Uncovering CO2 Emissions Patterns from China-Oriented International Maritime Transport: Decomposition and Decoupling Analysis

Transportation Engineering College, Dalian Maritime University, Dalian 116026, China
*
Author to whom correspondence should be addressed.
Sustainability 2019, 11(10), 2826; https://doi.org/10.3390/su11102826
Submission received: 22 February 2019
/
Revised: 17 April 2019
/
Accepted: 24 April 2019
/
Published: 17 May 2019
(This article belongs to the Special Issue Green Maritime Transport)
Abstract
:Given that most commodity transportation depends on the maritime industry, the growing economy and increasing international trade volume are expected to accelerate the development of shipping activities and thus increase associated CO2 emissions. In order to identify the driving factors of CO2 emissions from China’s international shipping and find efficient mitigation strategies, this paper first estimates the CO2 emissions and presents the CO2 emissions features from 2000 to 2017. Second, the Logarithmic Mean Divisia Index (LMDI) method is applied to decompose the changes in CO2 emissions. Finally, the decoupling index is introduced to quantitatively examine the decoupling relationship between economic growth and CO2 emissions. The factors affecting the decoupling relationship are analyzed according to the LMDI results. The results indicate that CO2 emissions in maritime transport activities have experienced rapid growth during the study period. Economic growth appears to be the principal factor driving the CO2 emissions growth, whereas the overall effects of energy intensity and the commodity structure play a significant role in inhibiting CO2 emissions. The decoupling state over the study period has experienced four decoupling stages, with a distinct tendency towards weak decoupling. Economic activity has proven to be the most significant indicator influencing the decoupling relationship during the study period.
1. Introduction
The international shipping sector is the backbone of global trade and facilitates transport among nations. Given that over 80% of the global trade volume is operated by shipping, the significance of maritime transportation cannot be overemphasized [1]. Although usually identified as an energy-efficient freight transportation mode, international shipping, in fact, relies on heavy fuel oil consumption, which increases contributions to both energy consumption and CO2 emissions [2]. From a global perspective, maritime transport contributes 3.1% of overall CO2 emissions due to fuel combustion, and approximately 84% of maritime transport CO2 emissions are generated by international shipping (trips between nations) [3]. It is predicted that CO2 emissions from international sea transportation will grow by up to 250% by 2050 if no action is taken [4]. The increasing fuel consumption and its associated carbon emissions have negative impacts not only on climate change but also on human health [5].
The international maritime transportation of China has experienced considerable growth, driven largely by the reform-and-opening policy of recent decades. Our calculations reveal that the seaborne volumes generated by China’s international trade expanded approximately six-fold from 0.73 billion tons to 5.15 billion tons between 2000 and 2017, and represented 44% of the total world seaborne trade in 2017. Consequently, the dramatic growth of international seaborne trading activities produces a large amount of CO2 emissions and has environmental impacts, both nationally and internationally. In 2016, as the largest emitter of CO2 emissions, China contributed 27.3% of the global aggregate emissions, which was a figure almost double that of the second emitter, the United States [6]. As a major developing country, China is willing to take its responsibilities seriously and to actively participate in international affairs, such as its approval of the Kyoto Protocol in 2002 and ratification of the Paris Agreement in 2016 [7]. Regarding the conventions of the agreements, China has a mandatory obligation to coordinate economic development and environmental protection. The shipping industry is securing its position as an important sector to identify mitigation measures by the International Maritime Organization (IMO) [8]. Considering the objectives of the Paris Agreement, the IMO adopted an initial approach in 2018 to reduce the CO2 emissions of global shipping by at least 50% by 2050 compared to 2008. This strategy outlines a specified target for 173 members, including China [9]. The ambitious target confirmed that it was not a question of whether climate change should be addressed and it was clear that every country will have to contribute.
Under such circumstances, it is desirable for the Chinese government to operate in line with IMO conventions by concentrating on international shipping. The policy instruments addressing CO2 emissions from China’s international seaborne trade are likely to be more compatible with the international shipping regulations. It is thus urgent for China to search for appropriate mitigation policies for the China-oriented international seaborne sector and respond positively to the decarbonization of global shipping. China-oriented international maritime transportation refers to international seaborne operations that have their origin or destination in China. Therefore, the following questions should be addressed. For instance, what is the link between China-oriented international trade and its associated CO2 emissions during the study period of 2000–2017? What are the key influencing factors contributing to the increase in CO2 emissions? What is the trend of the decoupling states during the different stages? All these research questions are fundamental prerequisites to exploring methods for CO2 emissions mitigation. Therefore, in this paper, we first measure the relationship between the CO2 emissions and seaborne trade activities based on the bottom-up model, which is considered the foundation for conducting further deep analysis. Then, we decompose the changes in CO2 emissions to explore the corresponding contributions of each influencing factor. Alongside this, we introduce the decoupling index to make the decoupling states explicit during different stages, and we also investigate the factors affecting the decoupling relationship based on the Logarithmic Mean Divisia Index (LMDI) results. Several policy implications are given, which the authorities of China can use to mitigate CO2 emissions in the maritime transport sector.
The contribution of this paper is three-fold. First, existing studies of CO2 emissions assessment in the maritime sector of China are mostly conducted from a general perspective, focusing on calculating aggregate CO2 emissions and ignoring the differentiation of vessel types. This paper takes the variations of energy efficiency for each ship type into consideration and classifies all the vessels by separating China’s international marine transport activities into seven types based on their carrying commodities. CO2 emissions are measured by each of the vessel types, which contributes to the reliability of the final result of aggregate CO2 emissions. The assessment model is flexible and accessible enough to measure the CO2 emissions from China-oriented international maritime activities regarding the variation of the commodity trade in further studies. Second, this paper is the first to apply an LMDI approach to the maritime transport sector. Apart from the two conventional indicators of economic activities and population, the decomposition index is expected to be more specialized due to the examination of the effect of the energy intensity of vessels, the commodity trade structure effect, and the maritime transportation intensity effect based on the reality of ocean shipping. This helps to more deeply analyze the changes in CO2 emissions in the maritime industry, facilitating the exploration of mitigation driving factors. Third, to the best of our knowledge, the current literature focuses more on the decoupling of general transport levels rather than the specified sub-mode. This study provides an insight for exploring the decoupling relationship between the maritime transport sector and economic development, which serves as a good supplement for the sub-mode of sea transport level decoupling research. Combined with the LMDI method, the decoupling analysis investigates not only the dynamic changes of the decoupling relationship between CO2 emissions in the maritime sector and economic growth but also the factors affecting the decoupling relationship. This allows the authorities to understand the decoupling states of the maritime industry and formulate measures to achieve low-carbon maritime transportation.
The findings of this study are likely to provide crucial instructions not only for the Chinese government but also for the IMO, to determine which strategies should be implemented and how to realize sustainable development in international ocean shipping. The paper proceeds as follows: Section 2 presents a brief review of existing studies; Section 3 introduces the adopted methodologies and data collection process; Section 4 discusses the empirical outcomes of the decomposition and the decoupling analysis of CO2 emissions; Section 5 presents concluding remarks and policy suggestions.
2. A Brief Literature Review
The rapid increase in CO2 emissions attracts public attention to environmental sustainability. The aim of sustainable development is to ensure that environmental damage does not grow with economic growth; this is defined as the decoupling state [10]. The definition of decoupling is initiated in physics rather than the environment, and refers to the elimination of the effect of mutual interference between signals. Decoupling theory was first adopted by Zhang [11] for exploring the relationship between economic activities and CO2 emissions. The Organization for Economic Co-operation and Development (OECD) was the first organization to propose the definition of decoupling as eliminating the linkage between environmental quality and economic activities [12]. However, the OECD model has several disadvantages, such as inaccurate measurement and unclear criteria [7]. To overcome these obstacles, an extended decoupling model was developed by Tapio that was used to describe the relationship between road transport CO2 emissions and economic development [13]. Decoupling analysis, which is considered to be a more specific concept that requires less calculation, has been used by a number of studies focusing on China to examine the relationships between economic growth, energy use, and emissions [14].
In addition, an increasing number of studies have started to focus on the decomposition of CO2 emissions changes to identify the driving factors. There are many decomposition techniques available to decompose the CO2 emissions changes into various driving factors. Among them, structural decomposition analysis (SDA) and index decomposition analysis (IDA) are two popular approaches that have been widely used [15]. SDA analysis depends on the input–output model and is more comprehensive to obtain more accurate results [16]. However, the high data collection requirements of SDA are considered to be an important disadvantage [17]. Compared with SDA, the demands for data of the IDA method are expected to be relatively lower. There are two branches of IDA: The Laspeyres index approach and the Divisia index approach [18]. The Divisia index method has been extended to LMDI decomposition, as proposed by [19]. The LMDI model overcomes the problems of residual terms in the decomposition and handles zero values in the data [20]. Regarding its significant advantages, LMDI has been identified as the most effective tool to study driving factors [19]. Many studies have adopted the LMDI method to study the decomposition of CO2 emission changes in different industries. Tian et al. [21] decomposed CO2 emissions from the Chinese iron and steel industry from two scopes and found that the population-scale effect was the main positive indicator, while energy intensity offset the total emissions increase. Yan and Fang [22] and Lin et al. [23] conducted LMDI decomposition to analyze CO2 emissions changes in the chemical industry and manufacturing industry, respectively. Xie et al. [24] conducted a decomposition analysis on reducing CO2 emissions in the petroleum refining and coking industry and argued that industry activity proved to be the main driving factor of the growth of CO2 emissions, whereas energy intensity had the greatest adverse effect. Ma and Cai [25] analyzed the changes in CO2 emissions in the Chinese commercial building sector by applying the LMDI method and found that only two driving forces contributed negatively to Chinese commercial buildings.
Academically, an increasing amount of research has been conducted to investigate carbon emissions issues in the transport sector. These studies have been primarily concerned with the general transportation level [26,27,28,29]. With regard to specific sub-modes, most of the studies that have looked at the transportation sector have concentrated on the road sector, since it is the most widely used door-to-door transportation mode [30,31,32]. Since CO2 emissions from the transport sector of China have witnessed rapid growth in recent years, the LMDI method has been applied to decompose CO2 emissions changes in the transport sector of China at national, regional, and provincial levels [33]. Meanwhile, some studies in the transport sector have adopted the Tapio model to discuss delinking economic growth from environmental problems [34].
Due to the deep decarbonization in the maritime industry, the topic of shipping decarbonizing has attracted considerable attention [2,35,36]. In particular, Wan et al. [4] proposed a policy analysis, which revisited the progress of technical, operational, and market-based routes and their associated controversies. Balcombe et al. [37] reviewed the potential of multiple pathways for shipping decarbonization, including energy efficiency technologies, alternative fuels, and policies. They suggested that a combination of pathways is required. As for specific research on CO2 emissions issues from water transportation, Walsh et al. [38] adopted a bottom-up approach to measure CO2 emissions associated with the UK international trade by sea transportation and conducted a detailed discussion based on the results. Additionally, Lee et al. [39] investigated the impacts of Asian economic integration on maritime CO2 emissions and identified the key driving factors of CO2 emissions. To the best of the author’s knowledge, there are only two previous studies in the literature that attempted to study CO2 emissions in the maritime sector of China. Hao et al. [40] calculated the quantity of CO2 emissions in China’s freight shipping between 2006 and 2012, including inland waterways and coastal and ocean freight shipping modes. Additionally, Yang et al. [41] estimated CO2 emissions in China’s international seaborne trade and projected future trends of the emissions under four scenarios.
In general, the existing studies in China’s water transportation were mainly concerned with the estimation and measurement of the quantity of CO2 emissions. To the best of our knowledge, research on the decomposition of the CO2 emissions changes in China-oriented international seaborne trade is absent. Under this circumstance, we employed an extended LMDI method to decompose the China-oriented CO2 emissions changes into six driving factors, including the CO2 emissions factor, energy intensity, commodity trade structure, maritime transportation intensity, and two other social indicators. Then, based on the decomposition model, we explored the decoupling relationship between the dynamic changes of CO2 emissions development and economic growth through a combination of the decoupling model and LMDI method. In brief, currently, there is little literature focusing on the decoupling states between China’s international maritime CO2 emissions and economic growth, using either the simple decoupling index or the comprehensive combination technique adopted in this paper.
3. Methodology and Data
3.1. Bottom-Up CO2 Emissions Estimation Approach
Two methodologies for the assessment of CO2 emissions are proposed by the Intergovernmental Panel on Climate Change (IPCC): A top-down approach and an activity-based bottom-up approach [42]. Specifically, the top-down approach is based on fuel consumption data acquired from fuel suppliers or monitoring systems. International navigation fuel sales data are available for 29 countries worldwide, excluding China [4]. Therefore, it is unrealistic to obtain actual data from fuel suppliers according to the situation in China. Moreover, this method also has considerable uncertainty (e.g., lack of activity data) in the measurement of shipping emissions due to reflecting impractical maritime traffic [43]. The bottom-up method was developed according to the practical operations of shipping. Compared with the top-down approach, this technique is more feasible for developing many variants, depending on the set of inputs and identified conditions [44]. Regarding international shipping, the variances of the energy intensities of vessels are significant and depend on the vessel types [45]. The activity-based approach is expected to calculate CO2 emissions by estimating each of the involved vessel types.
Under such circumstances, it was preferable to develop a bottom-up model to define the relationship between the seaborne trade and CO2 emissions in this study. Based on the turnover volumes of the seaborne trade, the CO2 emissions are accounted for by vessel types, as in Equation (1). Such a linking method is widely adopted in the measurement of CO2 emissions in the transport industry [26,39,40].
where refers to the CO2 emissions in the China-oriented international maritime activities in year t; represents the energy consumption of vessels of type i in year t, including crude oil tankers, products tankers, chemical tankers, liquid gas tankers, dry carriers, containerships, and reefers; refers to the freight turnover volume of vessels of type i in year t; represents the energy consumption per amount of transport turnover of vessels of type i in year t; means the freight trade volume by vessels of type i in year t; denotes the average distance travelled by vessels of type i in year t; and represents the CO2 emissions factor of fuel in year t. In practice, ocean freight fleets always depend on residual fuel oil (HFO) [43]. Thus, the ocean-going fleets involved in this paper are all expected to use HFO. Indeed, the trade imbalance problem exists in international seaborne trade, which is associated with the trade flow. A vessel will not use all of its available capacity and will travel a proportion of the round trip while empty [38]. In this paper, the values of the energy consumption per amount of transport turnover of vessels are obtained by considering the capacity use of the vessels. Thus, the quantity of CO2 emissions is estimated based on the trade turnover volume and presented in an aggregate value of round trips, including head haul and back haul.
It is likely that the fundamental problem of CO2 emissions issues is finding a method for shipping to decarbonize. As can be seen from Equation (1), the quantity of CO2 emissions is mainly dependent on improvement of the energy efficiency for the vessels and the adoption of alternative fuels. That is to say, the emissions from shipping are determined by the vessel efficiency and fuel type: Inefficient vessels consume more fuel and fuels varying in emissions are produced [37]. Moreover, the quantity of CO2 emissions is also determined by the average distance of different types of ships. It is likely that CO2 emissions from shipping are proportional to the average distance of vessels. The decrease in the average haul will contribute to the reduction of the CO2 emissions. Since the influences of these related pathways on the CO2 emissions reduction of China-oriented seaborne trade have been discussed in previous literature by Yang et al. [41], this paper conducts further research on the driving factors of CO2 emissions changes and decoupling states, building on the foundation of that research.
3.2. CO2 Emission Changing Decomposition Approach
In this study, the LMDI model is adopted to identify potential influencing factors of the CO2 emission changes from China-oriented international maritime transport activities. In order to identify the appropriate factors in this paper, the choice of factors in previous literature on the transportation industry was investigated. Three driving factors, including the CO2 emissions factor effect, economic activity effect, and population effect, are the common influencing factors selected by researchers [27,46,47]. According to the features of the research focus, other considerations were taken into account in various studies. Apart from the three common factors aformentioned, Guo et al. [27] added the energy intensity effect and energy structure effect; Wang et al. [46] considered the transportation service structure effect and transportation intensity effect; Yu et al. [47] selected the energy intensity effect, transportation service structure, and transportation intensity effect. Based on the existing literature, the impacts of six explanatory factors are quantified in this paper, including the CO2 emissions factor, energy intensity, commodity structure, maritime transportation intensity, economic growth, and population size. It should be noted that the commodity structure is defined based on the transportation service structure and the maritime transportation intensity is defined based on the transportation intensity. The LMDI analysis of the CO2 emission changes from China’s international seaborne trade activities is expressed as follows:
where represents the fuel consumption of vessels of type i; refers to the transport turnover volume of vessels of type i; GDP represents the gross domestic product (GDP) of China; and P refers to the population size of China. Equation (2) can be further expressed as:
where CF denotes the CO2 emissions factor of HFO; EI refers to the energy intensity effect of a certain vessel type, which describes the energy efficiency of the ships; TS refers to the percentage of the turnover volume share of the commodities carried by a specified vessel type of the total maritime transport turnover volume, which indicates the effect of commodity trade structure; TI denotes the maritime transportation intensity; ED represents the per capita GDP, which describes the economic development factor; and P is the population-scale factor.
Because the observed period of this paper is not very long, we assumed that the CO2 emissions factor of HFO remained steady across the entire period. The LMDI method includes two methodologies: Multiplicative decomposition and additive decomposition, and both forms are expected to obtain identical results [32]. Accordingly, an additive form was chosen for this study. Therefore, the decomposition analysis of the CO2 emission changes from in the base year 0 to in year t can be described as the following:
where refers to the CO2 emissions changes from the baseline year to year t, and , , , , and denote the contributions of energy intensity, commodity trade structure, maritime transportation intensity, economic growth, and population size to the CO2 emission changes, respectively.
3.3. Tapio Decoupling Evaluation Model
The Tapio decoupling index is defined as the ratio of percentage change between CO2 emissions and economic growth, which is represented as follows:
where is the elasticity of the decoupling indicator from the base year to year t, and and denote the percentage changes of the CO2 emissions in China-oriented international maritime transport and the economic growth of China from the base year to year t, respectively. Decoupling states are classified into three categories and then further divided into eight logical possibilities [13], as seen in Figure 1. To avoid overinterpreting slight changes as significant, an improvement is specified so that a ±20% variation of elasticity values near 1.0 is still considered as coupling. Therefore, 0.8 and 1.2 can be considered as the two significant boundaries for decoupling states.
According to Equations (4) and (10), the extended decoupling model based on the combination of the decomposition technique and the basic decoupling model can be obtained:
where , , , , and refer to the five sub-decoupling indicators () of ; represents the energy intensity sub-indicator; represents the commodity trade structure sub-indicator; implies the maritime transportation intensity sub-indicator; refers to the economic activity level sub-indicator; and indicates the population-scale sub-indicator.
When > 0, the value of the sub-indicator is smaller, and the degree of the decoupling effect is stronger. Thus, < 0 implies that the sub-indicator promotes decoupling, while > 0 represents a negative role in decoupling. On the contrary, if < 0, the value of the sub-indicator is higher, and the degree of the decoupling effect is stronger. Accordingly, > 0 represents a positive effect, while < 0 represents a negative effect on the decoupling relationship [7].
3.4. Data Sources
The definition of international maritime transport in this paper is in accordance with the definition from [4,48], namely referring to the shipping operations between countries regardless of vessel flag, excluding military and fishing vessels. This paper emphasizes the CO2 emissions of China-oriented international trade activities conducted by vessels not limited to Chinese shipping companies but refers to the import and export maritime transport activities of China by fleets, regardless of ownership or flag state. This study covers the period from 2000 to 2017. The transport volume data of China’s international seaborne transport can be obtained from the Clarkson Research [49,50,51,52,53]. According to the statistical data, the vessels operating as part of China’s international commodity trade are subdivided into nine categories: crude oil carriers, oil product carriers, chemical tankers, other liquid tankers, liquid gas tankers, dry bulk carriers, containerships, non-containers, and reefer cargos. After a preliminary calculation, the combination volumes of non-containers and other liquid tankers together accounted for less than 1.5% of the total volume over the study period. Regarding the small contribution of these two vessel types, there are seven categories of vessels involved in this paper, exclusive of these two categories. The different cargoes carried by vessels and the main trade flow (export or import) are provided in Table 1. Due to the unavailability of the shipping distances, we consider the world seaborne trade average shipping distances as our measurement.
In addition, the population scale and GDP of China were obtained from the China Statistical Yearbook. GDP was converted to year 2000 prices to eliminate inflation effects. The energy consumption per unit turnover volume of each particular vessel type was obtained from [3,39,40]. Note that the CO2 emissions factor is considered to be constant during the study period, referring to the data given by [4].
4. Results and Discussions
4.1. Trajectory of CO2 Emissions
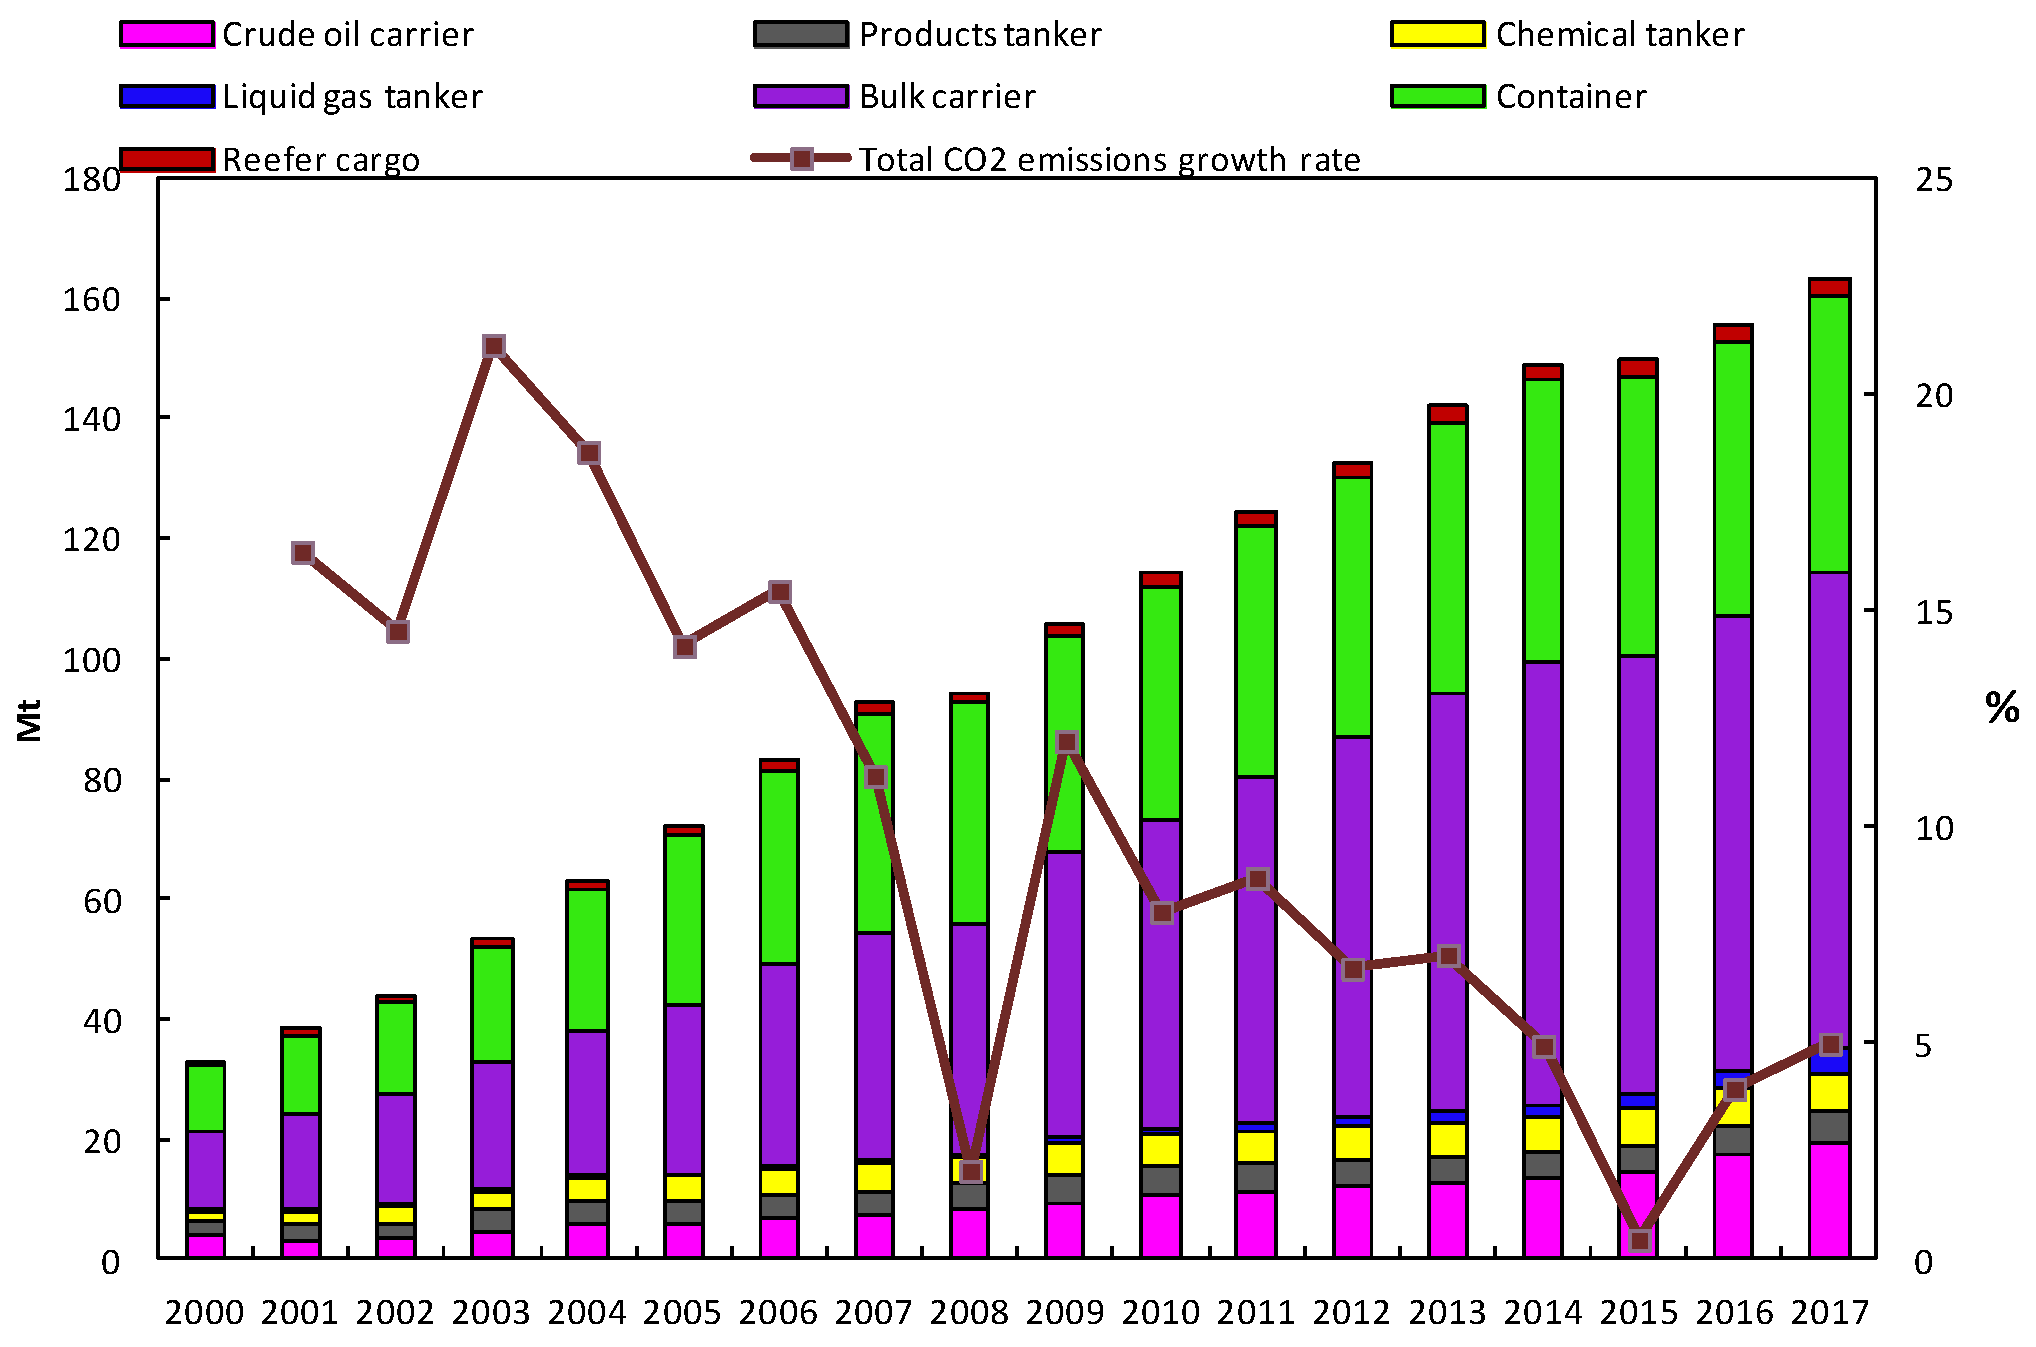
The CO2 emissions can be estimated based on the seaborne trade demand, as described in Equation (1). In fact, the relationship between China’s GDP growth and its seaborne trade should be focused on, which is the prerequisite for the following research. The previous work on international seaborne trade has emphasized the issue. As a typical case, Yang et al. (2017) developed a log-linear regression model and suggested that variations in trade demand have been largely driven by the development stages of China’s economy. It is likely that China is developing in a similar manner to other Asian countries [41,54]. According to Equation (1), the CO2 emissions in China’s international maritime transportation activities can be assessed by seven classified vessel types: crude oil carriers, oil product carriers, chemical tankers, liquid gas tankers, dry bulk carriers, containerships, and reefer cargos. As can be seen from Table 1, the main trade flows of most commodities are imports. The types of cargoes that a country imports and exports depend on its industrial trajectory. Regarding China, as a developing country that is undergoing an industrialization process, China is likely to import more raw material from foreign countries and then export industrial products [55]. However, due to the great disparity existing in the categories and the sizes of the vessels and the difficulty of defining the importing/exporting country or even importing/exporting ports in the seaborne trade, the CO2 emissions of international trade are presented as an aggregate value, which reflects the quantity from the general perspective in this paper. Therefore, the aggregate CO2 emissions are the accumulative CO2 emissions from various vessel categories based on trade volume, as can be seen in Figure 2. Generally, the aggregate CO2 emissions increased rapidly from 32.93 million tons (Mt) in 2000 to 163.40 Mt in 2017, following an annual growth rate of 9.9%.
Figure 2 describes the features of CO2 emissions from China’s international maritime trade-related activities. The curve of the growth trend can be divided into four phases: 2000–2007, 2007–2009, 2009–2015, and 2015–2017. In the first phase, the aggregate CO2 emissions experienced robust expansion, with a high annual growth rate of over 10%. This may be attributed to economic globalization at the beginning of the 2000s. During that period, the trade liberalization associated with China caused demand growth for China’s international maritime transportation. In the second period, the growth of CO2 emissions showed a sustained fluctuation year-over-year. We notice that between 2007 and 2008, the CO2 emissions from China’s international seaborne trade barely changed. This may have been due to the global financial crisis, which likely had an adverse impact on sea transportation. In the third phase, the maritime transport activities were likely to gradually recover from the shadow of the financial crisis, and both the international and domestic Chinese authorities paid attention to strengthening the construction of environmental restraints. Consequently, the growth rate of CO2 emissions appeared to be relatively slower compared to the first phase, with a growth rate of less than 10%. During the last phase, from 2015, the CO2 emissions increment rebounded to some extent, which may have been stimulated by China’s new “belt and road” initiative.
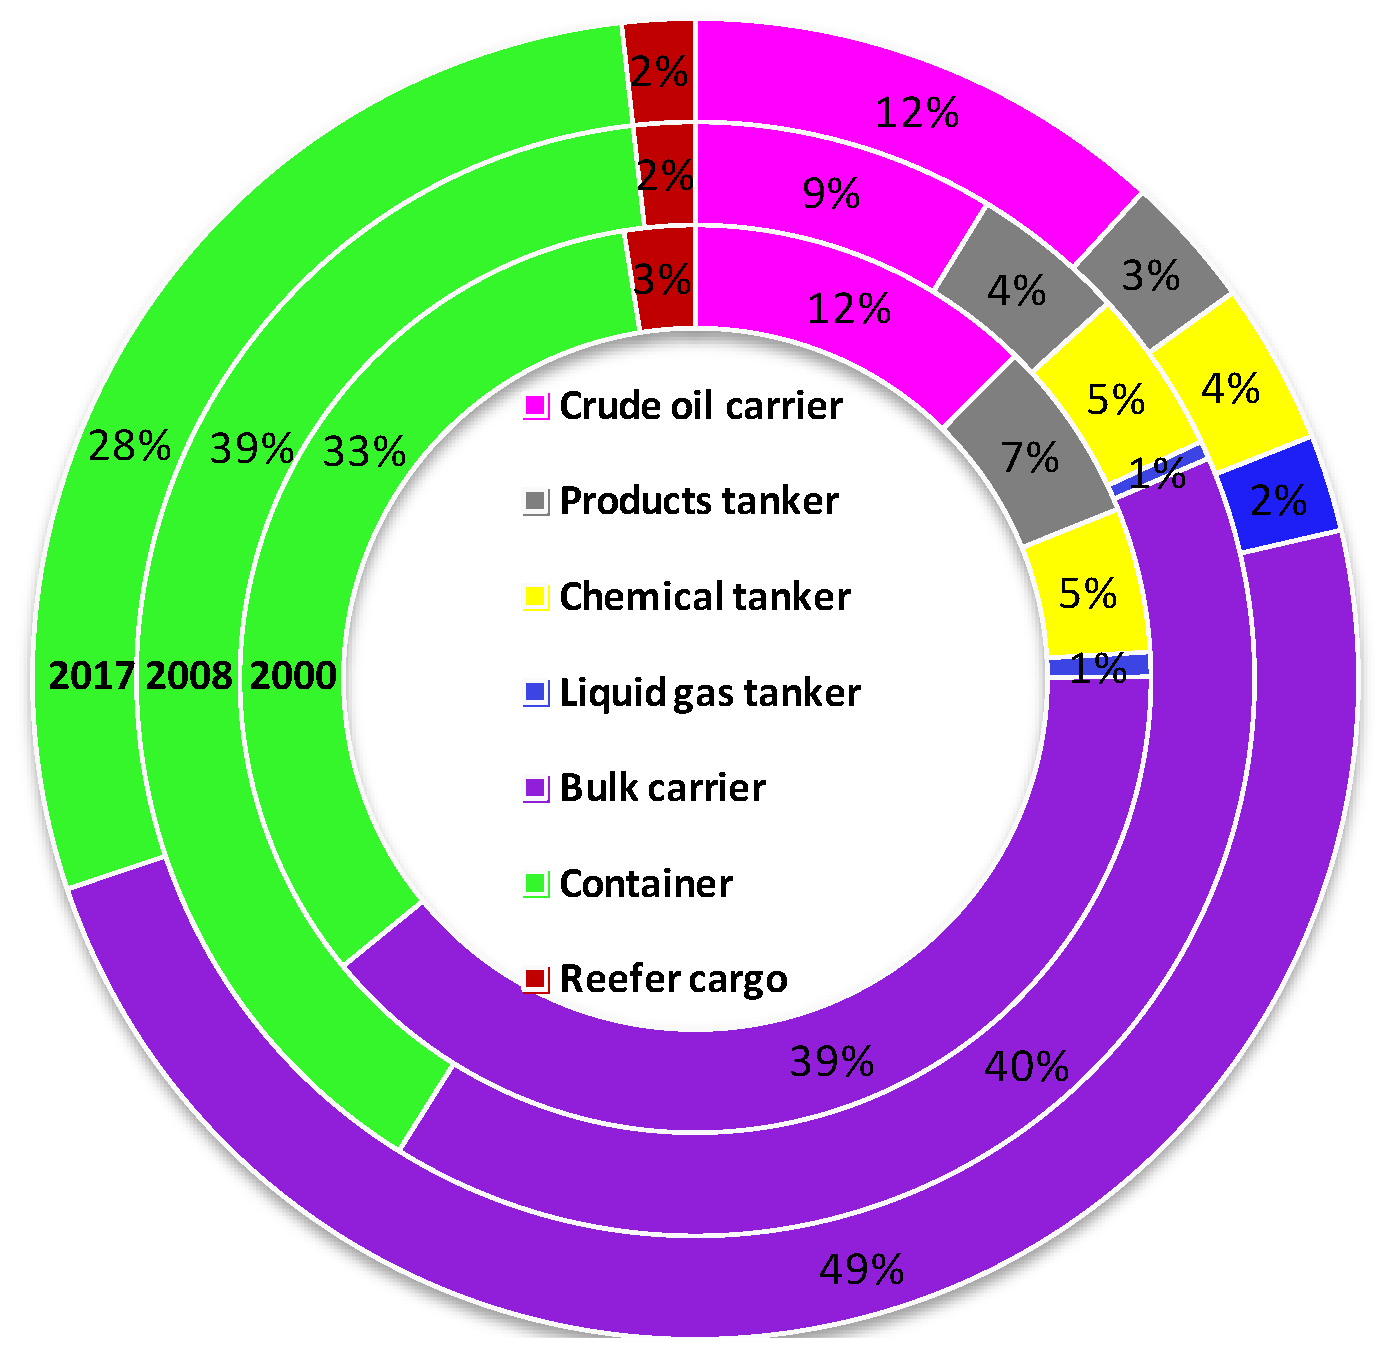
Figure 3 shows the proportions of CO2 emissions from various types of vessel for the years 2000, 2008, and 2017. In 2000, it is likely that bulk carriers and containerships produced approximately similar quantities of CO2 emissions, with a share of approximately 35% of the total CO2 emissions, whereas liquid gas tankers accounted for the smallest proportion at only 1%. During the entire study period, the CO2 emissions of all shipping modes showed an upward trend; nonetheless, the rates of increase were diverse. In 2017, bulk carriers proved to be the largest emitter, with approximately half of the overall emissions and nearly double that of containerships. The considerable expanded demand for bulk carriers may be due to the speeding up of urban construction in China in recent years. Note that the CO2 emissions of liquid gas tankers expanded thirteen-fold between 2000 and 2017, with a value of approximately 2.4% in 2017. Some implemented environmental regulations, such as “coal to gas switching”, are likely to have been responsible for the accelerated demand for liquid gas tankers. With the strong expansion and gas shortages in some cities, the Chinese demand for liquid natural gas is expected to continue to grow firmly with regard to the insufficient domestic natural gas output. In general, due to the robust expansion of the emissions emitted by bulk carriers and liquid gas tankers, the proportions of CO2 emissions from products tankers, chemical tankers, containers, and reefer cargos declined during the study period.
4.2. Decomposition Analysis of the CO2 Emissions
The influencing factors of the CO2 emissions changes in China-oriented international maritime transportation were uncovered by adopting LMDI decomposition. According to our calculation result, the decomposition results of the aggregate CO2 emission changes are shown in Figure 4. The result indicates that the effects of each influencing factor on the changes in CO2 emissions are diverse. Generally, economic growth, population size, and maritime transportation intensity contributed to the incremental growth in CO2 emissions, whereas the energy intensity and commodity structure proved to be inhibiting factors during the observed period. The effects of the influencing factors are sequentially discussed in the following sections.
First, GDP per capita is the most important contributor to the increase of CO2 emissions, which confirms the results of an array of studies on CO2 emission changes in the transportation industry [46,56]. The growth of economic output contributed to an increase of 135.22 Mt of CO2 emissions, which was responsible for 103.6% of the total CO2 emissions changes. Our calculations show that over the past 18 years, the economy of China has experienced sustained take-off that has resulted in the GDP per capita increasing from 7900 Yuan to 32,700 Yuan, which is equivalent to an increase of 310.6%. With regard to the contribution of economic growth, Figure 5 shows that during the period 2000–2017, the GDP per capita variation measurement had approximately the same trend as the system CO2 emissions variation trend in most years. This may be attributed to the urbanization and industrialization of China in recent years. On the other hand, with the enhancement of people’s living standards, there was a considerable increase in the demands of China’s import–export trade during these years.
After officially entering the stage of “new normal” [57], China’s economy will maintain medium- or even high-speed growth over the next five years, with an annual average growth rate of above 6.5% [58]. Therefore, it is likely that economic output growth will remain a significant contributor to promoting the increase in China’s international seaborne trade CO2 emissions in the long-term future. Moreover, the new “belt and road” initiative proposed by the Chinese government in 2016 will indeed stimulate the development of China-oriented international maritime transportation. This initiative aims to strengthen the construction of the “Ocean-Going Maritime Silk Road” to boost the international maritime trade associated with China. Therefore, under the business-as-usual (BAU) scenario without new policy involved, CO2 emissions in the maritime industry will continue their growth trend over the next long period.
Second, our results show that the population-scale factor always has a positive impact on CO2 emissions changes in China’s international maritime transportation sector. Unlike the promoting factor of economy, the accumulated effect of the population scale is limited, representing 7.6% of the total variation in CO2 emissions. The population size of China increased from 1.25 billion in 2000 to 1.39 billion in 2017, representing an increase of more than 100 million people. Nonetheless, due to the enormous population base, the growth of China’s population failed to promote the increase of CO2 emissions as much as the other contributors. According to national population planning, the population scale is projected to continue to increase during the “13th Five-Year Plan” and the “14th Five-Year Plan” until 2030. Therefore, the population-scale factor is expected to be the positive driving force of China-oriented international maritime transport CO2 emissions over the next few years.
Third, the maritime transportation intensity effect appeared to increase CO2 emissions over the study period. The maritime transportation intensity effect is measured as the maritime transportation turnover volume per unit of GDP. The factor of maritime transportation intensity in this paper is defined according to the transportation intensity, which conveys the connection between the development of transport demand and the economy [29]. The accumulated effect is an increase of 11.69 Mt, occupying 9% of the total CO2 emissions changes. As seen in Figure 4, the effect of maritime transportation intensity showed a fluctuating trend. Specifically, the maritime transportation intensity stimulated the variation in the CO2 emissions in most years but not all. During the observed period, the accumulated effect of maritime transportation intensity has restrained CO2 emissions from China-oriented international marine transport activities. Theoretically, the inhibition of CO2 emission increments comes from the decline of maritime transportation intensity. We notice that the maritime transportation intensity always curbed the increase of CO2 emissions from 2013 onward. This trend indicates that there is a potential for this effect to decrease the related emissions in the future. In general, the inhibiting impact of the maritime transportation intensity fails to overcome the positive impact and the maritime transportation intensity appears to be a positive cumulative contributor.
Fourth, commodity structure is regarded as an important inhibiting effect, with a cumulative reduction of approximately 13.35 Mt CO2 emissions, occupying 10.2% of the total CO2 emissions changes. Specifically, the influences of the commodity structure factor varied significantly annually, with a consistent fluctuation during the study period. The effects of commodity structure changes on CO2 emissions are explored in depth, as shown in Table 2.
The commodity structure effect represents the changes in the proportion of the defined trade commodity turnover volume with respect to the total turnover volume. Among all categories of shipping modes, the turnover volume changes of bulk carriers, liquid gas carriers, and crude oil tankers proved to contribute to the promotion of CO2 emissions, whereas the other sub-sectors inhibited emissions. Despite having the highest energy efficiency, the commodity turnover volume proportion of bulk carriers has experienced considerable increases, from 63% in 2000 to 70.6% in 2017, which promoted the corresponding CO2 emissions. For the primary inhibiting sub-sector, the variations of the turnover volume of containerships reduced the cumulative CO2 emissions by 14.77 Mt. This can be attributed to the relatively high energy consumption per unit of the turnover volume in containerships. Compared to the remarkable influences caused by bulk carriers and containerships, the other five categories are expected to have been more moderate during the study period considered. Generally, the CO2 emissions reductions caused by the decline in the turnover volume proportions of containerships, crude oil tankers, chemical tankers, and reefers were able to overcome the CO2 emission increments of the other three sub-sectors. Therefore, the commodity structure effect curbs the increase in CO2 emissions.
Fifth, energy intensity is a major inhibiting factor for China’s international maritime CO2 emissions. Between 2000 and 2017, the declining energy intensity contributed to 13.01 Mt of accumulated CO2 emissions reduction, with a cumulative effect of −10%. Figure 6 compares the value of the energy intensities for all seven shipping modes between 2000 and 2017 [39,40].
As seen in Figure 6, dramatic variations exist among the energy intensities of the seven vessel types. The energy intensities of the containerships and products tankers are relatively high and are more than three times and twice that of bulk carriers and crude oil carriers, respectively. In comparison, the energy intensities of the reefer cargos, chemical tankers, and liquid gas tankers are expected to be lower, within the range of 3 g/t*km and 4 g/t*km during the observed period. Figure 5 reveals that the energy intensities of all the considered shipping modes experienced a moderate decline from 2000 to 2017. In fact, energy intensity refers to the overall energy efficiency of the vessel type. Therefore, the reduction in energy intensity contributes to the mitigation of CO2 emissions since the improvement in the energy efficiency of vessels facilitates the suppression of CO2 emissions. The quantitative analysis result indicates that the decrease in energy intensity and the improvement of energy efficiency are the key outlets to mitigate the CO2 emissions of China’s international maritime transport sector.
4.3. Decoupling Analysis of CO2 Emissions and Economic Growth
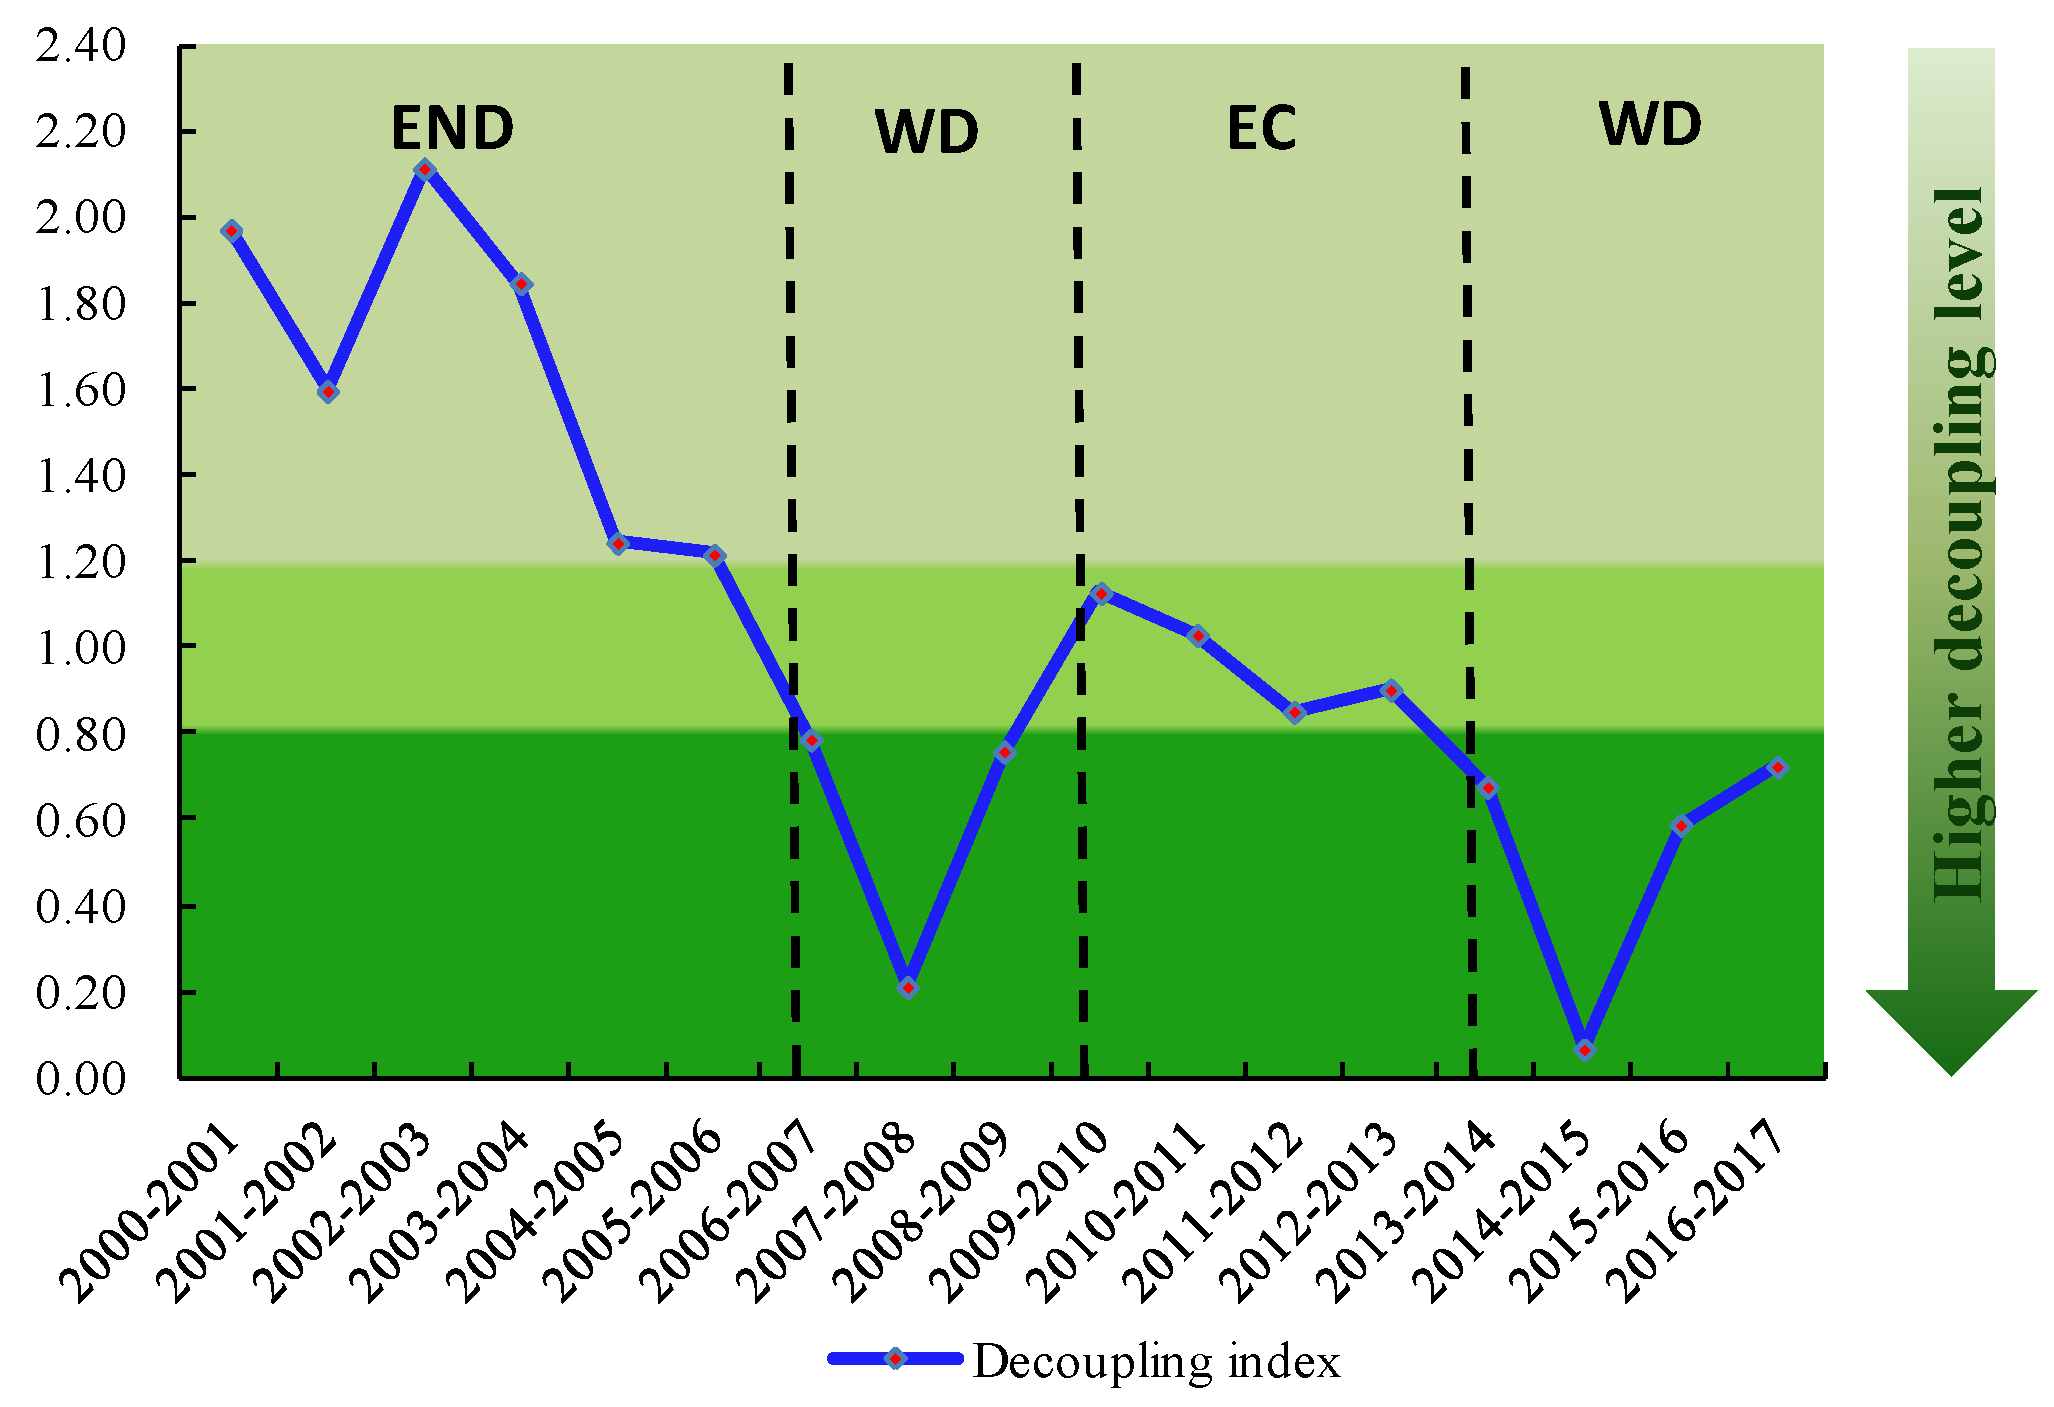
Table 3 shows that the decoupling status underwent three states during 2000–2017: Expansive negative decoupling, expansive coupling, and weak decoupling. Specifically, the decoupling index first increased from 1.972 to 2.115, and then gradually decreased to 0.724 in 2017. As can be seen in Figure 7, the periodic characteristics can be divided into four stages: The expansive negative decoupling stage (END) of 2000–2006, the weak decoupling stage (WD) of 2006–2009, the expansive coupling stage (EC) of 2009–2013, and the weak decoupling stage (WD) of 2013–2017. The decoupling analysis indicates that the relationships between CO2 emissions growth and economic growth were dynamic and periodic during the observed period.
During the first stage (2000–2006), the decoupling index ranges were all greater than 1.2, which implied that the CO2 emissions growth rate was higher than that of economic growth. This is mainly because the process of trade globalization underwent rapid development after China’s accession to the WTO in 2001. Under such circumstances, the demands of the bilateral trade associated with China considerably expanded and thus, China’s international seaborne trade activities increased at a staggering rate during that period. The authorities emphasized the booming economy, rather than being concerned with transport environmental issues. Under such circumstances, the annual growth rate of maritime transportation CO2 emissions (17%) surpassed that of the GDP (annual growth rate 10.3%), and thus, expansive negative decoupling occurred.
During the second stage (2006–2009), the decoupling index ranges were all lower than 0.8, which decreased significantly from the first stage. According to Clarkson Research data, the growth in the international seaborne trade of China slowed to less than half the growth rate recorded in the first stage [51]. China’s imports also grew at a slower pace than that of previous years. As demand for maritime transport services derives from the need to carry international trade, China’s seaborne trade could not be sheltered from the contraction in the financial crisis and merchandise trade during that period [59]. The depression of the shipping industry caused the slow growth of CO2 emissions during that period. Regarding the economic situation, the GDP of China was continuously maintained and experienced high-speed growth (an annualized rate over 10%). As a result, the weak decoupling state appeared during the second stage.
During the third stage (2009–2013), the demand for China’s international seaborne trade global economy rebounded and recovered from the reduced merchandise trade [60]. The recovery of China’s international maritime trade was robust and resulted in a rapid increase in CO2 emissions (an annualized rate of 8.9%). Specifically, the demand for liquid gas carriers (LNG) and dry cargo trades (coal and iron ore) increased rapidly over this period [61]. Consequently, the increase in the rate of CO2 emissions was approximately equal to the economic growth (an annualized rate of 8.9%). As a result, an expansive coupling state appeared between economic growth and CO2 emissions.
During the fourth stage (2013–2017), the decoupling index presented a downward tendency compared with the third stage. After the high-speed growth of the national economy, the economic growth of China was expected to be moderate, with an annual rate of 6.9%. Meanwhile, a series of policies were implemented by authorities that induced a decline in the growth rate of CO2 emissions. The import demand for iron weakened due to the depression of the Chinese steel industry. To encourage the development of the domestic coal supply, coal import duties were introduced that were likely to reduce coal imports [62]. Moreover, the improvement of energy efficiency was also likely responsible for the transitions of state. Therefore, the growth rate of CO2 emissions (annual average of 4%) appeared much lower than that of GDP, and weak decoupling thus occurred. Even if the decoupling elasticity exhibited weak decoupling at the end of the study period, there is still a long way to go to delink the connection between CO2 emissions and economic activities.
The decoupling index was then decomposed into five factors based on the results of the LMDI. The behaviors of sub-decoupling indicators during the four sub-periods are described in Figure 8.
As can be seen from Figure 8, the effect of energy intensity () was greater than zero in most years, which indicates its positive effect on the decoupling relationship between maritime CO2 emissions and economic activity. The value of the energy intensity decoupling effect () showed an increasing trend during the four stages, suggesting that the energy intensity indicator positively accelerated decoupling. Similar to energy intensity, the value of the commodity structure decoupling effect () was almost lower than zero and appeared to promote the decoupling relationship, except in the period 2000–2006. It is likely that the variation of the commodity structure contributed to the decoupling in most stages. In a particular stage, the effect of commodity structure on the decoupling relationship was even greater than that of the energy intensity during the period 2006–2009. The impact of the maritime transportation intensity indicator () was sometimes positive and sometimes negative, meaning that sometimes the maritime transportation intensity promoted decoupling and sometimes it inhibited decoupling. The economic growth effect () and the population-scale effect () on the decoupling progress were always negative over the study period. It should be noted that played an apparent inhibiting effect on the decoupling states, and appeared to be a weak inhibiting factor in terms of the decoupling states. Therefore, to break the delink between environmental issues of China’s international maritime transportation and the economic growth of China, this paper advocates for the technical development of vessels and optimization of commodity structure, in order to stimulate the generation of the decoupling relationship.
5. Conclusions
With the increasing international trade and economic growth of China, the demand for maritime transportation and its associated CO2 emissions will continue to grow. Consequently, it is important to find pathways to achieving a reduction in CO2 emissions of China-oriented international shipping, which is the purpose of this paper. This paper estimated the CO2 emissions associated with the China-oriented international seaborne trade and discussed the trajectory of the CO2 emissions. Then, the LMDI approach was introduced to decompose the main factors affecting changes in the aggregate CO2 emissions from maritime transportation activities. Finally, this paper employed a decoupling approach combined with the LMDI method to examine the decoupling relationship between CO2 emissions and economic growth, and major indicators influencing the decoupling relationship. Several conclusions can be made:
- (1)
- The aggregate CO2 emissions from the China-oriented international marine trade sector showed an escalating trend from 32.93 Mt to 163.4 Mt during the period 2000–2017, following average annual growth of 9.9%. Among the seven vessel types considered, bulk carriers proved to be the largest emitter of CO2 emissions in 2017, and liquid gas tankers reported the fastest growth rate, with a thirteen-fold expansion;
- (2)
- Economic growth proved to be an overwhelming contributor to the increase of CO2 emissions, which accounted for 103.6% of the aggregate emissions over the study period. Population scale and the maritime transportation intensity displayed relatively weaker effects compared with economic growth, with cumulative contributions of 7.6% and 9%, respectively;
- (3)
- Energy intensity and commodity structure played significant roles in inhibiting CO2 emissions. The contributions of both inhibitory effects were approximately equal, with cumulative contributions of approximately 10%, respectively. Generally, the mitigation effect caused by the combined inhibiting factors failed to overcome the increase in CO2 emissions produced by the promoting factors;
- (4)
- The decoupling effect between CO2 emissions in the maritime industry and the economic growth of China underwent three states (expansive negative decoupling, expansive coupling, and weak decoupling), with a shift from negative decoupling to weak decoupling over decades. The energy intensity indicator played a key role in promoting the decoupling relationships, whereas economic growth appeared to be the most negative indicator of the decoupling.
Practically, some factors, including economic activity, population scale, and commodity structure, are likely to be the objective factors that are difficult to alter for the present. If the authorities have access to high-quality economic development or optimize commodity structure, the CO2 emissions in maritime transportation are expected to be reduced. Moreover, regarding the subjective factor of energy intensity, the results revealed that improvement of the energy efficiency indeed facilitates CO2 emissions mitigation in the maritime sector. Therefore, it is suggested that the authorities support technological innovations such as the “design efficiency” of newly built vessels to improve the energy efficiency. Ultimately, there is no silver bullet solution to decarbonization [37]. The route to decarbonizing shipping requires a combination of various mitigation policies, which is a long-term process. It is suggested that policymakers regularly monitor the transition of emissions in the shipping industry and respond quickly with proper effective instruments.
Author Contributions
Resources, H.Y.; Supervision, H.Y.; Writing—original draft, X.M.; Writing—review & editing, H.Y. Data curation, X.M.; Formal analysis, X.M.; Funding acquisition, H.Y.; Methodology, X.M.
Funding
This study is supported by the National Nature Science Foundation of China [Grant 71372088].
Conflicts of Interest
The authors declare no conflict of interest.
References
- United Nations Conference on Trade and Development (UNCTAD). Review of Maritime Transport 2017; United Nations: Geneva, Switzerland, 2017. [Google Scholar]
- Bouman, E.A.; Lindstad, E.; Rialland, A.I.; Strømman, A.H. State-of-the-art technologies, measures, and potential for reducing GHG emissions from shipping—A review. Transp. Res. D Transp. Environ. 2017, 52, 408–421. [Google Scholar] [CrossRef]
- International Maritime Organization (IMO). Second IMO GHG Study 2009; IMO: London, UK, June 2009. [Google Scholar]
- International Maritime Organization (IMO). Third IMO GHG Study 2014; IMO: London, UK, June 2014. [Google Scholar]
- Achour, H.; Belloumi, M. Decomposing the influencing factors of energy consumption in Tunisian transportation sector using the LMDI method. Transp. Policy 2016, 52, 64–71. [Google Scholar] [CrossRef]
- Wu, Y.; Tam, V.W.Y.; Shuai, C.; Shen, L.; Zhang, Y.; Liao, S. Decoupling China’s economic growth from carbon emissions: Empirical studies from 30 Chinese provinces (2001–2015). Sci. Total Environ. 2019, 656, 576–588. [Google Scholar] [CrossRef] [PubMed]
- Zhao, X.; Zhang, X.; Li, N.; Shao, S.; Geng, Y. Decoupling economic growth from carbon dioxide emissions in China: A sectoral factor decomposition analysis. J. Clean. Prod. 2017, 142, 3500–3516. [Google Scholar] [CrossRef]
- Gilbert, P.; Bows, A. Exploring the scope for complementary sub-global policy to mitigate CO2 from shipping. Energy Policy 2012, 50, 613–622. [Google Scholar] [CrossRef]
- UN Climate Change News. Available online: https://unfccc.int/news/world-nations-agree-to-at-least-halve-shipping-emissions-by-2050 (accessed on 10 December 2018).
- Chen, B.; Yang, Q.; Li, J.S.; Chen, G.Q. Decoupling analysis on energy consumption, embodied GHG emissions and economic growth—The case study of Macao. Renew. Sustain. Energy Rev. 2017, 67, 662–672. [Google Scholar] [CrossRef]
- Zhang, Z. Decoupling China’s Carbon Emissions Increase from Economic Growth: An Economic Analysis and Policy Implications. World Dev. 2000, 28, 739–752. [Google Scholar] [CrossRef]
- Organisation for Economic Co-Operation and Development (OECD). Decoupling: A Conceptual Overview. OECD Pap. 2001, 5, 1–31. [Google Scholar]
- Tapio, P. Towards a theory of decoupling: Degrees of decoupling in the EU and the case of road traffic in Finland between 1970 and 2001. Transp. Policy 2005, 12, 137–151. [Google Scholar] [CrossRef]
- Ma, M.; Cai, W. Do commercial building sector-derived carbon emissions decouple from the economic growth in tertiary industry? a case study of four municipalities in china. Sci. Total Environ. 2019, 650, 822–834. [Google Scholar] [CrossRef]
- Xu, S.; He, Z.; Long, R.; Chen, H.; Zhang, W. Comparative analysis of the regional contributions to carbon emissions in China. J. Clean. Prod. 2016, 127, 406–417. [Google Scholar] [CrossRef]
- Boqiang, L.; Liu, K. Using LMDI to Analyze the Decoupling of Carbon Dioxide Emissions from China’s Heavy Industry. Sustainability 2017, 9, 1198. [Google Scholar] [CrossRef]
- Wang, Q.; Hang, Y.; Zhou, P.; Wang, Y. Decoupling and attribution analysis of industrial carbon emissions in Taiwan. Energy 2016, 113, 728–738. [Google Scholar] [CrossRef]
- Wang, W.; Li, M.; Zhang, M. Study on the changes of the decoupling indicator between energy-related CO2 emission and GDP in China. Energy 2017, 128, 11–18. [Google Scholar] [CrossRef]
- Ang, B.W.; Liu, F.L.; Chew, E.P. Perfect decomposition techniques in energy and environmental analysis. Energy Policy 2003, 31, 1561–1566. [Google Scholar] [CrossRef]
- Ma, X.; Wang, C.; Dong, B.; Gu, G.; Chen, R.; Li, Y.; Zou, H.; Zhang, W.; Li, Q. Carbon emissions from energy consumption in China: Its measurement and driving factors. Sci. Total Environ. 2019, 648, 1411–1420. [Google Scholar] [CrossRef]
- Tian, Y.; Zhu, Q.; Geng, Y. An analysis of energy-related greenhouse gas emissions in the Chinese iron and steel industry. Energy Policy 2013, 56, 352–361. [Google Scholar] [CrossRef]
- Yan, X.; Fang, Y. CO2 emissions and mitigation potential of the Chinese manufacturing industry. J. Clean. Prod. 2015, 103, 759–773. [Google Scholar] [CrossRef]
- Lin, B.; Long, H. Emissions reduction in China’s chemical industry—Based on LMDI. Renew. Sustain. Energy Rev. 2016, 53, 1348–1355. [Google Scholar] [CrossRef]
- Xie, X.; Shao, S.; Lin, B. Exploring the driving forces and mitigation pathways of CO2 emissions in China’s petroleum refining and coking industry: 1995–2031. Appl. Energy 2016, 184, 1004–1015. [Google Scholar] [CrossRef]
- Ma, M.; Cai, W. What drives the carbon mitigation in Chinese commercial building sector? evidence from decomposing an extended Kaya identity. Sci. Total Environ. 2018, 634, 884–899. [Google Scholar] [CrossRef] [PubMed]
- Cai, B.; Yang, W.; Cao, D.; Liu, L.; Zhou, Y.; Zhang, Z. Estimates of China’s national and regional transport sector CO2 emissions in 2007. Energy Policy 2012, 41, 474–483. [Google Scholar] [CrossRef]
- Guo, B.; Geng, Y.; Franke, B.; Hao, H.; Liu, Y.; Chiu, A. Uncovering China’s transport CO2 emission patterns at the regional level. Energy Policy 2014, 74, 134–146. [Google Scholar] [CrossRef]
- Ratanavaraha, V.; Jomnonkwao, S. Trends in Thailand CO2 emissions in the transportation sector and Policy Mitigation. Transp. Policy 2015, 41, 136–146. [Google Scholar] [CrossRef]
- Fan, F.; Lei, Y. Decomposition analysis of energy-related carbon emissions from the transportation sector in Beijing. Transp. Res. D Transp. Environ. 2016, 42, 135–145. [Google Scholar] [CrossRef] [Green Version]
- M’Raihi, R.; Mraihi, T.; Harizi, R.; Taoufik Bouzidi, M. Carbon emissions growth and road freight: Analysis of the influencing factors in Tunisia. Transp. Policy 2005, 42, 121–129. [Google Scholar] [CrossRef]
- Gambhir, A.; Tse, L.K.C.; Tong, D.; Martinez-Botas, R. Reducing China’s road transport sector CO2 emissions to 2050: Technologies, costs and decomposition analysis. Appl. Energy 2015, 157, 905–917. [Google Scholar] [CrossRef]
- Dennehy, E.R.; Ó Gallachóir, B.P. Ex-post decomposition analysis of passenger car energy demand and associated CO2 emissions. Transp. Res. D Transp. Environ. 2018, 59, 400–416. [Google Scholar] [CrossRef]
- Zhu, X.; Li, R. An Analysis of Decoupling and Influencing Factors of Carbon Emissions from the Transportation Sector in the Beijing-Tianjin-Hebei Area, China. Sustainability 2017, 9, 722. [Google Scholar] [CrossRef]
- Wang, Y.; Xie, T.; Yang, S. Carbon emission and its decoupling research of transportation in Jiangsu Province. J. Clean. Prod. 2017, 142, 907–914. [Google Scholar] [CrossRef]
- Halim, R.A.; Kirstein, L.; Merk, O.; Martinez, L.M. Decarbonization Pathways for International Maritime Transport: A Model-Based Policy Impact Assessment. Sustainability 2018, 10, 2243. [Google Scholar] [CrossRef]
- Bows-Larkin, A.; Anderson, K.; Mander, S.; Traut, M.; Walsh, C. Shipping charts a high carbon course. Nat. Clim. Chang. 2015, 5, 293. [Google Scholar] [CrossRef]
- Balcombe, P.; Brierley, J.; Lewis, C.; Skatvedt, L.; Speirs, J.; Hawkes, A.; Staffell, I. How to decarbonise international shipping: Options for fuels, technologies and policies. Energ. Convers. Manag. 2019, 182, 72–88. [Google Scholar] [CrossRef]
- Walsh, C.; Bows, A.; Gilbert, P.; Mander, S.; Trant, M. A new method for estimating national-scale CO2 from shipping: Preliminary results from a UK study. In Proceedings of the Low Carbon Shipping Conference, London, UK, 28–29 February 2012. [Google Scholar]
- Lee, T.; Lam, J.S.L.; Lee, P.T. Asian economic integration and maritime CO2 emissions. Transp. Res. D Transp. Environ. 2016, 43, 226–237. [Google Scholar] [CrossRef]
- Hao, H.; Geng, Y.; Ou, X. Estimating CO2 emissions from water transportation of freight in China. Int. J. Shipp. Transp. Logist. 2015, 7, 676–694. [Google Scholar] [CrossRef]
- Yang, H.; Ma, X.; Xing, Y. Trends in CO2 Emissions from China-Oriented International Marine Transportation Activities and Policy Implications. Energies 2017, 10, 980. [Google Scholar] [CrossRef]
- Intergovernmental Panel on Climate Change (IPCC). 2006 IPCC Guidelines for National Greenhouse Gas Inventories; Intergovernmental Panel on Climate Change: Hayama, Japan, 2006. [Google Scholar]
- Song, S.; Shon, Z. Current and future emission estimates of exhaust gases and particles from shipping at the largest port in Korea. Environ. Sci. Pollut. Res. Int. 2014, 21, 6612–6622. [Google Scholar] [CrossRef] [PubMed]
- Psaraftis, H.N.; Kontovas, C.A. CO2 emission statistics for the world commercial fleet. WMU J. Marit. Aff. 2009, 8, 1–25. [Google Scholar] [CrossRef]
- Walsh, C.; Bows, A. Size matters: Exploring the importance of vessel characteristics to inform estimates of shipping emissions. Appl. Energy 2012, 98, 128–137. [Google Scholar] [CrossRef]
- Wang, W.; Zhang, M.; Zhou, M. Using LMDI method to analyze transport sector CO2 emissions in China. Energy 2011, 36, 5909–5915. [Google Scholar] [CrossRef]
- Yu, J.; Da, Y.; Ouyang, B. Analysis of carbon emission changes in China’s transportation industry based on LMDI decomposition method. China J. Highw. Transp. 2015, 28, 112–119. [Google Scholar]
- Intergovernmental Panel on Climate Change (IPCC). Climate Change 2014 Synthesis Report; IPCC: Geneva, Switzerland, 2014. [Google Scholar]
- Clarksons Research. June 2006 China Intelligence Monthly; Clarksons Research: London, UK, 2006. [Google Scholar]
- Clarksons Research. June 2009 China Intelligence Monthly; Clarksons Research: London, UK, 2009. [Google Scholar]
- Clarksons Research. September 2013 China Intelligence Monthly; Clarksons Research: London, UK, 2013. [Google Scholar]
- Clarksons Research. June 2018 China Intelligence Monthly; Clarksons Research: London, UK, 2018. [Google Scholar]
- Clarksons Research. Shipping Intelligence Network Time Series; Clarksons Research: London, UK, 2017. [Google Scholar]
- Stopford, M. Maritime Economics, 3rd ed.; Routledge: Abingdon, UK, 2009. [Google Scholar]
- Huang, Q.H. China’s Industrialization Process; Springer: Singapore, 2018. [Google Scholar]
- Liu, Z.; Li, L.; Zhang, Y.J. Investigating the CO2 emission differences among China’s transport sectors and their influencing factors. Nat. Hazards 2015, 77, 1323–1343. [Google Scholar] [CrossRef]
- Chai, J.; Lu, Q.; Wang, S.; Lai, K. Analysis of road transportation energy consumption demand in China. Transp. Res. D Transp. Environ. 2016, 48, 112–124. [Google Scholar] [CrossRef]
- China Xinhua News. The 13th Five-Year Plan for Economic and Social Development of the People’s Republic of China. Available online: http://www.gov.cn/xinwen/2016-03/17/content_5054992.htm. (accessed on 10 September 2018).
- United Nations Conference on Trade and Development (UNCTAD). Review of Maritime Transport 2010; United Nations: Geneva, Switzerland, 2010. [Google Scholar]
- United Nations Conference on Trade and Development (UNCTAD). Review of Maritime Transport 2011; United Nations: Geneva, Switzerland, 2011. [Google Scholar]
- United Nations Conference on Trade and Development (UNCTAD). Review of Maritime Transport 2012; United Nations: Geneva, Switzerland, 2012. [Google Scholar]
- United Nations Conference on Trade and Development (UNCTAD). Review of Maritime Transport 2015; United Nations: Geneva, Switzerland, 2015. [Google Scholar]
Figure 1.
Eight decoupling states of the Tapio decoupling model.

Figure 2.
Trajectory of CO2 emissions in the China-oriented international maritime transport sector.
Figure 2.
Trajectory of CO2 emissions in the China-oriented international maritime transport sector.

Figure 3.
The proportions of CO2 emissions from different types of vessels (inner: year 2000; interim: year 2008; external: year 2017).
Figure 3.
The proportions of CO2 emissions from different types of vessels (inner: year 2000; interim: year 2008; external: year 2017).

Figure 4.
Decomposition results of CO2 emissions changes of international marine transport.

Figure 5.
Economic growth effect contribution and total change of CO2 emissions.

Figure 6.
Energy intensities (g/t*km) of vessels in 2000 and 2017.

Figure 7.
The decoupling state between CO2 emission and economic growth.

Figure 8.
The decomposition of the total decoupling index during sub-periods and the whole period.


Table 1.
Carrying cargoes and the main trade flow.
| Ship Type | Carrying Cargoes | Mainly Export/Import |
|---|---|---|
| crude oil carriers | crude oil | Import |
| oil product carriers | oil products | Import |
| chemical tankers | chemicals | Import |
| liquid gas tankers | gas liquids | Import |
| containerships | containerizable | Import/Export |
| reefer cargos | reefer trades | Import/Export |
| dry bulk carriers | coal | Import |
| grains | Import | |
| agribulks | Import | |
| iron ore | Import | |
| steel products | Export | |
| minerals | Export | |
| metals | Import | |
| forest products | Import | |
| fertilizers | Import/Export |
Table 2.
The influence of commodity structure changes on CO2 emissions (Mt).
| Time Period | ||||||||
|---|---|---|---|---|---|---|---|---|
| 2000–2001 | −0.15 | −1.39 | 0.00 | 0.19 | −0.03 | 0.91 | 0.08 | 0.09 |
| 2001–2002 | 0.44 | −0.11 | −0.26 | 0.22 | 0.04 | −0.12 | 0.78 | −0.11 |
| 2002–2003 | 0.93 | 0.28 | 0.44 | −0.02 | −0.06 | −0.50 | 0.80 | −0.01 |
| 2003–2004 | 0.59 | 0.51 | −0.07 | −0.18 | −0.05 | −0.49 | 0.92 | −0.05 |
| 2004–2005 | −0.40 | −0.62 | −0.81 | −0.09 | −0.08 | 0.58 | 0.73 | −0.10 |
| 2005–2006 | −0.66 | −0.18 | −0.48 | −0.35 | −0.03 | 0.41 | −0.05 | 0.03 |
| 2006–2007 | −0.79 | −0.35 | −0.50 | −0.27 | 0.05 | 0.56 | −0.14 | −0.15 |
| 2007–2008 | 0.32 | 0.72 | 0.31 | −0.09 | −0.03 | −0.51 | 0.18 | −0.27 |
| 2008–2009 | −5.49 | −0.62 | −0.06 | −0.04 | 0.15 | 2.36 | −7.45 | 0.17 |
| 2009–2010 | −0.14 | 0.81 | −0.49 | −0.31 | 0.18 | −0.43 | 0.24 | −0.13 |
| 2010–2011 | −1.59 | −0.54 | −0.62 | −0.40 | 0.23 | 0.94 | −1.12 | −0.06 |
| 2011–2012 | −2.09 | −0.06 | −0.59 | −0.37 | 0.08 | 0.85 | −1.91 | −0.09 |
| 2012–2013 | −1.84 | −0.60 | −0.26 | −0.37 | 0.15 | 1.09 | −1.78 | −0.07 |
| 2013–2014 | −1.57 | 0.54 | −0.95 | −0.25 | 0.20 | 0.22 | −1.32 | −0.01 |
| 2014–2015 | 0.86 | 0.95 | 0.40 | 0.08 | 0.29 | −0.99 | 0.09 | 0.03 |
| 2015–2016 | −1.13 | 1.76 | 0.56 | −0.05 | 0.34 | −0.74 | −2.88 | −0.13 |
| 2016–2017 | −0.65 | 1.06 | 0.03 | 0.02 | 0.82 | −0.59 | −1.95 | −0.04 |
| 2000–2017 | −13.35 | 2.17 | −3.36 | −2.27 | 2.24 | 3.55 | −14.77 | −0.90 |
Note: … denote CO2 emission changes caused by the commodity structure variation of crude oil tankers, products tankers, chemical tankers, liquid gas carriers, bulk carriers, containerships, and reefers.
Table 3.
The decoupling analysis between CO2 emissions and economic growth.
| Year | Decoupling State | |||
|---|---|---|---|---|
| 2000–2001 | 0.164 | 0.083 | 1.972 | END |
| 2001–2002 | 0.145 | 0.091 | 1.598 | END |
| 2002–2003 | 0.212 | 0.100 | 2.115 | END |
| 2003–2004 | 0.187 | 0.101 | 1.849 | END |
| 2004–2005 | 0.142 | 0.114 | 1.245 | END |
| 2005–2006 | 0.155 | 0.127 | 1.217 | END |
| 2006–2007 | 0.112 | 0.142 | 0.787 | WD |
| 2007–2008 | 0.020 | 0.097 | 0.211 | WD |
| 2008–2009 | 0.071 | 0.094 | 0.759 | WD |
| 2009–2010 | 0.125 | 0.106 | 1.128 | EC |
| 2010–2011 | 0.098 | 0.095 | 1.030 | EC |
| 2011–2012 | 0.067 | 0.079 | 0.852 | EC |
| 2012–2013 | 0.070 | 0.078 | 0.903 | EC |
| 2013–2014 | 0.049 | 0.073 | 0.677 | WD |
| 2014–2015 | 0.005 | 0.069 | 0.067 | WD |
| 2015–2016 | 0.039 | 0.067 | 0.589 | WD |
| 2016–2017 | 0.050 | 0.069 | 0.724 | WD |
© 2019 by the authors. Licensee MDPI, Basel, Switzerland. This article is an open access article distributed under the terms and conditions of the Creative Commons Attribution (CC BY) license (http://creativecommons.org/licenses/by/4.0/).
Share and Cite
MDPI and ACS Style
Yang, H.; Ma, X. Uncovering CO2 Emissions Patterns from China-Oriented International Maritime Transport: Decomposition and Decoupling Analysis. Sustainability 2019, 11, 2826. https://doi.org/10.3390/su11102826
AMA Style
Yang H, Ma X. Uncovering CO2 Emissions Patterns from China-Oriented International Maritime Transport: Decomposition and Decoupling Analysis. Sustainability. 2019; 11(10):2826. https://doi.org/10.3390/su11102826
Chicago/Turabian StyleYang, Hualong, and Xuefei Ma. 2019. "Uncovering CO2 Emissions Patterns from China-Oriented International Maritime Transport: Decomposition and Decoupling Analysis" Sustainability 11, no. 10: 2826. https://doi.org/10.3390/su11102826
Note that from the first issue of 2016, this journal uses article numbers instead of page numbers. See further details here.