Telecoupled Food Trade Affects Pericoupled Trade and Intracoupled Production


1
Center for Systems Integration and Sustainability, Department of Fisheries and Wildlife, Michigan State University, East Lansing, MI 48823, USA
2
Department of Counseling, Educational Psychology and Special Education, Michigan State University, East Lansing, MI 48823, USA
*
Author to whom correspondence should be addressed.
Sustainability 2019, 11(10), 2908; https://doi.org/10.3390/su11102908
Submission received: 18 April 2019
/
Revised: 9 May 2019
/
Accepted: 13 May 2019
/
Published: 22 May 2019
(This article belongs to the Special Issue Through the Lens of Telecoupling: New Perspectives for Global Sustainability)
Abstract
:Technology, transportation and global appetites have transformed trade relationships between near and distant countries. The impact of distant food demand on local agricultural production and trade has attracted considerable scientific scrutiny, yet little is known about how distant trade affects trade relationships and production between adjacent countries. In this paper, we explore this important issue by examining international food trade and agriculture production, which represent how distant places are connected through trade networks. By analyzing patterns of soybean, corn and wheat trading between 1991–2016 under the framework of metacoupling (human-nature interactions within, as well as between adjacent and distant systems), this study provides new insights into the spatio-temporal dynamics of trade flows. Results reveal that telecoupled (between distant countries) trade interacts with the geo-political landscape to enhance or offset intracoupled (within country) production and pericoupled (between neighboring countries) trade. Evidence from the literature and the results of autoregressive integrated moving average models indicate that when restrictions are placed on distant export routes, pericoupled trade increased. The extent to which the telecoupled food trade affected the pericoupled trade and intracoupled processes holds implications for the true extent of production driven by distant demands.
Keywords:
soybeans; international trade; metacoupling; telecoupling; pericoupling; intracoupling; trade barriers; ARIMA1. Introduction
International food trade and globalized agricultural production connect humans and the environment around the world [1,2,3,4,5]. The rate and scale of the food trade have significantly increased in the past several decades, even though both importing and exporting countries produce and consume similar types of food [6]. These interconnections may continue to increase as population growth increases caloric demand and greater affluence drives changes in consumption patterns [7,8,9,10]. Because these phenomena have been implicated as the main drivers of increased crop production and trade, as well as their associated environmental and socioeconomic impacts, the conceptual framework of telecoupling has emerged to help disentangle distant human-environment interactions [11].
The soybean trade is representative of the ways in which distant people and places are connected through telecoupling. In the context of the global food trade, much research has been conducted on the large flow of soybeans from the Americas to China [12,13,14,15,16]. For example, many studies have documented production increases in Brazil and the United States (U.S.) as well as several other countries (e.g., Argentina, Canada, Uruguay, Paraguay [17,18]) to meet the rising demand from China. China’s soybean demand is primarily driven by the meat consumption of their burgeoning middle class [19]; however, the catalyst that initiated the flow of soybeans from west to east was China lowering the soybean import tariff from 130% to 3% in 1995 [12,17]. This reduction quickly increased China’s soybean imports and sent a signal through the global market that increased demand for, and therefore production of, soybeans around the world. At the time, the U.S. was the world’s largest producer and exporter of soybeans, accounting for 68% of China’s soybean imports in 1995, but has since declined to 40% in 2016 [20]. Brazil first surpassed the U.S. in terms of Chinese market share in 2006 and then again in terms of total soybean production in 2013 [20]. Between 1995 (when China lowered their soybean import tariff) and 2016, total soybean exports from Brazil to China increased by over 750,000% [20]. Numerous previous studies have highlighted a highly concentrated trade network where Brazil and the U.S. account for 80% of global soybean exports and China makes up 64% of global soybean imports [6,10,16,20]. Given the economic [19,21], environmental [14,22] and political [23,24] importance of the soybean trade, the dynamics among Brazil, China and the U.S. have been widely studied by academics [14,15,25], governments [26,27,28], industry [29] and NGOs [30].
While the literature documents production increases in South American countries as a response to China’s soybean demand [18,23], little is known about how China’s soybean demand has altered the trade relationships among South American countries. Few studies have looked beyond soybean flows between the world’s top producing and consuming countries to determine the structure of trade between medium-size producers, or the effects that high volume soybean trade has had on them. To address this research gap, this study uses the metacoupling framework [31], which is an extension of the telecoupling framework [11], to explore how telecoupled (e.g., distant) soybean trade between Brazil and China has influenced pericoupled (e.g., trade between neighboring countries) and intracoupled (e.g., production within a country) processes within South America.
To study the interaction between telecouplings and pericouplings, we identified soybean exports from Brazil to China as our focal telecoupling, because it is the largest bilateral exchange of soybeans [20]. To explore the influence of telecouplings on pericouplings, Argentina, Paraguay and Uruguay were identified for several reasons. First, they share a border and joint membership in the Mercosur trade agreement with Brazil allowing feasible pericoupled trade, both geographically and politically [32,33]. Second, Argentina, Paraguay and Uruguay are net soybean exporters to Brazil, whereas Bolivia, Chile, Colombia, Ecuador, Peru and Venezuela are net importers from Brazil and do not send soybeans to China. Because of their lack of participation in the Chinese soybean trade, these countries were excluded from further analysis. Third, Argentina, Paraguay and Uruguay have ideal climatic and environmental conditions for soybean production and were the respective 3rd, 4th and seventh largest soybean exporters in 2016 [20]. Last, the literature has suggested that there are spillover effects of Brazil’s large-scale soybean production on regional cropping patterns [21,22,34]. Corn and wheat trade were identified as possible relationships to be affected by soybean expansion based on production-substitute suitability, their status as globally important food crops, a literature review, and preliminary analyses as well as data availability. After analyzing production and trade data to identify patterns in bilateral trade relationships of soybeans, corn and wheat, a literature review and autoregressive integrated moving average models (ARIMA) were used to identify changes in trade patterns before and after China lowered their soybean tariff.
2. Materials and Methods
2.1. Conceptual Framework
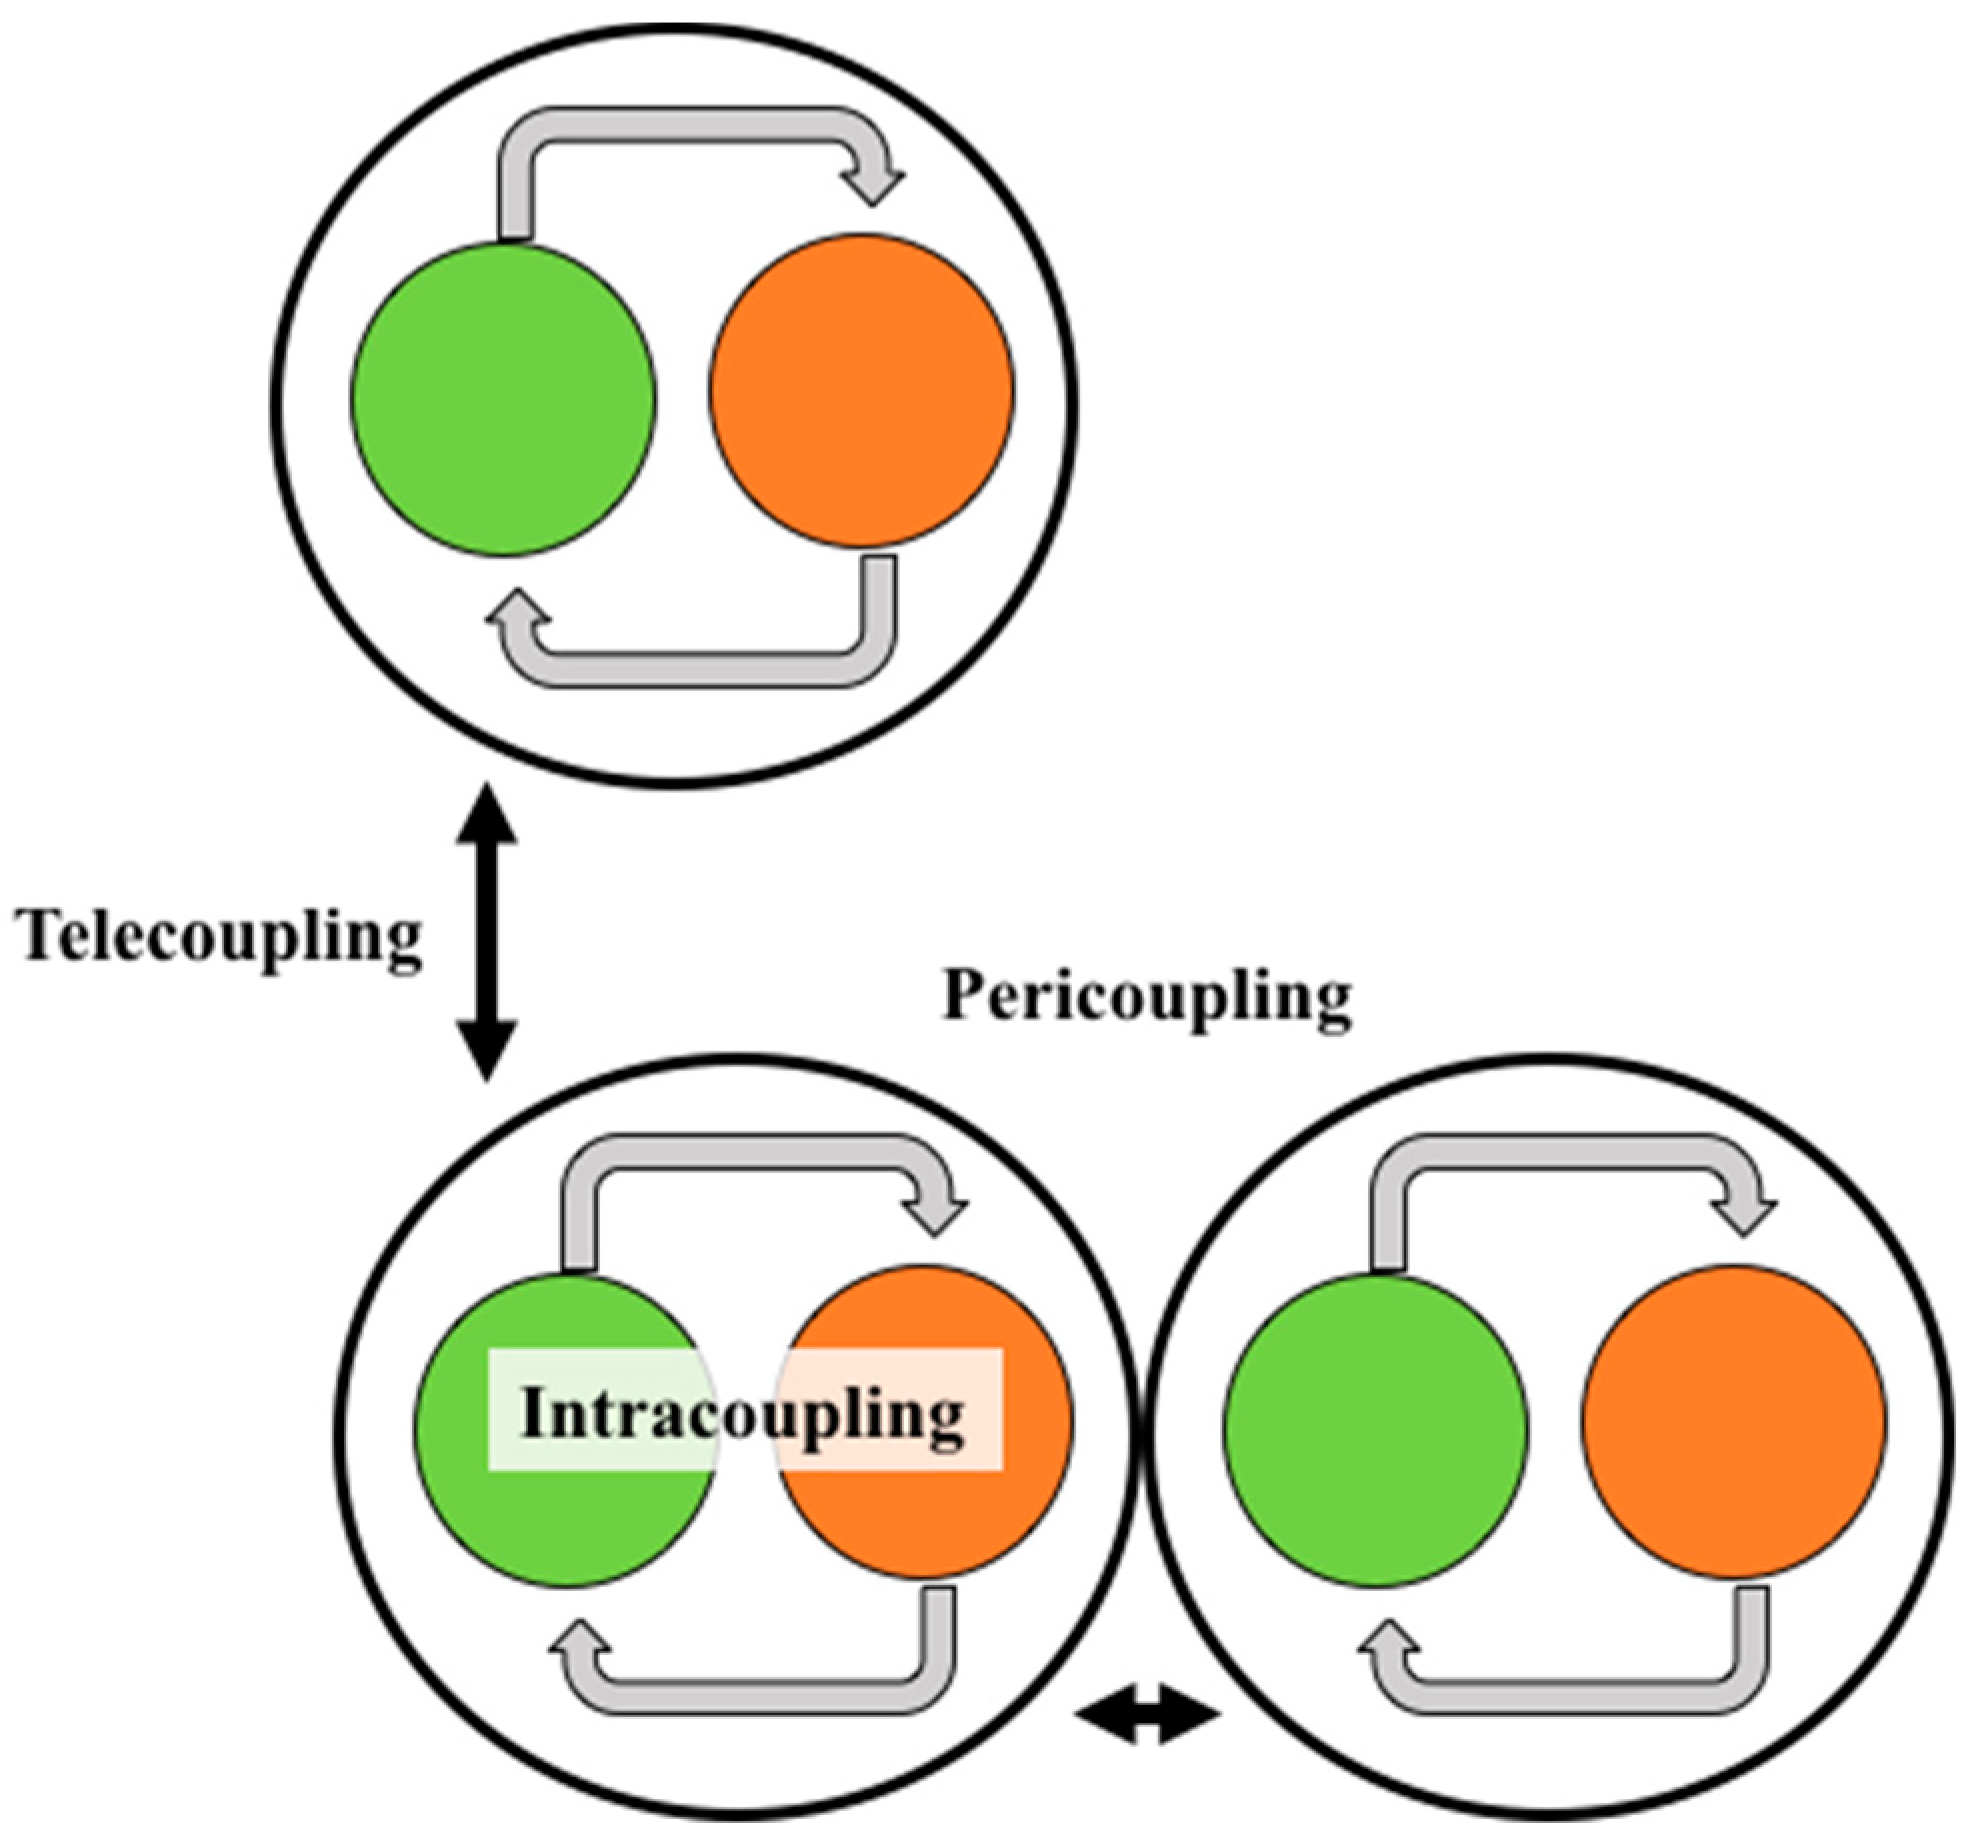
This study treats the South American food trade network as a metacoupled system. The metacoupling framework is an umbrella framework that examines three types of human-nature interactions. Human-nature interactions occurring within a coupled human and natural system are called intracouplings. Pericouplings occur when human-nature interactions cross boundaries between adjacent systems, while telecouplings examine human-nature interactions across distance. By providing a typology that categorizes processes as intracouplings, pericouplings and telecouplings (Figure 1), the metacoupling framework provides a structure for developing a more complete understanding of the complexity within trade networks. In relation to telecoupled trade between South American soybean-sending systems (e.g., Brazil, Argentina, Paraguay and Uruguay) and China, trade relationships among the neighboring countries in South America are classified as pericouplings, and production within a country is considered as an intracoupling. Because 30% of all global soybean trade flows in 2016 occurred between Brazil and China [20], this relationship is considered the main soybean telecoupling and a driver of structural change in the metacoupled soybean trade network.
2.2. Relevant Theories
Originating in the interdisciplinary field of land system science, the metacoupling framework aims to capture various socioeconomic and environmental interactions as well as their impacts, at multiple distances. The metacoupling concept and framework [31] is an extension of the telecoupling concept and framework [11] which was derived from the integration of the concepts such as teleconnections (e.g., distant climatic connections [35]) and globalization (e.g., distant connections among human systems [36]). The metacoupling concept and framework are also supported through the integration of a variety of interdisciplinary concepts and theories [37]. For example, metacoupled systems can be treated as complex adaptive systems [38,39] with interacting feedbacks and spillovers at multiple scales.
The metacoupling framework can also be integrated with traditional theories of international trade. International trade theory suggests that every country has a comparative advantage in terms of a good or service that could be produced at a relatively lower cost than other countries. Countries producing similar goods and services still trade with one another, because comparative advantages stem from not only differences in climate as well as natural and human resources but also from differences in technology, economies of scale, preference for variety and other factors [40]. By framing this study under the metacoupling framework and incorporating interdisciplinary concepts, such as theories of international trade, we were able to identify multiple drivers that influence tele- and pericoupled trade relationships.
2.3. Data Collection
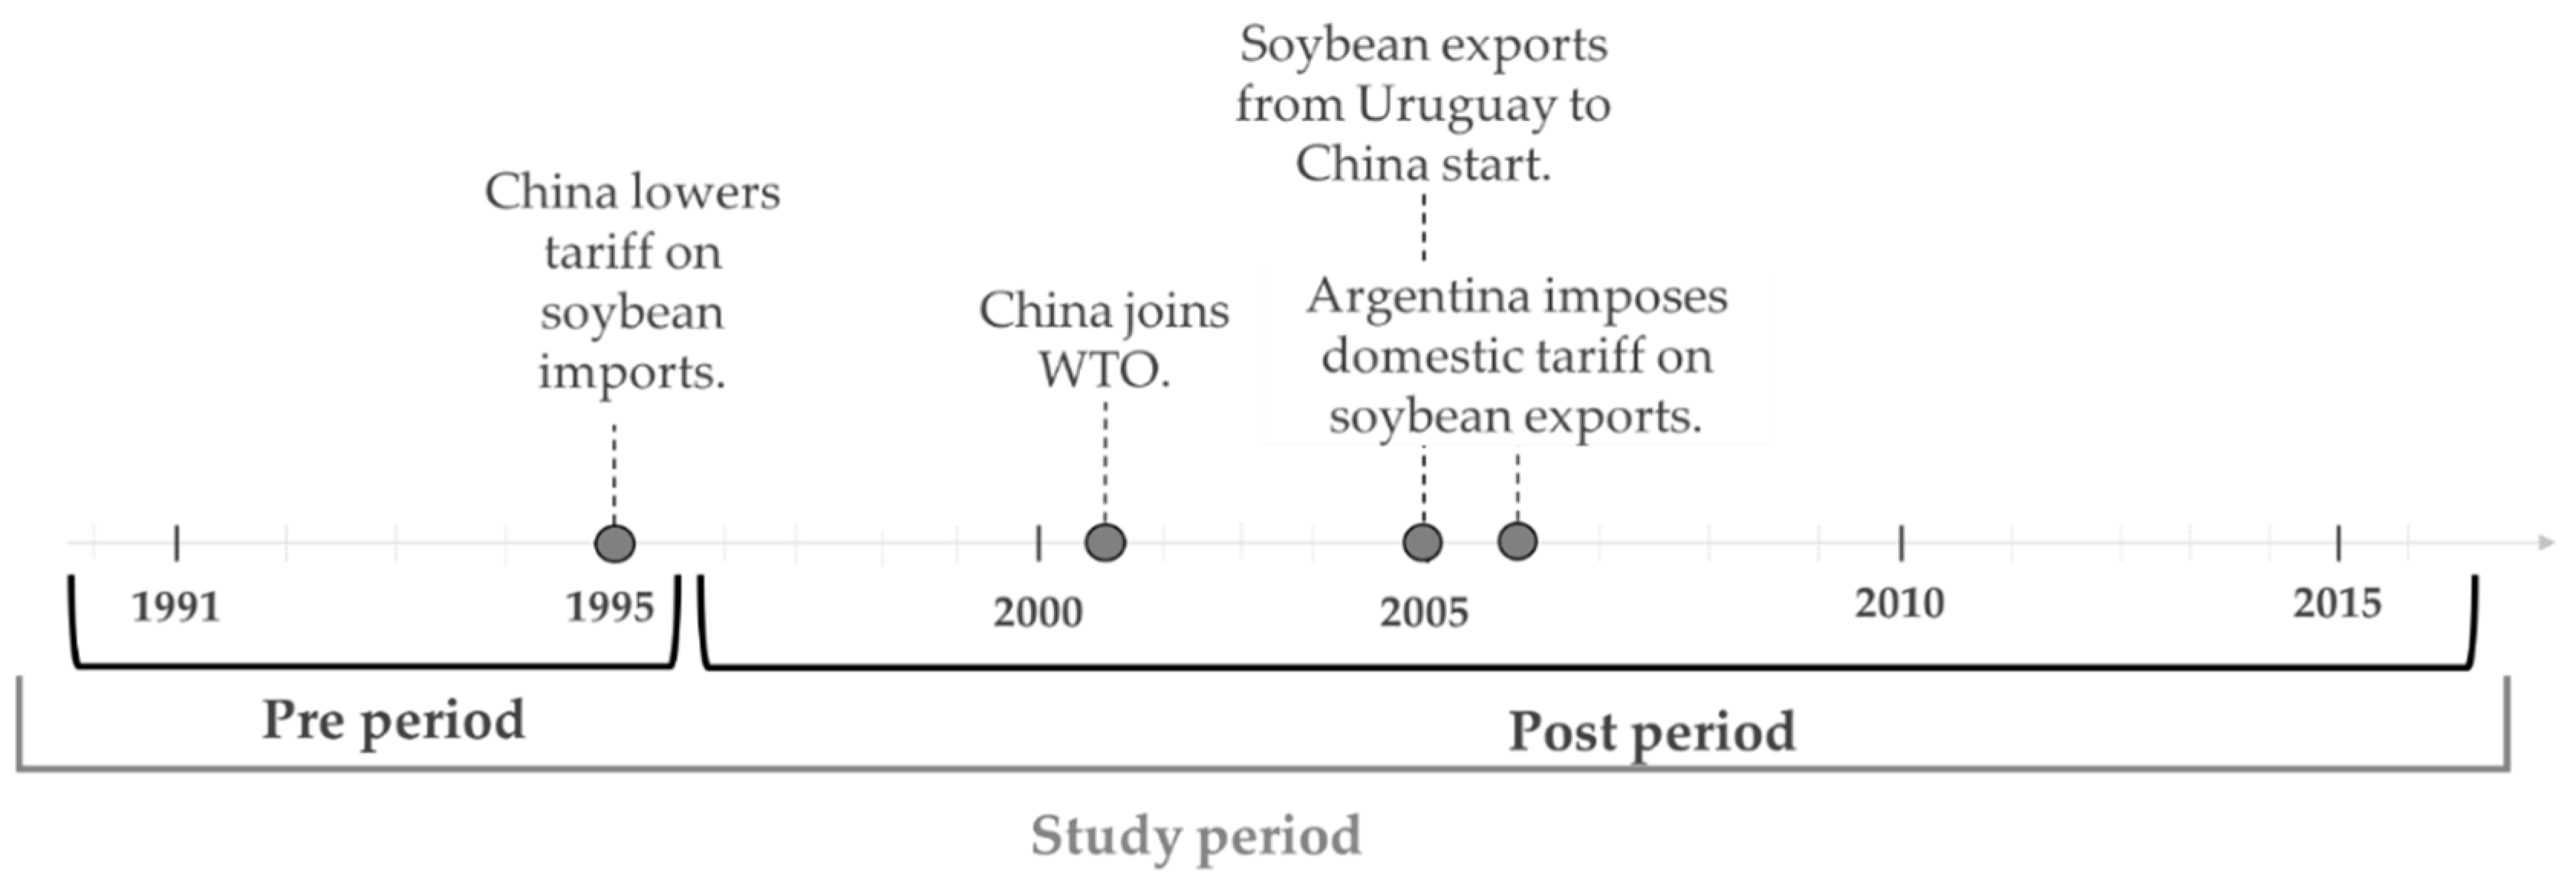
Soybean, corn and wheat production data were collected from FAOstat for the years 1991 to 2016 [41]. Total imports, total exports, and bilateral crop trade data were collected from UNComTrade [20] under HS code 1201 (soybeans), 1005 (corn), and 1001 (wheat) for the same time period. The study period 1991–2016 was chosen to capture change in the soybean trade network since the Chinese soybean tariff was lowered in 1995 [13,17]. While China did not join the World Trade Organization (WTO) until 2001, the study period was chosen to reflect the time before and after China lowered its tariff on soybean imports (Figure 2), reflecting China’s stronger soybean demand entered the global market. Data were thus split into two periods, before (1991–1995) and after (1996–2016) China’s lower tariff (Figure 2). Due to limited trade during the pre-period, values are reported as average in order to avoid comparing trade values in 2016 to a trade value of 0. Trade values below 25,000 metric tonnes (MT), which is 0.0007% of the soybeans exported from Brazil to China in 2016, were excluded from the analysis. Furthermore, many countries did not report bilateral trade data prior to 1991 which limited further historical analysis. While this study discusses four countries (i.e., Brazil, Argentina, Paraguay and Uruguay) in detail, data were collected and analyzed for all countries that were available during the study period (~75 countries).
2.4. Data Analysis
To identify trends in the production and trade of soybeans, corn and wheat both within and between country pairs from 1991 to 2016, descriptive statistics, data visualization and trend analyses were performed. To understand the drivers behind these trade trends, literature was collected from academic, government and NGO sources. Finally, to capture the interaction between tele- and pericouplings, and to estimate the impact of China’s soybean demand on trade between South America sending systems, time series autoregressive integrated moving average (ARIMA) models [42,43,44] were specified for each commodity (i.e., soybeans, corn and wheat) and bilateral country pair (e.g., China, Brazil, Argentina, Uruguay and Paraguay). When the dependent variable was telecoupling (e.g., soybean export to China), pericoupling (e.g., cross-border trade) was added as an independent variable and vice versa, to test for significance. Several country pairs had very little or no trade for certain commodities during the study period and are not discussed in this paper, full ARIMA results can be found in the Supplemental Materials (Figures S1–S5, Table S1).
Following the protocol specified in [43], outliers were smoothed and missing values were linearly interpolated before diagnostic tests were used to determine parameters and the best model fit using R packages tseries [45], forecast [43] and ggplot2 [46]. The ARIMA models capture time series trends and predict future values of trade ( at time by including autoregressive (AR(p)), integrated (I(d)) and moving average (MA(q)) model terms. The AR model term assumes the current value of trade between two countries is a linear function of the previous trade values and therefore includes p time lags to predict future values of (1).
where is a constant, are parameters and is AR polynomial order. The integrated model term I refers to the differencing degree which is calculated by subtracting the current of trade between two countries and previous values of trade times to stabilize the time series. Where is differenced times (2) and (3).
The MA model term calculates future error terms, at time , by combining previous errors terms, , where indicates the number of error terms included (4).
where is a constant, are parameters and is the MA polynomial order. Through the combination of model terms, ARIMA models (5) are commonly used to recreate a time series trend and then project into the future for predictive purposes.
Last, the ARIMA models were modified to test the influence of pericoupling processes () on telecoupling processes () (6).
where is a covariate at time and is its coefficient.
While ARIMA models are traditionally used for the purpose of forecasting, in the present case it is more informative to hindcast the predicted values in order to examine the influence of China’s tariff reduction on soybean trade. Therefore, the ARIMA models were trained on trade data in the post period (e.g., 1996–2016) and then hindcast for the pre period (e.g., 1991–1995). This method allowed for a comparison between the observed and hindcast trade data among South American sending systems before China lowered the soybean import tariff. Because the hindcast values were calculated from the trend in the post period, differences between the observed and hindcasted data approximate the effect that China’s soybean demand (e.g., telecoupling) had on trade between Brazil and nearby countries (e.g., pericoupling).
3. Results
3.1. Trend Analysis
3.1.1. Overview
While several countries in South America, as well as around the world, increased intracoupled soybean production and telecoupled export in response to China’s increased demand after entering the global market [14], Brazil emerged as the most competitive. Brazil’s success as a soybean sending system may be due to strategies used by the Brazilian government to liberalize trade and increase imports of and farmer access to fertilizers, pesticides, and seeds [47]. Since the pre-period average (1991–1995), Brazil steadily increased their market share from 0% to 46% of China’s soybean imports in 2016. The remaining 2016 market shares belonged to the U.S. (40%), Argentina (9%) followed by Uruguay and then Canada, who each accounted for less than 2% of China’s soybean imports [20]. While Argentina, Paraguay and Uruguay share a border with Brazil, as well as suitable land for soybean cultivation, their varying shares of the Chinese soybean market are largely reflective of the unique geo-political strategies taken by each country’s respective government.
3.1.2. Argentina
Exports of soybeans from Argentina to China started in 1995 and experienced rapid growth during the first decade of the study period. However, in 2006, the Argentine government placed a domestic tariff on exports of soybean of 23.5% which resulted in slower growth in soybean exports to China [48] (Figure 2). Soybean exports to other South American countries were exempt from the tariff through joint membership in the Mercosur trade agreement [32]. Between the pre-period average and 2005, Argentina’s soybean exports to China increased more than 35,000%, corresponding with a cessation of soybean exports from Argentina to Brazil in 1995 that did not start again consistently until 2005, just before Argentina’s domestic tariff went into effect. In contrast, since 2006 soybean exports from Argentina to Brazil, Paraguay and Uruguay have increased by 128,766%, 128% and 88%, respectively, while exports to China increased by 23% (Figure 3) [20,49]. Furthermore, the rate of soybean expansion by area planted in Argentina was much higher before the domestic tariff started in 2006 (i.e., 215% increase between 1995–2005 vs. 45% increase between 2006–2016). In contrast, the rate of corn expansion by area planted was much higher after 2006 (i.e., 80% increase between 1995–2005 vs. 175% increase between 2006–2016), while the rate of wheat expansion by area planted occurred at approximately the same rate before and after Argentina’s domestic tariff started in 2006 (i.e., 41% increase between 1995–2005 vs. 46% increase between 2006–2016) (Figure 3). Along with support from the literature, these results suggest that Argentina’s domestic tariff on soybean exports slowed soybean expansion and drove corn expansion while wheat intracoupling has remained relatively stable during the study period [21,50,51,52,53,54].
3.1.3. Uruguay
Differing from Argentina, Uruguay has tariff-free access to the Chinese soybean market as well as land prices that are approximately 50% cheaper than soybean land in Argentina. These factors, in combination with the financial crisis during the early 2000s, promoted investment in Uruguayan agriculture from nearby producers. In addition to investments from multinational companies, soybean expansion in Uruguay was driven primarily by investments from Argentina [29]. The flows of investment capital rapidly expanded Uruguay’s soybean production and exports, increasing exports to China by 1250% between 2005 and 2016 [20]. In 2007, two years after Uruguay began exporting soybeans to China, its soybean imports from Argentina, Brazil and Paraguay were equal to 60% of the amount Uruguay exported to China. As Uruguay increased soybean intracoupling, the contribution from nearby countries had become consistent but small. However, the rapid establishment of soybean production and foreign land ownership limited the development of soybean processing industry. Therefore, Uruguay is a net importer of both soybean oil and meal to support its a booming livestock industry, 100% of which comes from Argentina, Brazil and Paraguay [20].
3.1.4. Paraguay
Unlike Argentina and Uruguay, Paraguay chose to forgo diplomatic ties with China and market access due to ties with Taiwan [55]. Despite having restricted access to the largest soybean market, Paraguay’s soybean production increased by more than 400% between 1995 and 2016, more than half of which were exported [30,41,56]. Due to the geographic and political landscape, Paraguayan soybeans were sent via barge to river ports in Argentina and Uruguay [55,57]. Prior to 2009, exports to Argentina, Brazil and Uruguay accounted for between 40% and 70% of Paraguay’s total soybean exports. Since 2009, Paraguay has increased soybean exports to Russia and Turkey. Russia and Turkey are net exporters of processed soybean products and export soybean oil to China [20]. In 2016 29% of Paraguay’s soybean exports went to Argentina, Brazil, and Uruguay, while 15% went to Russia and 13% to Turkey [20]. While re-export analysis was not performed in the present study, the literature confirms that even though Paraguay does not directly engage in soybean trade with China, intracoupled soybean production, and pericoupled and telecoupled soybean exports have been increasingly driven by China’s soybean demand [55,57,58].
3.2. Differences in Trade Between the Pre- and Post-Period Trends
3.2.1. Overview
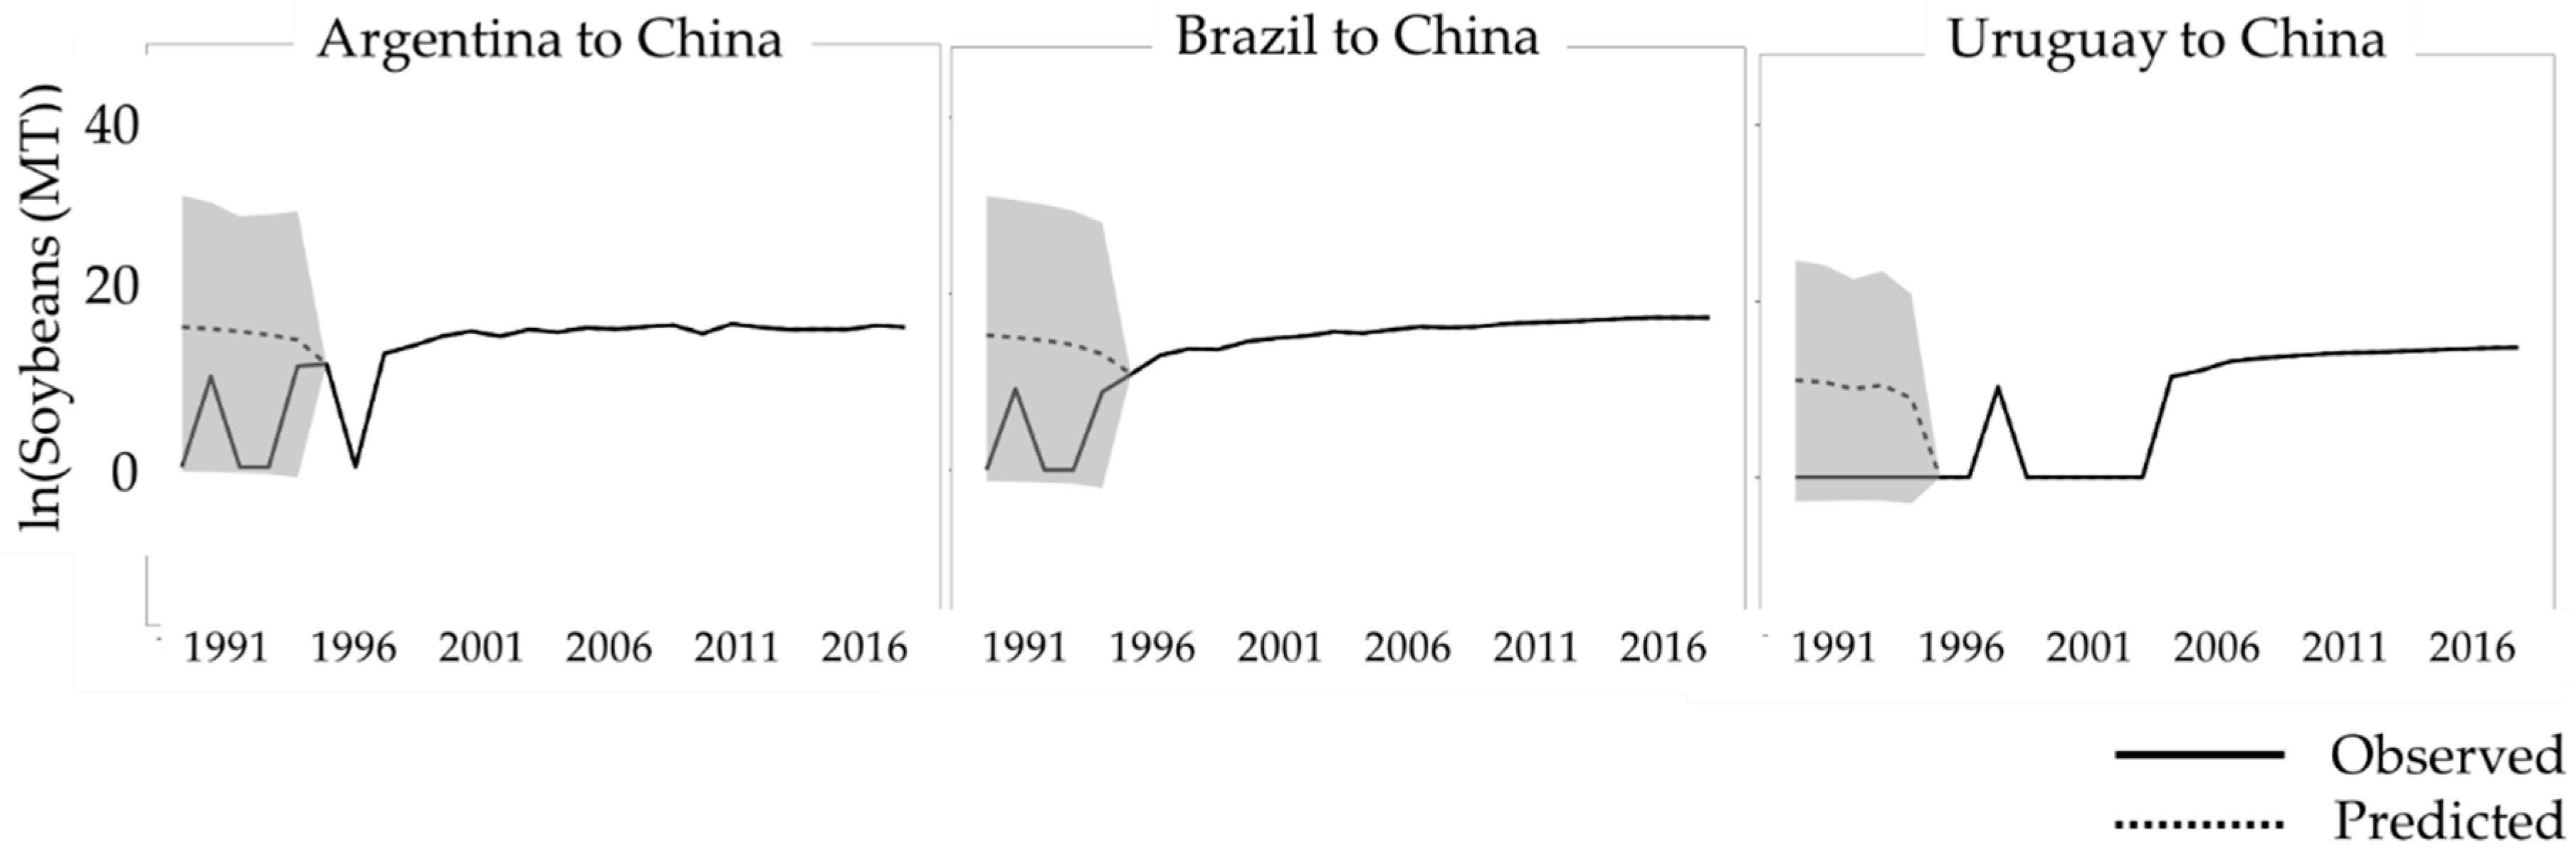
To explore differences in trade between the pre-period trend (i.e., 1991–1995, prior to China’s soybean tariff reduction) and the post-period trend (i.e., 1996–2016, after China’s soybean tariff reduction), autoregressive integrated moving average (e.g., ARIMA) models were constructed. For illustrative purposes, Figure 4 shows the ARIMA results for soybean exports from Argentina, Brazil and Uruguay to China. In all three cases, the hindcast values (e.g., dashed line) for the pre period were higher than the observed values (e.g., solid black line), indicating that based on the trend during the post period, more trade was expected during the pre-period. Differences in the hindcast values and observed trade values during the pre-period indicate that the trade trends before and after China’s market entry were different but cannot be used to directly infer the influence of China’s market demand. The relationships between telecoupled exports and pericoupled imports are shown in Table S1. Brazil and Uruguay’s soybean exports to China had a statistically significant relationship with their pericoupled soybean imports. Many other factors could drive bilateral trade relationships, such as population and economic growth, however because the models were constructed from the observed data the impact of major factors is endogenized in the ARIMA trend. The varying degrees of access to the Chinese soybean market by Argentina (somewhat restricted access), Uruguay (unrestricted access) and Paraguay (completely restricted) allow for a unique analysis of how telecoupled, pericoupled and intracoupled processes interact.
3.2.2. Argentina
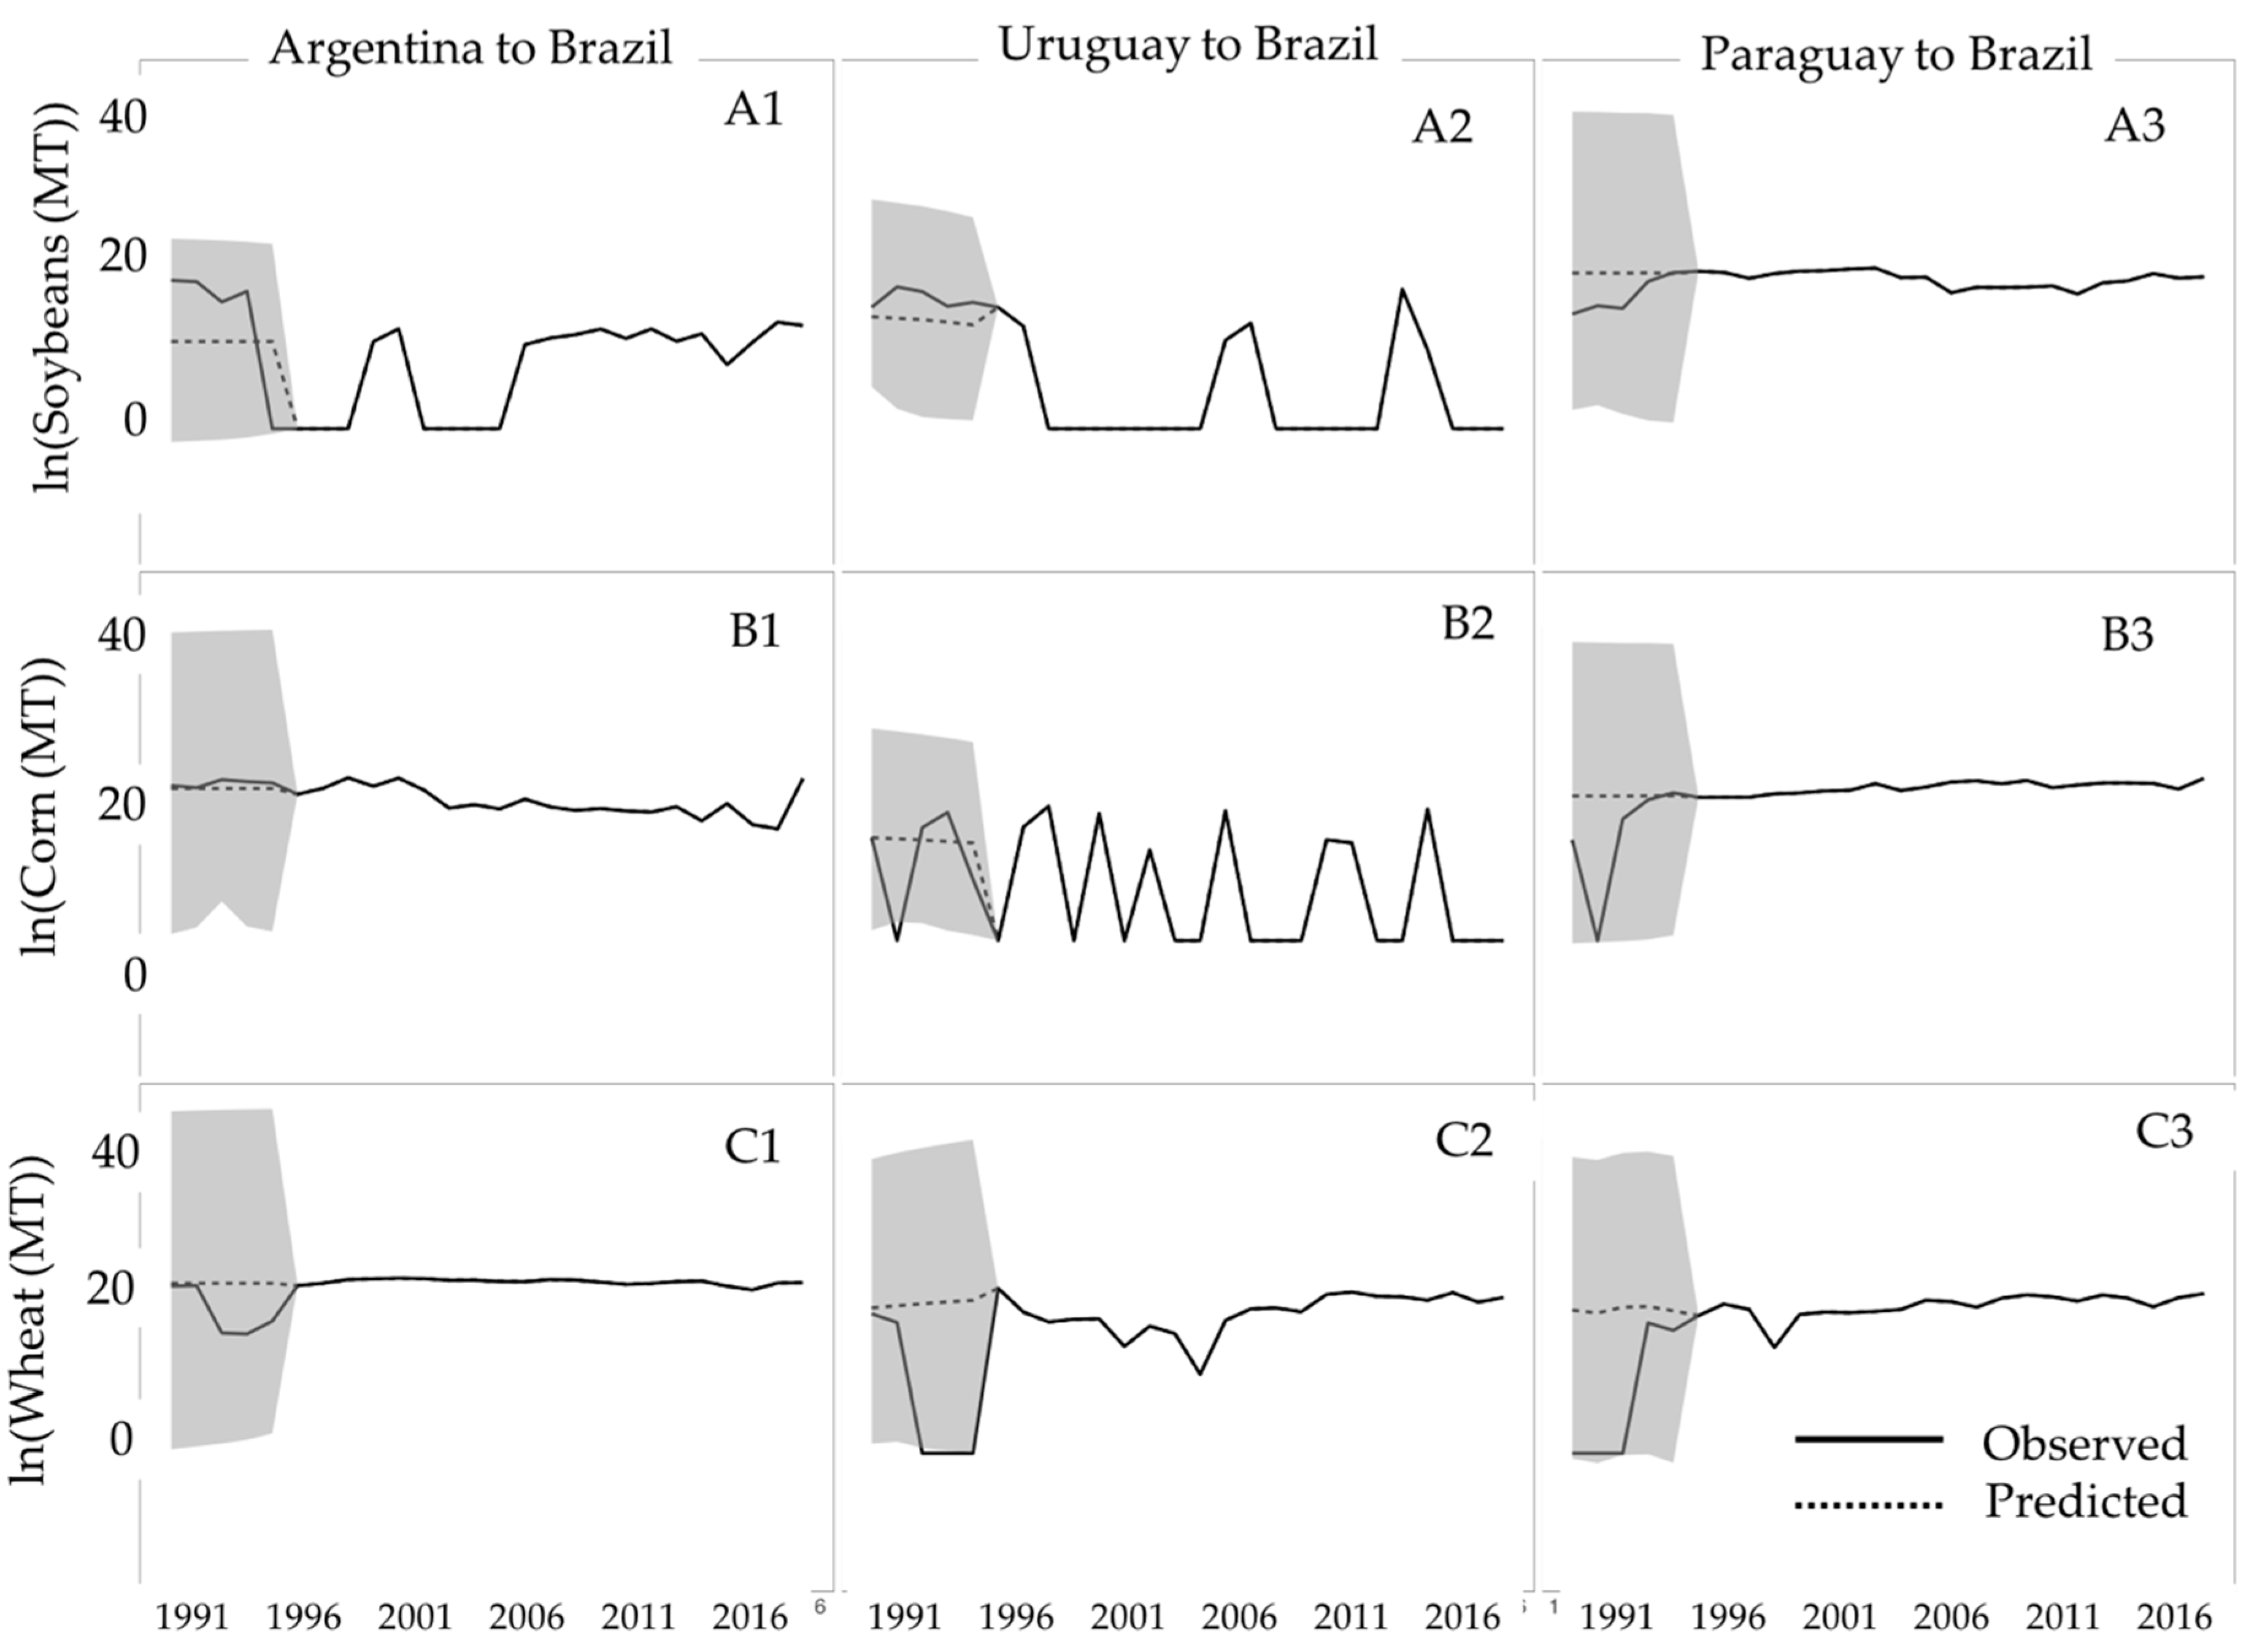
The observed trade data show that soybean exports from Argentina to Brazil have declined by 99% between the pre period (average of 1991–1995) and 2016 while exports of corn and wheat have increased 77% and 267%, respectively (Table 1) [20]. Using the trend from the post-period to hindcast the values for the pre-period, the ARIMA results indicate that the observed soybean and corn exports from Argentina to Brazil during the pre-period were higher than the hindcast values while the observed wheat exports were lower than the ARIMA values (Figure 5(A1)). With respect to soybean trade, the lower hindcast values reflect when the observed soybean exports from Argentina to Brazil dropped to zero in 1995 and did not start again consecutively until 2005, which respectively correspond with the reduction of the Chinese import tariff and the start of the Argentine export tariff.
The ARIMA results suggest that fewer soybean exports from Argentina to Brazil reflect the observed trend during the first half of the study period. However, between 2006 and 2016 soybean exports from Argentina to Brazil increased by over 400% [20]. The opposite trend was observed during the second half of the study period, which may have both masked and contributed to the relatively small difference between the observed and hindcast values (Table S1). These results suggest that pericoupled soybean trade between Argentina and Brazil was reduced between 1995 and 2005 and then enhanced between 2006 and 2016. Similarly, the hindcast values for corn exports from Argentina to Brazil are slightly lower than the observed data (Figure 5(B1)) which supports the literature finding that corn expansion in Argentina was driven by biofuel mandates in Europe and the U.S. during the mid-2000’s [54]. Competition from biofuel mandates, as well as other drivers, may have offset pericoupled corn trade between Argentina and Brazil during the post period. Differing from soybeans and corn, the observed wheat imports from Argentina to Brazil were much lower than the hindcast values (Figure 5(C1)), indicating that while pericoupled corn and soybean trade were offset during the post period, pericoupled wheat trade was enhanced.
3.2.3. Uruguay
Based on hindcasting the post-period trend, the ARIMA values for soybean and corn exports from Uruguay to Brazil were lower than the observed values during the pre-period (Figure 5 & Table S1). This is because observed soybean and corn exports from Uruguay to Brazil during the post period declined to zero (Table 1). In 1997, two years after China’s tariff was lowered, soybean exports from Uruguay to Brazil declined to zero and did not start again consistently. Further, corn exports from Uruguay to Brazil both increased and decreased but trade only occurred intermittently during the post period. The highly variable pattern and lower hindcast values indicate that exports of corn and soybeans from Uruguay to Brazil were reduced in the post period. In contrast, the observed values for wheat exports from Uruguay to Brazil were substantially lower than the hindcast values (Figure 5(C2)). The observed exports from Uruguay to Brazil increased by 1121% since the pre period (Table 1), indicating that pericoupled wheat trade was enhanced during the post period. Additionally, there was a significant relationship between Uruguay’s soybean exports to China and their soybean imports from Argentina, Brazil and Uruguay. Further, the hindcast values were higher than the observed trade for exports of corn and wheat from Argentina to Uruguay, and exports of corn and wheat from Paraguay to Uruguay (Figure S3), suggesting that Uruguay’s pericoupled imports were enhanced during the post period.
3.2.4. Paraguay
In contrast to Argentina and Uruguay, Paraguay showed a consistent pattern across soybean, corn and wheat exports to Brazil. Paraguay is the only country that is completely restricted from accessing the Chinese market and experienced increases in exports to Brazil of all three crops. Specifically, since the pre-period (average of 1991–1995) exports of soybeans, corn and wheat to Brazil have increased by 114%, 1712% and 6474%, respectively (Table 1). The observed values for soybean, corn and wheat exports from Paraguay to Brazil, during the pre-period were all lower than the ARIMA hindcast values (Figure 5(C1–C3)). The consistent pattern across crops indicates that pericoupled trade between Paraguay and Brazil was enhanced during the post period. Paraguay’s wheat exports to Brazil had a statistically significant relationship with Brazil’s soybean exports to China (Table S1). Further, in supplemental Figures S2 and S3, the hindcast values were higher than the observed soybean exports from Paraguay to Argentina, as well as soybean and corn exports from Paraguay to Uruguay.
4. Discussion
This study highlights a complex web of interactions that have been shaped by China’s soybean demand, domestic policies and international geo-political relationships (Figure 6). First, Brazil’s imports of wheat substantially increased from Argentina, Uruguay and Paraguay during the study period. The ARIMA models confirm that wheat trade during the post period was enhanced compared to the pre period. Interestingly, Argentina’s exports of wheat to Uruguay and Paraguay were also enhanced. Second, while there was a significant relationship between Brazil’s soybean exports to China and Brazil’s pericoupled soybean imports, the pattern across Argentina, Uruguay and Paraguay varied and may be related to the respective government strategies used to facilitate or inhibit trade. Soybean exports from Argentina to Brazil decreased in the first half of the study period (i.e., 1995–2005) and increased in the second half (i.e., 2006–2016), corresponding with the reduction of China’s soybean tariff and the start of a domestic export tariff. Further, while corn exports from Argentina to Brazil increased during the study period, differences between the observed and hindcast values suggest that pericoupled corn trade was offset in the post period. Direct and indirect competition from European and U.S. ethanol mandates and China’s soybean demand may have interacted to offset and enhance pericoupled soybean and corn trade between Argentina and Brazil during the post period. Uruguay did not start exporting soybeans to China until 2005, but since then has increased exports. Both soybean and corn exports from Uruguay to Brazil declined after the pre period and only occurred intermittently. Additionally, Uruguay increased imports of corn from Argentina and Paraguay. The ARIMA models indicate differences in the trend between the pre and post period which supports the observation that pericoupled trade was offset in the post period. Third, soybean and corn exports from Paraguay to Brazil increased throughout the study period and Paraguay’s wheat exports to Brazil had a significant relationship with Brazil’s soybean exports to China. The ARIMA models confirm differences between the pre and post period trends and suggest pericoupled trade was enhanced during the post period. The inability to access the Chinese market directly may have contributed to increased pericoupled trade with Brazil as well as Argentina and Uruguay, which offer export routes to distant markets [55,59]. Paraguay’s strengthening trade relationships with Russia and Turkey, who also export soybeans and soybean products, may compete with pericoupled exports and provide further evidence that Paraguay is indirectly influenced by the Chinese market.
In the meta- and telecoupling literature there are no studies that specifically address the synergy between telecoupling and pericoupling processes. However, a number of studies document spillover effects of Brazilian soybean expansion. For example, Bicudo da Silva et al. found that as a result of increased soybean production in Brazil, farmers increased operations from growing 1 to 2 crops each year which increases risk of precipitation anomalies. Soybeans are planted first, followed by corn, most of which is for domestic consumption rather than export [21]. Further, Dou et al. found that conservation efforts (i.e., Soy moratorium and zero-deforestation beef agreement) meant to contain deforestation in the Amazon biome displaced deforestation to the Cerrado region [22]. In each case, soybean expansion temporally displaced corn production and spatially displaced deforestation within Brazil’s system boundary. The results of the present study indicate that similar interactions may occur across system boundaries where telecouplings interact with pericouplings to enhance or offset one another. On the other hand, a network analysis of global soybean trade [16] identified Brazil, China and the U.S. as the key players but did not find regional or continental geography to be predictor of trade patterns. The present findings suggest that pericoupled relationships are important in global trade patterns and may be dwarfed, contextually and computationally, by the massive flows among Brazil, China and the U.S. Therefore, analyses that only consider distant trade routes or bilateral exchanges could mask the true value of the flow and therefore underrepresent the land-use impact of production. Because soybean expansion has already threatened ecosystems and displaced land-use in Brazil [21], Argentina [23] and Uruguay [34], stakeholders should consider pericoupled trade when designing policy interventions.
This study explored the impact of China’s tariff reduction and subsequent increases in soybean demand on pericoupled trade relationships between Brazil, the largest soybean exporter, and the adjacent soybean-sending systems of Paraguay, Uruguay and Argentina. We note that this analysis lacks a systematic consideration of other factors that could have driven differences between the pre- and post-period. For example, population growth and income level have been shown to be significant factors for food trade [7] and were not explicitly considered in this analysis. While the lack of other consideration is valid, ARIMA models accurately capture time-series trends by endogenizing the impact of major drivers through accounting for non-stationarity, seasonality and auto-correlation. ARIMA models use lags of the dependent variable or lags of errors as independent variables to capture the underlying systematic patterns in the data [42,60]. Additional independent variables can be added to ARIMA-X models; however, those factors should not have been affected by the intervention in question, i.e., China acceding to the WTO, and can result in over-specification. Further, ARIMA models have been shown to capture the same trend with only slight differences from ARIMA-X models [42]. Therefore, the ARIMA models can determine if the trends between the pre and post periods differ, however, those differences cannot be casually attributed to China’s soybean demand. Rather, the multitude of academic and government literature support this hypothesis [61].
5. Conclusions
The present research highlights the importance of pericoupled relationships in global trade and provides insights on how commodities flow in a metacoupled world. Despite government policies that inhibited soybean exports and expansion (e.g., Argentina and Paraguay), China’s distant demand affected intracoupling and trade both directly, via telecouplings, and indirectly through pericouplings. This suggests that in a metacoupled world, commodities would flow from areas of supply to areas of demand using the most cost-effective route [62]. If that route is restricted, the commodity will likely still flow to the area of demand, but via a different route. It is our hope that this paper stimulates future studies on metacoupled systems (e.g., beyond soybean trade, such as migration, tourism, species invasion) and provides insights for governing metacoupled systems.
Supplementary Materials
The following are available online at https://www.mdpi.com/2071-1050/11/10/2908/s1.
Author Contributions
All authors were involved in the conceptualization, writing, reviewing and editing of the manuscript; A.H. and M.G.C. curated the data, developed the methodology and performed the analysis.; A.H. and K.K. created the visualizations in the manuscript; K.A.F. and J.L. provided supervision; J.L. is responsible for project administration and funding acquisition.
Funding
This research was funded by the National Science Foundation and Michigan State University AgBio Research.
Conflicts of Interest
The authors declare no conflict of interest.
References
- Wood, S.A.; Smith, M.R.; Franzo, J.; Remans, R.; DeFries, R. Trade and the equitability of global food nutrient distribution. Nat. Sustain. 2018, 1, 34–37. [Google Scholar] [CrossRef] [Green Version]
- Lensen, M.; Moran, D.; Kanemoto, K.; Foran, B.; Lobefaro, L.; Geschke, A. International trade drives biodiversity threats in developing nations. Nature 2012, 486, 109–112. [Google Scholar] [CrossRef] [PubMed]
- Dalin, C.; Wada, Y.; Kastner, T.; Puma, M.J. Groundwater depletion embedded in international food trade. Nature 2017, 543, 700–704. [Google Scholar] [CrossRef] [PubMed] [Green Version]
- Chaudhary, A.; Katsner, T. Land use biodiversity impacts embodied in international food trade. Glob. Environ. Chang. 2016, 38, 195–204. [Google Scholar] [CrossRef]
- Moran, D.; Kanemoto, K. Identifying species threat hotspots from global supply chains. Nat. Ecol. Evol. 2017, 1. [Google Scholar] [CrossRef]
- MacDonald, G.K.; Brauman, K.A.; Sun, S.; Carlson, K.M.; Cassidy, E.S.; Gerber, J.S.; West, P.C. Rethinking agricultural trade relationships in an era of globalization. BiosSciences 2015, 65, 275–289. [Google Scholar] [CrossRef]
- Crist, E.; Moran, C.; Engelman, R. The interaction of human population, food production, and biodiversity protection. Science 2017, 356, 260–264. [Google Scholar] [CrossRef]
- DeFries, R.; Rudel, T.K.; Uriarte, M.; Hansen, M. Deforestation driven by urban population growth and agricultural trade in the twenty-first century. Nat. Geosci. 2010, 3, 178–181. [Google Scholar] [CrossRef]
- Lambin, E.F.; Meyfroidt, P. Global land use change, economic globalization, and the looming land scarcity. Proc. Natl. Acad. Sci. USA 2011, 108, 3465–3472. [Google Scholar] [CrossRef] [Green Version]
- Foley, J.A.; Ramankutty, K.A.; Brauman, K.A.; Cassidy, E.S.; Gerber, J.S.; Johnston, M.; Mueller, N.D.; O’Connell, C.; Ray, D.K.; West, P.C.; et al. Solutions for a cultivated planet. Nature 2011, 478, 337–342. [Google Scholar] [CrossRef] [Green Version]
- Liu, J.; Hull, V.; Batistella, M.; DeFries, R.; Dietz, T.; Fu, F.; Hertel, T.W.; Izaurralde, E.F.; Lambin, S.L.; Li, S.; et al. Framing sustainability in a telecoupled world. Ecol. Soc. 2013, 18, 26. [Google Scholar] [CrossRef]
- Sun, J.; Mooney, H.; Wu, W.; Tang, H.; Tong, Y.; Xu, Z.; Huang, B.; Cheng, Y.; Yang, X.; Wei, D.; et al. Importing food damages domestic environment: Evidence from global soybean trade. Proc. Natl. Acad. Sci. USA 2018, 115, 5415–5419. [Google Scholar] [CrossRef] [Green Version]
- Sun, J.; Tong, Y.; Liu, J. Telecoupled land-use changes in distant countries. J. Integr. Agric. 2017, 16, 368–376. [Google Scholar] [CrossRef]
- Reenberg, A.; Fener, N.A. Globalizing land use transistions: The soybean acceleraition. J. Geogr. 2011, 111, 85–92. [Google Scholar]
- Martinelli, A.L.; Batistella, M.; Silva, F.R.; Moran, E. Soy Expansion and Socioeconomic Development in Municipalities of Brazil. Land 2017, 6, 62. [Google Scholar] [CrossRef]
- Schaffer-Smith, D.; Tomscha, S.A.; Jarvis, K.J.; Maguire, D.Y.; Treglia, M.L.; Liu, J. Network analysis as a tool for quantifying the dynamics of metacoupled systems: An example using global soybean trade. Ecol. Soc. 2018, 23. [Google Scholar] [CrossRef]
- Sun, J.; Wu, W.; Tang, H.; Liu, J. Spatiotemporal patterns of non-genetically modified crops in the era of expansion of genetically modified food. Sci. Rep. 2015, 5, 14180. [Google Scholar] [CrossRef] [Green Version]
- Gasparri, N.I.; Kuemmerle, T.; Meyfroidt, P.; de Waroux, Y.l.P.; Kreft, H. The Emerging Soybean Production Frontier in Southern Africa: Conservation Challenges and the Role of South-South Telecouplings. Conserv. Lett. 2016, 9, 21–31. [Google Scholar] [CrossRef]
- Bo, X.; Yi, F.; Li, Y. What do China’s rising meat demand and industrialization of the livestock sector mean for its vegetable oil market? China Agric. Econ. Rev. 2017, 9, 303–316. [Google Scholar]
- UN International Statistics Division. 2018. Available online: https://comtrade.un.org/data/ (accessed on 13 May 2019).
- Bicudo da Silva, R.F.; Batistella, M.; Dou, Y.; Moran, E.F.; Torres, S.M.; Liu, J. The Sino-Brazilian Telecoupled Soybean System and Cascading Effects for the Exporting Country. Land 2017, 6, 53. [Google Scholar] [CrossRef]
- Dou, Y.; Bicudo da Silva, R.F.; Yang, H.; Liu, J. Spillover effect offsets the conservation effort in the Amazon. J. Geogr. Sci. 2018, 28, 1715–1732. [Google Scholar] [CrossRef] [Green Version]
- Li, A.S. Argentina and China: The Soybean Trade and Its Consequences; Law School International Immersion Program Papers; University of Chicago Law School Chicago Unbound: Chicago, IL, USA, 2016. [Google Scholar]
- Peine, E.K. Trading on Pork and Beans: Agribusiness and the Construction of the Brazil-China-Soy-Pork Commodity Complex. In The Ethics and Economics of Agrifood Competition; James, J.H.S., Ed.; Springer: Dordrecht, The Netherlands, 2013; pp. 193–210. [Google Scholar]
- Jordan, G.; Navin, R.; Oliver, T.C. Increasing expansion of large-scale crop production onto deforested land in sub-Andean South America. Environ. Res. Lett. 2018, 13, 084021. [Google Scholar] [Green Version]
- FAS. Vietnam’s Soybean and Soybean Meal Imports Continue to Grow in 2017; USDA Forgein Agriculutral Service: Washington, DC, USA, 2017. [Google Scholar]
- FAS. EU-27 Soybean Imports from the United States Still Impeded; USDA Forgein Agricultural Service: Washington, DC, USA, 2009. [Google Scholar]
- Westcott, P.; Trostle, R. USDA Agriculutral Projections to 2023; USDA Economic Research Service: Washington, DC, USA, 2014. [Google Scholar]
- Cargill. Growing a New Soy Industry in Uruguay. Available online: http://150.cargill.com/150/en/URUGUAYAN-SOY.jsp (accessed on 15 December 2018).
- Dutch Soy Coalition. Soy in Paraguay; Dutch Soy Coalition: Washington, DC, USA, 2009. [Google Scholar]
- Liu, J. Integration across a metacoupled world. Ecol. Soc. 2017, 22. [Google Scholar] [CrossRef]
- Felter, C.; Renwick, D. Mercosur: South America’s Fractious Trade Bloc. Available online: https://www.cfr.org/backgrounder/mercosur-south-americas-fractious-trade-bloc (accessed on 2 January 2019).
- Reeder, J.; Torene, J.; Jabara, C.; Babula, R. Regional Trade Agreements: Effects of the Andean and Mercosur Pacts on the Venezuelan Soybean Trade and U.S. Exports; U.S. International Trade Commission: Washington, DC, USA, 2005. [Google Scholar]
- Williman, K. Soybean Trade Telecouplings and Land Use Change in Uruguay: Connecting the Provincial to the Global. Master’s Thesis, Stockholm University, Stockholm, Sweden, 2015. [Google Scholar]
- Wallace, J.M.; Gutzler, D.S. Teleconnections in the Geopotential Height Field during the Northern Hemisphere Winter. Am. Meteorol. Soc. 1981, 109, 784–812. [Google Scholar] [CrossRef]
- Sassen, S. Globalization and Its Discontents: Essays on the New Mobility of People and Money; The New Press: New York, NY, USA, 1999. [Google Scholar]
- Liu, J.; Herzberger, A.; Kapsar, K.; Carlson, A.; Connor, T. What is Telecoupling? In Telecoupling: Exploring Land-Use Change in a Globalised World (Palgrave Studies in Natural Resource Management); Friis, C., Nielsen, J.Ø., Eds.; Palgrave Macmillan: Basingstoke, UK, 2019; pp. 19–48. [Google Scholar]
- Levin, S.A. Ecosystems and the biosphere as complex adaptive systems. Ecosystems 1998, 1, 431–436. [Google Scholar] [CrossRef]
- Holland, J.H. Complex Adaptive Systems. Daedalus 1992, 121, 17–30. [Google Scholar]
- Narlikar, A. New powers in the club: The challenges of global trade governance. Int. Affairs 2010, 86, 717–728. [Google Scholar] [CrossRef]
- Food and Agriculture Organization of the United Nations. FAOSTAT Statistical Database. Available online: http://www.fao.org/faostat/en/#home (accessed on 13 May 2019).
- Peter, D.; Silva, P. ARIMA vs. ARIMAX—Which approach is better to analyze and forecast macroeconomic time series? In Proceedings of the 30th International Conference Mathematical Methods in Economics, Karviná, Czech Republic, 11–13 September 2012. [Google Scholar]
- Hyndman, R.J.; Athanasopoulos, G. Forecasting: Principles and Practice; OTexts: Chula Vista, CA, USA, 2014. [Google Scholar]
- Williams, B.M.; Hoel, L.A. Modeling and Forecasting Vehicular Traffic Flow as a Seasonal ARIMA Process: Theoretical Basis and Empirical Results. J. Transp. Eng. 2003. [Google Scholar] [CrossRef]
- Trapletti, A.; Hornik, K. ggplot2: Time Series Analysis and Computational Finance; Springer: New York, NY, USA, 2018. [Google Scholar]
- Wickham, H. ggplot2: Elegant Graphics for Data Analysis; Springer: New York, NY, USA, 2016. [Google Scholar]
- Lin, Y. Post-crisis China impact on trade integration and manufacturing competitiveness between Argentina and Brazil. J. Chin. Econ. Bus. Stud. 2018, 16, 147–170. [Google Scholar] [CrossRef] [Green Version]
- Deese, W.; Reeder, J. Export taxes on agricultural products: Recent history and economic modeling of soybean export taxes in Argentina. Commission. J. Int. Commer. Econ. 2007, 1, 185. [Google Scholar]
- de Ridder, M.; ten Haaf, P.; Olah, N.; Bolscher, H. Soy Supply Security for The Netherlands; The Hague Centre for Strategic Studies, The Netherlands Organization for Applied Scientifc Research: The Hague, The Netherlands, 2015. [Google Scholar]
- Wright, B. Global Biofuels: Key to the Puzzle of Grain Market Behavior. J. Econ. Perspect. 2014, 28, 73–98. [Google Scholar] [CrossRef] [Green Version]
- Villoria, N.B.; Hertel, T.W. Geography Matters: International Trade Patterns and the Indirect Land Use Effects of Biofuels. Am. J. Agric. Econ. 2011, 93, 919–935. [Google Scholar] [CrossRef] [Green Version]
- Babcock, B.A.; Carriquiry, M. Prospects for Corn Ethanol in Argentina; IOWA State University: Ames, IA, USA, 2012. [Google Scholar]
- Vieira, L. Argentina’s Export Tax to Drive Dorn Acres Lower; Successful Farming: Des Moines, IA, USA, 2018. [Google Scholar]
- Liu, J.; Mooney, H.; Hull, V.; Davis, S.J.; Gaskell, J.; Hertel, T.; Lubchenco, J.; Seto, K.C.; Gleick, P.; Kremen, C.; et al. Systems integration for global sustainability. Science 2015, 347. [Google Scholar] [CrossRef]
- Bronstein, H.; Desantis, D. INTERVIEW-Paraguay Soybeans Flow to China Regardless of Politics; Reuters: Canary Wharf, UK, 2018. [Google Scholar]
- Solidaridad. Promoting Sustainability amoung Soy Family Farmers in Paraguay; The Sustainable Trade Initiative: Utrecht, The Netherlands, 2016. [Google Scholar]
- Bronstein, H.; Desantis, D. Paraguay Soybean Exports to Top Argentina’s for First Time; Reuters: Canary Wharf, UK, 2018. [Google Scholar]
- Brazier, J. Case Study: Paraguay’s Cursed Green Gold; South America Monthly Insight: San Francisco, CA, USA, 2017. [Google Scholar]
- Nickson, R.A. Brazil and Paraguay: A Protectorate in the making? In Brazil and Spanish America: Relationships and Comparisons; Insititue of Latin America Studies, University of London: London, UK, 2019. [Google Scholar]
- Lagarde, M. How to do (or not to do) … Assessing the impact of a policy change with routine longitudinal data. Health Policy Plan. 2011, 27, 76–83. [Google Scholar] [CrossRef] [PubMed]
- Carlson, A.; Zaehringer, J.; Garrett, R.; Felipe Bicudo Silva, R.; Furumo, P.; Raya Rey, A.; Torres, A.; Gon Chung, M.; Li, Y.; Liu, J. Toward Rigorous Telecoupling Causal Attribution: A Systematic Review and Typology. Sustainability 2018, 10, 4426. [Google Scholar] [CrossRef]
- Boulding, K. The Economics of Peace; Prentice-Hall Inc.: New York, NY, USA, 1945; Volume 278. [Google Scholar]
Figure 1.
Conceptual overview of the metacoupling framework adapted from Liu (2017). The green circles represent natural components while the orange circles represent human components of the system. Grey arrows are interactions within systems (i.e., intracoupling) and black arrows are interactions between systems (i.e., peri- and telecouplings).

Figure 2.
Timeline that defines the pre period (1991–1995, prior to China’s soybean tariff reduction) and post period (1996–2016, after China’s soybean tariff reduction) and highlights important events.
Figure 2.
Timeline that defines the pre period (1991–1995, prior to China’s soybean tariff reduction) and post period (1996–2016, after China’s soybean tariff reduction) and highlights important events.

Figure 3.
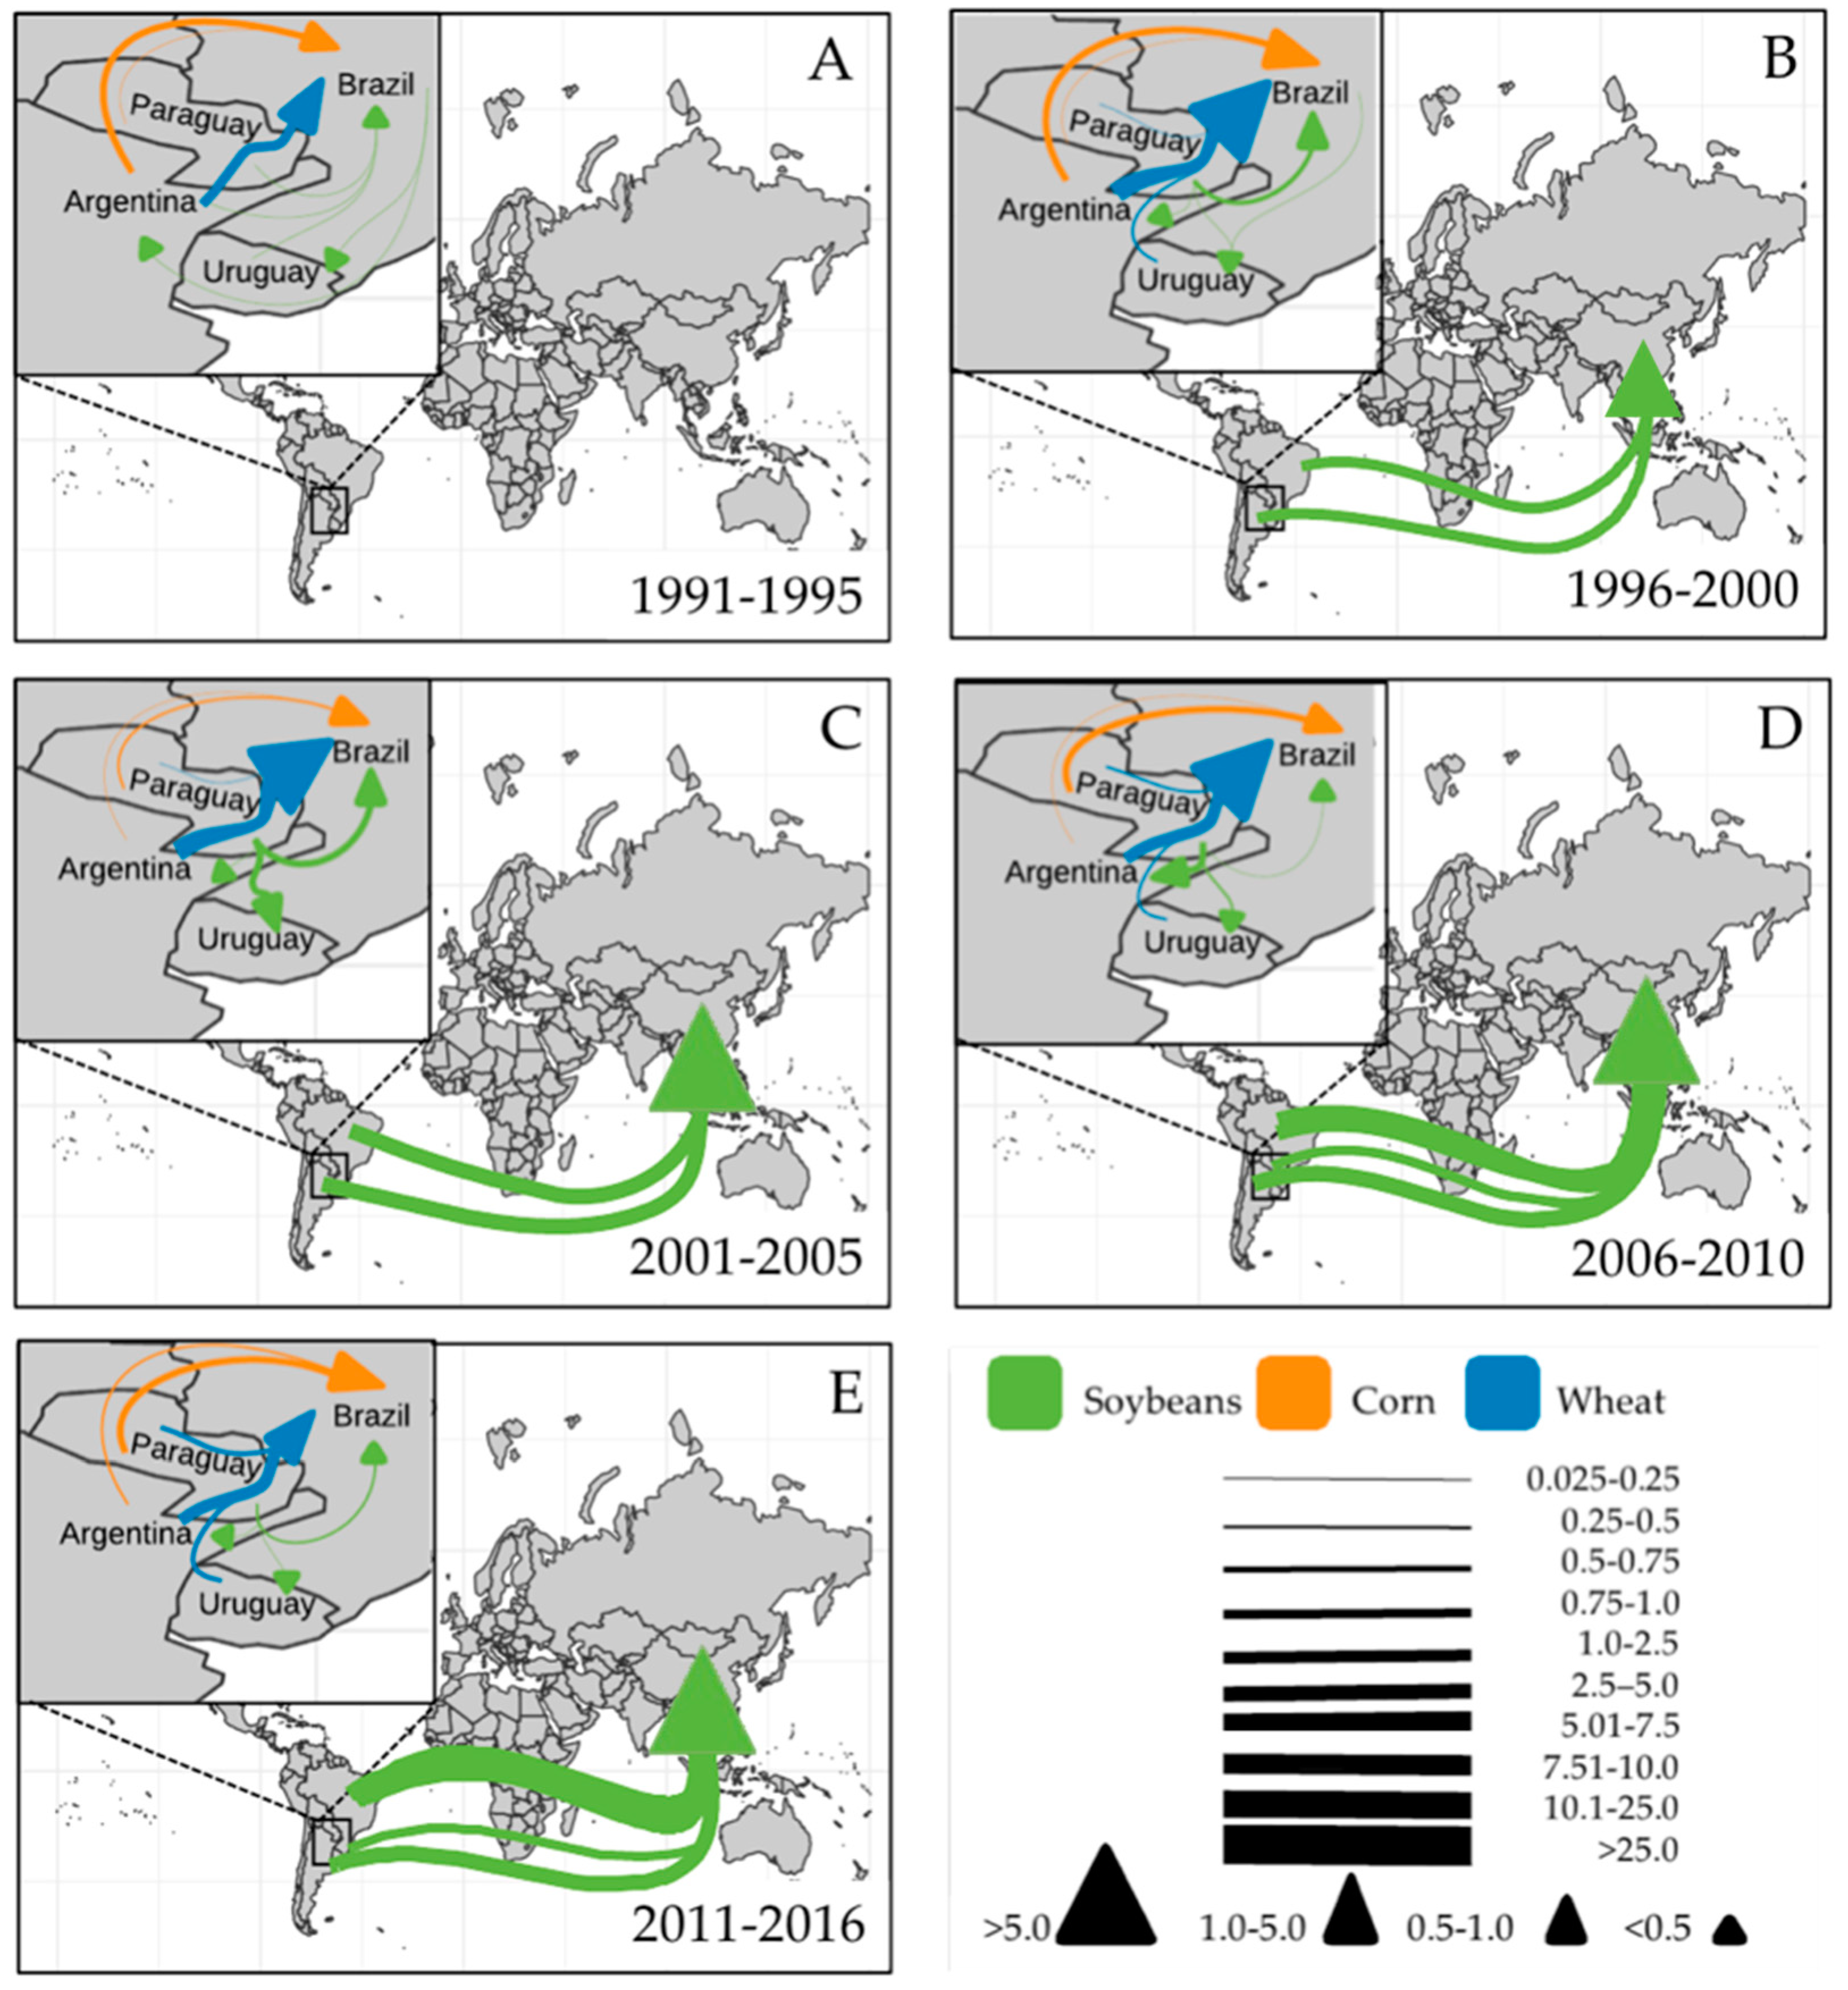
Flow maps depicting telecoupled soybean trade and pericoupled trade of soybeans (green arrow), corn (orange arrow) and wheat (blue arrow) from 1991–2016. Panels are split into 5-year time periods: 1991–1995 (A), 1996–2000 (B), 2001–2005 (C), 2006–2010 (D) and 2011–2016 (E). The width of the line represents average commodity flow from a single trade partner during the respective time period and the arrows are weighted according to total import from all trade partners. All values are presented in millions of MT. Trade amounts averaging below 25,000 MT per year were excluded.
Figure 3.
Flow maps depicting telecoupled soybean trade and pericoupled trade of soybeans (green arrow), corn (orange arrow) and wheat (blue arrow) from 1991–2016. Panels are split into 5-year time periods: 1991–1995 (A), 1996–2000 (B), 2001–2005 (C), 2006–2010 (D) and 2011–2016 (E). The width of the line represents average commodity flow from a single trade partner during the respective time period and the arrows are weighted according to total import from all trade partners. All values are presented in millions of MT. Trade amounts averaging below 25,000 MT per year were excluded.

Figure 4.
ARIMA for Argentina, Brazil and Uruguay’s soybean exports to China. See Table S1 for full country and commodity results. The solid line represents the natural log of imports in metric tonnes and the dashed line represents the natural log of the trend derived from the ARIMA models. The shaded grey area is the 95% CI. p-values, NRMSE (normalized by standard deviation) and MASE can be found in Table S1.

Figure 5.
ARIMA for Brazil’s soybean (A), corn (B) and wheat (C) imports from Argentina (1), Uruguay (2) and Paraguay (3). The solid line represents the natural log of imports in metric tonnes and the dashed line represents the natural log of the trend derived from the ARIMA models. The shaded grey area is the 95% CI.

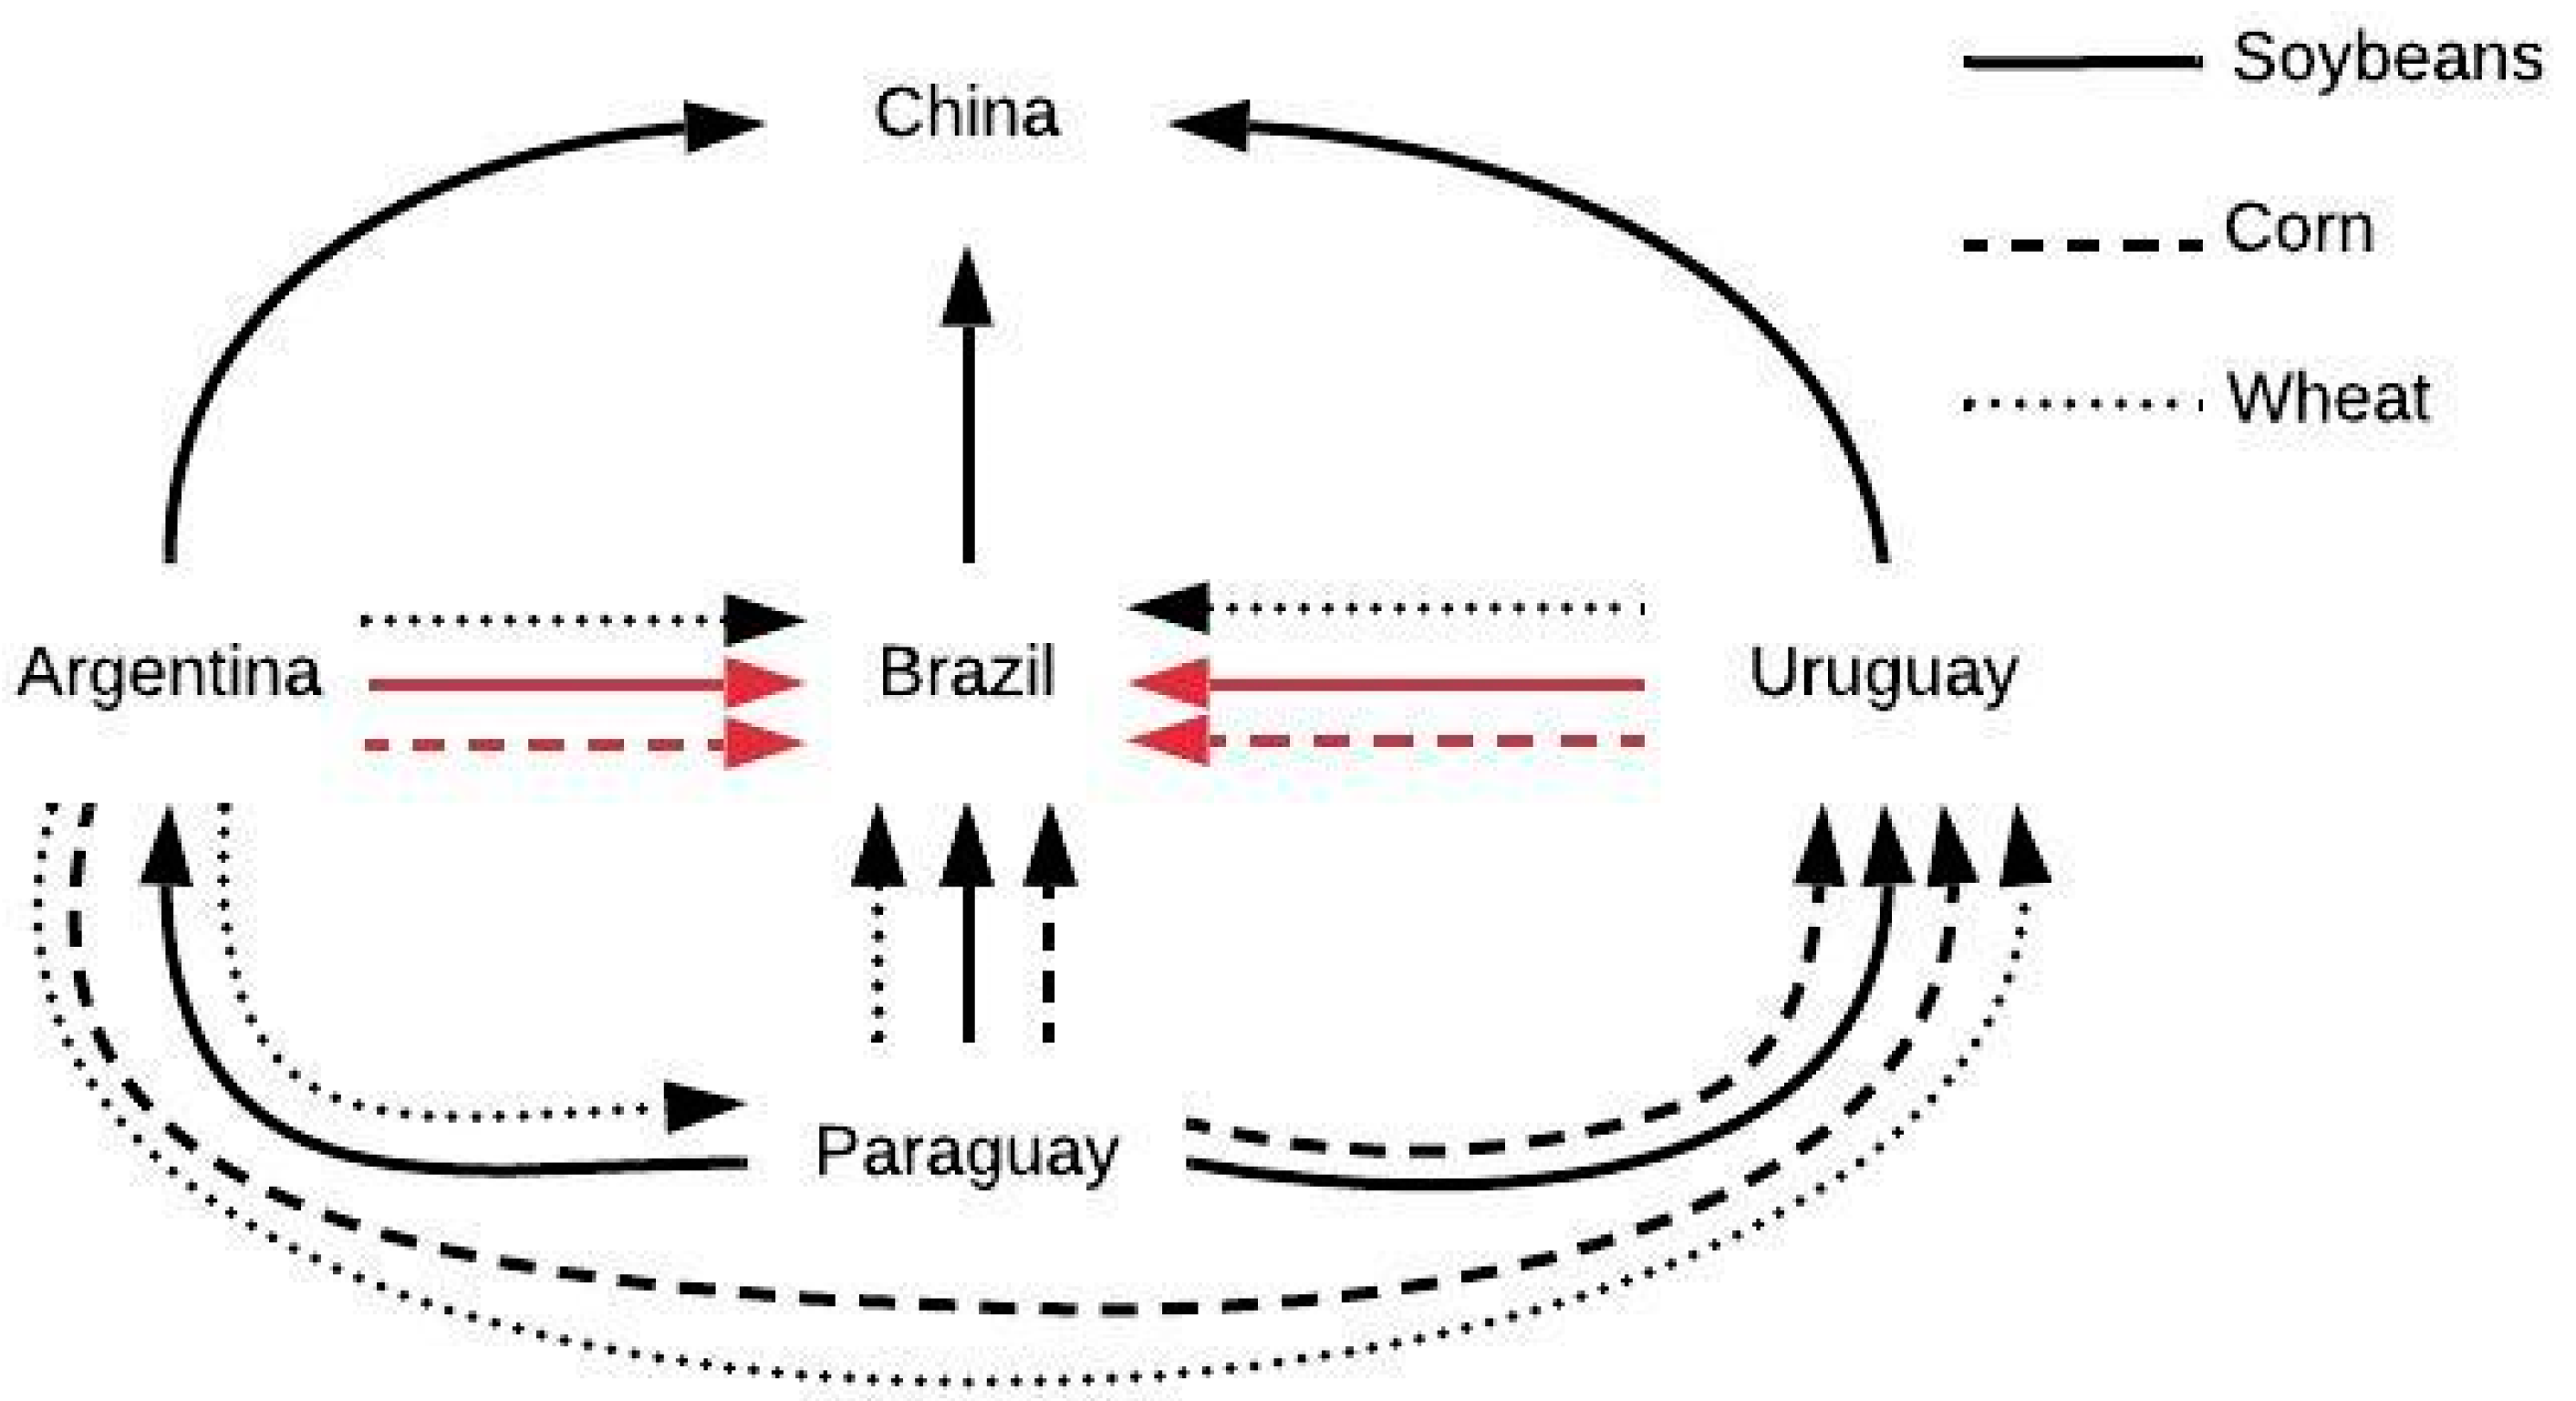
Figure 6.
Summary of ARIMA results for all bilateral trade relationships. Black lines are cases where trade flows were enhanced (hindcast values were higher than the observed trade) and red lines indicate situations where trade was offset (hindcast values were lower than the observed trade) during the pre-period. Solid lines are soybean flows, dashed are corn flows and dotted are wheat flows.

Table 1.
Brazil’s soybean, corn and wheat imports in MT from Argentina, Paraguay, Uruguay and the U.S. The table includes the trade value for the pre period (the average trade value between 1991 and 1995), 2016 and the percent change between the pre period and 2016.
Table 1.
Brazil’s soybean, corn and wheat imports in MT from Argentina, Paraguay, Uruguay and the U.S. The table includes the trade value for the pre period (the average trade value between 1991 and 1995), 2016 and the percent change between the pre period and 2016.
| Brazil’s Soybean Imports | ||||
| Argentina | Paraguay | Uruguay | USA | |
| Pre-Period | 129,079 | 177,765 | 33,016 | 187,397 |
| 2016 | 670 | 381,448 | 0 | 0 |
| Percent Change | −99.5% | 114.6% | −100% | −100% |
| Brazil’s Corn Imports | ||||
| Argentina | Paraguay | Uruguay | USA | |
| Pre-Period | 811,167 | 80,831 | 5188 | 123,894 |
| 2016 | 1,436,245 | 1,465,053 | 0 | 532 |
| Percent Change | 77% | 1712% | −100% | −99.5% |
| Brazil’s Wheat Imports | ||||
| Argentina | Paraguay | Uruguay | USA | |
| Pre-Period | 1,074,906 | 14,544 | 47,287 | 173,355 |
| 2016 | 3,950,036 | 956,125 | 577,415 | 1,226,210 |
| Percent Change | 268 | 6474% | 1121% | 607% |
© 2019 by the authors. Licensee MDPI, Basel, Switzerland. This article is an open access article distributed under the terms and conditions of the Creative Commons Attribution (CC BY) license (http://creativecommons.org/licenses/by/4.0/).
Share and Cite
MDPI and ACS Style
Herzberger, A.; Chung, M.G.; Kapsar, K.; Frank, K.A.; Liu, J. Telecoupled Food Trade Affects Pericoupled Trade and Intracoupled Production. Sustainability 2019, 11, 2908. https://doi.org/10.3390/su11102908
AMA Style
Herzberger A, Chung MG, Kapsar K, Frank KA, Liu J. Telecoupled Food Trade Affects Pericoupled Trade and Intracoupled Production. Sustainability. 2019; 11(10):2908. https://doi.org/10.3390/su11102908
Chicago/Turabian StyleHerzberger, Anna, Min Gon Chung, Kelly Kapsar, Kenneth A. Frank, and Jianguo Liu. 2019. "Telecoupled Food Trade Affects Pericoupled Trade and Intracoupled Production" Sustainability 11, no. 10: 2908. https://doi.org/10.3390/su11102908
Note that from the first issue of 2016, this journal uses article numbers instead of page numbers. See further details here.