Crop Diseases and Mycotoxin Accumulation in Temperate Agroforestry Systems


Molecular Phytopathology and Mycotoxin Research, Faculty of Agricultural Sciences, University of Goettingen, 37077 Göttingen, Germany
*
Author to whom correspondence should be addressed.
Sustainability 2019, 11(10), 2925; https://doi.org/10.3390/su11102925
Submission received: 27 March 2019
/
Revised: 17 May 2019
/
Accepted: 21 May 2019
/
Published: 23 May 2019
(This article belongs to the Special Issue Sustainable Agroforestry Systems)
Abstract
:Background: Temperate agroforestry is regarded as a sustainable alternative to monoculture agriculture due to enhanced provisioning of ecosystem services. Plant health and food safety are crucial requirements for sustainable agriculture; however, studies of fungal diseases and mycotoxin contamination of crops grown under temperate agroforestry are lacking. This study therefore aimed to compare fungal colonization and mycotoxin contamination of crops grown in temperate agroforestry against conventional monoculture. Methods: The biomass of plant pathogenic fungi in oilseed rape plants and barley and wheat grain harvested in 2016 to 2018 at four paired agroforestry and monoculture sites was quantified using species-specific real-time PCR. Mycotoxin content of barley and wheat grain was determined by HPLC-MS/MS. Results: The colonization of oilseed rape plants with the vascular pathogen Verticillium longisporum and wheat grain with the head blight pathogen Fusarium tricinctum was lower in agroforestry than in conventional monoculture. Mycotoxin content of barley and wheat grain did not differ between agroforestry and monoculture systems and did not exceed the legal limits of the EU. Remarkably, fumonisin B1 was detected in wheat grains at two sites in two years, yet the low levels found do not raise food safety concerns. No differences were found between the two production systems with regard to infection of wheat and barley grain with five Fusarium species (F. avenaceum, F. culmorum, F. graminearum, F. poae, and F. proliferatum) and oilseed rape with fungal pathogens Leptosphaeria biglobosa, Leptosphaeria maculans, and Sclerotinia sclerotiorum. Conclusions: Temperate agroforestry does not negatively affect the infection of wheat, barley and oilseed rape with major fungal pathogens though it may suppress the infection of oilseed rape with V. longisporum and wheat grain with F. tricinctum. Furthermore, temperate agroforestry does not increase mycotoxin contamination of barley and wheat. Therefore, temperate agroforestry does not negatively affect food safety.
1. Introduction
Agroforestry systems are multifunctional plant production systems that gained attention as a sustainable alternative to traditional monoculture agriculture. For example, the integration of trees in temperate agricultural systems in alley cropping patterns has been shown to increase C sequestration, soil nutrient availability, and biodiversity [1,2,3]. Other beneficial ecosystem services that are enhanced by agroforestry include pollination [1] and reduced nitrate leaching [4,5]. While yield is of key importance for the farmers, few studies addressed the long-term impact of temperate agroforestry on crop yield. Recently, a comprehensive long-term study evaluated the crop yield of winter wheat (Triticum aestivum L.) and oilseed rape (Brassica napus L.) in a temperate agroforestry system in Germany [6]. The authors found that crop yield was reduced in the vicinity of trees but temperate agroforestry did not reduce the average long-term yield. Similar results were obtained for winter wheat, barley (Hordeum vulgare L.), and maize (Zea mays L.) in young alley cropping systems in Belgium [7]. Crop yield is significantly reduced by microbial pathogens with fungal diseases being economically most relevant [8]. The loss potential of wheat due to pathogens has been estimated to be 16% [9].
Diversification of agroecosystems has been shown to suppress plant diseases [10,11,12,13]. For example, growing a mixture of varieties reduced the severity of diseases in barley [14], wheat [15], and rice [16] compared to pure stands. Crop rotation, which is a common practice in the temperate-zone, substantially contributes to plant disease control [17,18]. Intercropping systems have been shown to be less susceptible to diseases, too [19,20]. Dilution of host plant density in diversified agroecosystems is considered one of the main mechanisms contributing to the improved control of soil-borne and splash-dispersed pathogens [10,19]. Apart from host dilution, crop diseases can be suppressed by soil microflora that harbor antagonists [21,22,23] as well as by a balanced plant nutrition [11,24]. Increased biodiversity in agroforestry systems has been hypothesized to reduce the occurrence and severity of plant diseases [3], but this hypothesis has not been tested in temperate-zone plant production systems.
Modern alley cropping systems alter several microsite conditions that may affect the development and severity of crop diseases. For example, the integration of trees alters the microclimate in agroforestry systems [25,26], which in turn can affect crop diseases [19]. Furthermore, trees in agroforestry effectively reduce wind speed [27], diminishing the dissemination of splash-dispersed [28] as well as airborne pathogens and the dispersion of windblown soil carrying inoculum of fungal or bacterial pathogens [29]. If competition for essential resources (e.g., water, soil nutrients, and light) in the vicinity of the trees occurs, reduced crop development could suppress plant resistance to certain pathogens [30]. There is a lack of studies comparing fungal infection and mycotoxin contamination of crops under temperate agroforestry with monoculture systems [19].
This study aimed to investigate the impact of temperate agroforestry on the infection of oilseed rape plants and barley and wheat grain with plant pathogenic fungi and the accumulation of mycotoxins. We hypothesized that (i) agroforestry systems as a whole show either equal or lower fungal infection and mycotoxin concentration compared to conventional monoculture, and (ii) the abundance of pathogenic fungi and the concentration of mycotoxins in crops increases with the distance from the tree row in agroforestry systems.
2. Materials and Methods
2.1. Study Sites
Four sites (Jena, Cottbus, Göttingen, and Braunschweig) at which monoculture cropland was replaced by agroforestry were chosen (Figure A1). The site characteristics are reported in Table 1. The agroforestry systems were established between 2007 and 2011. The aboveground biomasses of the trees in the agroforestry systems were harvested one (Jena, Cottbus, Göttingen) or two harvests (Braunschweig) prior to our first sampling in 2016. Additionally, the trees in the agroforestry system at Cottbus were harvested in winter 2017/18. Adjacent to each agroforestry system, a monoculture cropland served as a reference system. Each paired agroforestry and monoculture system had identical crops, cultivation and harvest methods, fertilization rates, and pesticide treatments. In the agroforestry systems, poplar trees (clone Max1; Populus nigra × P. maximowiczii) were planted in 12-m wide rows in an alley cropping pattern (Jena, Cottbus, and Braunschweig) or as an adjacent short-rotation coppice (Göttingen) in a north-south direction with 48-m (Jena, Cottbus, and Braunschweig) or 24-m wide (Göttingen) crop rows (Table 2).
2.2. Experimental Design and Crop Harvest
Four transects were established in each agroforestry system and four sampling areas were set in each monoculture system as replicate plots (Figure A1). In each replicate plot of the agroforestry systems, harvest samples were taken within the crop row at distances of 1 m, 4 m, 7 m, and 24 m (Jena, Cottbus, and Braunschweig) or 1 m, 4 m, and 7 m (Göttingen) from the tree row (Figure A1). In the monoculture systems, harvest samples were taken in each replicate plot. The layout of the replicate plots within the study sites is schematically illustrated in Figure A1. Harvest samples were taken in 2016 to 2018 and include barley and wheat grain, as well as oilseed rape plants.
Barley and wheat grain as well as oilseed rape plant samples were harvested at a width of 1.5 to 2.0 m (orthogonal to the tree row of the agroforestry system) and a length of 10 m (parallel to the tree row of the agroforestry system) at each sampling location of both management systems using a plot combine. Harvest samples were subsequently dried to determine their water content and to calculate the crop yield per area. Harvest and crop yield data were provided by our cooperation partners (see Acknowledgements).
2.3. Quantification and Identification of Phytopathogenic Fungi
Fungal phytopathogens in harvest samples were quantified using species-specific real-time PCR (qPCR). DNA from wheat grains and oilseed rape plants was extracted using a cetyltrimethylammonium bromide (CTAB) protocol according to Brandfass and Karlovsky [31]. Briefly, 30 mg of finely ground material were suspended in 1 ml CTAB-buffer with proteinase K. Following incubation at 42 °C and 65 °C for 10 min each, a chloroform/isoamylalcohol (24:1 (v/v)) extraction was performed and DNA was precipitated with polyethylene glycol (PEG). Precipitated DNA was pelleted by centrifugation and the pellets were washed with 80% (v/v) ethanol twice prior to drying by vacuum-centrifugation. The dried pellets were resuspended in 50 μl TE buffer (10 mM Tris, 1 mM ethylenediaminetetraacetic acid (EDTA), pH 8.0) and incubated at 42 °C for 2 h to facilitate the dissolution of DNA. DNA from barley grains was extracted using a modified sodium dodecyl sulfate (SDS) extraction protocol from Cristina et al. [32]. 30 mg of finely ground barley grains were suspended in 500 µl lysis buffer (2.5% sorbitol (w/v), 100 mM Tris, 50 mM EDTA, 500 mM NaCl, 2% sodium N-laurylsarcosinate (w/v), 1% sodium dodecylsulfate (SDS) (w/v)). 100 µl potassium acetate (3 M) were added, the samples were thoroughly mixed and centrifuged at 7380× g for 10 min. An aliquot of 400 µl was transferred to a new 1.5 ml Eppendorf tube, 400 µl chloroform/isoamylalcohol (24:1 (v/v)) were added, the mixture was shaken, incubated on ice for 10 min, and centrifuged at 7380× g for 10 min. Following centrifugation, 400 µl of the upper phase was transferred to a new Eppendorf tube containing 100 µl of PEG 6000 (30% (w/v)) and 50 µl of NaCl (5 M). The mixture was incubated at room temperature for 20 min to allow DNA precipitation and centrifuged at 16,000× g for 15 min to pellet the precipitated DNA. DNA pellet was washed with 80% (v/v) ethanol twice prior to drying in vacuum. Dried pellets were resuspended in 50 μl TE buffer (10 mM Tris, 1 mM EDTA, pH 8.0) and incubated at 42 °C for 2 h to facilitate the dissolution of DNA. DNA extracts from barley and wheat grain were purified using spermine precipitation as described by Reineke et al. [33]. The quantity and quality of DNA in all extracts was assessed by electrophoresis in 0.8% (w/v) agarose gels stained with ethidium bromide.
Barley and wheat grain samples were tested for the presence of DNA of six Fusarium species: F. avenaceum, F. culmorum, F. graminearum, F. poae, F. proliferatum, and F. tricinctum. DNA of oilseed rape plants was examined for the presence of fungal pathogens Leptosphaeria biglobosa, Leptosphaeria maculans, Sclerotinia sclerotiorum, and Verticillium longisporum. DNA standards for qPCR assays were obtained from F. avenaceum DSM 62161, F. culmorum DSM 62191, F. graminearum IFA66, F. poae F448, F. proliferatum DSM 62261, F. tricinctum DSM 23357, L. biglobosa IPP1560 (provided by A. von Tiedemann, University of Goettingen, Germany), L. maculans T12aD34 (provided by A. von Tiedemann, University of Goettingen, Germany), S. sclerotiorum IPP 1309 (provided by A. von Tiedemann, University of Goettingen, Germany), and V. longisporum VL43 (provided by A. von Tiedemann, University of Goettingen, Germany). DNA of quantification standards were extracted using a CTAB protocol [31] and quantified by densitometry [34].
PCR analysis was carried out in the CFX 384 Thermocycler (Biorad, Rüdigheim, Germany) in 384-well microplates. qPCR assays were performed with 1 µl diluted DNA extracts (barley grain: 1:20, wheat grain: 1:50, and oilseed rape plants: 1:100 in double-distilled H2O (ddH2O)) in 4 µl reaction volume. The reaction contained mastermix ThermoPol (20 mM Tris-HCl, 10 mM (NH4)2SO4, 10 mM KCl, 2 mM MgSO4, 0.1% Triton® X-100, pH 8.8 at 25 °C) or standard Taq reaction buffer (10 mM Tris-HCl, 50 mM KCl, 1.5 mM MgCl2, pH 8.3 at 25 °C) (New England Biolabs, Beverly, Massachusetts, USA) (Table A1), containingMgCl2, deoxyribonucleosides (Bioline, Luckenwalde, Germany) and primers in concentrations given in Table A1 and Table A2, 0.1X SYBR Green I (Invitrogen, Karlsruhe, Germany), 1 mg/mL bovine serum albumin, and 0.025 u Taq DNA Polymerase or Hot Start Taq DNA Polymerase (New England Biolabs, Beverly, Massachusetts, USA) (Table A1). 1 µl template DNA Assays without template DNA served as negative controls. All DNA standards as well as negative controls were amplified in duplicates. Standard curves were generated from 1:3 serial dilution series of 100 pg/µl fungal DNA. The PCR conditions and detection limits are given in Table A3. Following amplification, melting curves were recorded from 55 °C to 95 °C with 0.5 °C increase per step and continuous fluorescence measurement.
2.4. Determination of Mycotoxins
Concentrations of mycotoxins 3-acetyl-deoxynivalenol (3-ADON), 15-acetyl-deoxynivalenol (15-ADON), diacetoxyscirpenol (DAS), deoxynivalenol (DON), enniatin A, enniatin A1, enniatin B, enniatin B1, fumonisin B1, fusaric acid, fusarin X, HT-2 toxin, nivalenol (NIV), T-2 toxin, and zearalenone (ZEN) as well as deoxynivalenol-3-glucoside (DON-3-glu), were determined in barley and wheat grain samples. Mycotoxins were extracted from 1 g finely ground dry material into 10 ml acetonitrile/water/acetic acid (84:15:1 (v/v/v)) by shaking at 170 rpm overnight.
The next day, samples were centrifuged for 10 min at 4750× g, 1 ml of the supernatant was transferred into a new 2 ml Eppendorf tube and evaporated using vacuum centrifugation. The dry extracts were stored at −20 °C until analysis. Water purified by an Arium pro ultrapure water system (Sartorius, Goettingen, Germany) and LC-MS grade methanol (Th. Geyer, Hoexter, Germany) were used in the following steps. Dried extracts were dissolved in 1 ml water/methanol (4:1 (v/v)), centrifuged for 10 min at 7380× g to remove undissolved residues and the supernatants were transferred to HPLC-vials.
Blank matrix samples of barley and wheat were spiked at the beginning of the extraction with a mixture of all monitored toxins to a final concentration of 300 µg/l to determine the recovery. Non-spiked blank matrix extracts were also analyzed, to ensure that the matrix was toxin-free.
An Agilent 1290 Infinity II HPLC system (Agilent Technologies, Waldbronn, Germany) coupled to an Agilent 6460 QQQ (Agilent Technologies, Waldbronn, Germany) was employed for mytoxin quantification. Separation was carried out using an Agilent Zorbax Eclipse C18 column with 1.8 µm particle size and 100 × 2.1 mm (Agilent Technologies, Waldbronn, Germany). A 10-point calibration ranging from 1.9 to 800 µg/l was used and after every 10th sample, a quality control standard to monitor the stability of the system and a blank were analyzed. The MS/MS transitions, the LC-gradient, limits of detection (LODs), limits of quantification (LOQs), and the recoveries are listed in the Supplementary File S1.
2.5. Statistical Analysis
Concentrations of fungal DNA below the LOQ but with positive melting curves were set to half of the LOQ [35]. Concentrations of mycotoxins below the LOQ and above the LOD were set to half the LOQ [35]. Mycotoxin concentrations below the LOD were set to zero. Only sites at which at least 10% of all sampling locations across both management systems reported values above the LOQ were statistically analyzed. Homoscedasticity (Levene’s test) and normality of distribution (Shapiro-Wilk test) were assessed for each parameter.
A comparison of fungal infection and mycotoxin level between agroforestry and monoculture systems was achieved by weighting the amounts of fungal DNA and mycotoxins determined at sampling locations within the agroforestry systems by the area of the sampling location and the crop yield for this area. By this procedure, weighted average fungal DNA concentrations and mycotoxin levels were obtained for each replicate plot of each agroforestry system. To assess the statistical significance of differences between agroforestry and monoculture systems, we applied linear mixed effect models. Our model assigned the management type (agroforestry versus monoculture system) as fixed effects and sites nested within a year as random effects. Log- or square-root-transformation of data were performed when normality of distribution or homoscedasticity were not met. In addition, t-tests were performed which yielded similar results. Here, we reported the results obtained from the linear mixed effect models. In cases when the management types within only one site and sampling date were compared, independent t-test or Mann-Whitney U test was conducted. Statistical significance was considered at p ≤ 0.05.
Unweighted fungal DNA concentrations or mycotoxin concentrations among sampling locations within each agroforestry system were compared using one-way analysis of variance (ANOVA) with Tukey’s honestly significant difference (HSD) test. When homoscedasticity or normality of distribution was not met, Kruskal-Wallis test with multiple comparison extension was used instead. Statistical significance was considered at p ≤ 0.05. All statistical analyses were performed in R version 3.4.3 [36]. The datasets of the pairwise comparison of agroforestry versus monoculture systems that were generated during this study are available in the BonaRes Data Centre repository, [https://doi.org/10.20387/BonaRes-XPWF-EY08].
3. Results
3.1. Occurrence and Abundance of Phytopathogenic Fungi
3.1.1. Oilseed Rape Plants
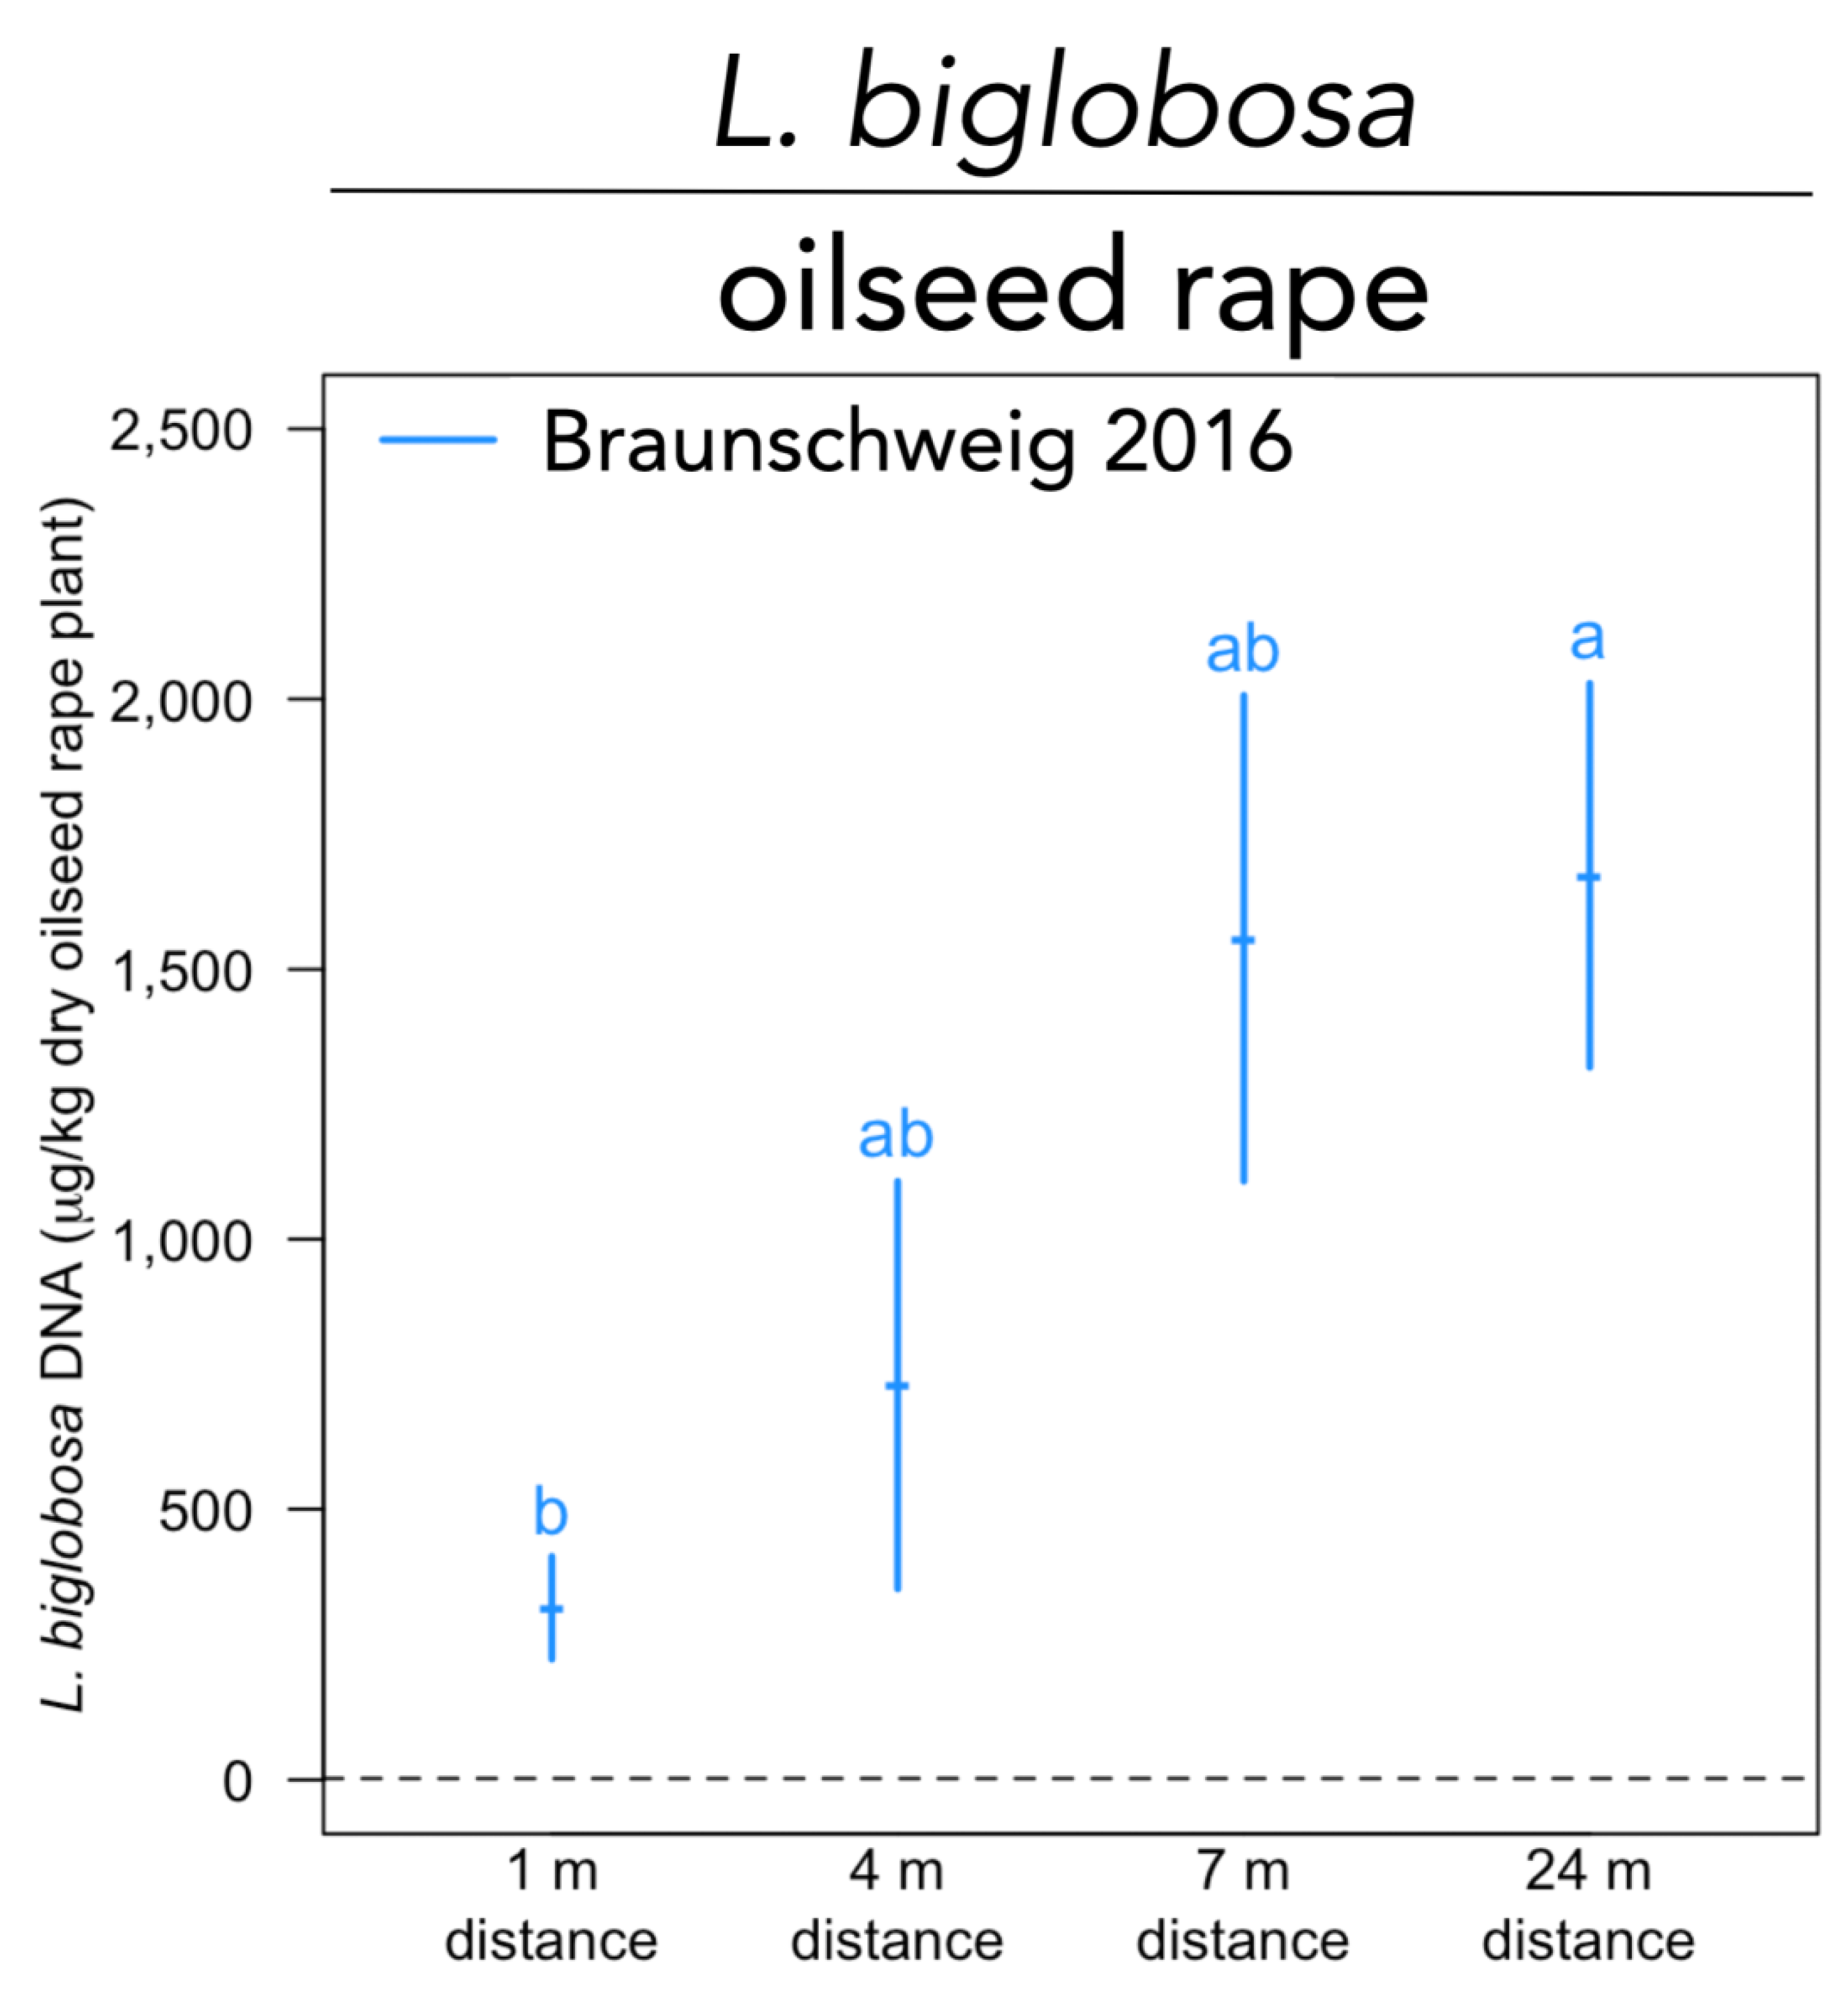
All investigated pathogens of oilseed rape (V. longisporum, L. biglobosa, L. maculans, and S. sclerotiorum) were detected at all three sites that grew oilseed rape, except for S. sclerotiorum. The latter pathogen was only detected in Braunschweig in 2016, which was the only site for which no data on oilseed rape plant yield are available. The abundance of V. longisporum was lower in the agroforestry compared to the monoculture systems (p = 0.008) (Figure 1A). No differences between the two management systems were found for L. maculans and L. biglobosa (Figure A2A,B). At different distances from the tree rows within the crop rows of the agroforestry systems, DNA concentrations of L. biglobosa increased from 1 m distance to 24 m distance to the tree row at Braunschweig in 2016 (p = 0.029) (Figure A3). No differences in the abundance of the other oilseed rape pathogens among samples collected at different distances from the tree row within the crop row were found at any other site and year.
3.1.2. Barley and Wheat Grain
F. tricinctum was the most abundant Fusarium species detected in both barley and wheat grain. The second most abundant species in both grains was F. graminearum. In barley, F. avenaceum was detected in nine out of 56 samples, and in wheat grain, in six out of 80 samples. No F. culmorum, F. poae, and F. proliferatum DNA were found in our samples. Higher abundance of F. tricinctum in barley grain was found in the agroforestry systems compared to monoculture systems (p = 0.001) (Figure 1C). In contrast, the abundance of F. tricinctum in wheat grain was lower in the agroforestry than monoculture systems (p = 0.021) (Figure 1B). The amount of F. tricinctum DNA in wheat grain was about 20 times higher than in barley (cf. Figure 1B,C). The abundance of F. avenaceum and F. graminearum was not affected by agroforestry practice (Figure A2C–E). No differences in the DNA concentration of any Fusarium species in barley or wheat at any site and year were observed at different distances from the tree rows within the crop rows of the agroforestry systems.
3.2. Mycotoxin Concentrations in Barley and Wheat Grain in Agroforestry versus Monoculture Systems
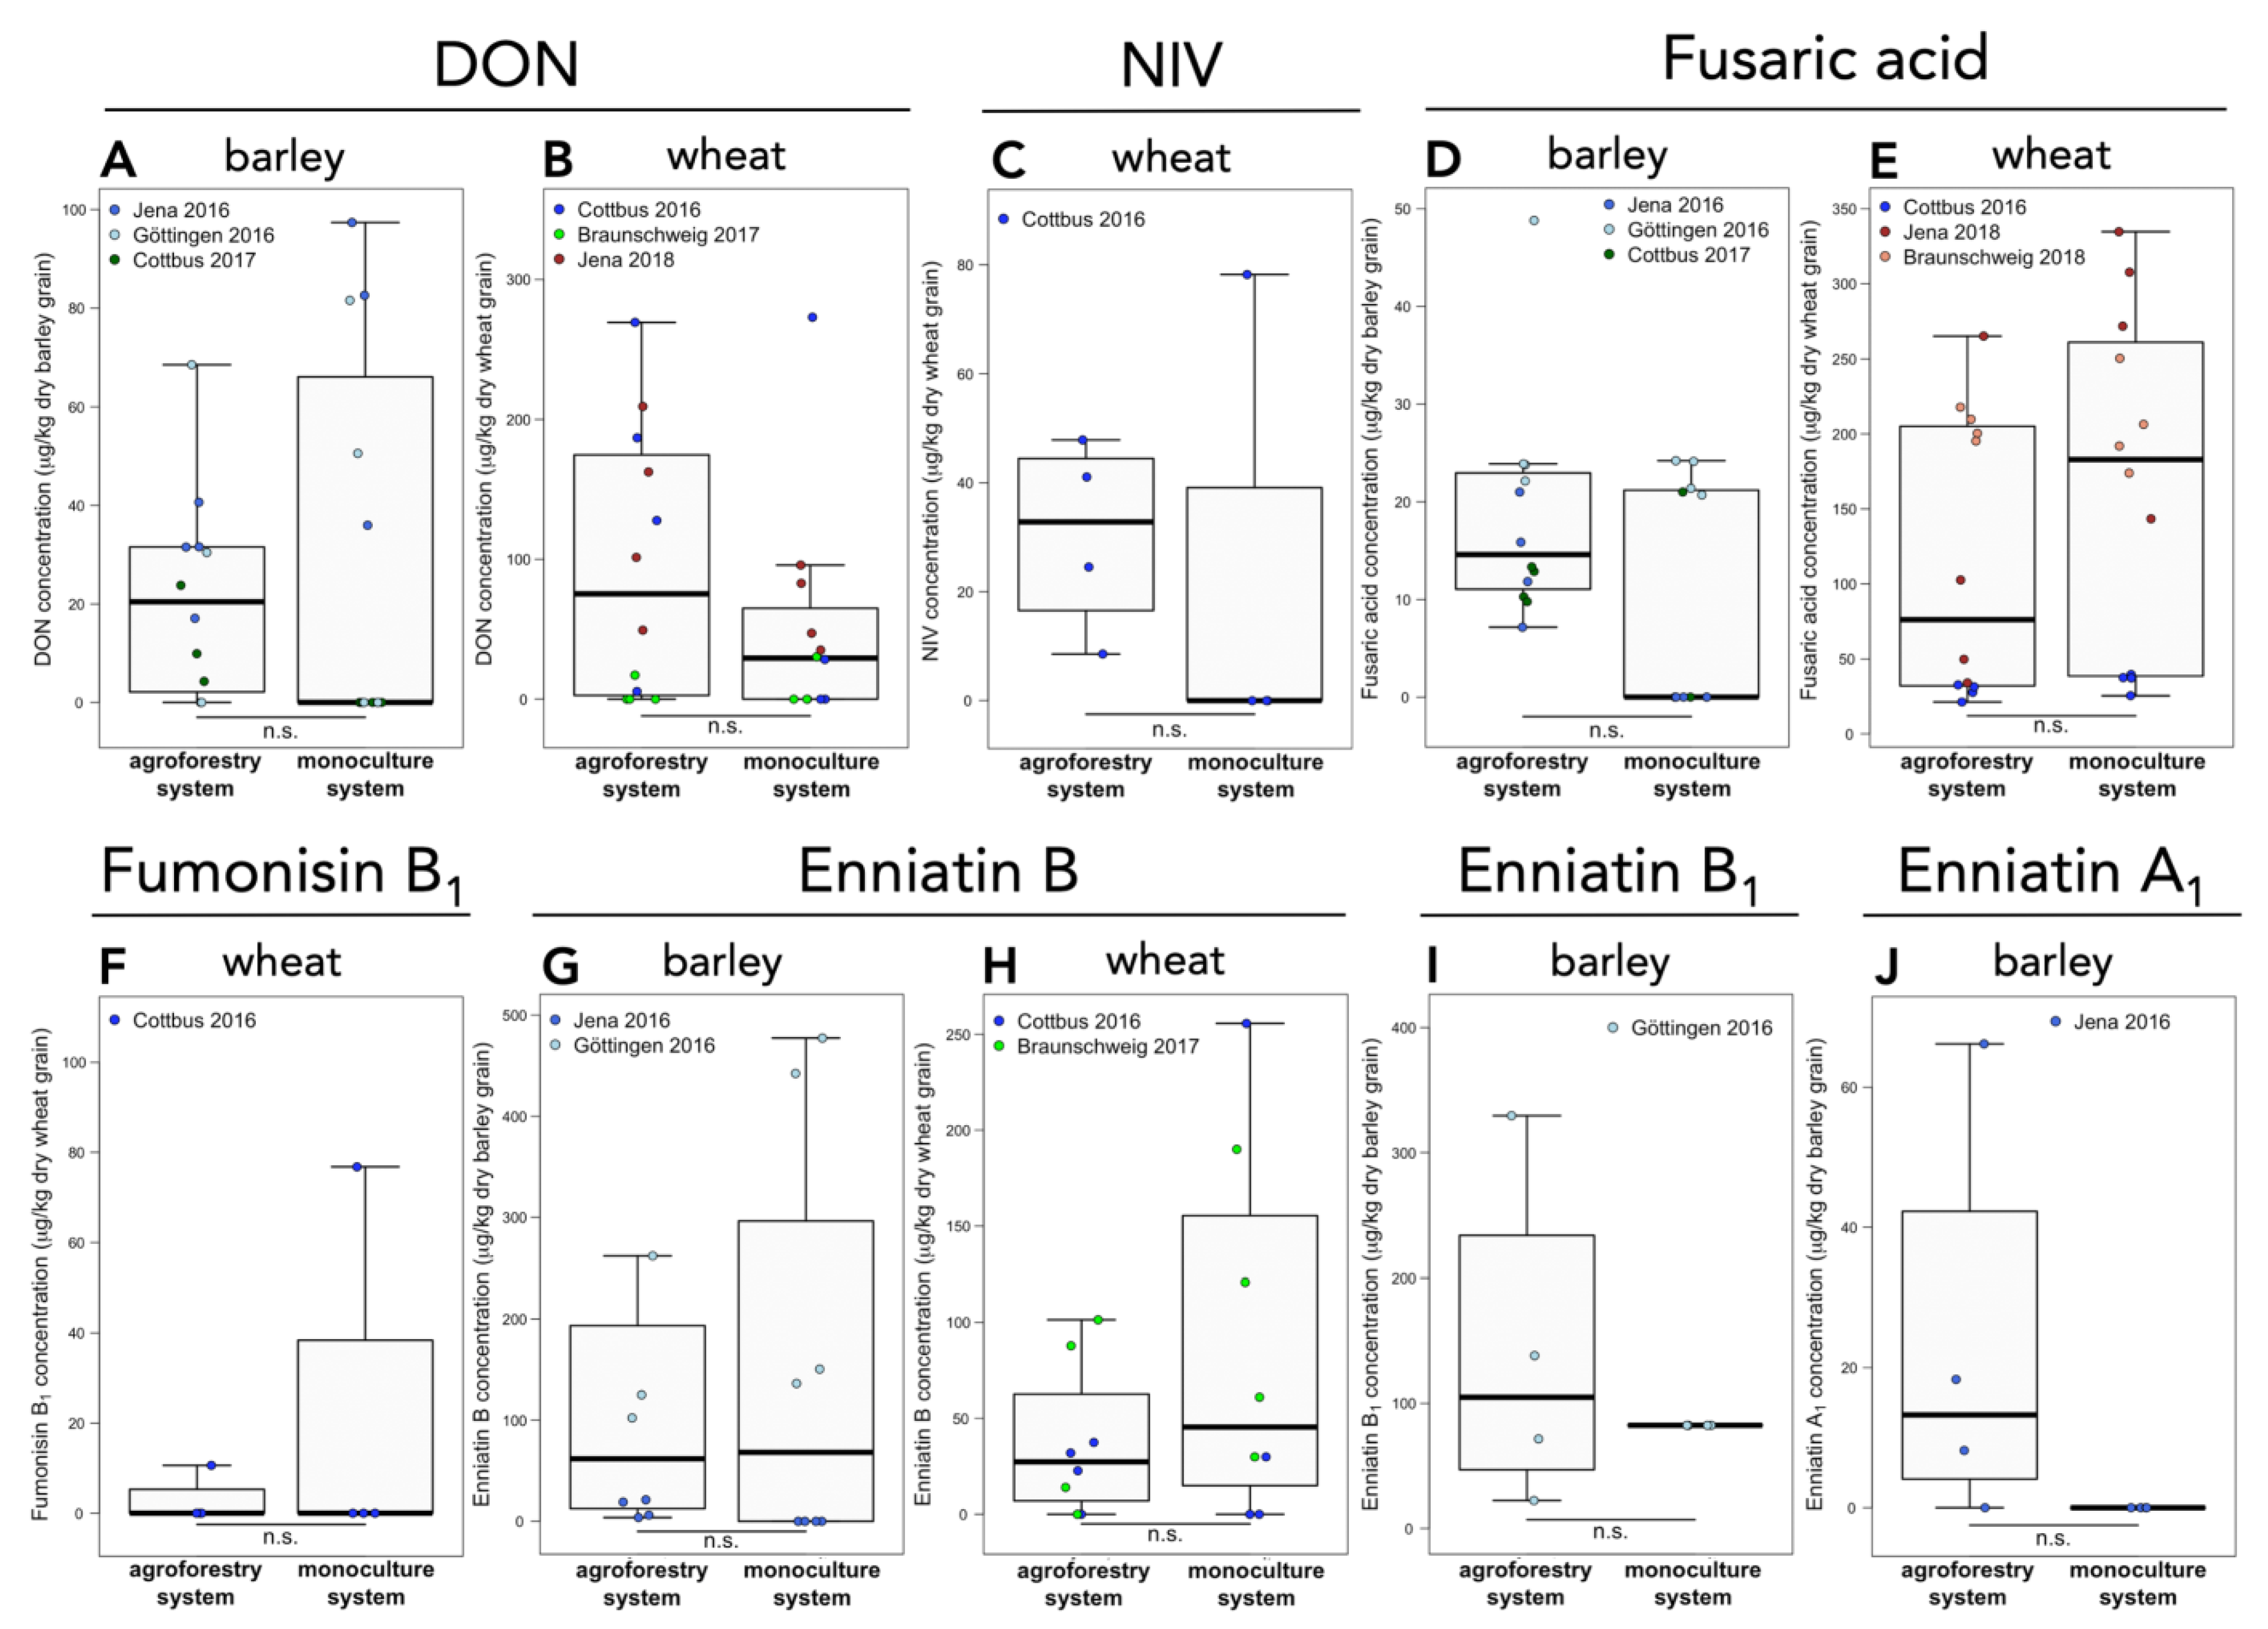
Mycotoxin levels were below the EU defined legal limits in all of our samples. DON was frequently observed in barley and wheat grain but agroforestry practice did not affect DON levels (Figure 2A,B). NIV was exclusively and consistently observed in wheat grain samples from Cottbus in 2016. At this site, no effect of agroforestry on NIV accumulation was observed (Figure 2C). Fusaric acid was detected at all sites, years, and crops, except for wheat grain samples from Braunschweig in 2017. Concentrations of fusaric acid in barley and wheat grain did not differ between the two management systems (Figure 2D,E). Fumonisin B1 was only detected in wheat at two sites (Cottbus in 2016 and Braunschweig in 2017). At each site, fumonisin B1 was found in two samples; fumonisin levels in Braunschweig in 2016 have not exceeded the LOQ. Compared to monocultural management, agroforestry did not influence the accumulation of fumonisin B1 in wheat grain (Figure 2F). Enniatin B was found more frequently and in higher concentrations than enniatin B1 in both barley and wheat grain, whereby the amounts of enniatin B1 in wheat grain were always below LOQ. Compared to the monocultural management system, no effect of agroforestry on enniatin B and enniatin B1 accumulation in barley and wheat grain was found (Figure 2G–I). Enniatin A and enniatin A1 were exclusively found at one site in barley grain (Göttingen in 2016), whereby enniatin A was only detected in a single sample at a level below LOQ. For enniatin A1, no difference between agroforestry and monoculture system was detected (Figure 2J). 3-ADON, 15-ADON, DON-3-glu, DAS, fusarin X, T-2, and ZEN were not detected in our samples. HT-2 was found only in two samples below LOQ.
Within each agroforestry system and year, no differences in mycotoxin concentrations in wheat grain among the different distances to the tree row were detected. In barley grain at Jena in 2016, DON concentrations were lower at 1 m distance than 24 m distance to the tree row (p = 0.023) (Figure 3A). Fusaric acid concentrations in barley grain at Jena in 2016 were higher at 24 m distance compared to 4 (p = 0.046) (Figure 3B) and 7 m distance from the tree row (p = 0.029) (Figure 3B). No further differences in mycotoxin concentrations among the different distances from the tree row within each agroforestry system were found at any other site and year.
4. Discussion
Agricultural systems are shaped by interactions of numerous abiotic and biotic factors. Similarly, colonization of crops by plant pathogenic fungi and accumulation of mycotoxins in cereal grains is influenced by environmental factors. The integration of trees into agricultural systems represents a new factor that may affect crop health and mycotoxin contamination.
In German agroforestry systems with short-rotation poplar trees in particular, recent studies have shown that winter wheat yields were either positively affected or not substantially affected by agroforestry [6,26]. Long-term yields of oilseed rape were not substantially reduced under agroforestry practice [6]. For both crops, however, yield depression was observed close to the interface between the trees and crops, presumably caused by competition for resources [6,26]. Apart from reducing yield, competition for water, nutrients, and light is likely to affect crop health [11,24]. For instance, coverage of seedlings by leaf litter derived from the trees may suppress seedling development [37], particularly for winter crops. Other factors that may influence the susceptibility of crops to fungal pathogens include altered microclimatic conditions (temperature, humidity, wind, evaporation) [25,26,27], soil microbial communities [38,39,40,41], and the dilution of the host crop by the trees.
4.1. Suppression of V. Longisporum in Oilseed Rape under Agroforestry
Our results indicate that V. longisporum in oilseed rape plants was suppressed in agroforestry compared to monoculture systems (Figure 1A). Verticillium affiliates are soil-borne fungal pathogens with a cosmopolitan distribution which cause vascular plant diseases [42]. V. longisporum is widely spread in Europe, causing premature senescence of oilseed rape and leading to significant economic losses [43]. Despite crop rotation, V. longisporum poses a major threat to oilseed rape cultivation, as microsclerotia of the pathogen can survive for over 10 years in soil [44]. Their germination is stimulated by root exudates from the host, resulting in hyphal growth towards the host root [45]. A recent study on oilseed rape and V. longisporum showed that drought had no impact on disease severity [46]. Thus, abiotic stress might not be among the factors determining the extent of V. longisporum-induced vascular disease in oilseed rape.
Microbial antagonism may contribute to the suppression of V. longisporum under agroforestry management. Pseudomonas species have been shown to suppress the viability of V. longisporum microsclerotia in vitro [47]. Similarly, bacterial isolates that can colonize the rhizosphere of oilseed rape like Burkholderia cepacia, Flavobacterium indologenes, P. chlororaphis, Serrana rubidaea, and Serratia plymuthica have been described as antagonists of V. longisporum [48,49]. A recent study investigating soil bacterial communities in temperate alley cropping systems reported alterations of the community structure in response to agroforestry practices [39]. Furthermore, diversification of soil microbial communities under agroforestry is likely to occur [38,40,41]. Soil microbial diversification as well as increasing plant diversity is believed to suppress soil-borne pathogens through enhanced microbial antagonism [50,51]. Therefore, we hypothesize that belowground diversification in agroforestry systems enhances the suppression of soil-borne pathogen V. longisporum.
4.2. Effect of Agroforestry on L. Maculans and L. Biglobosa in Oilseed Rape
Our results suggest that agroforestry systems do not affect the abundance of L. maculans and L. biglobosa in oilseed rape as compared to monoculture systems (Figure A2A,B). L. maculans and L. biglobosa cause blackleg disease in oilseed rape, though L. biglobosa is considered weakly aggressive [52]. Symptoms of blackleg include premature senescence, lodging of the plant and even seed loss [53], making it an economically important disease in the production of oilseed rape. Similar to the antagonists of V. longisporum, different microorganisms such as Bacillus species, Gliocladium catenulatum, and Serratia plymuthica were identified as antagonists acting against blackleg disease in oilseed rape [54,55]. Both Leptosphaeria species can co-occur on the same plant and spread via splash-dispersal of inoculum or wind-dispersal of ascospores [56,57]. Although our data did not reveal differences between agroforestry and monoculture systems for the investigated Leptosphaeria species, it is reasonable to assume that reduced wind speed [27] and the physical barrier of the trees (host dilution effect) may reduce the extent to which splash-dispersed pathogens spread. This assumption is supported by the lower abundance of L. biglobosa closer to the tree row within one of our investigated agroforestry systems in 2016 (Braunschweig) (Figure A3).
4.3. Effect of Agroforestry on F. Tricinctum in Barley and Wheat Grain
Our data suggests a higher susceptibility of barley to F. tricinctum in agroforestry as compared to monoculture systems (Figure 1C), whereas the opposite applies to wheat (Figure 1B). However, although quantities of F. tricinctum DNA in barley grain were higher in agroforestry than monoculture systems, DNA concentrations of F. tricinctum in agroforestry systems were negligibly low (<15 μg kg−1; on average about 20-times lower than in wheat grain) (cf. Figure 1B,C). We assume that the low colonization of barley with F. tricinctum under agroforestry does not exert a substantial impact on crop health and mycotoxin contamination.
F. tricinctum is frequently recovered from wheat grain and can be regarded as one of major Fusarium species causing Fusarium head blight of wheat [58,59,60,61]. Strains of F. tricinctum have been shown to produce enniatins, fusarin C, and moniliformin [62,63,64].
Similar to V. longisporum in oilseed rape, the suppression of F. tricinctum in wheat grain under agroforestry may have been caused by microbial antagonism. For example, a recent study proved the antagonistic effects of isolates of the bacterial genera Bacillus and Sphingomonas against F. tricinctum [65]. Inhibition of other Fusarium species like F. graminearum by microbial antagonists has been frequently reported [66,67,68], particularly by Bacillus affiliates [69]. Microbial antagonism has repeatedly been reported to amplify with agricultural diversification [21,22,23,50,70]. Similarly, a recent study from central Sweden found that the abundance of F. tricinctum in winter wheat kernels was positively linked to increasing agricultural intensification [59]. Therefore, enhanced microbiological control of F. tricinctum in wheat grain due to diversification may occur under agroforestry practice. Additionally, altered microclimatic conditions may suppress infection of wheat with F. tricinctum in agroforestry systems.
Our results further revealed that within each agroforestry system and year, the abundance of investigated Fusarium species in barley and wheat grain was not affected by the distance from the tree row, although yield depressions due to resource competition close to the tree rows are well known [6,26]. Therefore, competition for resources at the interface of crops and trees in temperate agroforestry systems does not seem to affect the abundance of Fusarium species in barley and wheat grain. It is conceivable that, although yield depressions occur, negative effects of resource competition may be compensated by an enhanced microclimate and antagonism at the crop-tree interface.
4.4. Mycotoxin Accumulation in Barley and Wheat Grain
Over our three-year sampling period (2016 to 2018), temperate agroforestry systems did not affect the accumulation of DON, 3-ADON, 15-ADON, DON-3-glu, DAS, fusarin X, fumonisin B1, NIV, ZEN, T-2, HT-2, fusaric acid, enniatin A, enniatin A1, enniatin B, and enniatin B1 in barley and wheat grain compared to monoculture systems (Figure 2). However, within one of our agroforestry systems (Jena in 2016), the distance from the tree row influenced the concentration of DON and fusaric acid in barley grain (Figure 3A,B). Since this is the first study investigating mycotoxins in cereal grain in temperate agroforestry versus monoculture systems, no comparison can be drawn with other studies.
The production of DON by Fusarium species (mainly F. graminearum and F. culmorum) has been shown to be dependent on temperature, whereby optimum temperatures were found to be species-dependent [71,72,73,74]. Furthermore, temperature cycles of certain ranges and durations can significantly affect DON production by F. graminearum [75]. Likewise, particularly in interaction with temperature, water activity is an important environmental factor determining DON production by F. culmorum and graminearum [71,72,73]. Thus, the lower concentrations of DON in barley grain at 1 m distance from the tree row within the crop row compared to the center of the crop row (24 m distance from the tree row) in the agroforestry at Jena in 2016 (Figure 3A) may have resulted from altered microclimatic conditions in the vicinity of the trees, particularly during anthesis. Fusaric acid is a fungal metabolite produced by a broad spectrum of Fusarium species and has repeatedly been reported in barley grain [76,77,78]. Fusaric acid shows pharmacological activity [79] and synergetic toxic effects in co-occurrence with other mycotoxins like fumonisin B1 [80] and DON as well as other trichothecenes [81,82]. Studies on mammals (swine and rats) revealed that fusaric acid exhibits neurotoxic effects [83,84]. While the toxicity of fusaric acid to mammals is low [85], its strong phytotoxicity was already described in 1934 [86]. Furthermore, fusaric acid acts as a virulence factor for F. oxysporum [87,88], a soil-borne plant pathogenic fungus that causes vascular diseases. In the 1980s, efforts were undertaken to select for fusaric resistance in barley [77]. Despite this, there is a lack of studies investigating the effect of controlling environmental factors (e.g., temperature and water activity) on fusaric acid production. We assume that if, similar to other Fusarium mycotoxins, the production of fusaric acid is affected by temperature and water activity, altered microclimatic conditions may be responsible for the lower fusaric acid accumulation in barley grain close the tree row (at 4 and 7 m distance) compared to the center of the crop row (24 m distance from the tree row) at Jena in 2016 (Figure 3B).
Fumonisins are mycotoxins known from mainly maize and asparagus. Recently, fumonisins have been detected in wheat in South Europe [89] and artificial seed-borne infection of wheat with F. proliferatum was demonstrated to lead to fumonisin accumulation in grains [90]. In our study, fumonisins in wheat grain were detected for the first time in Northern Europe. Despite the low levels of fumonisin B1 observed, the occurrence of this mycotoxin in wheat grains harvested at two locations in two years indicates a potential new threat to food safety. Therefore, we suggest that fumonisins be included in routine monitoring programs of wheat grain for mycotoxin contamination.
5. Conclusions
Compared to monoculture cropland, production of oilseed rape, wheat, and barley in temperate agroforestry does not pose an increased risk to plant health or food safety. The results of our three-year study indicate that temperate agroforestry may suppress V. longisporum infection of oilseed rape and F. tricinctum colonization of wheat grain but further studies are needed to confirm these effects. It can further be concluded that temperate agroforestry systems with barley or wheat pose no risk of increased mycotoxin contamination and therefore represent an alternative to monoculture agriculture which maintains food safety.
Supplementary Materials
Supplementary File S1 are available online at https://www.mdpi.com/2071-1050/11/10/2925/s1.
Author Contributions
Conceptualization, L.B. and P.K.; methodology, LB., A.R., and P.K.; validation, L.B., A.R., and P.K.; formal analysis, L.B.; investigation, L.B., E.L., and A.R.; resources, P.K.; data curation, L.B., E.L., and A.R.; writing—original draft preparation, L.B.; writing—review and editing, E.L., A.R., and P.K.; visualization, L.B.; supervision, P.K.; project administration, P.K.; funding acquisition, L.B. and P.K.
Funding
This study was financed by the German Federal Ministry of Education and Research (BMBF) in the framework of the Bonares-SIGNAL project (funding codes: 031A562A and 031B0510A).
Acknowledgments
We acknowledge support by the German Research Foundation and the Open Access Publication Funds of the University of Goettingen. We would like to thank Andrea Biertümpfel, Christian Böhm, Leonie Göbel, Michael Kanzler, Carolin Rudolf, Marcus Schmidt, and the working group of Anita Swieter for the harvest and crop yield assessment at our study sites. The authors would further like to thank Jonas Watterott and Heike Rollwage for participating in the laboratory work. We acknowledge support by the Open Access Publication Funds of the Göttingen University.
Conflicts of Interest
The authors declare no conflict of interest. The funders had no role in the design of the study; in the collection, analyses, or interpretation of data; in the writing of the manuscript, or in the decision to publish the results.
Appendix A
Figure A1.
Map of the study sites in Germany and schematic illustration of the experimental design. Borders of federal states are represented by black lines. Dots represent study sites.
Figure A1.
Map of the study sites in Germany and schematic illustration of the experimental design. Borders of federal states are represented by black lines. Dots represent study sites.


Table A1.
Mastermix composition for real-time PCR assays.
| Target Organism | Final MgCl2 Concentration (mM) | Concentration of Each Primer (µM) | Concentration of Each dNTP1 (µM) | Choice of DNA Polymerase2 | Choice of Reaction Buffer2 |
|---|---|---|---|---|---|
| Fusarium avenaceum | 2.5 | 0.4 | 100 | Hot Start Taq | Standard Taq |
| Fusarium culmorum | 4.0 | 0.3 | 200 | Taq | ThermoPol® |
| Fusarium graminearum | 2.5 | 0.3 | 200 | Hot Start Taq | Standard Taq |
| Fusarium poae | 2.0 | 0.3 | 100 | Taq | ThermoPol® |
| Fusarium proliferatum | 2.0 | 0.3 | 125 | Taq | ThermoPol® |
| Fusarium tricinctum | 2.5 | 0.4 | 100 | Hot Start Taq | Standard Taq |
| Leptosphaeria maculans | 2.0 | 0.3 | 100 | Taq | ThermoPol® |
| Leptosphaeria biglobosa | 2.0 | 0.3 | 100 | Taq | ThermoPol® |
| Sclerotinia sclerotiorum | 2.0 | 0.3 | 100 | Taq | ThermoPol® |
| Verticillium longisporum | 3.0 | 0.3 | 200 | Taq | ThermoPol® |
1 deoxyribonucleoside, 2 purchased from New England Biolabs, Beverly, Massachusetts, USA; ThermoPol® reaction buffer (20 mM Tris-HCl, 10 mM (NH4)2SO4, 10 mM KCl, 2 mM MgSO4, 0.1% Triton® X-100, pH 8.8 at 25 °C); Standard Taq reaction buffer (10 mM Tris-HCl, 50 mM KCl, 1.5 mM MgCl2, pH 8.3 at 25 °C).
Table A2.
Primer, primer sequences and product size of the different real-time PCR assays.
| Target Organism | Primer Pair | Primer Sequence (5’-3’) | Product Size (bp) | Reference |
|---|---|---|---|---|
| Fusarium avenaceum | JIAf | GCTAATTCTTAACTTACTAGGGGCC | 220 | [91] |
| JIAr | CTGTAATAGGTTATTTACATGGGCG | |||
| Fusarium culmorum | OPT18 F | GATGCCAGACCAAGACGAAG | 472 | [92] |
| OPT18 R | GATGCCAGACGCACTAAGAT | |||
| Fusarium graminearum | Fg16N F | ACAGATGACAAGATTCAGGCACA | 280 | [93] |
| Fg16N R | TTCTTTGACATCTGTTCAACCCA | |||
| Fusarium poae | Fp82F | CAAGCAAACAGGCTCTTCACC | 220 | [94] |
| Fp82R | TGTTCCACCTCAGTGACAGGTT | |||
| Fusarium proliferatum | Fp3-F | CGGCCACCAGAGGATGTG | 230 | [95] |
| Fp4-R | CAACACGAATCGCTTCCTGAC | |||
| Fusarium tricinctum | Tri1 | CGTGTCCCTCTGTACAGCTTTGA | 215 | [96] |
| Tri1 | GTGGTTACCTCCCGATACTCTA | |||
| Leptosphaeria maculans | LmacF | CTTGCCCACCAATTGGATCCCCTA | 331 | [97] |
| LmacR | GCAAAATGTGCTGCGCTCCAGG | |||
| Leptosphaeria biglobosa | LbigF | ATCAGGGGATTGGTGTCAGCAGTTGA | 444 | [97] |
| LmacR | GCAAAATGTGCTGCGCTCCAGG | |||
| Sclerotinia sclerotiorum | SsF | AGTCGAGGGACGGGTACTAA | 225 | [98] |
| SsR | CTTGTCCTCATTGCCGTTT | |||
| Verticillium longisporum | OLG 70 | CAGCGAAACGCGATATGTAG | 261 | [99] |
| OLG 71 | GGCTTGTAGGGGGTTTAGA |
Table A3.
Real-time PCR conditions and detection limit of the different assays.
| Target Organism | Initial Denaturation | Denaturation | Annealing | Extension | No. of Cycles | Limit of Quantification (g DNA µL−1 Template) |
|---|---|---|---|---|---|---|
| Fusarium avenaceum | 95 °C, 120 s | 94 °C, 15 s | 60 °C, 15 s | 68 °C, 25 s | 38 | 1.24 × 10⁻¹² |
| Fusarium culmorum | 95 °C, 120 s | 94 °C, 20 s | 62 °C, 40 s | 68 °C, 45 s | 35 | 1.24 × 10⁻¹² |
| Fusarium graminearum | 95 °C, 120 s | 94 °C, 30 s | 61 °C, 30 s | 68 °C, 30 s | 35 | 1.37 × 10⁻¹³ |
| Fusarium poae | 95 °C, 120 s | 94 °C, 30 s | 62.5 °C, 30 s | 68 °C, 35 s | 35 | 1.37 × 10⁻¹³ |
| Fusarium proliferatum | 95 °C, 120 s | 94 °C, 35 s | 64 °C, 30 s | 68 °C, 35 s | 35 | 1.37 × 10⁻¹³ |
| Fusarium tricinctum | 95 °C, 120 s | 94 °C, 20 s | 65 °C, 20 s | 68 °C, 18 s | 38 | 1.52 × 10⁻¹⁴ |
| Leptosphaeria biglobosa | 95 °C, 120 s | 94 °C, 30 s | 68 °C, 35 s1 | 40 | 1.52 × 10⁻¹⁴ | |
| Leptosphaeria maculans | 95 °C, 120 s | 94 °C, 30 s | 68 °C, 35 s1 | 40 | 4.57 × 10⁻¹⁴ | |
| Sclerotinia sclerotiorum | 95 °C, 120 s | 94 °C, 30 s | 56 °C, 30 s | 68 °C, 20 s | 40 | 4.57 × 10⁻¹⁴ |
| Verticillium longisporum | 95 °C, 120 s | 94 °C, 10 s | 60 °C, 15 s | 68 °C, 15 s | 40 | 1.52 × 10⁻¹⁴ |
1 performed as a two-step PCR.
Figure A2.
Abundance of (A) Leptosphaeria biglobosa and (B) L. maculans in oilseed rape plants, (C) Fusarium avenaceum in barley grain, and F. graminearum in (D) barley and (E) wheat grain of temperate agroforestry and monoculture systems. n = 4 replicate plots per management system and study site and year. Fungal DNA concentration of each replicate plot in the agroforestry systems are obtained from three (Göttingen) or four (Jena, Cottbus, and Braunschweig) sampling locations within the crop rows of the agroforestry systems and are weighted averages by area and yield. Dashed lines represent the limit of quantification (LOQ) of the respective real-time PCR assay. Samples below the LOQ were assigned to half the LOQ. n.s. indicates no significant differences between agroforestry and monoculture systems.
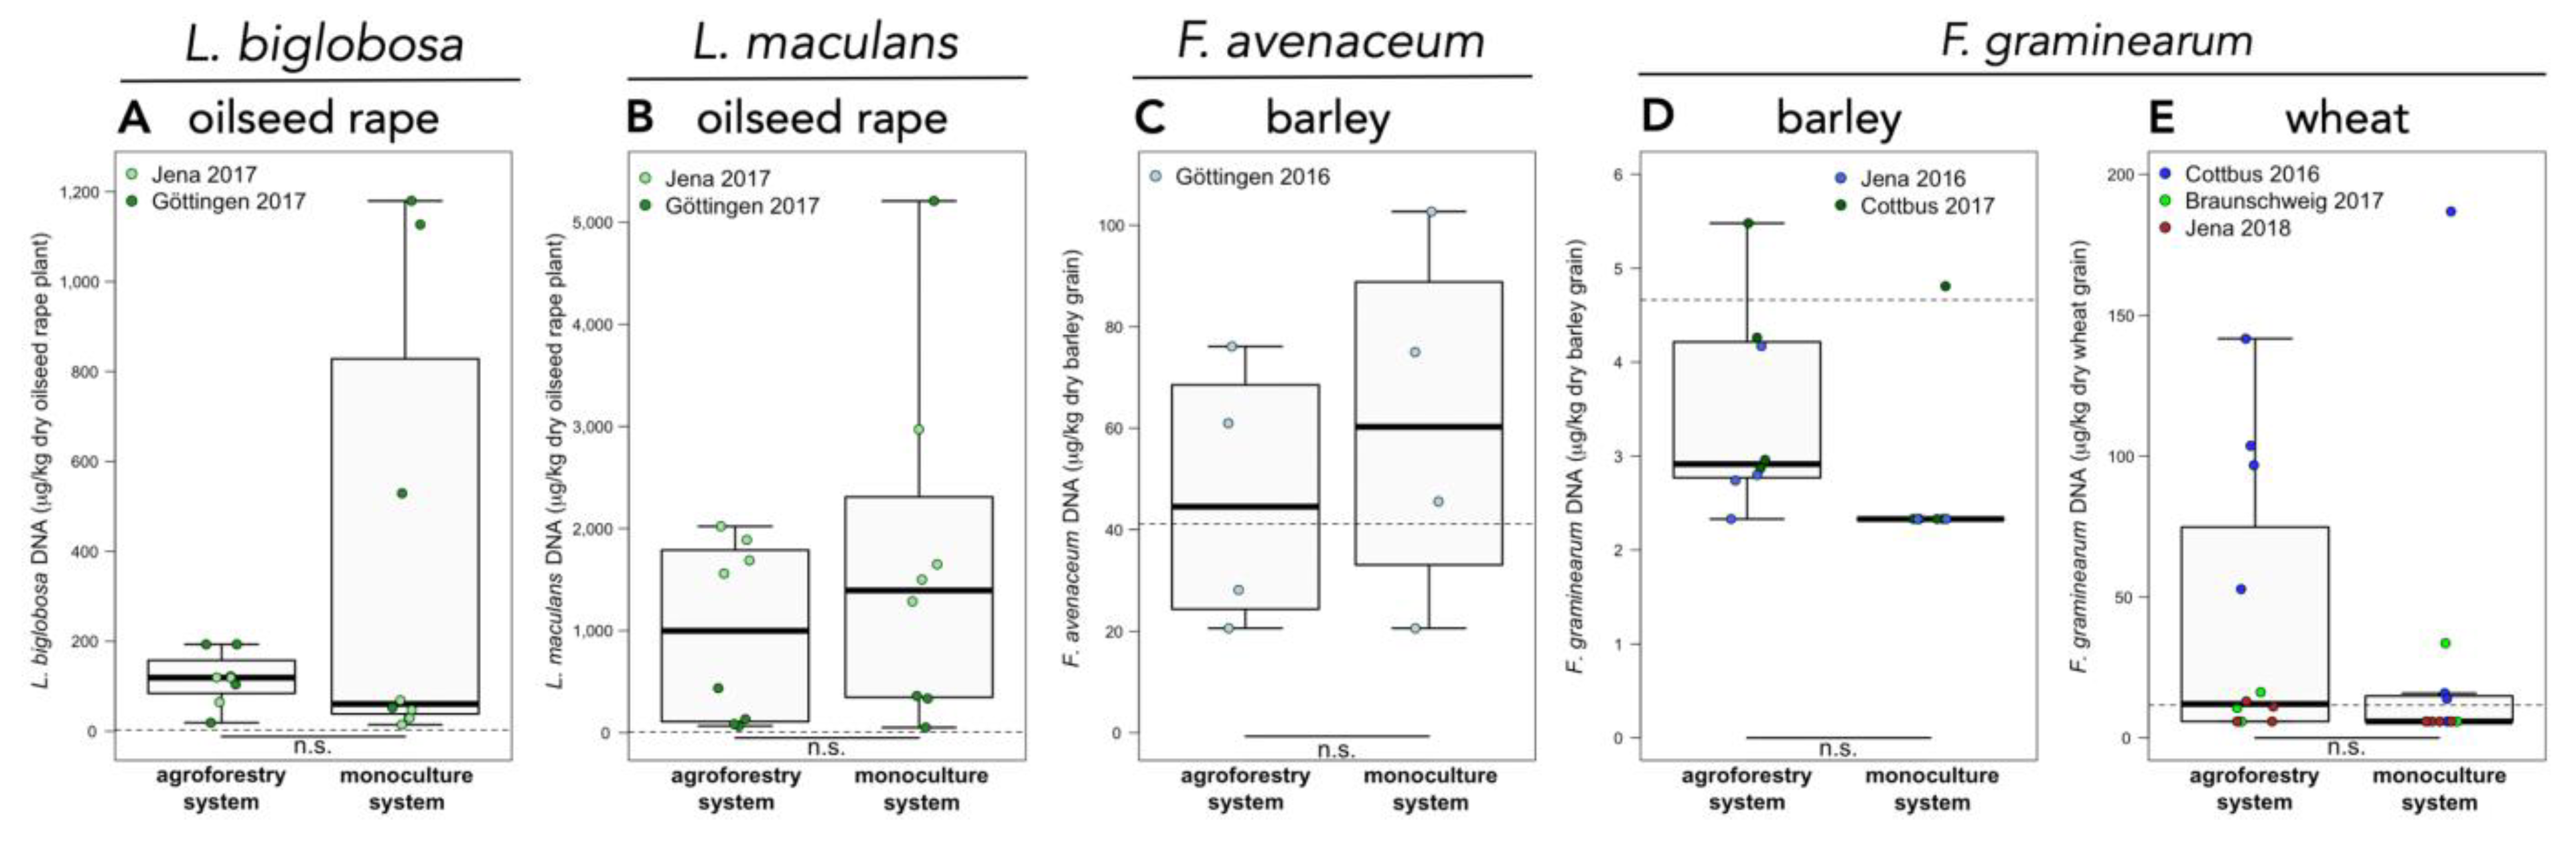
Figure A3.
Abundance of Leptosphaeria biglobosa in barley grain samples within the temperate agroforestry system at Braunschweig in 2016. Medians with standard error (n = 4 per replicate plot). Dashed lines represent the limit of quantification. Distances (1 m, 4 m, 7 m, and 24 m) are distances from the tree row within the crop row of the agroforestry system. Different lowercase letters indicate significant differences among distances from the tree row within the crop row of the agroforestry system (Kruskal-Wallis test with multiple comparison extension at p ≤ 0.05).

References
- Kay, S.; Crous-Duran, J.; Ferreiro-Domínguez, N.; García de Jalón, S.; Graves, A.; Moreno, G.; Mosquera-Losada, M.R.; Palma, J.H.N.; Roces-Díaz, J.V.; Santiago-Freijanes, J.J.; et al. Spatial similarities between European agroforestry systems and ecosystem services at the landscape scale. Agrofor. Syst. 2018, 92, 1075–1089. [Google Scholar] [CrossRef]
- Pardon, P.; Reubens, B.; Reheul, D.; Mertens, J.; De Frenne, P.; Coussement, T.; Janssens, P.; Verheyen, K. Trees increase soil organic carbon and nutrient availability in temperate agroforestry systems. Agric. Ecosyst. Environ. 2017, 247, 98–111. [Google Scholar] [CrossRef]
- Smith, J.; Pearce, B.D.; Wolfe, M.S. Reconciling productivity with protection of the environment: Is temperate agroforestry the answer? Renew. Agric. Food Syst. 2013, 28, 80–92. [Google Scholar] [CrossRef]
- Allen, S.C.; Jose, S.; Nair, P.K.R.; Brecke, B.J.; Nkedi-Kizza, P.; Ramsey, C.L. Safety-net role of tree roots: Evidence from a pecan (Carya illinoensis K. Koch)–cotton (Gossypium hirsutum L.) alley cropping system in the southern United States. For. Ecol. Manag. 2004, 192, 395–407. [Google Scholar] [CrossRef]
- Wang, Y.; Zhang, B.; Lin, L.; Zepp, H. Agroforestry system reduces subsurface lateral flow and nitrate loss in Jiangxi Province, China. Agric. Ecosyst. Environ. 2011, 140, 441–453. [Google Scholar] [CrossRef]
- Swieter, A.; Langhof, M.; Lamerre, J.; Greef, J.M. Long-term yields of oilseed rape and winter wheat in a short rotation alley cropping agroforestry system. Agrofor. Syst. 2018, 92, 1–12. [Google Scholar] [CrossRef]
- Pardon, P.; Reubens, B.; Mertens, J.; Verheyen, K.; De Frenne, P.; De Smet, G.; Van Waes, C.; Reheul, D. Effects of temperate agroforestry on yield and quality of different arable intercrops. Agric. Syst. 2018, 166, 135–151. [Google Scholar] [CrossRef]
- Savary, S.; Ficke, A.; Aubertot, J.N.; Hollier, C. Crop losses due to diseases and their implications for global food production losses and food security. Food Secur. 2012, 4, 519–537. [Google Scholar] [CrossRef]
- Oerke, E.C. Crop losses to pests. J. Agric. Sci. 2006, 144, 31–43. [Google Scholar] [CrossRef]
- Hiddink, G.A.; Termorshuizen, A.J.; van Bruggen, A.H.C. Mixed Cropping and Suppression of Soilborne Diseases. In Genetic Engineering, Biofertilisation, Soil Quality and Organic Farming; Lichtfouse, E., Ed.; Sustainable Agriculture Reviews; Springer Netherlands: Dordrecht, The Netherlands, 2010; pp. 119–146. [Google Scholar]
- Krupinsky, J.M.; Bailey, K.L.; McMullen, M.P.; Gossen, B.D.; Turkington, T.K. Managing Plant Disease Risk in Diversified Cropping Systems. Agron. J. 2002, 94, 198–209. [Google Scholar] [CrossRef]
- Lin, B.B. Resilience in Agriculture through Crop Diversification: Adaptive Management for Environmental Change. BioScience 2011, 61, 183–193. [Google Scholar] [CrossRef] [Green Version]
- Ratnadass, A.; Fernandes, P.; Avelino, J.; Habib, R. Plant species diversity for sustainable management of crop pests and diseases in agroecosystems: A review. Agron. Sustain. Dev. 2012, 32, 273–303. [Google Scholar] [CrossRef]
- Wolfe, M.S.; Brändle, U.; Koller, B.; Limpert, E.; McDermott, J.M.; Müller, K.; Schaffner, D. Barley mildew in Europe: Population biology and host resistance. Euphytica 1992, 63, 125–139. [Google Scholar] [CrossRef]
- Finckh, M.R.; Mundt, C.C. Stripe rust, yield, and plant competition in wheat cultivar mixtures. Phytopathology 1992, 89, 905–913. [Google Scholar] [CrossRef]
- Zhu, Y.; Chen, H.; Fan, J.; Wang, Y.; Li, Y.; Chen, J.; Fan, J.; Yang, S.; Hu, L.; Leung, H.; et al. Genetic diversity and disease control in rice. Nature 2000, 406, 718–722. [Google Scholar] [CrossRef]
- Curl, E.A. Control of plant diseases by crop rotation. Bot. Rev. 1963, 29, 413–479. [Google Scholar] [CrossRef]
- Zogg, H. Crop rotation and biological soil desinfection. Qual. Plant. Mater. Veg. 1969, 18, 256–273. [Google Scholar] [CrossRef]
- Boudreau, M.A. Diseases in intercropping systems. Ann. Rev. Phytopathol. 2013, 51, 499–519. [Google Scholar] [CrossRef]
- Trenbath, B.R. Intercropping for the management of pests and diseases. Field Crop. Res. 1993, 34, 381–405. [Google Scholar] [CrossRef]
- Raaijmakers, J.M.; Paulitz, T.C.; Steinberg, C.; Alabouvette, C.; Moënne-Loccoz, Y. The rhizosphere: A playground and battlefield for soilborne pathogens and beneficial microorganisms. Plant Soil 2009, 321, 341–361. [Google Scholar] [CrossRef]
- Selosse, M.A.; Baudoin, E.; Vandenkoornhuyse, P. Symbiotic microorganisms, a key for ecological success and protection of plants. C. R. Biol. 2004, 327, 639–648. [Google Scholar] [CrossRef]
- Weller, D.M.; Raaijmakers, J.M.; McSpadden Gardener, B.B.; Thomashow, L.S. Microbial populations responsible for specific soil suppressiveness to plant pathogens. Ann. Rev. Phytopathol. 2002, 40, 309–348. [Google Scholar] [CrossRef]
- Dordas, C. Role of nutrients in controlling plant diseases in sustainable agriculture. A review. Agron. Sustain. Dev. 2008, 28, 33–46. [Google Scholar] [CrossRef] [Green Version]
- Jose, S.; Gillespie, A.R.; Pallardy, S.G. Interspecific interactions in temperate agroforestry. Agrofor. Syst. 2004, 61, 237–255. [Google Scholar]
- Kanzler, M.; Böhm, C.; Mirck, J.; Schmitt, D.; Veste, M. Microclimate effects on evaporation and winter wheat (Triticum aestivum L.) yield within a temperate agroforestry system. Agrofor. Syst. 2018, 92. [Google Scholar] [CrossRef]
- Böhm, C.; Kanzler, M.; Freese, D. Wind speed reductions as influenced by woody hedgerows grown for biomass in short rotation alley cropping systems in Germany. Agrofor. Syst. 2014, 88, 579–591. [Google Scholar] [CrossRef]
- Lovell, D.J.; Parker, S.R.; Van Peteghem, P.; Webb, D.A.; Welham, S.J. Quantification of raindrop kinetic energy for improved prediction of splash-dispersed pathogens. Phytopathology 2002, 92, 497–503. [Google Scholar] [CrossRef]
- Hodges, L.; Brandle, J. Windbreaks: An Important Component in a Plasticulture System. Available online: https://digitalcommons.unl.edu/agronomyfacpub/391/ (accessed on 26 March 2019).
- Schroth, G.; Krauss, U.; Gasparotto, L.; Duarte Aguilar, J.A.; Vohland, K. Pests and diseases in agroforestry systems of the humid tropics. Agrofor. Syst. 2000, 50, 199–241. [Google Scholar] [CrossRef]
- Brandfass, C.; Karlovsky, P. Upscaled CTAB-Based DNA Extraction and Real-Time PCR Assays for Fusarium culmorum and F. graminearum DNA in Plant Material with Reduced Sampling Error. Int. J. Mol. Sci. 2008, 9, 2306–2321. [Google Scholar] [CrossRef] [Green Version]
- Cristina, D.; Turcu, A.G.; Ciuca, M. Molecular Detection of Resistance Genes to Leaf Rust Lr34 And Lr37 in Wheat Germplasm. Agric. Agric. Sci. Procedia 2015, 6, 533–537. [Google Scholar] [CrossRef] [Green Version]
- Reineke, A.; Karlovsky, P.; Zebitz, C.P.W. Preparation and purification of DNA from insects for AFLP analysis. Insect Mol. Biol. 1998, 7, 95–99. [Google Scholar] [CrossRef]
- Nutz, S.; Döll, K.; Karlovsky, P. Determination of the LOQ in real-time PCR by receiver operating characteristic curve analysis: Application to qPCR assays for Fusarium verticillioides and F. proliferatum. Anal. Bioanal. Chem. 2011, 401, 707–726. [Google Scholar] [CrossRef]
- Clarke, J.U. Evaluation of censored data methods to allow statistical comparisons among very small samples with below detection limit observations. Environ. Sci. Technol. 1998, 32, 177–183. [Google Scholar] [CrossRef]
- Team, R.C. R: A Language and Environment for Statistical Computing; R Foundation for Statistical Computing: Vienna, Austria, 2017. [Google Scholar]
- Xiong, S.; Nilsson, C. The effects of plant litter on vegetation: A meta-analysis. J. Ecol. 1999, 87, 984–994. [Google Scholar] [CrossRef]
- Araujo, A.S.F.; Leite, L.F.C.; de Iwata, B.F.; de Lira, M.A.; Xavier, G.R.; Figueiredo, M.D.V.B. Microbiological process in agroforestry systems: A review. Agron. Sustain. Dev. 2012, 32, 215–226. [Google Scholar] [CrossRef]
- Banerjee, S.; Baah-Acheamfour, M.; Carlyle, C.N.; Bissett, A.; Richardson, A.E.; Siddique, T.; Bork, E.W.; Chang, S.X. Determinants of bacterial communities in Canadian agroforestry systems: Co-occurrence patterns of soil bacterial communities. Environ. Microbiol. 2016, 18, 1805–1816. [Google Scholar] [CrossRef]
- Chander, K.; Goyal, S.; Nandal, D.P.; Kapoor, K.K. Soil organic matter, microbial biomass and enzyme activities in a tropical agroforestry system. Biol. Fertil. Soils 1998, 27, 168–172. [Google Scholar] [CrossRef]
- Kaur, B.; Gupta, S.R.; Singh, G. Soil carbon, microbial activity and nitrogen availability in agroforestry systems on moderately alkaline soils in northern India. Appl. Soil Ecol. 2000, 15, 283–294. [Google Scholar] [CrossRef]
- Klosterman, S.J.; Atallah, Z.K.; Vallad, G.E.; Subbarao, K.V. Diversity, pathogenicity, and management of Verticillium species. Ann. Rev. Phytopathol. 2009, 47, 39–62. [Google Scholar] [CrossRef] [PubMed]
- Dunker, S.; Keunecke, H.; Steinbach, P.; Tiedemann, A.V. Impact of Verticillium longisporum on yield and morphology of einter oilseed tape (Brassica napus) in relation to systemic spread in the plant. J. Phytopathol. 2008, 156, 698–707. [Google Scholar] [CrossRef]
- Heale, J.B.; Karapapa, V.K. The Verticillium threat to Canada’s major oilseed crop: Canola. Can. J. Plant Pathol. 1999, 21, 1–7. [Google Scholar] [CrossRef]
- Zhou, L.; Hu, Q.; Johansson, A.; Dixelius, C. Verticillium longisporum and V. dahliae: Infection and disease in Brassica napus. Plant Pathol. 2006, 55, 137–144. [Google Scholar] [CrossRef]
- Lopisso, D.T.; Knüfer, J.; Koopmann, B.; von Tiedemann, A. The vascular pathogen Verticillium longisporum does not affect water relations and plant responses to drought stress of its host, Brassica napus. Phytopathology 2016, 107, 444–454. [Google Scholar] [CrossRef] [PubMed]
- Debode, J.; Maeyer, K.D.; Perneel, M.; Pannecoucque, J.; Backer, G.D.; Höfte, M. Biosurfactants are involved in the biological control of Verticillium microsclerotia by Pseudomonas spp. J. Appl. Microbiol. 2007, 103, 1184–1196. [Google Scholar] [CrossRef]
- Abuamsha, R.; Salman, M.; Ehlers, R.U. Differential resistance of oilseed rape cultivars (Brassica napus ssp. oleifera) to Verticillium longisporum infection is affected by rhizosphere colonisation with antagonistic bacteria, Serratia plymuthica and Pseudomonas chlororaphis. BioControl 2011, 56, 101–112. [Google Scholar] [CrossRef]
- Berg, G. Rhizobacteria of oilseed rape antagonistic to Verticillium dahliae var. longisporum STARK. J. Plant Dis. Protect. 1996, 103, 20–30. [Google Scholar]
- Altieri, M.A. The ecological role of biodiversity in agroecosystems. In Invertebrate Biodiversity as Bioindicators of Sustainable Landscapes; Paoletti, M.G., Ed.; Elsevier: Amsterdam, The Netherlands, 1999; pp. 19–31. [Google Scholar] [Green Version]
- Latz, E.; Eisenhauer, N.; Rall, B.C.; Allan, E.; Roscher, C.; Scheu, S.; Jousset, A. Plant diversity improves protection against soil-borne pathogens by fostering antagonistic bacterial communities. J. Ecol. 2012, 100, 597–604. [Google Scholar] [CrossRef]
- Shoemaker, R.A.; Brun, H. The teleomorph of the weakly aggressive segregate of Leptosphaeria maculans. Can. J. Bot. 2001, 79, 412–419. [Google Scholar]
- West, J.S.; Kharbanda, P.D.; Barbetti, M.J.; Fitt, B.D.L. Epidemiology and management of Leptosphaeria maculans (phoma stem canker) on oilseed rape in Australia, Canada and Europe. Plant Pathol. 2001, 50, 10–27. [Google Scholar] [CrossRef]
- Danielsson, J.; Reva, O.; Meijer, J. Protection of oilseed rape (Brassica napus) toward fungal pathogens by strains of plant-associated Bacillus amyloliquefaciens. Microb. Ecol. 2007, 54, 134–140. [Google Scholar] [CrossRef]
- Hammoudi, O.; Salman, M.; Abuamsha, R.; Ehlers, R.U. Effectiveness of bacterial and fungal isolates to control Phoma lingam on oilseed rape Brassica napus. Am. J. Plant Sci. 2012, 3, 773–779. [Google Scholar] [CrossRef]
- Huang, Y.J.; Fitt, B.D.L.; Jedryczka, M.; Dakowska, S.; West, J.S.; Gladders, P.; Steed, J.M.; Li, Z.Q. Patterns of ascospore release in relation to phoma stem canker epidemiology in England (Leptosphaeria maculans) and Poland (Leptosphaeria biglobosa). Eur. J. Plant Pathol. 2005, 111, 263–277. [Google Scholar] [CrossRef]
- Travadon, R.; Bousset, L.; Saint-Jean, S.; Brun, H.; Sache, I. Splash dispersal of Leptosphaeria maculans pycnidiospores and the spread of blackleg on oilseed rape. Plant Pathol. 2007, 56, 595–603. [Google Scholar] [CrossRef]
- Czaban, J.; Wróblewska, B.; Sułek, A.; Mikos, M.; Boguszewska, E.; Podolska, G.; Nieróbca, A. Colonisation of winter wheat grain by Fusarium spp. and mycotoxin content as dependent on a wheat variety, crop rotation, a crop management system and weather conditions. Food Addit. Contam. Part A 2015, 32, 874–910. [Google Scholar] [CrossRef]
- Karlsson, I.; Friberg, H.; Kolseth, A.K.; Steinberg, C.; Persson, P. Agricultural factors affecting Fusarium communities in wheat kernels. Int. J. Food Microbiol. 2017, 252, 53–60. [Google Scholar] [CrossRef] [Green Version]
- Leplat, J.; Mangin, P.; Falchetto, L.; Heraud, C.; Gautheron, E.; Steinberg, C. Visual assessment and computer—Assisted image analysis of Fusarium head blight in the field to predict mycotoxin accumulation in wheat grains. Eur. J. Plant Pathol. 2018, 150, 1065–1081. [Google Scholar] [CrossRef]
- Alkadri, D.; Nipoti, P.; Döll, K.; Karlovsky, P.; Prodi, A.; Pisi, A. Study of fungal colonization of wheat kernels in Syria with a focus on Fusarium species. Int. J. Mol. Sci. 2013, 14, 5938–5951. [Google Scholar] [CrossRef]
- Burmeister, H.R.; Plattner, R.D. Enniatin production by Fusarium tricinctum and its effect on germinating wheat seeds. Phytopathology 1987, 77, 1483–1487. [Google Scholar] [CrossRef]
- Chelkowski, J.; Zawadzki, M.; Zajkowski, P.; Logrieco, A.; Bottalico, A. Moniliformin production by fusarium species. Mycotoxin Res. 1990, 6, 41–45. [Google Scholar] [CrossRef]
- Thrane, U. Screening for Fusarin C production by European isolates of Fusarium species. Mycotoxin Res. 1988, 4, 2–10. [Google Scholar] [CrossRef]
- Wachowska, U.; Kucharska, K.; Jedryczka, M.; Lobik, N. Microorganisms as biological control agents against fusarium pathogens in winter wheat. Pol. J. Environ. Stud. 2013, 22, 591–597. [Google Scholar]
- Nourozian, J.; Etebarian, H.R.; Khodakaramian, G. Biological control of Fusarium graminearum on wheat by antagonistic bacteria. Songklanakarin J. Sci. Technol. 2006, 28, 29–38. [Google Scholar]
- Zalila-Kolsi, I.; Ben Mahmoud, A.; Ali, H.; Sellami, S.; Nasfi, Z.; Tounsi, S.; Jamoussi, K. Antagonist effects of Bacillus spp. strains against Fusarium graminearum for protection of durum wheat (Triticum turgidum L. subsp. durum). Microbiol. Res. 2016, 192, 148–158. [Google Scholar] [CrossRef]
- Zhao, Y.; Selvaraj, J.N.; Xing, F.; Zhou, L.; Wang, Y.; Song, H.; Tan, X.; Sun, L.; Sangare, L.; Folly, Y.M.E.; et al. Antagonistic Action of Bacillus subtilis Strain SG6 on Fusarium graminearum. PLoS ONE 2014, 9, e92486. [Google Scholar] [CrossRef]
- Khan, N.; Maymon, M.; Hirsch, A.M. Combating Fusarium Infection Using Bacillus-Based Antimicrobials. Microorganisms 2017, 5, 75. [Google Scholar] [CrossRef]
- Ghorbani, R.; Wilcockson, S.; Koocheki, A.; Leifert, C. Soil management for sustainable crop disease control: A review. Environ. Chem. Lett. 2008, 6, 149–162. [Google Scholar] [CrossRef]
- Hope, R.; Aldred, D.; Magan, N. Comparison of environmental profiles for growth and deoxynivalenol production by Fusarium culmorum and F. graminearum on wheat grain. Lett. Appl. Microbiol. 2005, 40, 295–300. [Google Scholar] [CrossRef]
- Ramirez, M.L.; Chulze, S.; Magan, N. Temperature and water activity effects on growth and temporal deoxynivalenol production by two Argentinean strains of Fusarium graminearum on irradiated wheat grain. Int. J. Food Microbiol. 2006, 106, 291–296. [Google Scholar] [CrossRef]
- Schmidt-Heydt, M.; Parra, R.; Geisen, R.; Magan, N. Modelling the relationship between environmental factors, transcriptional genes and deoxynivalenol mycotoxin production by strains of two Fusarium species. J. R. Soc. Interface 2011, 8, 117–126. [Google Scholar] [CrossRef]
- Llorens, A.; Mateo, R.; Hinojo, M.J.; Valle-Algarra, F.M.; Jimenez, M. Influence of environmental factors on the biosynthesis of type B trichothecenes by isolates of Fusarium spp. from Spanish crops. Int. J. Food Microbiol. 2004, 94, 43–54. [Google Scholar] [CrossRef]
- Ryu, D.; Bullerman, L.B. Effect of cycling temperatures on the production of deoxynivalenol and zearalenone by Fusarium graminearum NRRL 5883. J. Food Prot. 1999, 62, 1451–1455. [Google Scholar] [CrossRef]
- Bacon, C.W.; Porter, J.K.; Norred, W.P.; Leslie, J.F. Production of fusaric acid by Fusarium species. Appl. Environ. Microbiol. 1996, 62, 4039–4043. [Google Scholar] [Green Version]
- Chawla, H.S.; Wenzel, G. In vitro Selection for fusaric acid resistant barley plants. Plant Breed. 1987, 99, 159–163. [Google Scholar] [CrossRef]
- Smith, T.K.; Graça Sousadias, M. Fusaric acid content of swine feedstuffs. J. Agric. Food Chem. 1993, 41, 2296–2298. [Google Scholar] [CrossRef]
- Wang, H.; Ng, T.B. Pharmacological activities of fusaric acid (5-butylpicolinic acid). Life Sci. 1999, 65, 849–856. [Google Scholar] [CrossRef]
- Bacon, C.W.; Porter, J.K.; Norred, W.P. Toxic interaction of fumonisin B1 and fusaric acid measured by injection into fertile chicken egg. Mycopathologia 1995, 129, 29–35. [Google Scholar] [CrossRef]
- Dowd, P.F. Toxicological and biochemical interactions of the fungal metabolites fusaric acid and kojic acid with xenobiotics in Heliothis zea (F.) and Spodoptera frugiperda (J.E. Smith). Pestic. Biochem. Physiol. 1988, 32, 123–134. [Google Scholar] [CrossRef]
- Smith, T.K.; McMillan, E.G.; Castillo, J.B. Effect of feeding blends of Fusarium mycotoxin-contaminated grains containing deoxynivalenol and fusaric acid on growth and feed consumption of immature swine. J. Anim. Sci. 1997, 75, 2184–2191. [Google Scholar] [CrossRef]
- Porter, J.K.; Bacon, C.W.; Wray, E.M.; Hagler, W.M. Fusaric acid in Fusarium moniliforme cultures, corn, and feeds toxic to livestock and the neurochemical effects in the brain and pineal gland of rats. Nat. Toxins 1995, 3, 91–100. [Google Scholar] [CrossRef]
- Smith, T.K.; MacDonald, E.J. Effect of fusaric acid on brain regional neurochemistry and vomiting behavior in swine. J. Anim. Sci. 1991, 69, 2044–2049. [Google Scholar] [CrossRef]
- Hidaka, H.; Nagatsu, T.; Takeya, K.; Takeuchi, T.; Suda, H. Fusaric acid, a hypotensive agent produced by fungi. J. Antibiot. (Tokyo) 1969, 22, 228–230. [Google Scholar] [CrossRef]
- Yabuta, T.; Kobe, K.; Hayashi, T. Biochemical studies of the “bakanae” fungus of rice. I. Fusarinic acid, a new product of the “Bakanae” fungus. Z. Pflanzenkrankh. Pflanzenpathol. Pflanzenschutz 1934, 10, 1059–1068. [Google Scholar]
- López-Díaz, C.; Rahjoo, V.; Sulyok, M.; Ghionna, V.; Martín-Vicente, A.; Capilla, J.; Pietro, A.D.; López-Berges, M.S. Fusaric acid contributes to virulence of Fusarium oxysporum on plant and mammalian hosts. Mol. Plant Pathol. 2018, 19, 440–453. [Google Scholar] [CrossRef]
- Venter, S.L.; Steyn, P.J. Correlation between fusaric acid production and virulence of isolates of Fusarium oxysporum that causes potato dry rot in South Africa. Potato Res. Neth. 1998, 41, 289–294. [Google Scholar] [CrossRef]
- Amato, B.; Pfohl, K.; Tonti, S.; Nipoti, P.; Dastjerdi, R.; Pisi, A.; Karlovsky, P.; Prodi, A. Fusarium proliferatum and fumonisin B1 co-occur with Fusarium species causing Fusarium Head Blight in durum wheat in Italy. J. Appl. Bot. Food Qual. 2015, 88, 228–233. [Google Scholar]
- Guo, Z.; Pfohl, K.; Karlovsky, P.; Dehne, H.W.; Altincicek, B. Fumonisin B1 and beauvericin accumulation in wheat kernels after seed-borne infection with Fusarium proliferatum. Agric. Food Sci. 2016, 25, 138–145. [Google Scholar] [CrossRef]
- Turner, A.S.; Lees, A.K.; Rezanoor, H.N.; Nicholson, P. Refinement of PCR-detection of Fusarium avenaceum and evidence from DNA marker studies for phenetic relatedness to Fusarium tricinctum. Plant Pathol. 1998, 47, 278–288. [Google Scholar] [CrossRef]
- Schilling, A.G.; Moller, E.M.; Geiger, H.H. Polymerase chain reaction-based assays for species-specific detection of Fusarium culmorum, F. graminearum, and F. avenaceum. Phytopathology 1996, 86, 515–522. [Google Scholar] [CrossRef]
- Nicholson, P.; Simpson, D.R.; Weston, G.; Rezanoor, H.N.; Lees, A.K.; Parry, D.W.; Joyce, D. Detection and quantification of Fusarium culmorum and Fusarium graminearum in cereals using PCR assays. Physiol. Mol. Plant Pathol. 1998, 53, 17–37. [Google Scholar] [CrossRef]
- Parry, D.W.; Nicholson, P. Development of a PCR assay to detect Fusarium poae in wheat. Plant Pathol. 1996, 45, 383–391. [Google Scholar] [CrossRef]
- Jurado, M.; Vázquez, C.; Marín, S.; Sanchis, V.; Teresa González-Jaén, M. PCR-based strategy to detect contamination with mycotoxigenic Fusarium species in maize. Syst. Appl. Microbiol. 2006, 29, 681–689. [Google Scholar] [CrossRef]
- Kulik, T. Detection of Fusarium tricinctum from cereal grain using PCR assay. J. Appl. Genet. 2008, 49, 305–311. [Google Scholar] [CrossRef]
- Liu, S.Y.; Liu, Z.; Fitt, B.D.L.; Evans, N.; Foster, S.J.; Huang, Y.J.; Latunde-Dada, A.O.; Lucas, J.A. Resistance to Leptosphaeria maculans (phoma stem canker) in Brassica napus (oilseed rape) induced by L. biglobosa and chemical defence activators in field and controlled environments. Plant Pathol. 2006, 55, 401–412. [Google Scholar] [CrossRef]
- Yin, Y.; Ding, L.; Liu, X.; Yang, J.; Ma, Z. Detection of Sclerotinia sclerotiorum in Planta by a Real-time PCR Assay. J. Phytopathol. 2009, 157, 465–469. [Google Scholar] [CrossRef]
- Eynck, C.; Koopmann, B.; Grunewaldt-Stoecker, G.; Karlovsky, P.; von Tiedemann, A. Differential interactions of Verticillium longisporum and V. dahliae with Brassica napus detected with molecular and histological techniques. Eur. J. Plant Pathol. 2007, 118, 259–274. [Google Scholar] [CrossRef]
Figure 1.
Abundance of (A) Verticillium longisporum in oilseed rape plants and Fusarium tricinctum in (B) wheat and (C) barley grain of temperate agroforestry and monoculture systems. n = 4 replicate plots per management system and study site and year. Fungal DNA concentration of each replicate plot in the agroforestry systems are obtained from three (Göttingen) or four (Jena, Cottbus, and Braunschweig) sampling locations within the crop rows of the agroforestry systems and are weighted averages by area and yield. Dashed lines represent the limit of quantification (LOQ) of the respective real-time PCR assay. Samples below LOQ and above the limit of detection were assigned to half the LOQ. Asterisks indicate significant differences between agroforestry and monoculture systems (linear mixed effect model at * p ≤ 0.05 and ** p ≤ 0.01).

Figure 2.
Mycotoxin concentrations in barley and wheat grain samples of temperate agroforestry and monoculture systems. Deoxynivalenol (DON) in (A) barley and (B) wheat, (C) nivalenol (NIV) in wheat, fusaric acid in (D) barley and (E) wheat, (F) fumonisin B1 in wheat, enniatin B in (G) barley and (H) wheat, (I) enniatin B1 in barley, and (J) enniatin A1 in barley grain (J). n = 4 replicate plots per management system and study site and year. Mycotoxin concentrations of each replicate plot in the agroforestry systems are obtained from three (Göttingen) or four (Jena, Cottbus, and Braunschweig) sampling locations within the crop rows of the agroforestry systems and are weighted averages by area and yield. Samples below LOQ and above the limit of detection were assigned to half the LOQ, samples below the limit of detection to zero. n.s. indicates no significant differences between agroforestry and monoculture systems (linear mixed effect model or Mann-Whitney U test).

Figure 3.
(A) Deoxynivalenol (DON) and (B) fusaric acid concentrations in barley grain samples within the temperate agroforestry system at Jena in 2016. Medians with standard error (n = 4 per replicate plot). Distances (1 m, 4 m, 7 m, and 24 m) are distances from the tree row within the crop row of the agroforestry system. Samples below the limit of quantification (LOQ) were assigned to half the LOQ, samples below the limit of detection to zero. Different lowercase letters indicate significant differences among distances from the tree row within the crop row of the agroforestry system (Kruskal-Wallis test with multiple comparison extension at p ≤ 0.05).
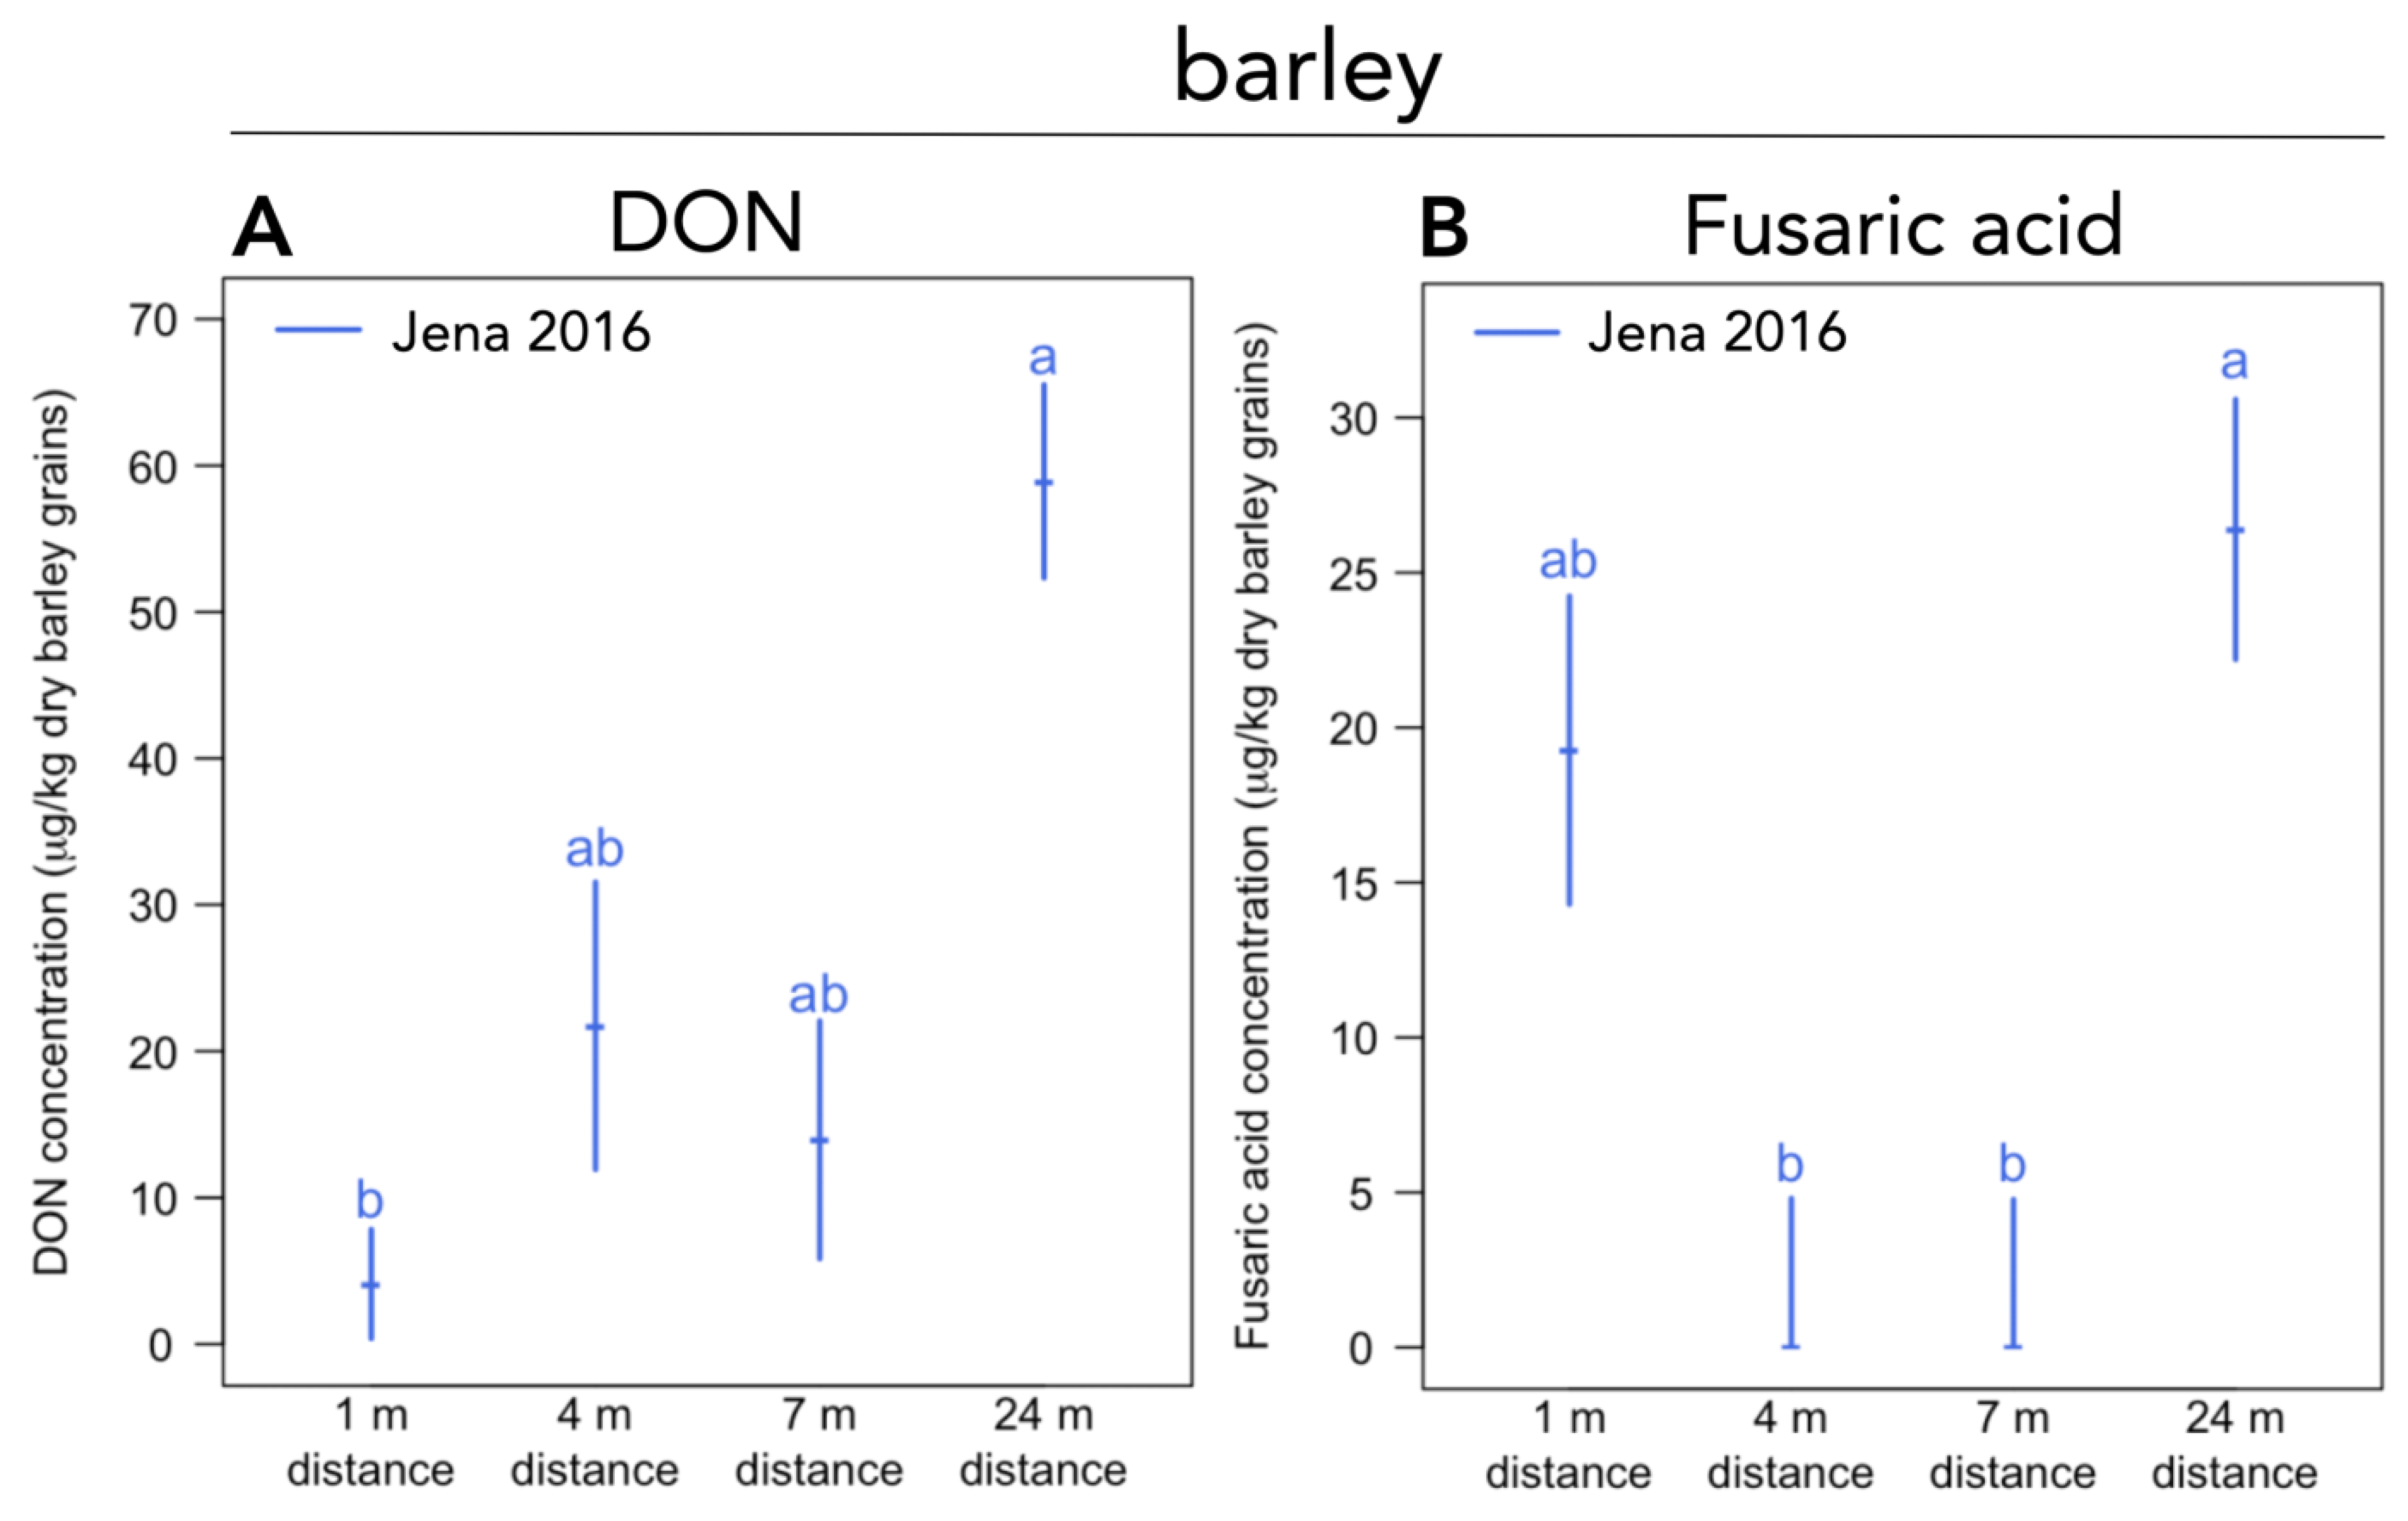
Table 1.
Study site locations and characteristics.
| Study Site | ||||
|---|---|---|---|---|
| Jena | Cottbus | Göttingen | Braunschweig | |
| Mean annual air temperature 1981–2010 | 9.9 ± 0.1 °C a | 9.6 ± 0.2 °C b | 9.2 ± 0.1 °C c | 9.6 ± 0.2 °C d |
| Mean annual air temperature 2016 | 10.8 °C | 10.3 °C | 9.8 °C | 10.3 °C |
| Mean annual air temperature 2017 | 10.9 °C | 10.3 °C | 9.9 °C | 10.3 °C |
| Mean annual air temperature 2018 | 11.5 °C | 11.2 °C | 10.6 °C | 11.2 °C |
| Mean annual precipitation 1981–2010 | 608 ± 21 mm a | 568 ± 21 mm b | 651 ± 24 mm c | 637 ± 23 mm d |
| Annual precipitation 2016 | 528 mm | 593 mm | 544 mm | 504 mm |
| Annual precipitation 2017 | 648 mm | 621 mm | 777 mm | 819 mm |
| Annual precipitation 2018 | 415 mm | 429 mm | 430 mm | 380 mm |
| Meters above sea level | 289 m | 67 m | 329 m | 82 m |
| Year of agroforestry system establishment | 2007 | 2010 | 2011 | 2008 |
| Harvest dates of the aboveground tree biomass of the agroforestry system | winter 2014/15 | winter 2014/15, winter 2017/18 | winter 2014/15 | winter 2013/14 |
| Soil type | Calcaric Phaeozem | Gleyic Cambisol | Eutric Cambisol | Vertic Cambisol |
a mean ± SE during 1981–2010; climate station at Jena (station ID: 2444) of the German Meteorological Service, b mean ± SE during 1981–2010; climate station at Cottbus (station ID: 880) of the German Meteorological Service, c mean ± SE during 1981–2010; climate station at Göttingen (station ID: 1691) of the German Meteorological Service, d mean ± SE during 1981–2010; climate station at Braunschweig (station ID: 662) of the German Meteorological Service.
Table 2.
Crop rotation of the agroforestry and monoculture systems from 2015 to 2018.
| Study Site | Crop Rotation | |||
|---|---|---|---|---|
| Crop 2015 a | Crop 2016 | Crop 2017 | Crop 2018 | |
| Jena | summer barley | summer barley | winter oilseed rape | winter wheat |
| Cottbus | maize | winter wheat | winter barley | maize b |
| Göttingen | summer wheat | winter barley | winter oilseed rape | winter wheat a |
| Braunschweig | winter barley | winter oilseed rape c | winter wheat | winter wheat |
a no sampling for crop diseases conducted, b not analyzed, c no determination of the oilseed rape plant yield.
© 2019 by the authors. Licensee MDPI, Basel, Switzerland. This article is an open access article distributed under the terms and conditions of the Creative Commons Attribution (CC BY) license (http://creativecommons.org/licenses/by/4.0/).
Share and Cite
MDPI and ACS Style
Beule, L.; Lehtsaar, E.; Rathgeb, A.; Karlovsky, P. Crop Diseases and Mycotoxin Accumulation in Temperate Agroforestry Systems. Sustainability 2019, 11, 2925. https://doi.org/10.3390/su11102925
AMA Style
Beule L, Lehtsaar E, Rathgeb A, Karlovsky P. Crop Diseases and Mycotoxin Accumulation in Temperate Agroforestry Systems. Sustainability. 2019; 11(10):2925. https://doi.org/10.3390/su11102925
Chicago/Turabian StyleBeule, Lukas, Ena Lehtsaar, Anna Rathgeb, and Petr Karlovsky. 2019. "Crop Diseases and Mycotoxin Accumulation in Temperate Agroforestry Systems" Sustainability 11, no. 10: 2925. https://doi.org/10.3390/su11102925
Note that from the first issue of 2016, this journal uses article numbers instead of page numbers. See further details here.