Community-Supported Agriculture Marketing Performance: Results from Pilot Market Channel Assessments in Colorado


1
Department of Agricultural and Resource Economics, Colorado State University, Fort Collins, CO 80523, USA
2
Colorado State University Extension, Fort Collins, CO 80523, USA
*
Author to whom correspondence should be addressed.
Sustainability 2019, 11(10), 2950; https://doi.org/10.3390/su11102950
Submission received: 11 March 2019
/
Revised: 16 May 2019
/
Accepted: 22 May 2019
/
Published: 24 May 2019
(This article belongs to the Special Issue Management of Community Supported Agriculture)
Abstract
:Due in large part to rising consumer interest, the number of farmers and ranchers selling through local food markets is growing. Community-supported agriculture (CSA) is a unique local food channel adopted by producers that was initially established as a strategy for producers to directly benefit from the season-long investments of buyers who align with their community-focused mission. Although the U.S. Department of Agriculture has long collected data to improve farm performance, information on specific marketing channels is missing, and in response, this research provides some of the first evidence of the heterogeneity of performance among CSAs. In a pilot approach to understanding the economics of CSAs relative to other direct marketing channels, we conducted an assessment process, incorporating 42 farms in Colorado between June 2016 and October 2017. Results showed that farms that incorporated CSA sales in their direct market portfolios tended to be smaller in scale and utilize more diverse markets. Although these CSA farms have lower average weekly sales, they have the highest average marketing profit margins compared to other direct market channels.
1. Introduction
According to the U.S. Department of Agriculture (USDA), 167,009 U.S. farms sold $8.7 billion of agricultural products through local food markets in 2015. They made 35% ($3 billion) of these sales directly to consumers, through on-farm stores, farmers markets, roadside stands, and community supported agriculture (CSA) arrangements [1].
Direct markets garner substantial attention, mostly due to growing consumer and societal interest in establishing relationships with producers and knowing more about where their food comes from [2,3]. Policymakers and economic developers, however, are also interested in these local markets, due to their potential to foster positive community economic development outcomes, as well as to support market access for young, beginning, and small farmers and ranchers [4,5,6,7].
Despite the growing interest in local food systems, there is evidence of differential performance for farms and ranches within these markets. Low et al. [6] reported that the number of farms with direct sales increased by 17% and overall sales increased by 32% between 2002 and 2007, but the number of farms with direct sales increased by only 5.5%, with no change in direct sales, between 2007 and 2012 [6].
Herein, we focus on CSA marketing arrangements. While the traditional CSA emphasized sustainable agriculture, shared production risk, and consumer involvement in the farm operation, it has evolved to commonly include connections with public health programming, food system collaborations, season extension, and consumer-friendly product offerings and operational models [8]. In a sense, the evolution of the mission of CSAs has paralleled the broader economy’s framing of sustainability, to include environmental, social, and economic benefits. Specifically, many see CSAs as an option for beginning, limited-resource, small, and socially-disadvantaged producers to be economically viable, addressing the imperfect competition and market structure failures of a free market [9]. CSA marketing arrangements offer consumers a membership, whereby they can purchase a share of produce that will be grown on the farm throughout the season, usually before the growing season, when producers need the operating capital to purchase inputs. In return, the farm provides a share of harvested farm products to its members [10]. As a result, CSAs are increasingly addressing sustainability in the broadest sense of the term.
Although there have been recent research efforts quantifying the profitability impacts of sales through local food markets [6,11,12], this body of work merely divides local food markets into two categories (i.e., direct-to-consumer or intermediated sales) due to data constraints. However, a handful of localized case studies provide evidence of the variability of cost structures within direct markets, particularly due to labor [13,14,15,16]. Low et al. [6] highlighted that within-market differences may be related to the different levels of financial commitment required for CSA membership, compared to shopping at farmers markets.
To better understand how participation in different market channels impacts farm viability, this pilot asks the following question: what are the farm profitability impacts of sales through CSA marketing arrangements, and how do sales through this market channel compare to other direct channels? For this initial pilot, we closely examine the economic aspects of a market week for 42 farms in Colorado that participated in market channel assessments between June 2016 and October 2017.
The rest of this paper begins with a review of the literature on the farm and ranch profitability impacts of sales through local food markets. Next, we present our empirical framework. Subsequently, we present our results, including comparing farm performance through CSA market arrangements to other direct market channels. Finally, we end with recommendations for market channel selection and opportunities for future research.
1.1. Evidence of Farm and Ranch Profitability Impacts of Sales through Local Food Channels
The growth in the number of farms and ranches participating in local food marketing channels has raised their visibility, along with questions about their viability. Despite this interest, few data have been available to assess farm performance by market channel. The USDA’s Census of Agriculture (Census) began to collect information about farmers’ direct-to-consumer sales in 1978, but questions were focused on participation and not volume of sales. Data on intermediated channels have only recently been collected [17]. However, the financial data gathered through the Census are insufficient to examine the profitability impacts of sales through local food markets.
The USDA Agricultural Resource Management Survey (ARMS) is the primary source of farm financial information available in the U.S. Beginning in 2008, it included questions about local food sales [17]. Several articles highlight the farm and ranch impacts of local food markets using these data. Park et al. [18] used ARMS data and found that farms selling only through direct channels report significantly lower revenue than farms using direct and intermediated or intermediated-only marketing strategies. Park [19] similarly found that participation in direct markets is associated with a decrease in farm sales. Low et al. [6] showed that even though farms selling through local food markets grew more slowly than those that did not, farms with local food sales were more likely to survive across all sales categories. Bauman et al. [11] used the ARMS data to identify factors that have the greatest influence on the efficiency of farms and ranches that participate in local food markets, and to subsequently estimate the relationship between marketing strategy and farm financial efficacy. They found that market channel choice is a significant influencer of production efficiency if profit is defined as return on assets. Bauman et al. [12] divided farms and ranches participating in local food markets by quartile and showed that participation in local food markets may support the profitability of farms of any scale.
Although the ARMS data have been useful in elucidating the farm and ranch impacts of local food markets, they have several drawbacks. First, ARMS is congressionally mandated to focus on the core agricultural states, which do not align with where most local food sales occur. Also, it is not geared to collect data on small, niche agricultural sectors, which has resulted in estimates of local food sales that exhibit substantial year-to-year variation [6]. Second, the data’s inability to assess the heterogeneity of performance within direct or intermediated channels limits the ability of researchers to make meaningful recommendations to farm and ranch support organizations.
In 2016, the USDA’s National Agricultural Statistic Service (NASS) administered a new national survey, the 2015 Local Food Marketing Practices Survey (LFMPS). To date, this is the only time this survey has been administered, and the USDA NASS obtained only 5697 usable responses, representing a 13% response rate. Furthermore, as noted by O’Hara and Lin [20], the LFMPS cannot measure the relative profitability of different local food marketing channels, because it does not ask for data on production costs or differences in per-unit prices by market channel.
Given data limitations, several researchers have used case studies that include primary data collection to better understand the farm and ranch profitability impacts of sales through local food markets. LeRoux et al. [15] conducted market channel assessments with four diversified vegetable farming operations in Central New York, and concluded that a combination of market channels is necessary to maximize farm performance, although CSA marketing arrangements were the first priority (or steady) channel for two of the four operations and CSAs were the top-performing channel across all four operations. Hardesty and Leff [14] conducted detailed analyses of three organic farm operations to understand their marketing costs and profitability in alternative market channels. For each of the operations, they found that marketing costs per dollar of revenue were lowest in the wholesale channels and highest in farmers market channels. There is also an article from a conference proceeding by Christensen et al. [16] that provides preliminary analysis of a subset of the sample of Colorado producers included in this paper. However, its focus is on farmer recruitment for market channel assessments and not on market performance results. Overall, these case studies, despite their limited sample sizes, provide evidence of the heterogeneity of farm performance within direct and intermediated channels and, thus, the need for additional investigation.
1.2. Nonmonetary Benefits of CSA Models and Potential Impact on Profitability
Beyond financial sustainability, there is evidence of other nonmonetary benefits of the CSA model that influence farmers’ economic well-being and ability to sustain a viable CSA business. Morgan et al. [21] interviewed 24 CSA farmers in four states, finding that farmers had social motivations that included benefits such as increasing their customers’ access to healthy foods, nutrition education, and enhanced community connections. In fact, a 2017 study by Woods et al. found that the CSA model continues to be innovative and focuses on capturing new and unique market opportunities, such as institutional health and wellness programs, diversified multi-farm systems, and urban production connections [8]. The authors found a shift in business focus over time, from customers trying to create benefits for the farmer to the farmer wanting to improve the benefits experienced by the customer.
There are some quantifiable benefits that accrue for CSA members who receive a regular order of fresh fruits, vegetables, and other products, and these documented benefits represent new market opportunities for producers. Curtis et al. [22] measured changes in food consumption for CSA members in northern Utah, finding that consumers altered their diets from a greater reliance on grains, dairy, and packaged meals to increased consumption of fresh produce during the course of a seasonal CSA program. In addition, the researchers found added benefits, such as increased consumption of meals at home and changes in knowledge of cooking and food preservation—tangible benefits that could motivate public programs to provide more financial support to CSAs based on their nutritional benefits, while driving more customers to CSA farms.
Lastly, Flora and Bregendahl [23] used a community capitals framework to assess the multiple attributes that multi-farm (collaborative) CSAs in Iowa generated—for both producers and consumers. They found that producers who participated long-term in collaborative CSAs as a business model also benefited from creating social, cultural, and natural capitals, which they listed among their explicit business goals.
2. Conceptual Model and Methods
When exploring the sustainability of different local food marketing strategies, it is important to delineate, measure, and assess key outcomes from the choices available. One area in need of pilot research relates to the additional marketing costs that occur to support the sales service, education, and marketing activities of the direct marketing strategies to support their sustainability mission [8]. Following Bauman et al. [24], we seek to continue refining the trade-offs between different food marketing channel strategies, by exploring the economic costs and benefits across business models that producers participating in local markets currently face. Moreover, by exploring the perceived risk and lifestyle differences these operations report, the assessment of broader operational sustainability outcomes (e.g., producer well-being, improved control over farm performance) can be considered.
Matt LeRoux and Todd Schmit developed the Market Channel Assessment Tool (MCAT) at Cornell University in 2008, to evaluate and compare marketing channels of individual farms and inform decision making for farmers wishing to change their marketing mix, increase profitability, or decrease the amount of labor involved in their current marketing activities. Through their preliminary work in this area, LeRoux et al. [15] determined that five interacting factors best measure the overall performance of a marketing channel for a particular farm. The MCAT enables producers to interactively compare the five factors with one another and then weight the performance factors that are of greatest importance to producers in order to estimate an overall performance ranking for each channel. The MCAT is used within a programmed MS Excel workbook to facilitate data entry and channel ranking analysis. The five specific performance factors evaluated within the MCAT are:
- Volume (Gross Sales): to compare the volumes of multiple products distributed through each channel, gross sales are evaluated (i.e., price times quantity);
- Profit (Net Returns): net returns focus on the price–cost differential for each channel. Here, net returns are calculated as gross sales, less labor, and travel-based marketing costs;
- Labor Requirements: the number of labor hours each channel requires in a typical, peak-season week;
- Risk: farmer perceptions of each channel’s financial or business risk. Financial/business risk is defined as the probability of lost or lower-than-expected sales, either based on waning volumes or declining price points;
- Lifestyle Preferences: lifestyle preferences reflect how well each channel fits a farmers’ overall lifestyle preferences and enjoyment of work. Lifestyle preferences are unique to each individual and can relate to a channel’s labor requirements, the stressfulness of the work, any required face-to-face interactions with customers/building of personal relationships, or expectations related to the style and presentation of products. This is an important criterion to include when considering diversified markets, as not every farmer wants to participate in a farmers market, for example.
After labor, transportation, and sales data were collected for each market channel, producer respondents were able to evaluate each market channel by applying a weight based on the above performance factors. This weighting helped producers to better understand the interactions of monetary and nonmonetary factors as they impact the viability of each channel.
During peak-season harvest (June–October) during the summers of 2016 and 2017, research assistants from Colorado State University worked with Colorado fruit and vegetable growers to collect channel-specific marketing costs and returns for one week of normal, peak-season business. Collected information included employee counts, pay rates, mileage, and daily gross sales specific to each marketing channel from each farm owner. Research assistants also gathered farmer perceptions on channel financial or business risk, and each channel’s consistency with farmer lifestyle preferences, through pre and post surveys. According to previous research (e.g., [11,12,15,25,26,27]), labor will represent a significant share of total variable costs, regardless of channel. Accordingly, labor activities—both paid and unpaid—were closely tracked through the MCAT, from harvest to market. Specifically, farmers were asked to assign a wage rate to all unpaid labor, that was equal to or greater than minimum wage. The majority of the time, producers set unpaid labor at minimum wage, except for their own compensation, which was often set higher (up to $25/hour). Since LeRoux et al. [15] found that farmers’ production activities (e.g., planting, cultivating, fertilizing, irrigating, weeding) did not vary for a crop based on its marketing channel destination (i.e., most crops are grown with more than one market destination in mind, but all are treated the same up until the point of harvest), labor data collection began at the harvest stage. Harvest activities were included in marketing labor because they can vary depending on requirements from each of the marketing channels (e.g., bunching and tying beets in the field for wholesalers versus harvesting loose for a farmers market).
To collect the marketing labor data, farm staff—including owners, hired staff, unpaid family members, and volunteers—completed labor logs each day (see Figure 1) during the study week. We categorized each tracked item (labor, mileage, or sales) by marketing channel in order to assess the costs and returns of each specific channel. For larger-scale operations with H2A crews (non-immigrant, temporary foreign workers), we classified the entire crew as a single group of employees, as they are paid similar rates to perform similar tasks. In this case, we asked the manager of the crew to complete the labor logs.
In addition to labor, the other major variable expense that was recorded was transportation costs. Given that the locations of direct markets likely vary, and because transportation costs associated with sales at different direct markets may impact each producer’s profitability, the number of miles to each direct market sales point were also recorded.
Once the data were compiled, channels were ranked by various criteria. We first computed intermediate results on labor costs, gross sales, and profit for each marketing channel within the MCAT program. We then ranked and scaled each set of performance factor scores across marketing channels to reflect the relative distance between factor scores. Finally, we computed weighted average factor scores, based on the producer-supplied weights or the stated importance of each factor, to determine the overall channel performance rankings.
We defined the lowest overall score as the top-performing channel, however, channels scoring low and close to each other provide some indication of preferred multichannel market management strategies. In addition to the farm-level benefit of the ranking provided by the MCAT, once a farm’s data have been entered, simulations of impacts of potential marketing changes are possible.
A Pilot Study of Direct Market Tradeoffs in Colorado’s Fruit and Vegetable Industry
Colorado’s fruit and vegetable industry is very diverse in terms of production and marketing, according to data from the Census [28]. Between 2007 and 2012, the number of farms reporting vegetable sales increased from 738 to 780—a 6% increase. Vegetables represent about 12% of all crop revenues and are produced on a little more than 83,000 acres in 48 counties. Potatoes are grown on over 59,000 acres, or 71% of all vegetable acres, and onions are grown on another 6400 acres. In 2012, there were 6080 acres of non-citrus fruit in Colorado—1387 acres of apples, 1088 of grapes, 2776 of peaches, 244 of pears, and 276 of sweet cherries. Although acreage under vegetable production continues to grow, revenues declined from $289 million to $281 million from 2007 to 2012, while revenue from fruit production increased from $23.2 million to $24 million in the same period. Most of Colorado’s fruit and vegetable acreage is targeted at the fresh market industry (about 79,000 acres). In 2012, 2896 farms sold through local food channels (up from 2777 farms in 2007). However, the total dollar amount of sales through these channels decreased from $22,584,000 in 2007 to $19,199,000 in 2012 [28]. The number of farmers markets increased from 106 in 2009 to 159 in 2013. Additionally, 234 farms reported participating in a CSA marketing arrangement in 2012, up from 214 in 2007.
Focus group studies and producer surveys from Colorado have repeatedly shown that labor is the greatest constraint facing both direct and intermediated market producers of fruits and vegetables. For example, a 2014 survey of 40 commercial specialty crop growers conducted by the Colorado Fruit and Vegetable Growers Association showed that 91% of fruit growers said recruiting and retaining labor was a high to moderately high risk, compared to 69% of vegetable growers. Those growing more types of crops (e.g., three or more types) had higher perceptions of labor risk than those only growing one or two types of crops [29]. Thus, producers were very interested in understanding labor utilization by market channel, and particularly for channels where utilization was known to be significant, such as direct channels.
We invited any specialty crop farmer in Colorado utilizing more than one marketing channel to participate in a market channel assessment. To generate a robust sample of farms participating in the study, we included information about the study in the newsletters of both the Colorado State University food systems extension team and the Colorado Fruit and Vegetable Growers Association. In addition, we passed out postcards with information about the study at events such as the Colorado Produce Day, the Western Horticulture Society Annual meeting, the Colorado Fruit and Vegetable Growers Association Annual Conference, and 2016–2017 Colorado Building Farmers classes. In addition, graduate research assistants visited farmers markets and spoke with local and regional distributors and food hubs throughout Colorado to gain additional farm contacts for participation.
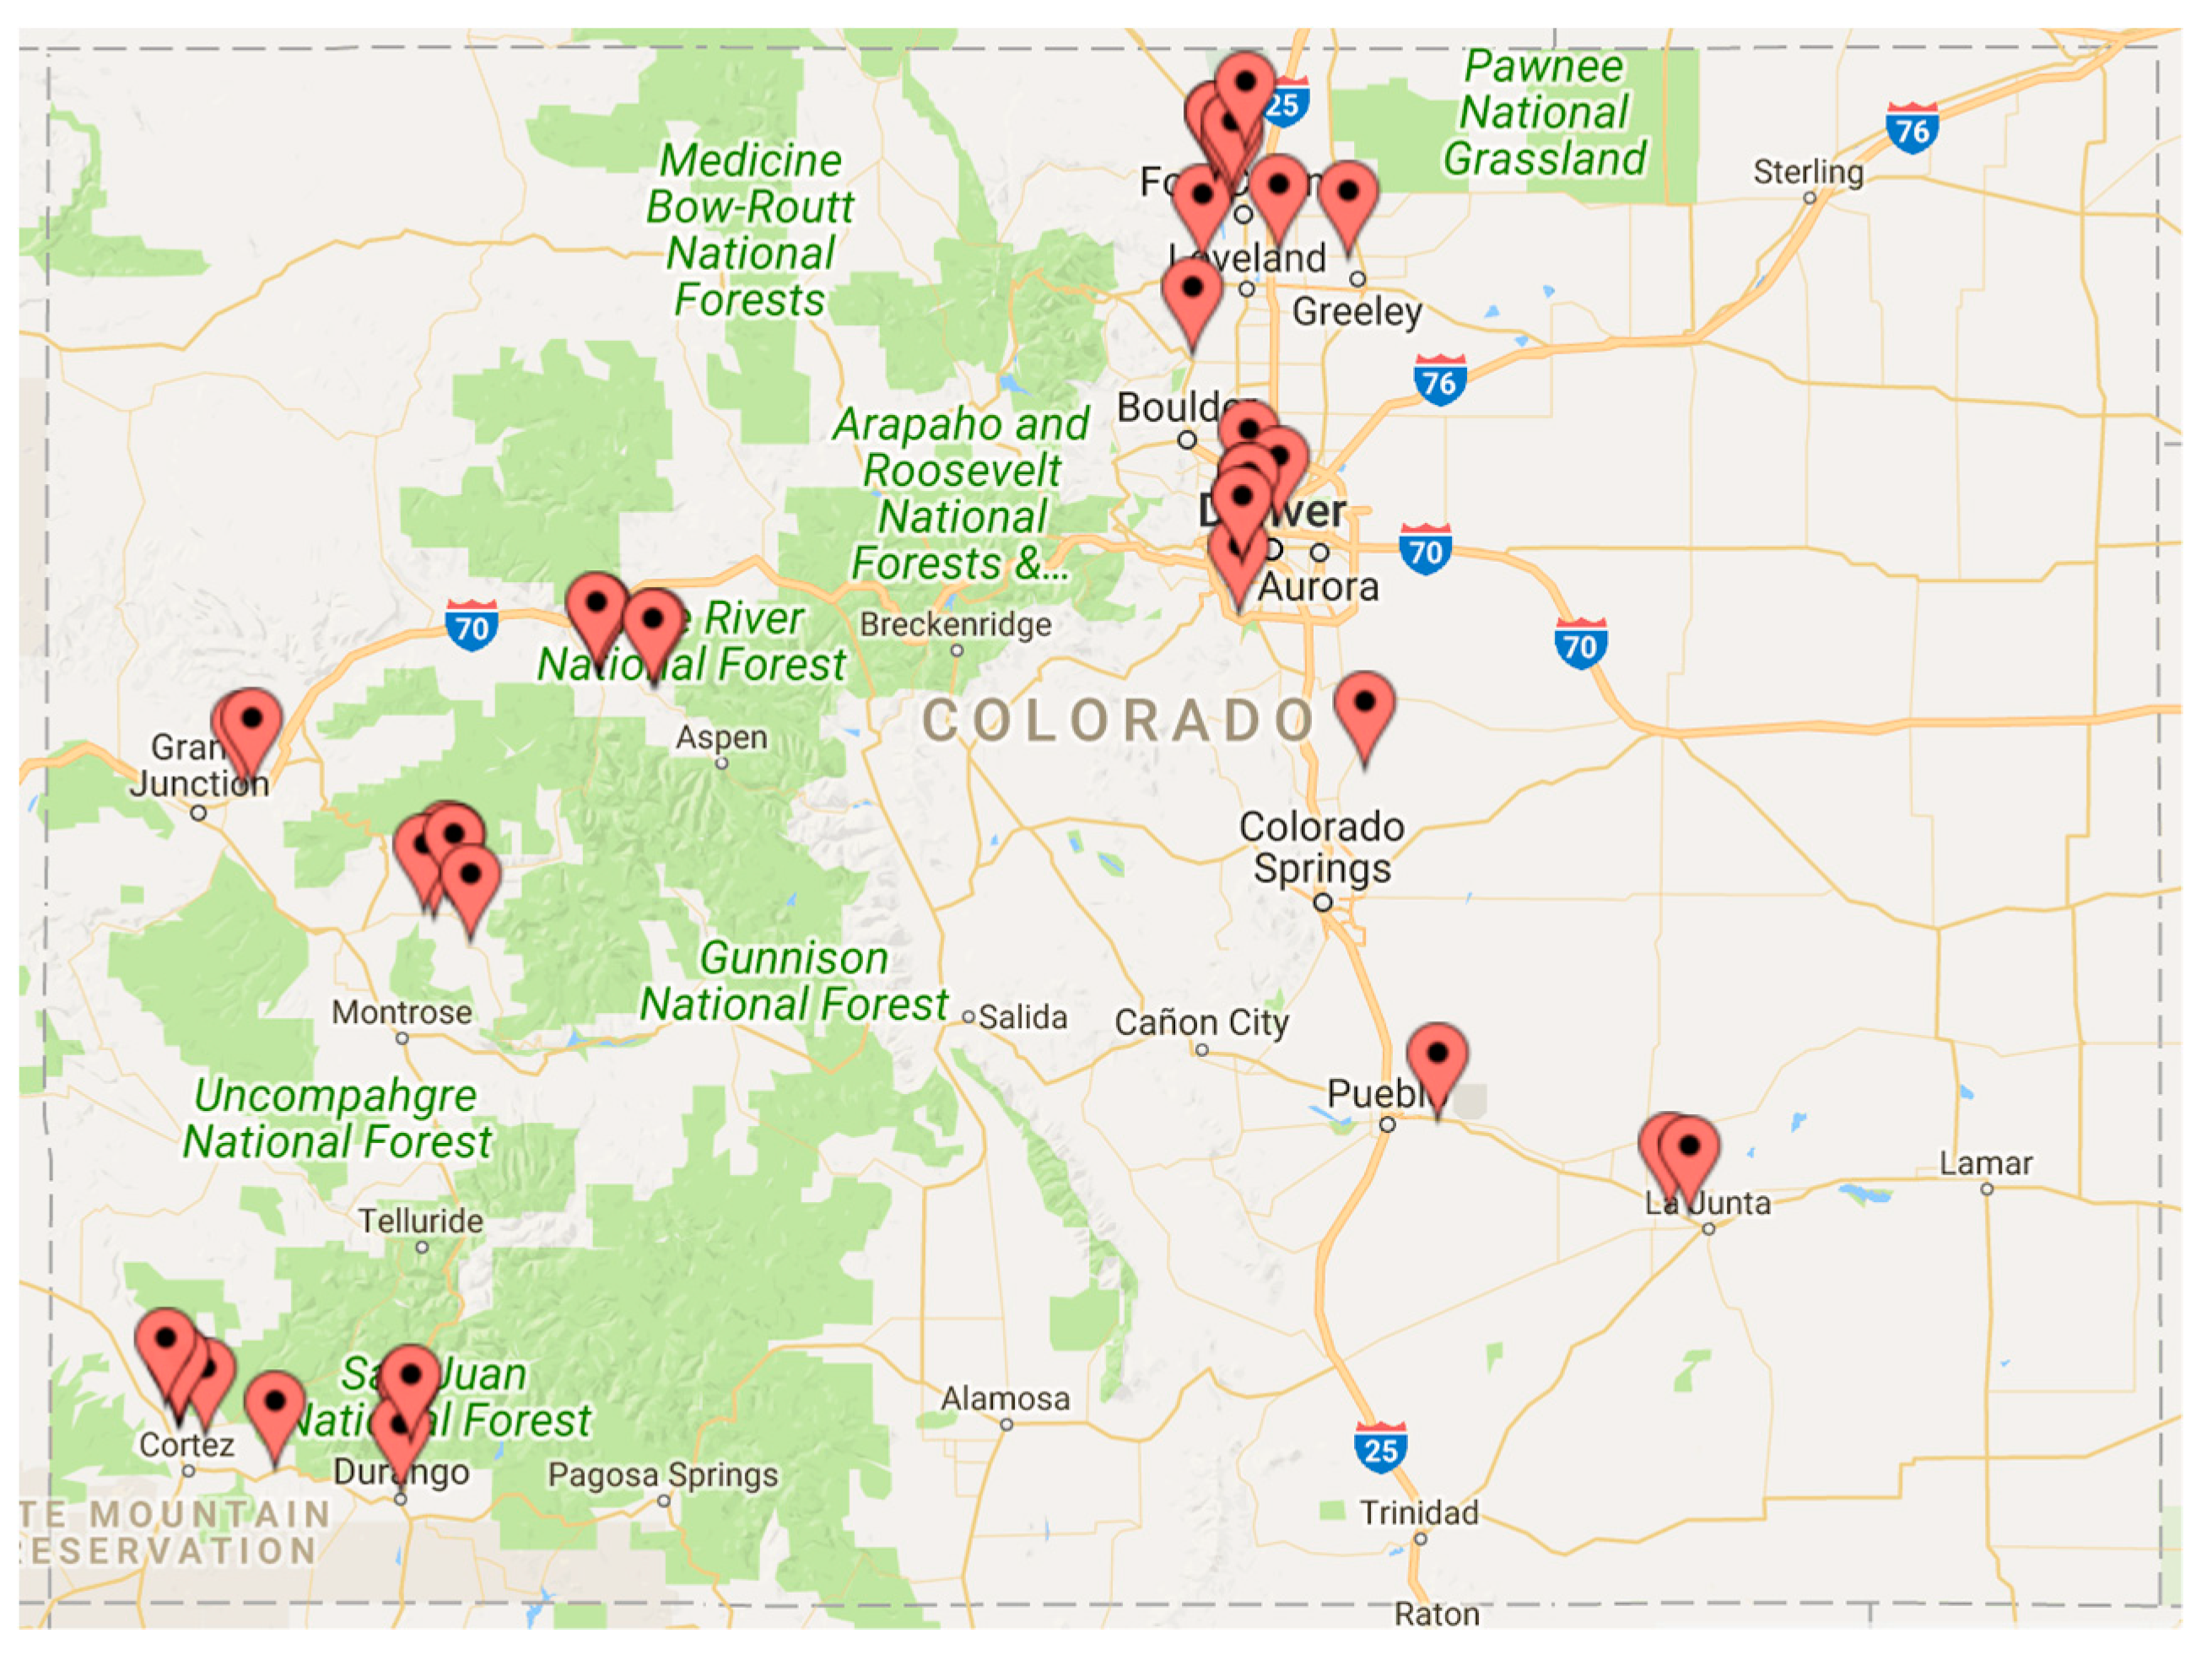
In total, 42 farms participated in market channel assessments for at least one year of data collection. Participating farms were located throughout the state (see Figure 2), with 37% located along Colorado’s more populous front range, 34% in the southern part of the state, and 29% along the west slope. Of the 42 participating farms, five had no sales through direct channels, five used one direct channel, sixteen used two direct channels, nine used three direct channels, and seven used four or more direct channels. Of the 37 farms with direct sales, 16 did not use CSA marketing arrangements and 21 did.
3. Results
We present the results of the market channel assessments first by comparing farms with direct sales, and then separating the sample by those with CSA marketing arrangements and those without. Next, we examine market channel characteristics of farms with direct sales by looking at the following key financial indicators by market channel: CSA (community supported agriculture), FS (farm stands), FM (farmers markets), and other direct market outlets. We pay particular attention to the marketing profit margin percentiles across direct channels, sales per labor hour percentiles, and marketing profit per labor hour percentiles. Finally, we examine differences in farmer perceptions of risk and lifestyle by market channel. Given our focus on analyzing the farm impacts of direct markets, we exclude the three farm observations without direct sales.
Table 1 provides the complete summary statistics for the farms in our sample, divided by those with and without CSA sales. Farms with direct sales that did not use CSA marketing arrangements are significantly larger in scale (98.40 average acres, $7432.63 weekly gross revenue) than those that used CSA markets (3.10 average acres, $2,173.35 weekly gross revenue). Furthermore, CSA marketing arrangements appear to be utilized by farmers with less experience farming and newer farming operations. Farms with CSA markets had 9.41 years of farming experience compared to 13.00 for those without CSA markets, and the average farm age was 4.75 years for farms with CSAs compared to 14.88 for those without CSAs.
Next, in order to examine market channel characteristics of farms with direct sales, we aggregated data from the participating farms and clustered the results by market channel. We identified 201 distinct market channels. Of these, 100 represent direct markets. Given that the focus of this paper is direct markets, we examined these channels only, dividing them into four categories: (1) community supported agriculture (CSA) (n = 26); (2) farmers markets (FM) (n = 43); (3) farm stands (FS) (n = 24); and (4) other (Other DM—this category includes direct markets, such as events and online sales) (n = 7). Table 2 provides the complete results.
Overall, direct channels had an average weekly gross revenue of $804.42. When we examine weekly gross revenue by market channel, we see that FS were highest ($963.03), followed by FM ($903.27), CSA ($637.16), and Other DM ($ 274.71). While Other DM represented the largest percentage of gross revenue by channel (38%), this was closely followed by FM (31%), CSA (26%), and FS (15%). The relative importance of CSA sales, shown in its relatively high share of weekly farm sales, may reflect the fact that farms with CSA sales tend to be smaller in scale compared to farms that do not utilize this market channel.
As stated above, the two primary variable costs on which this study focused are transportation and labor. Table 2 includes the average total round trip distance to market in miles for each of the direct channels. On average, farmers traveled the farthest distance to FM (66.43 miles), followed by FS (35.75 miles), Other DM (12.86 miles), and CSA (6.55 miles). Thus, although weekly gross revenues for CSA marketing arrangements are less than those of either FS or FM, transportation costs associated with CSA markets are also lower (and mean costs were shown to be statistically different from those associated with the FM channel).
3.1. Labor
Labor needs varied substantially across direct channels. On average, direct channels required 21.42 h of marketing labor per week. Note that the coefficient of variation (i.e., the ratio of the standard deviation to the mean, a measure of relative standard deviation) for FS (3.34) was higher than that of other direct channels. In addition, FS required the most weekly marketing labor on average (27.06 h), followed by FM (26.45 h), Other DM (11.27 h), and CSA (10.61 h). Thus, CSA required significantly less marketing labor, on average, compared to FS or FM.
Higher labor requirements at farm stands and farmers markets may be due to the fact that employees must be present to set up booths, make the sales, and then pack up equipment and unsold product at the end of the sales period. By contrast, labor used to capture sales under a CSA program generally occurs over a much shorter period—several hours per sales opportunity. Taking a closer look at how labor is used in each post-harvest marketing activity (Table 3), we see that CSA marketing arrangements allocate less of their weekly labor (as a percentage of total labor utilization) on sales and bookkeeping (19%), compared to sales through FM (40%) or FS (26%). Accordingly, a larger percentage of weekly labor hours can be devoted to harvest for CSA markets (48%) compared to FM (36%), although FS similarly use 45% of their weekly labor allocation on harvest.
Although we did not collect complete variable cost data from producers, we estimated marketing profit margins by direct channel. Marketing profit margin was calculated as weekly gross sales minus weekly marketing labor cost minus weekly market travel cost, divided by gross sales.
Table 2 provides the complete results. On average, CSA had the highest marketing profit margin (0.55), followed by FS (0.39), FM (0.19), and Other DM (−0.68). Of note is that the coefficients of variation are particularly high for FM (2.19) and low for CSA (1.17), meaning that marketing profit margins were fairly consistent (and significantly different from FM) for CSA markets but had high levels of variation across FM channels. Figure 3 provides additional insight into the marketing profit margins. Here, we can see the distribution of marketing profit margins, including the 75th, median, and 25th percentiles. Interestingly, CSA marketing arrangements have the least variability, as well as the highest median and 75th percentile marketing profit margins. Note that the small number of other DM observations precluded a calculation of percentiles for this variable.
Next, we examined sales per labor hour and marketing profit per labor hour by direct market channel. Sales per labor hour were calculated as gross weekly sales divided by weekly marketing labor hours. Marketing profit per labor hour was calculated as gross weekly sales minus weekly marketing labor costs minus weekly market travel costs, divided by marketing labor hours.
Table 2 shows that CSA has the highest sales per labor hour ($60.29), similar to FS ($60.19), and followed by Other DM ($36.87) and FM ($33.03). Marketing profit per labor hour tells a similar story, with FS having the highest return on labor invested ($47.47), followed closely by CSA ($46.18), and then by FM ($19.31) and Other DM ($16.62).
3.2. Market Channel Preferences: Noneconomic Assessment of Markets
Although financial tradeoffs are always important to the viability of a farm, the historical context of CSAs as a strategy to incorporate a broader mission of social, environmental, and customer engagement means more outcomes should be considered. Accordingly, this pilot approach to assessing market integrates questions for producers to indicate how lifestyle preferences and risk influence their decisions. Both unweighted (without consideration of farmers’ perceptions of relative risk and benefit) and weighted (by relative risk and benefit by each farmer) values are presented in Figure 4. Although Other DM has the highest overall ranking in both the weighted and unweighted channel rankings (where a low score conveys the highest rank), CSA has the next highest weighted and unweighted measures (2.09 and 2.03), followed by FS (2.29 and 2.30), and FM (3.48 and 3.39). One might conclude that this indicates that producers perceive more control over their farm’s viability, consistent with the managerial control those choosing this channel may seek [24]. A pairwise comparison of the mean values of the weighted and unweighted channel ranking showed no significant difference in means, implying that farmers’ lifestyle preference and risk perception did not represent a trade-off when evaluating each channel independently, but could influence the channel selection across their set of direct market opportunities.
4. Conclusions and Future Research
Policy support at the Federal and state levels has grown to encompass direct markets, including $150 million over the duration of the 2014 Farm Bill for the Farmers Market and Local Food Promotion Program [30,31], which was made permanent and mandatory and increased to $50 million per year through the 2018 Farm Bill [30]. Given the emergence of CSAs as a food market option for consumers who want a long-term, highly engaged way to procure food from an operation whose mission aligns with theirs, CSAs provide an interesting focus for a market channel assessment. By assessing economic performance and framing the trade-offs in the context of lifestyle and risk preferences of participating producers, this pilot is intended to inform future efforts to evaluate all types of direct markets. Although the findings are most thorough for financial outcomes, it seeds ideas for how a broader set of direct market impacts on an operation could be framed and assessed.
During the summers of 2016 and 2017, 42 fruit and vegetable growers across the state of Colorado participated in market channel assessments. These assessments enabled the in-depth examination of performance by market channel, and this article focused on what this pilot study found about CSA marketing arrangements.
Data from the Colorado sample provide evidence that farms with CSA sales tend to be smaller in scale (both in terms of acreage and sales) and more diverse (in terms of the number of market channels that they use) compared to farms with direct sales that do not participate in CSA.
CSA market channels were the best-performing direct channel in terms of average marketing profit margin. This finding is in line with results from LeRoux et al. [15], where CSAs were the highest ranked overall market channel. However, although Other DM and FS performed better than CSA in terms of sales and marketing profit per labor hour in our study, returns to CSA labor were solid. Overall, modest labor requirements are important to long-term economic and community sustainability, given statewide labor challenges reported by Colorado Fruit and Vegetable Growers Association members.
Furthermore, although weekly gross revenue was less for CSA than for FM or FS, given the relatively smaller size of farms that incorporate CSA marketing channels, these sales appear to represent an important component of overall farm revenues. This may explain why farmers reported CSA markets to be among the lowest risk channels within their direct market portfolios. Lastly, CSAs have the lowest labor and transportation requirements compared to all other direct market channels, which likely helps these producers to manage their energy requirements and costs (a sustainability goal of some invested in the local food system). Moreover, lower transportation costs would allow these smaller-scale farms to redirect resources to crop production, where more value can be added to the operation’s output.
There are several important limitations to this study. Most notably, the sample size limits the generalizability of the results and, therefore, this research should be regarded as a pilot only. Colorado has many micro-climates and remote regions. Thus, a larger sample size would have been useful to enable the researchers to disaggregate the results by region and commodity. That being said, the pilot results provide strong evidence of the importance of disaggregating local food sales beyond the direct and intermediated channel delineation often used in national analyses, and integrating some noneconomic aspects that are likely important to those choosing more local markets (as evidenced in the weighted channel assessments). The data point to substantial heterogeneity within direct markets. A more nuanced understanding of market performance by specific direct and intermediated markets will enable agricultural support organizations to provide better guidance and recommendations to farmers.
Author Contributions
The following authors contributed to this article in the following ways: conceptualization, B.B.R.J., M.S., and D.T.M.; methodology, B.B.R.J., M.S., and D.T.M.; formal analysis, B.B.R.J., M.S., and D.T.M.; investigation, B.B.R.J., M.S., and D.T.M.; resources, B.B.R.J., M.S., and D.T.M.; data curation, B.B.R.J., M.S., and D.T.M.; writing—original draft preparation, B.B.R.J. and M.S.; writing—review and editing, B.B.R.J., M.S., and D.T.M.; supervision, B.B.R.J., M.S., and D.T.M.; project administration, B.B.R.J., M.S., and D.T.M.; funding acquisition, B.B.R.J., M.S., and D.T.M.
Funding
This research was funded by the U.S. Department of Agriculture’s Agricultural Marketing Service’s Federal-State Marketing Improvement Program through grant CTGG1 BMAA 2016-1478, in addition to matching funds from Colorado State University Extension, the Colorado Fruit and Vegetable Growers Association, and the Colorado Department of Agriculture. Its contents are solely the responsibility of the authors and do not necessarily reflect the official view of the USDA.
Acknowledgments
The authors also wish to acknowledge Elizabeth Naasz, Jeremy Christensen, and Kellie Hirakata, the research assistants who coordinated data collection with the participating farmers, and Matt LeRoux of Cornell Cooperative Extension of Tompkins County and Todd Schmit of Cornell University, who created the market channel assessment tool, allowed it to be used as part of this research, and trained our team on how to use it.
Conflicts of Interest
The authors declare no conflict of interest. The funders had no role in the design of the study; in the collection, analyses, or interpretation of data; in the writing of the manuscript, or in the decision to publish the results.
References
- U.S. Department of Agriculture Census of Agriculture (USDA NASS). Direct Farm Sales of Food: Results from the 2015 Local Food Marketing Prices Survey; Report ACH12-35; Department of Agriculture: Washington, DC, USA, 2016. Available online: https://www.agcensus.usda.gov/Publications/2012/Online_Resources/Highlights/Local_Food/LocalFoodsMarketingPractices_Highlights.pdf (accessed on 22 April 2019).
- U.S. Department of Agriculture Agricultural Marketing Service (USDA AMS). Farmers Markets and Direct-to-Consumer Marketing; Department of Agriculture: Washington, DC, USA. Available online: https://www.ams.usda.gov/services/local-regional/farmers-markets-and-direct-consumer-marketing (accessed on 22 April 2019).
- Thilmany, D.; Bond, C.A.; Bond, J.K. Going local: Exploring consumer behavior and motivations for direct food purchases. Am. J. Agric. Econ. 2008, 90, 1303–1309. [Google Scholar] [CrossRef]
- Jablonski, B.B.R.; Thilmany McFadden, D.; Sullins, M.; Curtis, K. Determinants of effective beginning farmer programming: Implications for emerging USDA programs. J. Agric. Resour. Econ. 2017, 42, 427–438. [Google Scholar]
- Jablonski, B.B.R. Wealth impacts of farmers markets. In Rural Wealth Creation; Pender, J.L., Johnson, T.G., Weber, B., Fannin, J.M., Eds.; Routledge: New York, NY, USA, 2014; pp. 218–231. ISBN 978-0415858977. [Google Scholar]
- Low, S.A.; Adalja, A.; Beaulieu, E.; Key, N.; Martinez, S.; Melton, A.; Perez, A.; Ralston, K.; Stewart, H.; Suttles, S.; et al. Trends in U.S. Local and Regional Food Systems; Administrative Publication Number 067; U.S. Department of Agriculture, Economic Research Service: Washington, DC, USA, 2015.
- Schmit, T.M.; Jablonski, B.B.R.; Minner, J.; Kay, D.; Christensen, L. Rural wealth creation of intellectual capital from urban local food system initiatives: Developing indicators to assess change. Community Dev. 2017, 48, 639–656. [Google Scholar] [CrossRef]
- Woods, T.; Ernst, M.; Tropp, D. Community Supported Agriculture—New Models for Changing Markets; U.S. Department of Agriculture, Agricultural Marketing Service: Washington, DC, USA, 2017. Available online: https://www.ams.usda.gov/sites/default/files/media/CSANewModelsforChangingMarketsb.pdf (accessed on 10 May 2019).
- Brown, C.; Miller, S. The impacts of local markets: A review of research on farmers markets and community supported agriculture (CSA). Am. J. Agric. Econ. 2008, 90, 1296–1302. [Google Scholar] [CrossRef]
- Kolodinsky, J.M. Community Supported Agriculture (CSAs)-Farmers’ Perspective. In The Sage Encyclopedia of Food Issues; Albala, K., Ed.; Sage: Los Angeles, CA, USA, 2015; pp. 204–209. ISBN 978-1452243016. [Google Scholar]
- Bauman, A.; Thilmany, D.; Jablonski, B.B.R. Evaluating scale and technical efficiency among farms and ranches with a local market orientation. Renew. Agric. Food Syst. 2019, 34, 198–206. [Google Scholar] [CrossRef]
- Bauman, A.; Thilmany McFadden, D.; Jablonski, B.B.R. The financial performance implications of differential marketing strategies: Exploring farms that pursue local markets as a core competitive advantage. Agric. Resour. Econ. Rev. 2018, 47, 477–504. [Google Scholar] [CrossRef]
- Jablonski, B.; Perez-Burgos, J.; Gómez, M. Food value chain development in central New York: CNY Bounty. J. Agric. Food Syst. Community Dev. 2011, 129–141. [Google Scholar] [CrossRef]
- Hardesty, S.D.; Leff, P. Determining marketing costs and returns in alternative marketing channels. Renew. Agric. Food Syst. 2010, 25, 24–34. [Google Scholar] [CrossRef]
- LeRoux, M.N.; Schmit, T.M.; Roth, M.; Streeter, D.H. Evaluating marketing channel options for small-scale fruit and vegetable producers. Renew. Agric. Food Syst. 2010, 25, 16–23. [Google Scholar] [CrossRef]
- Christensen, J.; Thilmany, D.; Jablonski, B.B.R.; Sullins, M.; Naasz, E. Assessing market channel performance for Colorado fruit and vegetable producers. J. Food Distrib. Res. 2017, 48, 61–67. [Google Scholar]
- Low, S.A.; Vogel, S. Direct and Intermediated Marketing of Local Foods in the United States; U.S. Department of Agriculture, Economic Research Service: Washington, DC, USA, 2011.
- Park, T.; Mishra, A.K.; Wozniak, S.J. Do farm operators benefit from direct to consumer marketing strategies? Agric. Econ. 2014, 45, 213–224. [Google Scholar] [CrossRef]
- Park, T. Direct marketing and the structure of farm sales: An unconditional quantile regression approach. J. Agric. Resour. Econ. 2015, 40, 266–284. [Google Scholar]
- O’Hara, J.K.; Lin, J. Population density and local food market channels. Appl. Econ. Perspect. Policy 2019. [Google Scholar] [CrossRef]
- Morgan, E.H.; Severs, M.M.; Hanson, K.L.; McGuirt, J.; Becot, F.; Wang, W.; Kolodinsky, J.; Sitaker, M.; Pitts, S.B.J.; Ammerman, A.; et al. Gaining and maintaining a competitive edge: Evidence from CSA members and farmers on local food marketing strategies. Sustainability 2018, 10, 2177. [Google Scholar] [CrossRef]
- Curtis, K.; Allen, K.; Ward, R. Food consumption, attitude, and behavioral change among CSA members: A northern Utah case study. J. Food Distrib. Res. 2015, 46, 3–16. [Google Scholar]
- Flora, C.; Bregendahl, C. Collaborative community-supported agriculture: Balancing community capitals for producers and consumers. Int. J. Soc. Agric. Food 2012, 19, 329–346. [Google Scholar]
- Bauman, A.; Thilmany, D.; Jablonski, B.; Shideler, D. An overview of emerging business models in the local foods landscape. In Smart Marketing; Cornell University: Ithaca, NY, USA, 2015; Available online: http://publications.dyson.cornell.edu/docs/smartMarketing/pdfs/SmrtMkg%20Mar2015.pdf (accessed on 10 May 2019).
- Jablonski, B.B.R.; Schmit, T.M.; Kay, D. Assessing the economic impacts of food hubs on regional economies: A framework that includes opportunity cost. Agric. Resour. Econ. Rev. 2016, 45, 143–172. [Google Scholar] [CrossRef]
- Schmit, T.M.; Jablonski, B.B.R.; Mansury, Y. Assessing the economic impacts of local food system producers by scale: A case study from New York. Econ. Dev. Q. 2016, 30, 316–328. [Google Scholar] [CrossRef]
- Jablonski, B.B.R.; Schmit, T.M. Differential expenditure patterns of local food system participants. Renew. Agric. Food Syst. 2016, 31, 139–147. [Google Scholar] [CrossRef]
- U.S. Department of Agriculture Census of Agriculture (USDA NASS). Table 2: Market Value of Agricultural Products Sold Including Direct Sales: 2012 and 2007; Department of Agriculture: Washington, DC, USA, 2012. Available online: https://www.nass.usda.gov/Publications/AgCensus/2012/Full_Report/Volume_1,_Chapter_2_County_Level/Colorado/st08_2_002_002.pdf (accessed on 22 April 2019).
- Colorado Fruit and Vegetable Growers Association. CSU/CFVGA Report on Labor. 2014. Available online: https://coloradoproduce.org/wp-content/uploads/2013/09/CFVGA.newsletter.July-2014.final_.pdf (accessed on 22 April 2019).
- National Sustainable Agriculture Coalition. 2014 Farm Bill Drilldown: Local and Regional Food Systems, Healthy Food Access and Rural Development. 2014. Available online: http://sustainableagriculture.net/blog/2014-farmbill-local-rd-organic/ (accessed on 22 April 2019).
- Clark, J.; Jablonski, B.B.R. Federal policy, administration, and local food coming of age. Choices 2018, 33, 1–8. Available online: http://www.choicesmagazine.org/choices-magazine/theme-articles/the-promise-expectations-and-remaining-questions-about-local-foods/federal-policy-administration-and-local-food-coming-of-age (accessed on 22 April 2019).
Figure 1.
Example market channel assessment labor log.

Figure 2.
All market channel assessment participants, 2016 and 2017, Colorado.

Figure 3.
Marketing profit margins, by percentile and direct channel.

Figure 4.
Evaluation of risk and reward of market channel engagement. Superscripts on the figure above denote statistical differences in means, where tests were based on pairwise comparisons. The codes defined in the footnote below indicate significant differences between direct market channels and are the findings from combinations of pairwise tests. a CSA and FM, b FM and FS, c FM and Other DM.


Table 1.
Summary of farm characteristics, divided by farms with and without sales through community supported agriculture (CSA) marketing arrangements (n = 37).
Table 1.
Summary of farm characteristics, divided by farms with and without sales through community supported agriculture (CSA) marketing arrangements (n = 37).
| Mean | Minimum | Maximum | Std. Dev. | Coeff. Var. | ||
|---|---|---|---|---|---|---|
| Number of acres | All DM farms | 44.31 | 0.10 | 1500.00 | 246.01 | 5.55 |
| With CSA | 3.10 | 0.10 | 15.00 | 3.77 | 1.22 | |
| No CSA | 98.40 | 0.50 | 1500.00 | 373.82 | 3.80 | |
| Weekly gross revenue ($) | All DM farms | 4447.63 | 166.96 | 62,027.62 | 10,634.91 | 2.39 |
| With CSA | 2173.35 | 304.00 | 6611.20 | 1968.30 | 0.91 | |
| No CSA | 7432.63 | 166.96 | 62,027.62 | 15,796.59 | 2.13 | |
| Experience farming (years) | All DM farms | 10.90 | 1.00 | 50.00 | 11.62 | 1.07 |
| With CSA | 9.41 | 1.00 | 35.00 | 9.96 | 1.06 | |
| No CSA | 13.00 | 1.00 | 50.00 | 13.83 | 1.06 | |
| Age of farm (years) | All DM farms | 9.00 | 1.00 | 100.00 | 18.85 | 2.09 |
| With CSA | 4.75 | 1.00 | 25.00 | 5.74 | 1.21 | |
| No CSA | 14.88 | 1.00 | 100.00 | 27.88 | 1.87 | |
| Total no. market channels in farm’s portfolio | All DM farms | 4.59 | 2.00 | 11.00 | 2.27 | 0.49 |
| With CSA | 4.67 | 2.00 | 11.00 | 2.48 | 0.53 | |
| No CSA | 4.50 | 2.00 | 9.00 | 2.03 | 0.45 |
Note: Std. Dev. refers to the standard deviation. Coeff. Var. stands for the coefficient of variation and is the ratio of the standard deviation to the mean. Pairwise tests revealed no significant differences between the means of variables in the above table, across all DM farms, for farms categorized as CSA and no CSA. DM refers to direct markets.
Table 2.
Summary of market channel characteristics by direct channels (n = 37 farms and 100 direct market channels).
Table 2.
Summary of market channel characteristics by direct channels (n = 37 farms and 100 direct market channels).
| Mean | Minimum | Maximum | Std. Dev. | Coeff. Var. | ||
|---|---|---|---|---|---|---|
| Weekly gross revenues by channel ($) | Direct-all | 804.42 | 10.00 | 17,500.00 | 1914.40 | 2.38 |
| CSA | 637.16 | 40.00 | 4434.00 | 904.90 | 1.42 | |
| FM | 903.27 | 62.25 | 5795.00 | 1098.54 | 1.22 | |
| FS | 963.03 | 10.00 | 17,500.00 | 3535.86 | 3.67 | |
| Other DM | 274.71 | 20.00 | 718.00 | 258.64 | 0.94 | |
| Percentage gross revenue by channel | Direct-all | 0.26 | 0.01 | 0.86 | 0.22 | 0.83 |
| CSA b,c | 0.26 | 0.02 | 0.77 | 0.20 | 0.75 | |
| FM d,e | 0.31 | 0.02 | 0.86 | 0.23 | 0.76 | |
| FS | 0.15 | 0.01 | 0.80 | 0.18 | 1.19 | |
| Other DM | 0.38 | 0.12 | 0.69 | 0.22 | 0.57 | |
| Total marketing hours per channel | Direct-all | 21.42 | 0.08 | 448.84 | 46.18 | 2.16 |
| CSA a | 10.61 | 0.90 | 40.25 | 10.11 | 0.95 | |
| FM e | 26.45 | 6.59 | 92.84 | 18.60 | 0.70 | |
| FS | 27.06 | 0.08 | 448.84 | 90.37 | 3.34 | |
| Other DM | 11.27 | 1.35 | 28.27 | 9.60 | 0.85 | |
| Avg. total round trip distance to market (miles) | Direct-all | 39.75 | 0.00 | 635.00 | 94.13 | 2.37 |
| CSA a | 6.55 | 0.00 | 50.00 | 12.30 | 1.88 | |
| FM | 66.43 | 0.00 | 571.20 | 100.58 | 1.51 | |
| FS | 35.75 | 0.00 | 635.00 | 129.02 | 3.61 | |
| Other DM | 12.86 | 0.00 | 30.00 | 12.20 | 0.95 | |
| Marketing profit margin | Direct-all | 0.30 | −3.30 | 0.97 | 0.77 | 2.58 |
| CSA | 0.55 | −2.23 | 0.92 | 0.64 | 1.17 | |
| FM | 0.26 | −1.29 | 0.87 | 0.56 | 2.19 | |
| FS | 0.39 | −1.10 | 0.97 | 0.56 | 1.41 | |
| Other DM | −0.68 | −3.30 | 0.81 | 1.81 | −2.66 | |
| Sales per labor hour ($) | Direct-all | 46.90 | 3.69 | 400.00 | 54.31 | 1.16 |
| CSA a | 60.29 | 6.46 | 193.51 | 49.63 | 0.82 | |
| FM | 33.03 | 4.56 | 121.04 | 27.02 | 0.82 | |
| FS | 60.19 | 3.69 | 400.00 | 86.23 | 1.43 | |
| Other DM | 36.87 | 4.65 | 121.35 | 42.49 | 1.15 | |
| Profit per labor hour ($) | Direct-all | 32.87 | −15.54 | 388.00 | 54.03 | 1.64 |
| CSA a | 46.18 | −14.43 | 178.51 | 48.85 | 1.06 | |
| FM | 19.31 | −7.97 | 105.47 | 26.19 | 1.36 | |
| FS | 47.47 | −7.85 | 388.00 | 86.18 | 1.82 | |
| Other DM | 16.62 | −15.54 | 98.46 | 41.17 | 2.48 |
Note: Std. Dev. refers to the standard deviation. Coeff. Var. stands for the coefficient of variation and is the ratio of the standard deviation to the mean. Superscripts denote statistical differences in means, where tests were based on pairwise comparisons. The codes defined in the footnote below indicate significant differences between direct market channels and are the findings from combinations of pairwise tests. a CSA and FM, b CSA and FS, c CSA and Other DM, d FM and FS, e FM and Other DM
Table 3.
Labor utilization by direct market outlet and activity.
| Total Weekly Marketing Hours | Harvest (% of All Hours) | Process/pack (% of All Hours) | Transport & Delivery (% of All Hours) | Sales & Bookkeep. (% of All Hours) | |
|---|---|---|---|---|---|
| Direct-all | 21.42 | 41% | 19% | 10% | 30% |
| CSA | 10.61 | 48% | 22% | 11% | 19% |
| FM | 26.45 | 36% | 13% | 11% | 40% |
| FS | 27.06 | 45% | 21% | 8% | 26% |
| Other DM | 11.27 | 28% | 42% | 14% | 16% |
© 2019 by the authors. Licensee MDPI, Basel, Switzerland. This article is an open access article distributed under the terms and conditions of the Creative Commons Attribution (CC BY) license (http://creativecommons.org/licenses/by/4.0/).
Share and Cite
MDPI and ACS Style
Jablonski, B.B.R.; Sullins, M.; Thilmany McFadden, D. Community-Supported Agriculture Marketing Performance: Results from Pilot Market Channel Assessments in Colorado. Sustainability 2019, 11, 2950. https://doi.org/10.3390/su11102950
AMA Style
Jablonski BBR, Sullins M, Thilmany McFadden D. Community-Supported Agriculture Marketing Performance: Results from Pilot Market Channel Assessments in Colorado. Sustainability. 2019; 11(10):2950. https://doi.org/10.3390/su11102950
Chicago/Turabian StyleJablonski, Becca B. R., Martha Sullins, and Dawn Thilmany McFadden. 2019. "Community-Supported Agriculture Marketing Performance: Results from Pilot Market Channel Assessments in Colorado" Sustainability 11, no. 10: 2950. https://doi.org/10.3390/su11102950
Note that from the first issue of 2016, this journal uses article numbers instead of page numbers. See further details here.