1. Introduction
Traffic congestion, safety, pollutant emissions, and fuel consumption have become increasingly severe issues all over the world [
1,
2]. From the perspective of components in the transport system, trucks play an important role in the abovementioned serious problems that need to be solved urgently [
3,
4]. Although trucks only account for approximately 4% of all the traffic accidents and 12% of all traffic fatalities based on the Federal Railway Administration (FRA) database, truck-related accidents lead to many more deaths, injuries, and much more property loss than other vehicles [
5,
6]. Besides, trucks consume considerable amounts of energy and are the biggest source of air pollutant emissions every year [
7,
8]. Fortunately, growing attention has been paid to these problems through the application of Intelligent Transportation Systems (ITS) technology. There are several technologies among the sub-systems of ITS to address the problem, including the Advanced Traffic Management System (ATMS), Advanced Vehicle Control and Safety System (AVCSS), Advanced Traveler Information System (ATIS), and Automated Highway System (AHS) [
9,
10]. Based on guidance of ITS and its sub-systems, the literature review is summarized in three parts, including multilane separate freeways, a guidance strategy, and cooperative vehicle-to-infrastructure (V2I) technology, which are all factored into the construction of the ITS framework for the study area.
1.1. Multilane Separate Freeway
In a freeway traffic management system, the concept of separation denotes a measure of diverging one homogenous traffic stream to one or more exclusive lanes from the hybrid traffic flow. Two typical representatives are the high-occupancy-vehicle (HOV) lanes in expressways and bus-only lanes in urban roads. To satisfy increasing logistics demands, freeways are faced with the linear growth of trucks [
11]. Nevertheless, large trucks are thought to present safety hazards in mixed traffic because of their decreased stopping capabilities, lack of maneuverability, and large size, which occupies more lane space and blocks motorists’ visibility [
12]. To improve efficiency and safety, lane restrictions on trucks to reduce their interaction with passenger cars is applied to road design and management. These restrictions typically prohibit trucks from traveling in the median or left-most lanes of multilane freeways, instead of compulsively separating them on their own lanes [
13,
14,
15,
16]. Based on the above considerations, a brand-new organization mode of freeway traffic is designed to completely separate trucks from the hybrid traffic flow, and this mode is called ‘multilane separate freeways’.
Recent studies on separate freeway mostly focus on truck lane restriction strategies. Meyer et al. [
13] examined the feasibility of truck-only toll (TOT) lanes as parts of the Atlanta in America. There are three TOT lane strategies designed for the regional freeway network: building new lanes along major truck corridors, allowing trucks to use existing HOV lanes inside the central area, and turning all proposed HOV lanes in the region into TOT lanes. Based on comprehensive analysis of five primary performance measures, this proof-of-concept study proved that the third strategy provided the greatest transportation benefit to the region. Also, Bigazzi et al. [
17] studied the emissions benefits of commercial vehicle lane management strategies, especially truck-only lanes (TOLs). TOL strategies consistently outperformed general purpose lane strategies in regard to total emissions reductions. Converting a general purpose lane to TOL reduced emissions more than adding a new TOL for all pollutants except hydrocarbons (HC). Lord et al. [
18] compared passenger cars-only with mixed traffic freeway facilities and assessed whether or not more homogeneous traffic flow composed of vehicle types was safer than the current mixed flow scenario using the data collected from the New Jersey Turnpike in 2002, which was also a typical traffic corridor. Besides, when the accidents happened, separating trucks from cars to create more homogeneous traffic conditions was demonstrated to be an alternative strategy. Moreover, existing fee policies related to truck lane restrictions were analyzed and characterized the state of the practice in permit fees for trucks on public freeways, evaluating these practices at the economic level [
19]. Other aspects of related research include emissions, safety, fuel consumption, pavement performance, and characteristics of truck drivers [
20,
21,
22,
23,
24]. Readers can refer to the above-mentioned literature for more details. In general, little attention has been paid to systematically analyzing multilane separate freeways both for cars and trucks.
1.2. Guidance Strategy at Toll Station Area
Advanced guidance strategy is an important part of AVCSS and ATIS. Although no research has been conducted to specifically explore the guidance strategy for separate freeways, existing research related to route guidance and drivers’ characteristic offers theoretical references for strategy development, especially at toll station areas. The
Manual on Uniform Traffic Control Devices (MUTCD) [
25] specifies the standards by which traffic signs, road surface markings, and signals are designed, installed, and used. Liu et al. In [
26], they investigated the contributory factors to the guessability of traffic signs and provided practical suggestions for more user-friendly sign design and settings based on the MUTCD. Ozbay et al. [
27] proposed a microscopic simulation model, which was validated and calibrated using the detailed vehicle-by-vehicle toll data at each toll plaza in the same area, as shown in [
18]. Additionally, another micro-simulation model for optimizing toll plaza operations in relation to operational costs and level of service for users was developed and several scenarios were tested in the Vissim platform, such as implementing a number plate recognition technology and segregating lanes for different vehicle types [
28]. Furthermore, Kim et al. [
29] presented an analytical method for dynamically adjusting toll plaza capacity to cope with a sudden shift in demand using loop detector data. Emissions around a toll station area were also analyzed in both electronic toll collection (ETC) lanes and manual toll collection (MTC) lanes [
30]. The results showed that all emissions were reduced by using ETC, and the reduction in nitrogen oxide (NO
x) emission was much less than hydrocarbons (HC) and carbon monoxide (CO) for the testing vehicle. In terms of guidance strategy, most of the existing models achieved user optimal equilibrium by comparing travel time from the angle of road network. For example, a traffic-condition-based route guidance strategy for a single destination road network was proposed, which provided stable splitting rates, in particular when traffic demand was high [
31]. Therefore, a reasonable guidance strategy needs to be designed to separate cars and trucks safely and effectively at toll stations in the multilane separate freeway.
1.3. Traffic Flow in V2I Environment
For the AHS, the other sub-systems and intelligent vehicles are all fundamental preparations for the construction of advanced highways. With the rapid development of vehicular technology, hi-tech manufacturing facilities are equipped in connected and automated vehicles (CAVs) to improve road capacity and traffic safety [
32,
33,
34]. Meanwhile, vehicle-to-infrastructure (V2I) communication is available if the road-side unit (RSU) can share information with the vehicles with on-board unit (OBU) [
35,
36,
37]. In this case, these advanced technologies will enhance traffic efficiency and safety. The V2I communication system was evaluated in architecture based on cellular networks and a novel communication paradigm was presented for vehicles in V2I environment [
38]. Milanés et al. [
39] designed an intelligent V2I-based traffic management system and the proposed solution was validated by an IEEE-802.11p-based communications study. The entire system showed good performance in testing real-world scenarios, both in computer simulation and with real vehicles.
Shladover et al. analyzed the advantages of cooperative adaptive cruise control (CACC) based on cooperative communication including higher accuracy, faster response, and shorter gaps, resulting in enhanced traffic flow stability and possibly improved safety [
40]. Li et al. developed a V2I integrated system that incorporated both adaptive cruise control (ACC) and variable speed limit (VSL) to reduce rear-end collision risks on freeways [
41,
42], and the intelligent driver model (IDM) was used to simulate intelligent vehicles’ behavior [
41,
42,
43,
44]. Moreover, Dey et al. demonstrated the potential of V2I in a heterogeneous wireless network with variable communication techniques that guaranteed the optimal utilization of available communication options and minimized the corresponding backhaul communication infrastructure requirements while considering CAV application requirements [
45]. A longitudinal freeway merging control algorithm was proposed for maximizing the average travel speed of fully CAVs based on the V2I communications as well as automated driving. The new method was able to reduce travel time, increase average travel speed, and improve throughput [
46]. Other related studies on next-generation traffic characteristics can be found in [
47,
48,
49,
50]. However, the V2I technology has not been investigated at toll station areas, let alone multilane separate freeways.
1.4. Objectives of This Study
The efficient movement of passengers and freights is essential to the national economy. Therefore, the main objective of this study is to comprehensively assess multilane freeways, which separate trucks and passenger-cars completely. Although published literature has extensively studied the above issues, some clear gaps still need to be further addressed. First of all, most previous scholars focused on recommended TOLs instead of compulsory lanes for different vehicles. Secondly, guidance strategy at toll station areas is ignored, especially for multilane separate freeways. Thirdly, the cooperative V2I technology needs further exploration at toll station areas of multilane separate freeways. To fill the gaps, this study proposes a general configuration and segmentation of multilane separate freeways near a toll station. Next, a six-step guidance strategy is designed to adapt to the new organization mode. Then, six traffic scenarios are set and modeled in Vissim and MATLAB platforms for comparative analysis at Huludao Toll Station in Liaoning Province, China. Finally, features of each scenario is summarized based on the comprehensive assessment including speed, delay, surrogate safety measures, air emission, and fuel consumption.
3. Experiment Design
3.1. Framework
Figure 3 presents the framework of study approach, which includes data collection, roadway modeling, experiment design, traffic simulation, assessment index, and result analysis.
First, geometric data and organization forms of the conventional and separate freeways are collected. The characteristics of traffic flow are also needed in this paper, such as service time in toll channel, number of channels, speed distribution, and limit speed. Moreover, demand of cars and trucks is another important parameter, which can be extracted from the transportation science and technology projects of Liaoning Province, where the study area is located. Based on the collected data, virtual models of old and new roadways and toll stations are built via Auto-CAD software. The third step is experiment design, e.g., lane settings and guidance strategy. For the lane settings, speed limit and directions of lane-changing for each lane should be set in advance besides the number of cars-only and trucks-only lanes. Next, the proposed hierarchical guidance strategy is developed step by step in Vissim. The details are discussed in the following sub-section. Numerical simulation experiments for cooperative vehicle-to-infrastructure environment are investigated in MATLAB for the sake of convenience in car-following and lane-changing model implementation. Then, four kinds of indexes are used to assess the performance of different guidance strategies and traffic scenarios, including efficiency, safety, emissions, and fuel consumption. Finally, comparative analysis is conducted based on experiment results to quantify the effects of separate organization for vehicles and cooperative V2I technology on the traffic system near toll stations.
3.2. Study Area
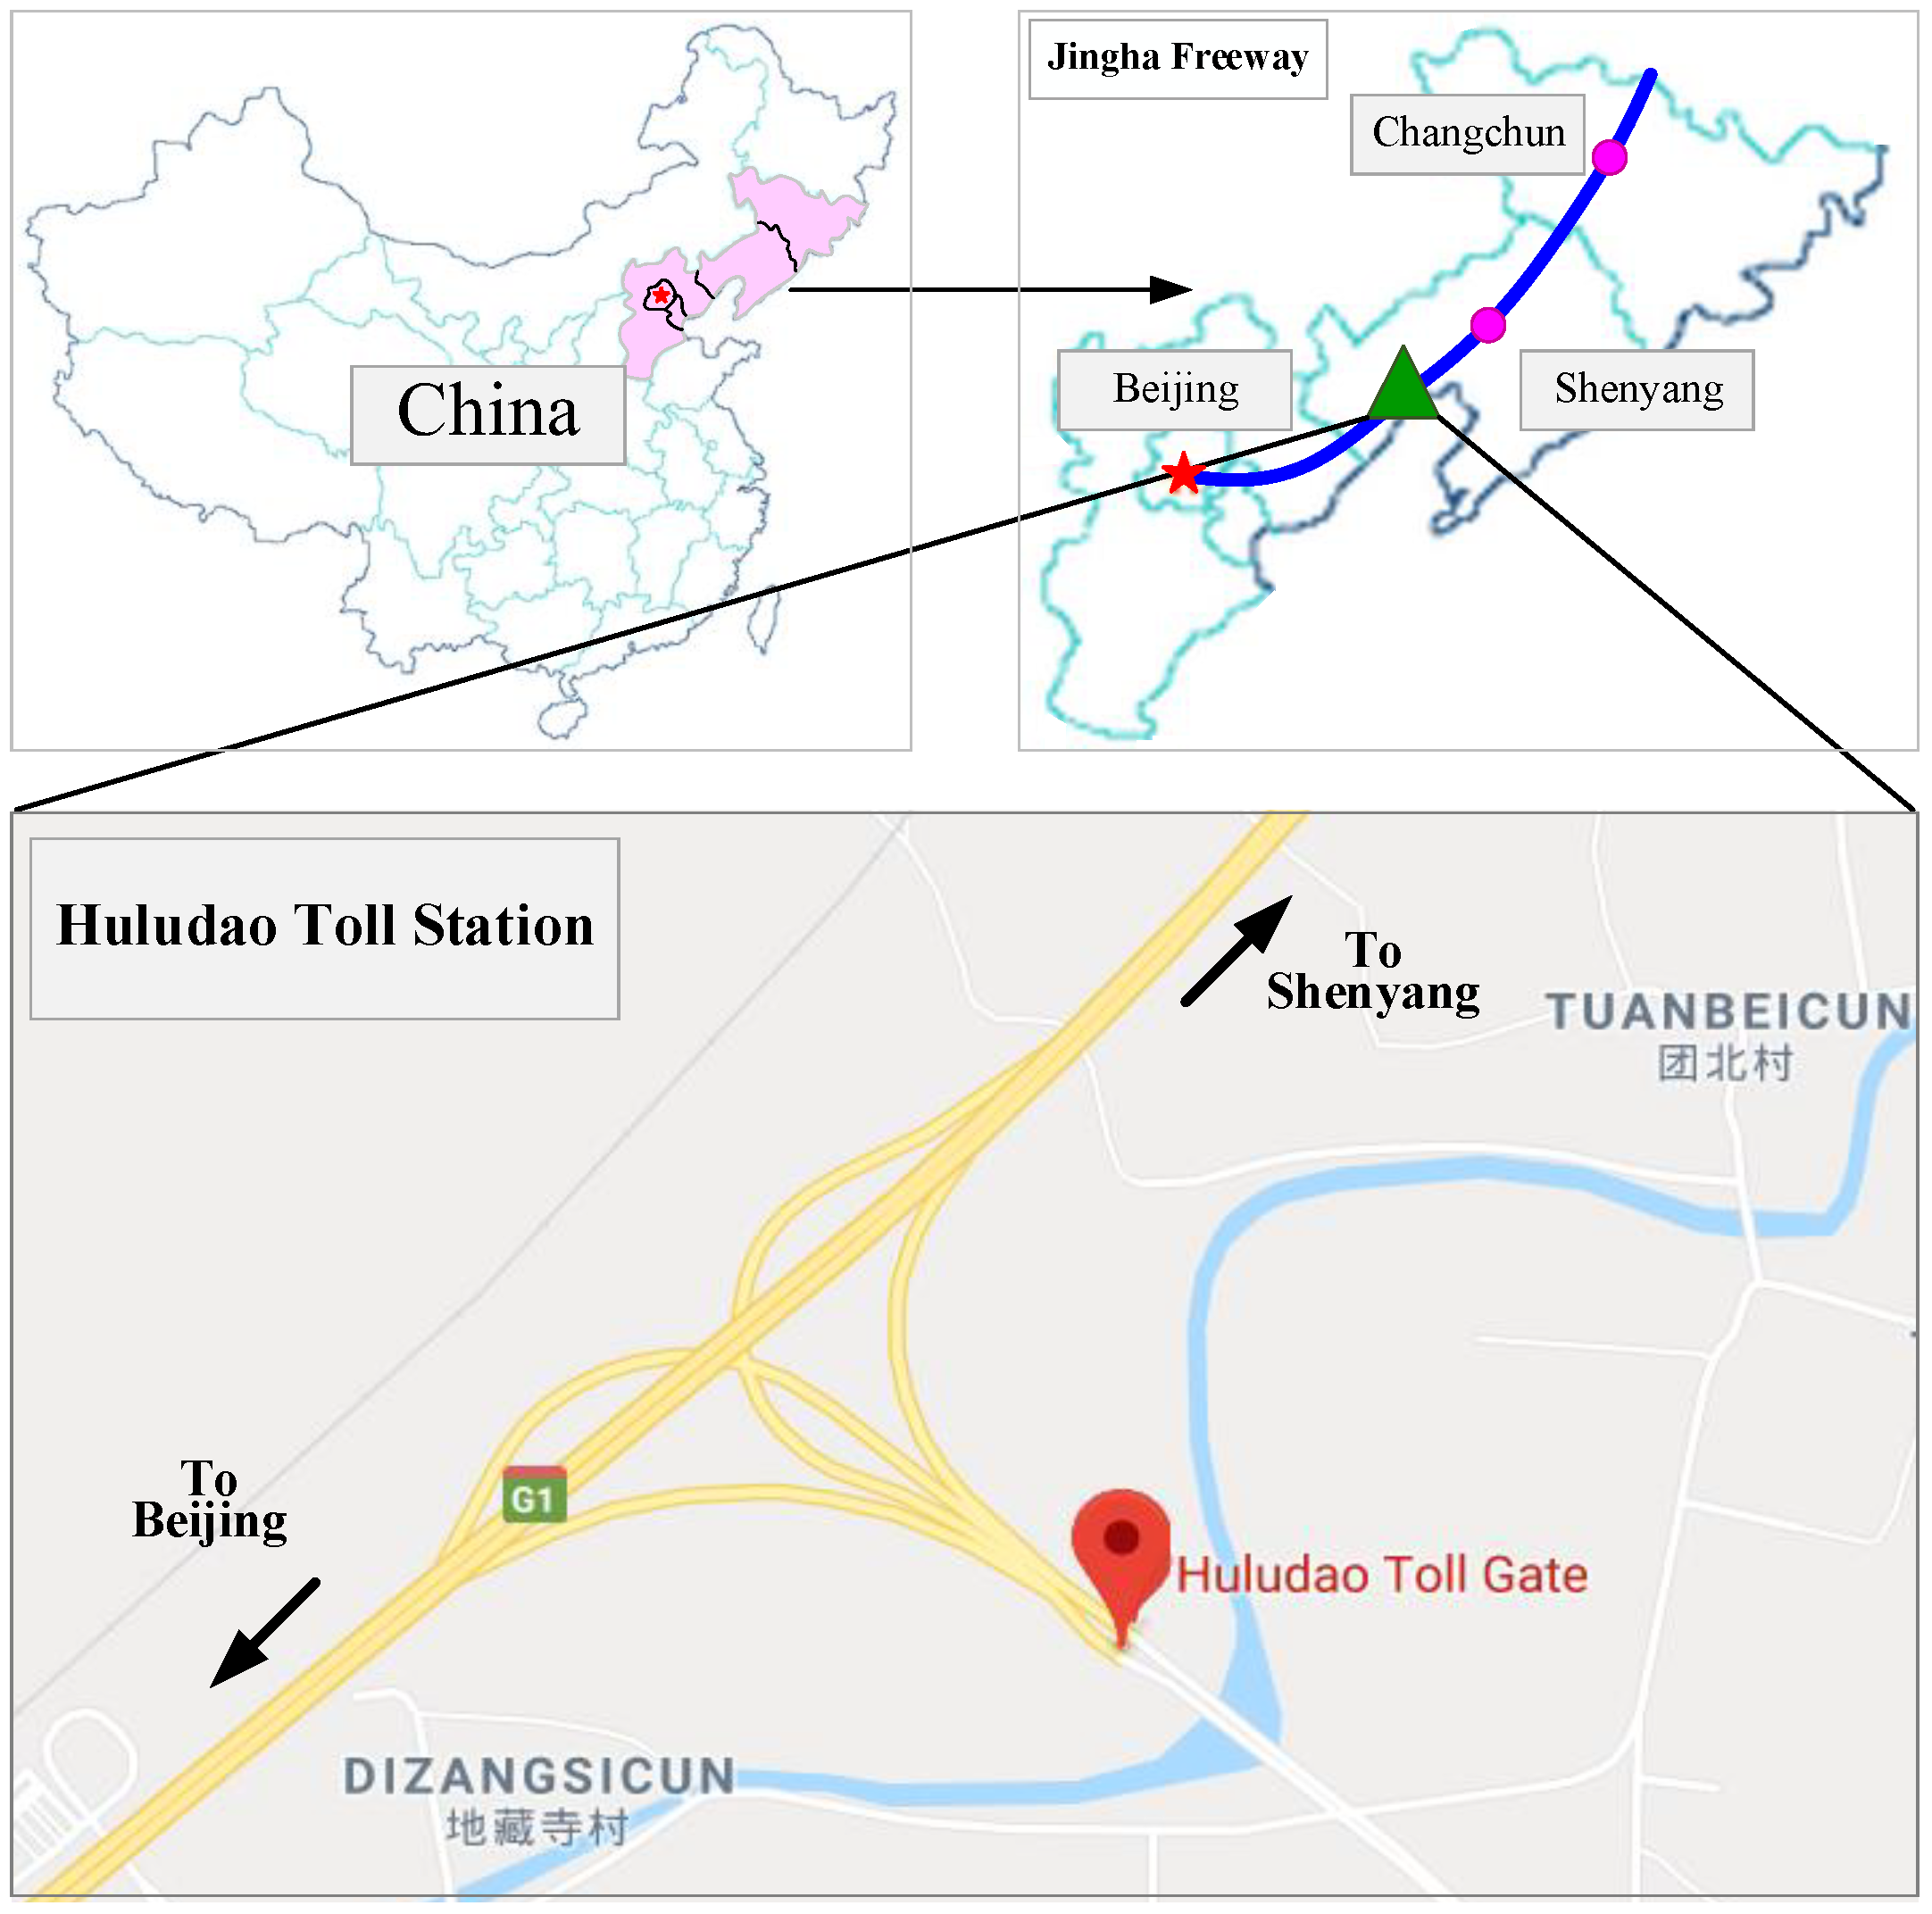
With the rapid progress of the economy and technology in recent years, the international macroeconomic situation changes continuously. The Silk Road Economic Belt and the 21st-Century Maritime Silk Road bring a great opportunity for old industrial base revitalization in the northeast of China. However, transport is the foundation of the development of various industries, and an advanced transport system needs to adapt to changing demands, such as high freight rates, stricter security standards, and people-oriented service. Jingha Freeway is an important corridor linking Beijing and Harbin both for passengers and freights, and the section between Shenyang and Beijing reaches the highest peak load, as shown in
Figure 4. To make the freeway more efficient and much safer, national and provincial transport departments plan to reconstruct the freeway into a separate type.
In Jingha Freeway, Huludao Toll Station is a representative example of the reform project. For each direction, there are three lane for cars and trucks at the present time, but three passenger-car lanes and truck-only lanes are designed in the long-term plan. Moreover, relative guidance strategies and potential cooperative V2I facilities will be applied at the toll station. Before starting construction, transport engineers need to prove that it is effective and reliable. Therefore, this paper focuses on the assessment of a multilane separate freeway from different aspects and finding the optimal guidance strategy at toll station area. Also, CAVs in cooperative V2I environment need a further investigation in multilane separate freeways of the brand-new organization mode.
3.3. Vissim Modeling
After two decades of academic research, behavior-based traffic flow simulator Vissim has been considered as one of the best microscopic programs to analyze and optimize traffic flows. It offers a wide variety of urban and freeway applications, integrating public and private transportation. In this paper, the subject is multilane freeways at toll station areas, and
Figure 5 presents the main visualization procedure of Vissim modeling.
First of all, import Auto-CAD maps from external resources and model old and new roads. Then, facilities for guidance strategy are implemented in 3D vision, laying the groundwork for the following steps. Both dynamic and static 3D objects are modeled directly in V3DM module and dynamic models like VMS boards are controlled by Visual Basic codes to display changeable information. Next, route choice setting is a fundamental step, which determines lane-changing behaviors and rights of each lane. For example, the vehicle category ‘truck’ is not allowed for left lane changes on multilane links and does not oscillate around its desired speed, while the ‘car’ category cannot change to right lanes from toll plaza to weaving area. In this case, cars and trucks can travel at proper speeds under different conditions via speed control. Finally, a complete simulation-based environment is implemented using the COM program interface in VISSIM. With the control strategy, the guidance information could be provided to vehicles and effectively influence car-following and lane-changing maneuvers.
3.4. Investigation and Scenario Design
To assess the impacts of the proposed guidance strategy and V2I environment on the freeway system at toll station area, six traffic scenarios are designed in the investigations, as summarized in
Table 4.
In terms of old freeway, there are three lanes in one direction upstream and downstream of Huludao Toll Station with four channels. In the long-term planning for the toll channels of multilane separate freeway, there are three ETC lanes and two MTC lanes in Scenario 2–5, as shown in
Figure 1. The number of ETC lanes rises to four in cooperative V2I environment and the last one is designed for MTC for the sake of diversity and compatibility. Certainly, Scenario 1 contains mixed traffic freeway facilities and mixed vehicle types. It is firstly simulated as the reference group. Under Scenario 2, a separate freeway is designed for the speedy movement of passengers and cargo. Cars and trucks equally share six lanes in one direction. However, there is no guidance technique applied in this scenario except vehicle permission settings at the start of basic separate section (Section V in
Figure 1). Based on Scenario 2, the last three steps of hierarchical guidance strategy are implemented in Scenario 3. On the contrary, to find the difference in guidance order, only the first three steps are used to guide cars and trucks under Scenario 4. Next, the six-step guidance strategy is logically implemented in Scenario 5. It also can be recognized as a combination of Scenario 3 and Scenario 4. Finally, new traffic flow models are chosen to imitate CAVs and simulate the V2I environment in separate freeways on MATLAB platform in Scenario 6.
According to actual surveys and design plans, the road width is 3.75 m. Volumes of cars and trucks are 2400 veh/h and 2000 veh/h, respectively. Desired speeds of cars and trucks are respectively 120 km/h and 100 km/h. Mixed section and basic section in
Figure 1 are 1500 and 1000 m long, respectively. The length of toll plaza, toll channels, weaving area, and basic section is respectively equal to 250, 50, and 200 m. Each simulation lasted 1 h with a time step of 0.1 s. For each scenario, speeds and positions of every vehicle are stored, and average speed, delay, and queue length are directly calculated by Vissim. Furthermore, traffic conflict analysis is accomplished using the Surrogate Safety Assessment Model (SSAM). The other assessment indexes are calculated from raw data generated by Vissim and MATLAB. Additionally, the versions of Vissim and MATLAB used in numerical experiments are respectively V5.40 and R2014b.
4. Results and Discussion
4.1. Average Speed
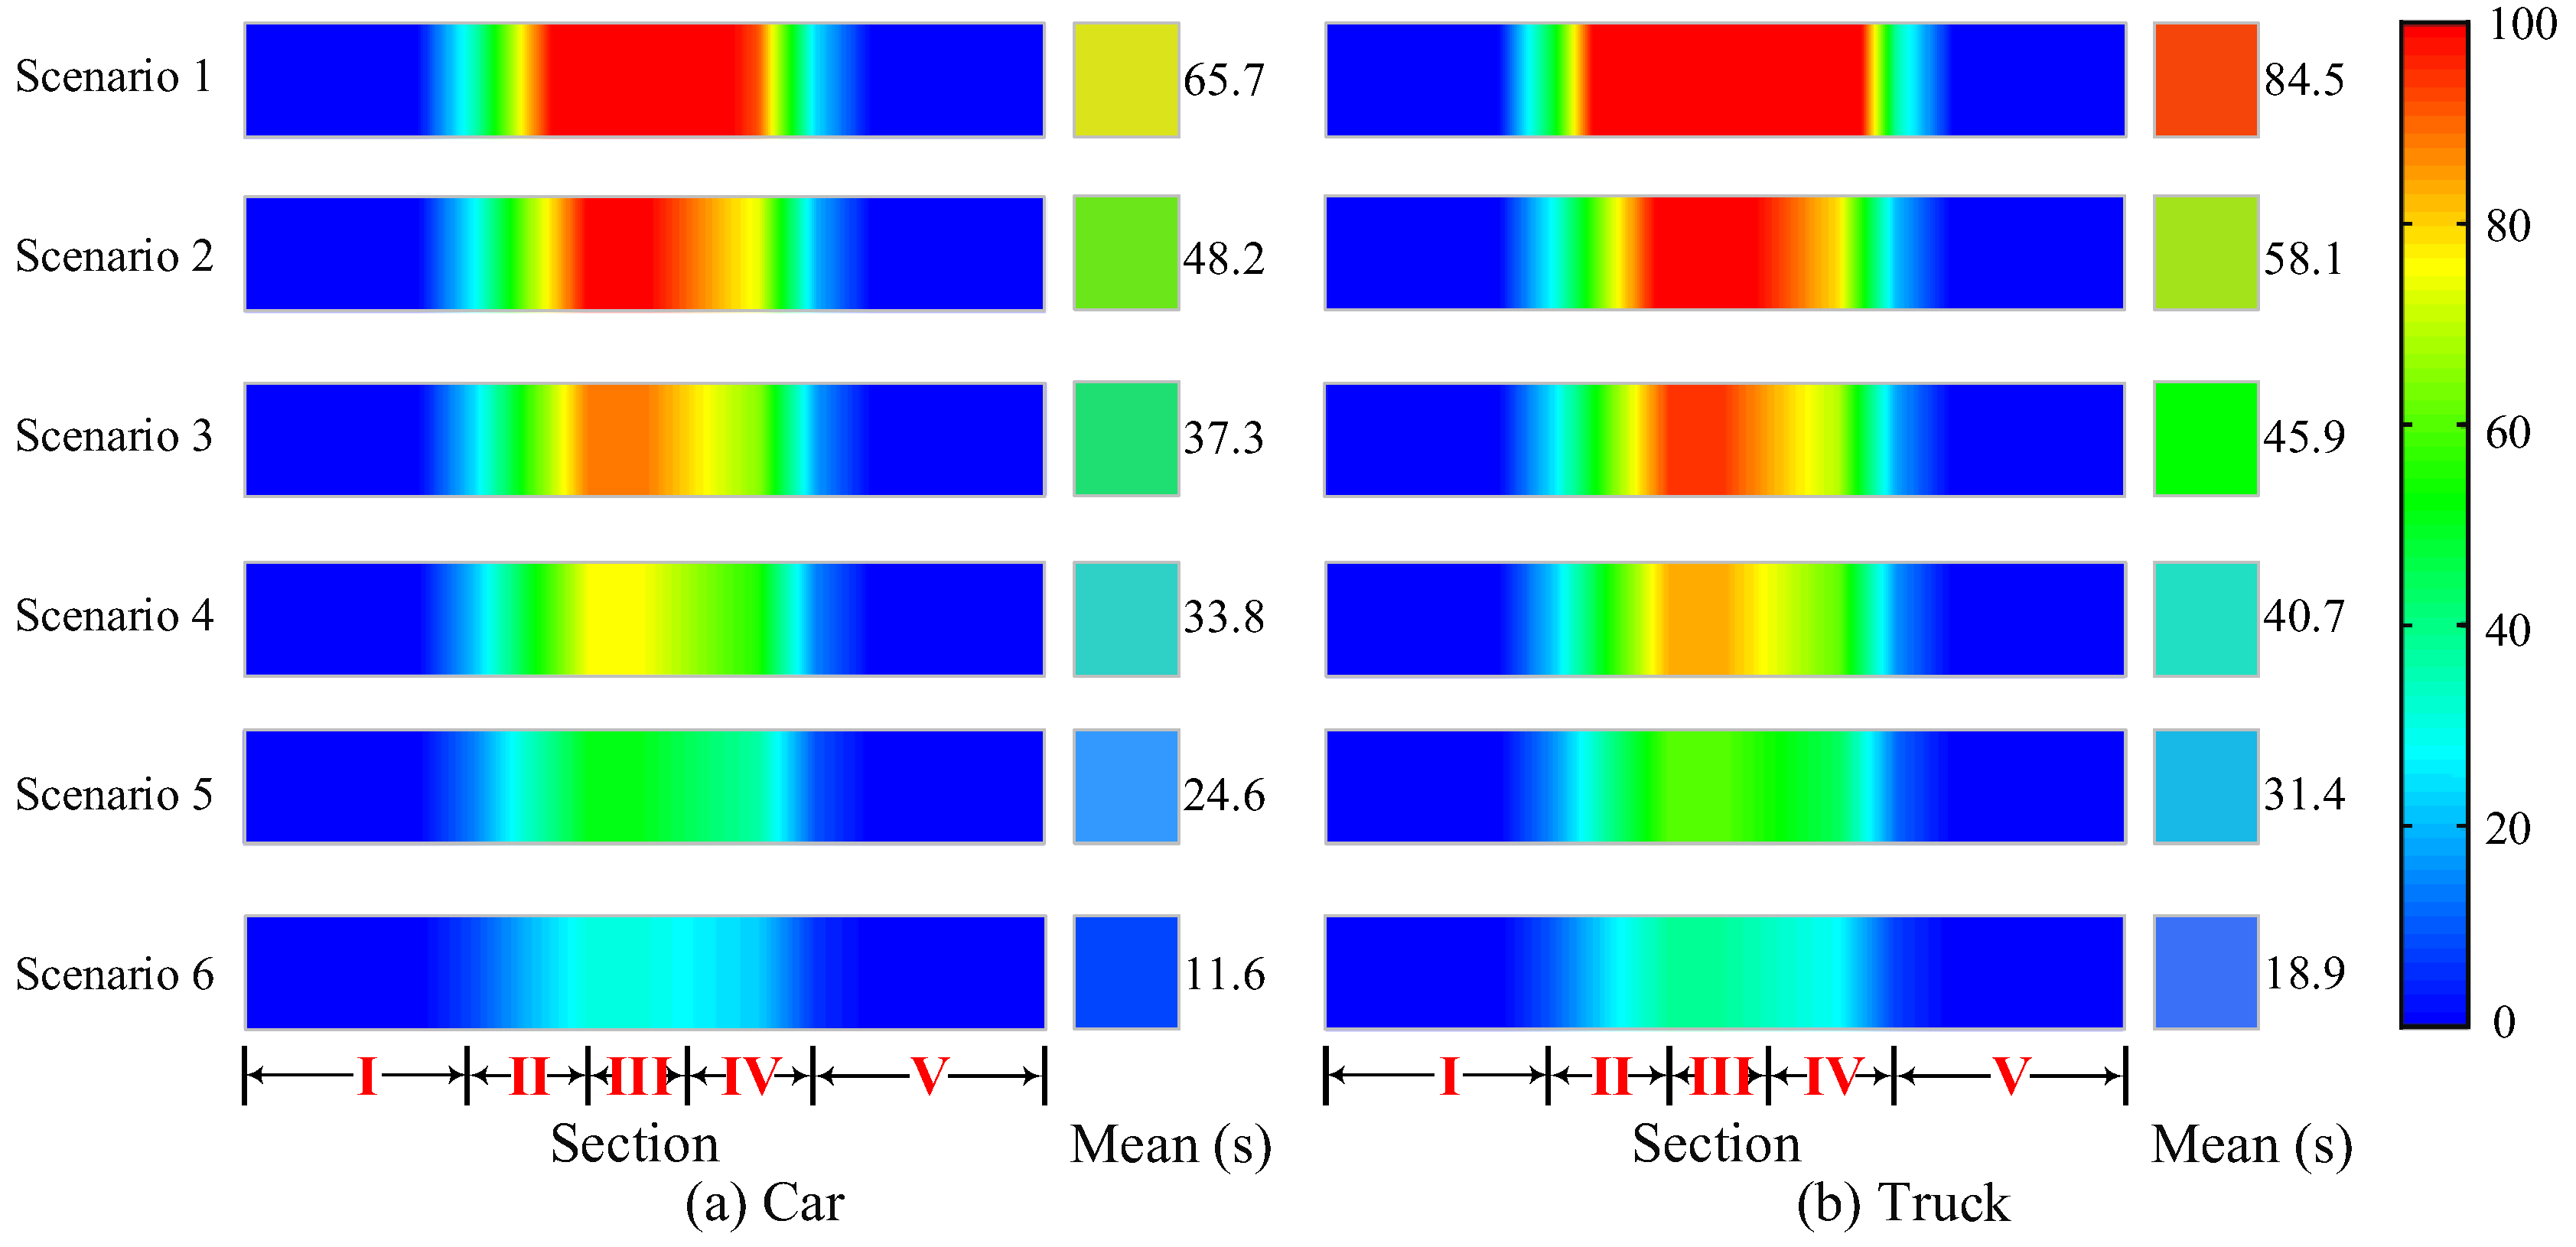
The mean speed distribution in five sections is shown in
Figure 6. The lines in each scenario can be divided into two parts. First, the speed decreases rapidly before vehicles approach to the toll channels. The phenomenon of deceleration in toll plaza is much clearer than mixed section. Second, after reaching the lowest point in toll channels, vehicles start to accelerate to leave the weaving area and pursue the desired speed. There is slower improvement of mean speed in basic section and vehicles tend to travel at stable high speeds. Obviously, the mean speed in the basic section is over 10 km/h higher than the mixed section because of more lanes and a separate organization mode. Both cars and trucks have the similar tendency.
Figure 6a shows the mean speed changes of cars along the roadway. Basically, the mean speeds in all sections rank as the order of scenario from 1 to 6. The original speed under Scenario 1 is around 70 km/h while the highest speed exceeds 90 km/h under Scenario 6. In the basic section, the mean speed increases to 90 km/h under Scenario 1, but it is still 20 km/h lower than Scenario 6. This is because there are three more lanes in Scenario 6, especially in basic section. Also, communication between vehicles and road side infrastructure helps to make full use of road resources in time and space, thus improving traffic efficiency. For the other scenarios, differences of mean speed are less than 10 km/h. It is worth noting that there is small gap between Scenario 3 and Scenario 4 in mixed section and toll plaza, while the gap becomes bigger in weaving area and basic section of separate freeway. This change proves that guidance ahead of toll channels in Scenario 3 have a slight advantage in improving speed over Scenario 4. In the toll channels, the average speed in Scenario 6 is obviously higher than the other five scenarios because of shorter headway and less delay in ETC lanes. For Scenarios 2–5, the only difference is traffic flow composition in each lane resulting from different guidance strategies. If passenger-cars account for a higher proportion before reaching a toll channel, the average speed will be higher. On the contrary, the traffic flow mixed with cars and trucks obtains a relatively low efficiency. Therefore, according to the guidance strategy in
Section 3.4, the full six-step guidance strategy in Scenario 5 is the most efficient method, followed by Scenario 4 and 3, and Scenario 2 without any guidance measures performs the worst in separating cars/trucks from hybrid traffic flow.
Compared with cars, trucks slow down in each section under all scenarios, as shown in
Figure 6b. In the mixed section, no scenario achieved a high speed of over 80 km/h, which Scenario 3–4 realize for cars. Because of speed limit, trucks travel in basic section at a speed range from 70 km/h to 90 km/h. Although it is approximately 20 km/h lower than cars, it is increased by the same speed from mixed section to basic section. The differences between six scenarios reach the peak in toll channels and the maximum value is nearly 30 km/h for Scenario 1 and Scenario 6, which indicates that new technologies help to mitigate congestions and improve traffic efficiency. These results strongly support the superiority of CAVs and V2I technologies. Moreover, the difference between two adjacent scenarios ranges from 5 km to 10 km/h, which demonstrates that guidance strategy is necessary at toll station area and upfront guidance works more effectively.
The following is detailed analysis of speed in mean and standard deviation (SD), as shown in
Table 5 and
Figure 7. The minimum speed remains zero from Scenario 1 to Scenario 5 due to the service time at toll channels. In the longer term, the ETC in the toll system have replaced the MTC. In this case, CAVs only need to decelerate instead of stopping and queuing, and finish toll collection process in several seconds. Therefore, the minimum speeds for cars and trucks are 31.6 km/h and 24.1 km/h. For the maximum and mean values, the order is from Scenario 1 to Scenario 6. That is to say, the separate freeway performs better than the mixed one. Also, the more steps of guidance strategy, faster vehicles travels through the toll station. SD, an index of dispersion, indicates the equilibrium state of traffic flow. As shown in
Table 5, the SD value for cars keeps declining from 25.1 km/h to 10.3 km/h with the application of separate organization mode and guidance strategy. For trucks, the maximum SD change in amplitude is more than 16 km/h. Eventually, SD of speed under Scenario 6 is approximately equal to half of Scenario 1. This is because CAVs and V2I can remarkably avoid oscillatory jams and guarantee a steady traffic state.
To this end, we further investigated the relationship of percentage change between mean speed and its SD, as shown in
Figure 7. Compared with Scenario 1, the percentage of mean change increases continuously from Scenario 2 to Scenario 6, and shares the same tendency with SD. Also, cars are extremely consistent with trucks in both mean and SD changes. However, it is noteworthy that the improvement for cars is lower than trucks, especially under Scenario 5 and Scenario 6. Therefore, cars are more sensitive to new technologies in guidance and V2I. Specifically, for the changes in amplitude, the SD is higher than the mean by over 12 percent for passenger-car traffic, while the difference between SD and mean for trucks is around 10 percent, even less than 5 percent under Scenario 2 and Scenario 3. Furthermore, apart from SD change for cars and trucks, the other pairs of SD and mean changes for cars and trucks are closer to each other under the same scenario. For instance, the SD changes for cars and trucks are respectively 40% and 39%, while the mean changes are 29% and 32% under Scenario 5. This finding explains that the proposed guidance strategy has equivalent positive impact on both cars and trucks.
4.2. Delay and Queue Length
Delay caused by congestions and toll collection facilities is a critical factor in evaluating the efficiency of guidance strategy and transportation infrastructures. Reduction of delay in transportation system is a major purpose of the reconstruction project at Huludao Toll Station. Hence, delay and queue length are chosen as important indexes to assess the multilane separate freeway at toll station area and V2I environment.
As shown in
Figure 8, the distribution of delay follows a unimodal distribution. The delay in mixed section and separate section is sufficiently small, while it gathers around the middle three sections, including toll plaza, toll channels, and weaving area. Generally, the single peak appears in toll channels due to toll collection service. Obviously, it significantly reduces the efficiency of traveling through the toll station area. Furthermore, the influence areas of six scenarios are pretty different from each other. For car traffic under Scenario 1, the high delay-bandwidth almost occupies full sections from II to IV, which is twice as broad as Scenario 3. In contrast, there is no high delay for cars since the first three strategies are applied in Scenario 4, while no high delay for trucks occurs in Scenario 5 and Scenario 6. Besides, the length of the high-delay concentrated area for trucks in Scenario 1 extends even beyond the boundaries of Section II and IV. In this case, congestions and queues tend to propagate upstream and have negative impact on freeway mainlines.
The mean delay is also investigated quantitatively. The highest delay is 84.5 s and obtained in truck traffic under Scenario 1, while the lowest delay is 11.6 s caused in Scenario 6 for cars. For the same type of vehicles, the biggest gap in delay is approximately one minute. The smallest difference between two scenarios is less than 6 s, which happens in Scenario 3 and Scenario 4. It is evident that the mean delay of trucks is higher 7–20 s than cars under the same scenario. Meanwhile, new freeway organization and V2I environment have a tendency in narrowing the gap. For example, the mean differences between cars and trucks under Scenario 5 and Scenario 6 are respectively 6.8 s and 7.3 s, while the corresponding number is 18.8 s under Scenario 1. The dynamic changes in delay also prove that new technologies of freeway organization mode and V2I show clear advantages of dissipating traffic congestion and reducing travel delay, providing theoretical basis for automated highway management.
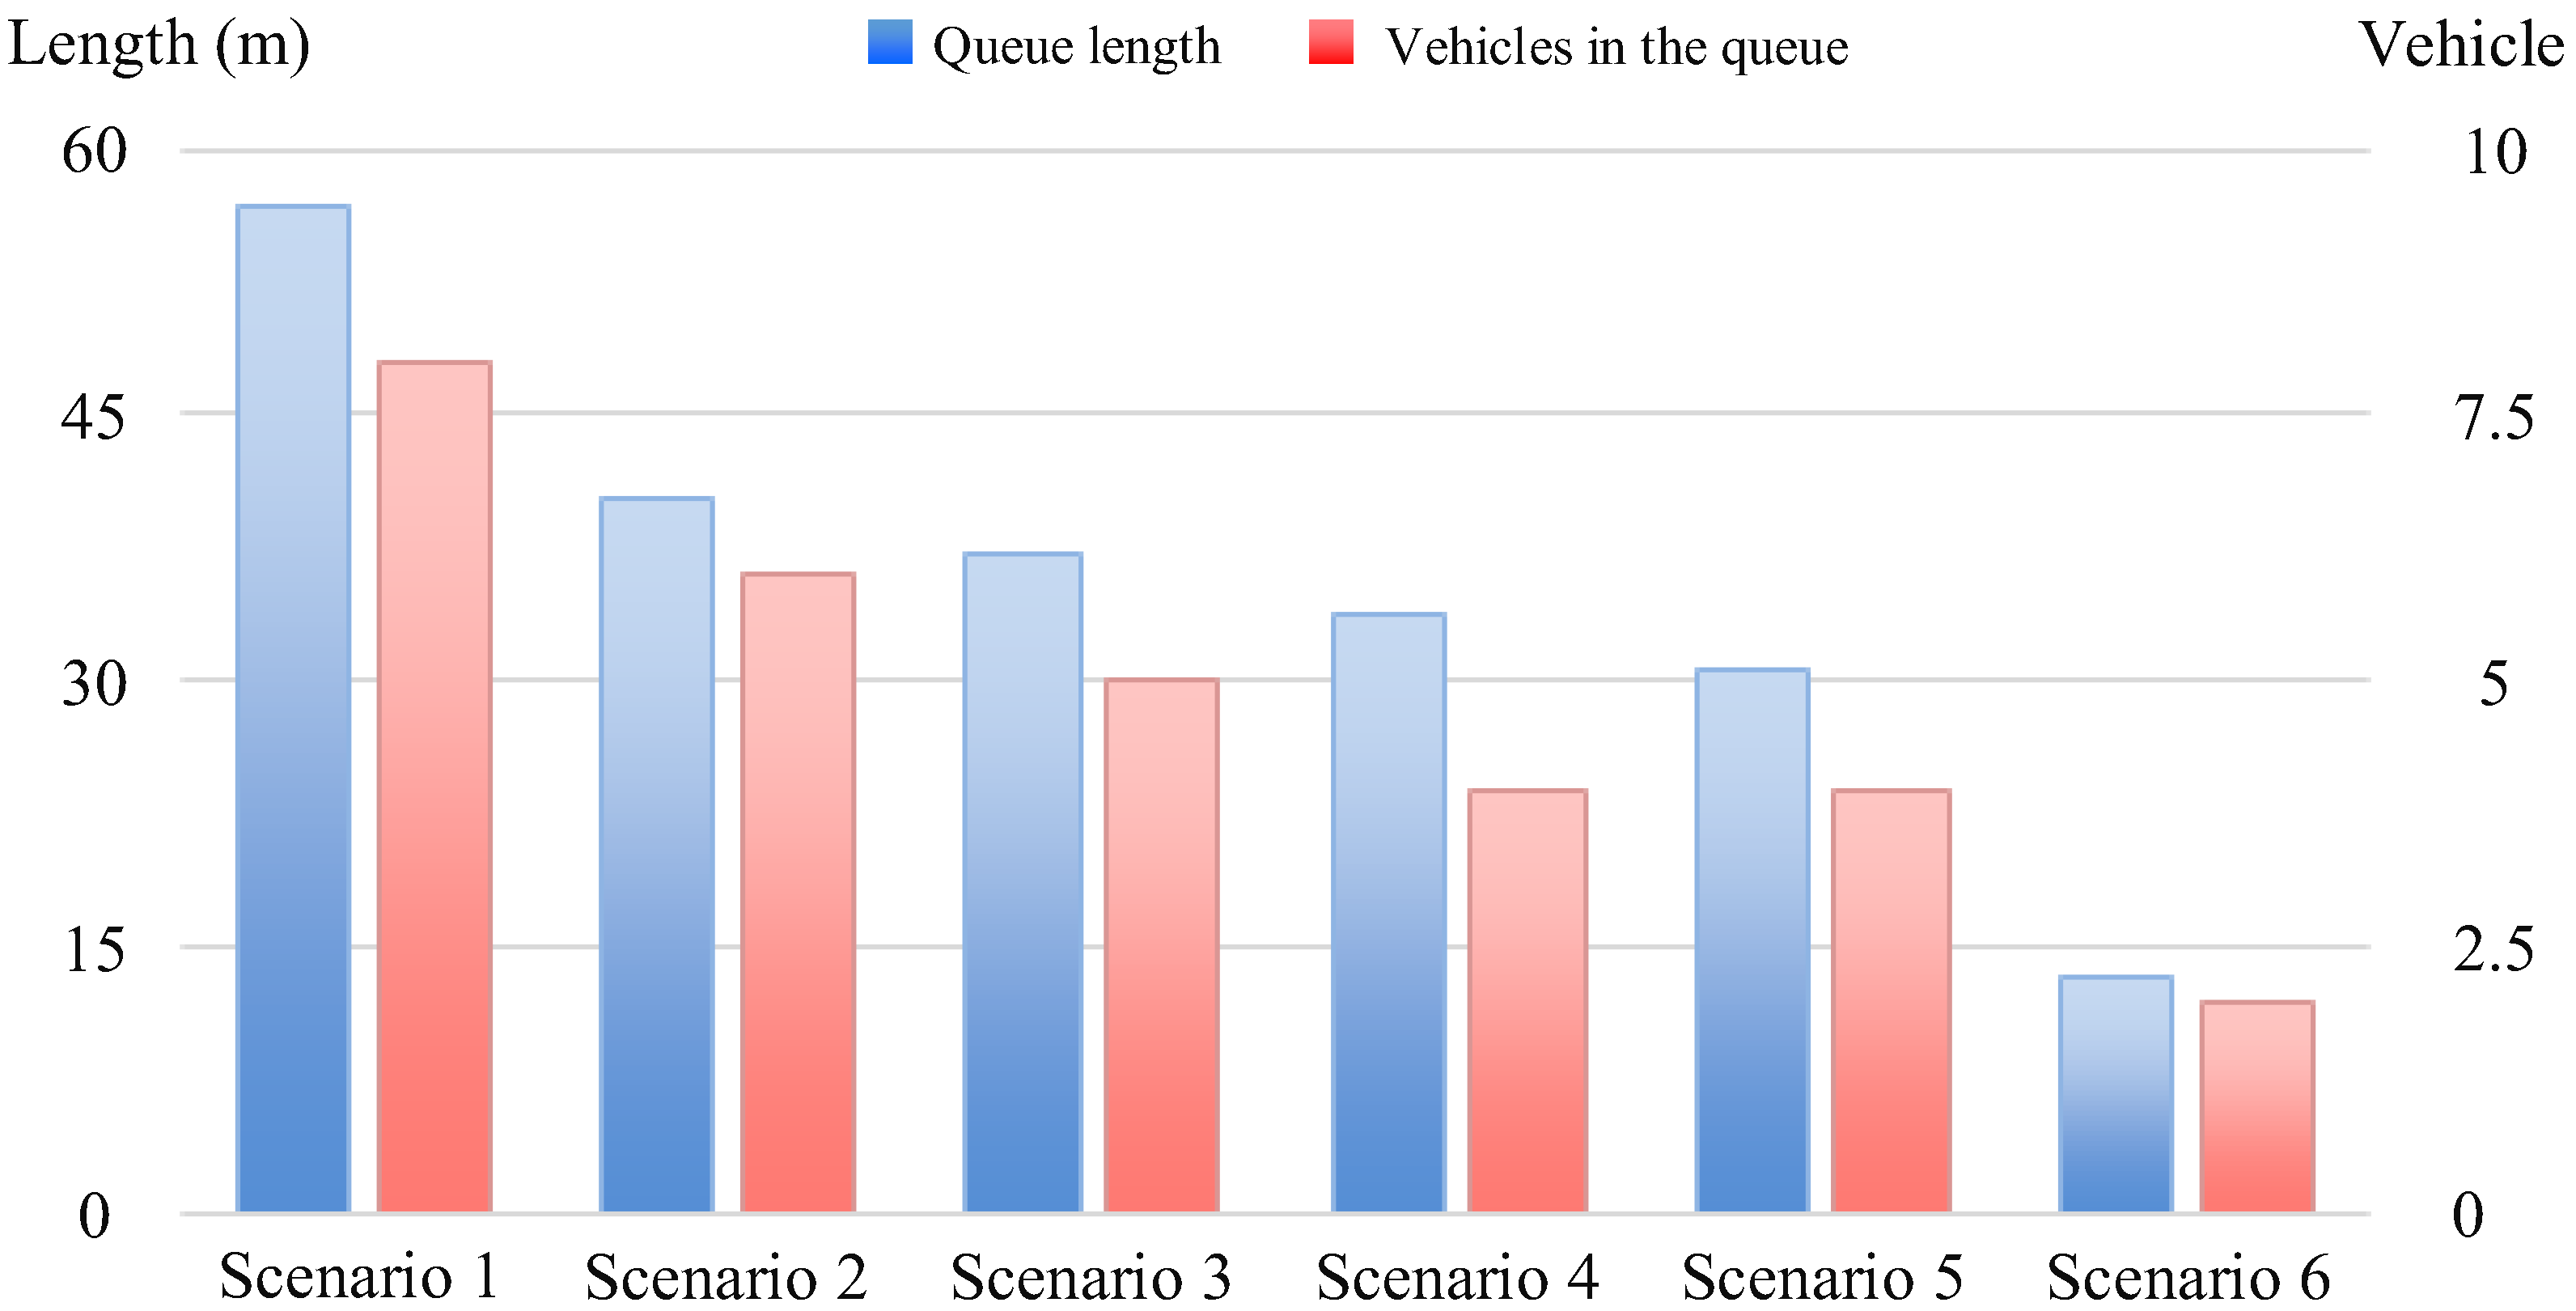
Excessive delay cannot dissipate during a short period and may result in queues with the arrival of vehicles. As shown in
Figure 9, there exists different length of queue caused by severe congestions under each scenario. From the angle of queue length, the maximum of over 55 m occurs in Scenario 1 while the minimum of less than 15 m is obtained in Scenario 6. Also, a large number of vehicles need to queue up to pass toll channels in Scenario 1. Compared with the separate organization mode in the other scenarios, Scenario 1 apparently fails to catch up with the fast increase of passengers and cargoes. Furthermore, one less toll channel and three less main lines also account for the significant delay. For Scenario 2, the queue length is reduced by over 15 m due to the separate organization mode. The six-step hierarchical guidance strategy in Scenario 5 makes the queue length 10 m shorter than Scenario 2. Therefore, combination of new organization mode and guidance strategy decreases the queue length over 25 m. In terms of vehicles in the queue, the size is between two vehicles under Scenario 6 and 8 vehicles under Scenario 1. Therefore, from the global perspective, there is a two-vehicle decrease from Scenario 1 to Scenario 6 except that the same number of vehicles in queue is observed under Scenario 4 and Scenario 5. In general, Scenario 6 performs the best both in queue length and vehicles in the queue. This case could be caused by three reasons. (1) Vehicle queue can be discharged quickly and the traffic flow under this scenario is hardly oversaturated due to much shorter headway and service time. (2) The lane-changing model ensures that cars and trucks can find the proper gaps and change their lanes to the exclusive ones before approaching to toll channels. (3) Cooperative communications between vehicles and infrastructures work along the roadway and enforce vehicles to change lane in advance.
4.3. Safety Analysis
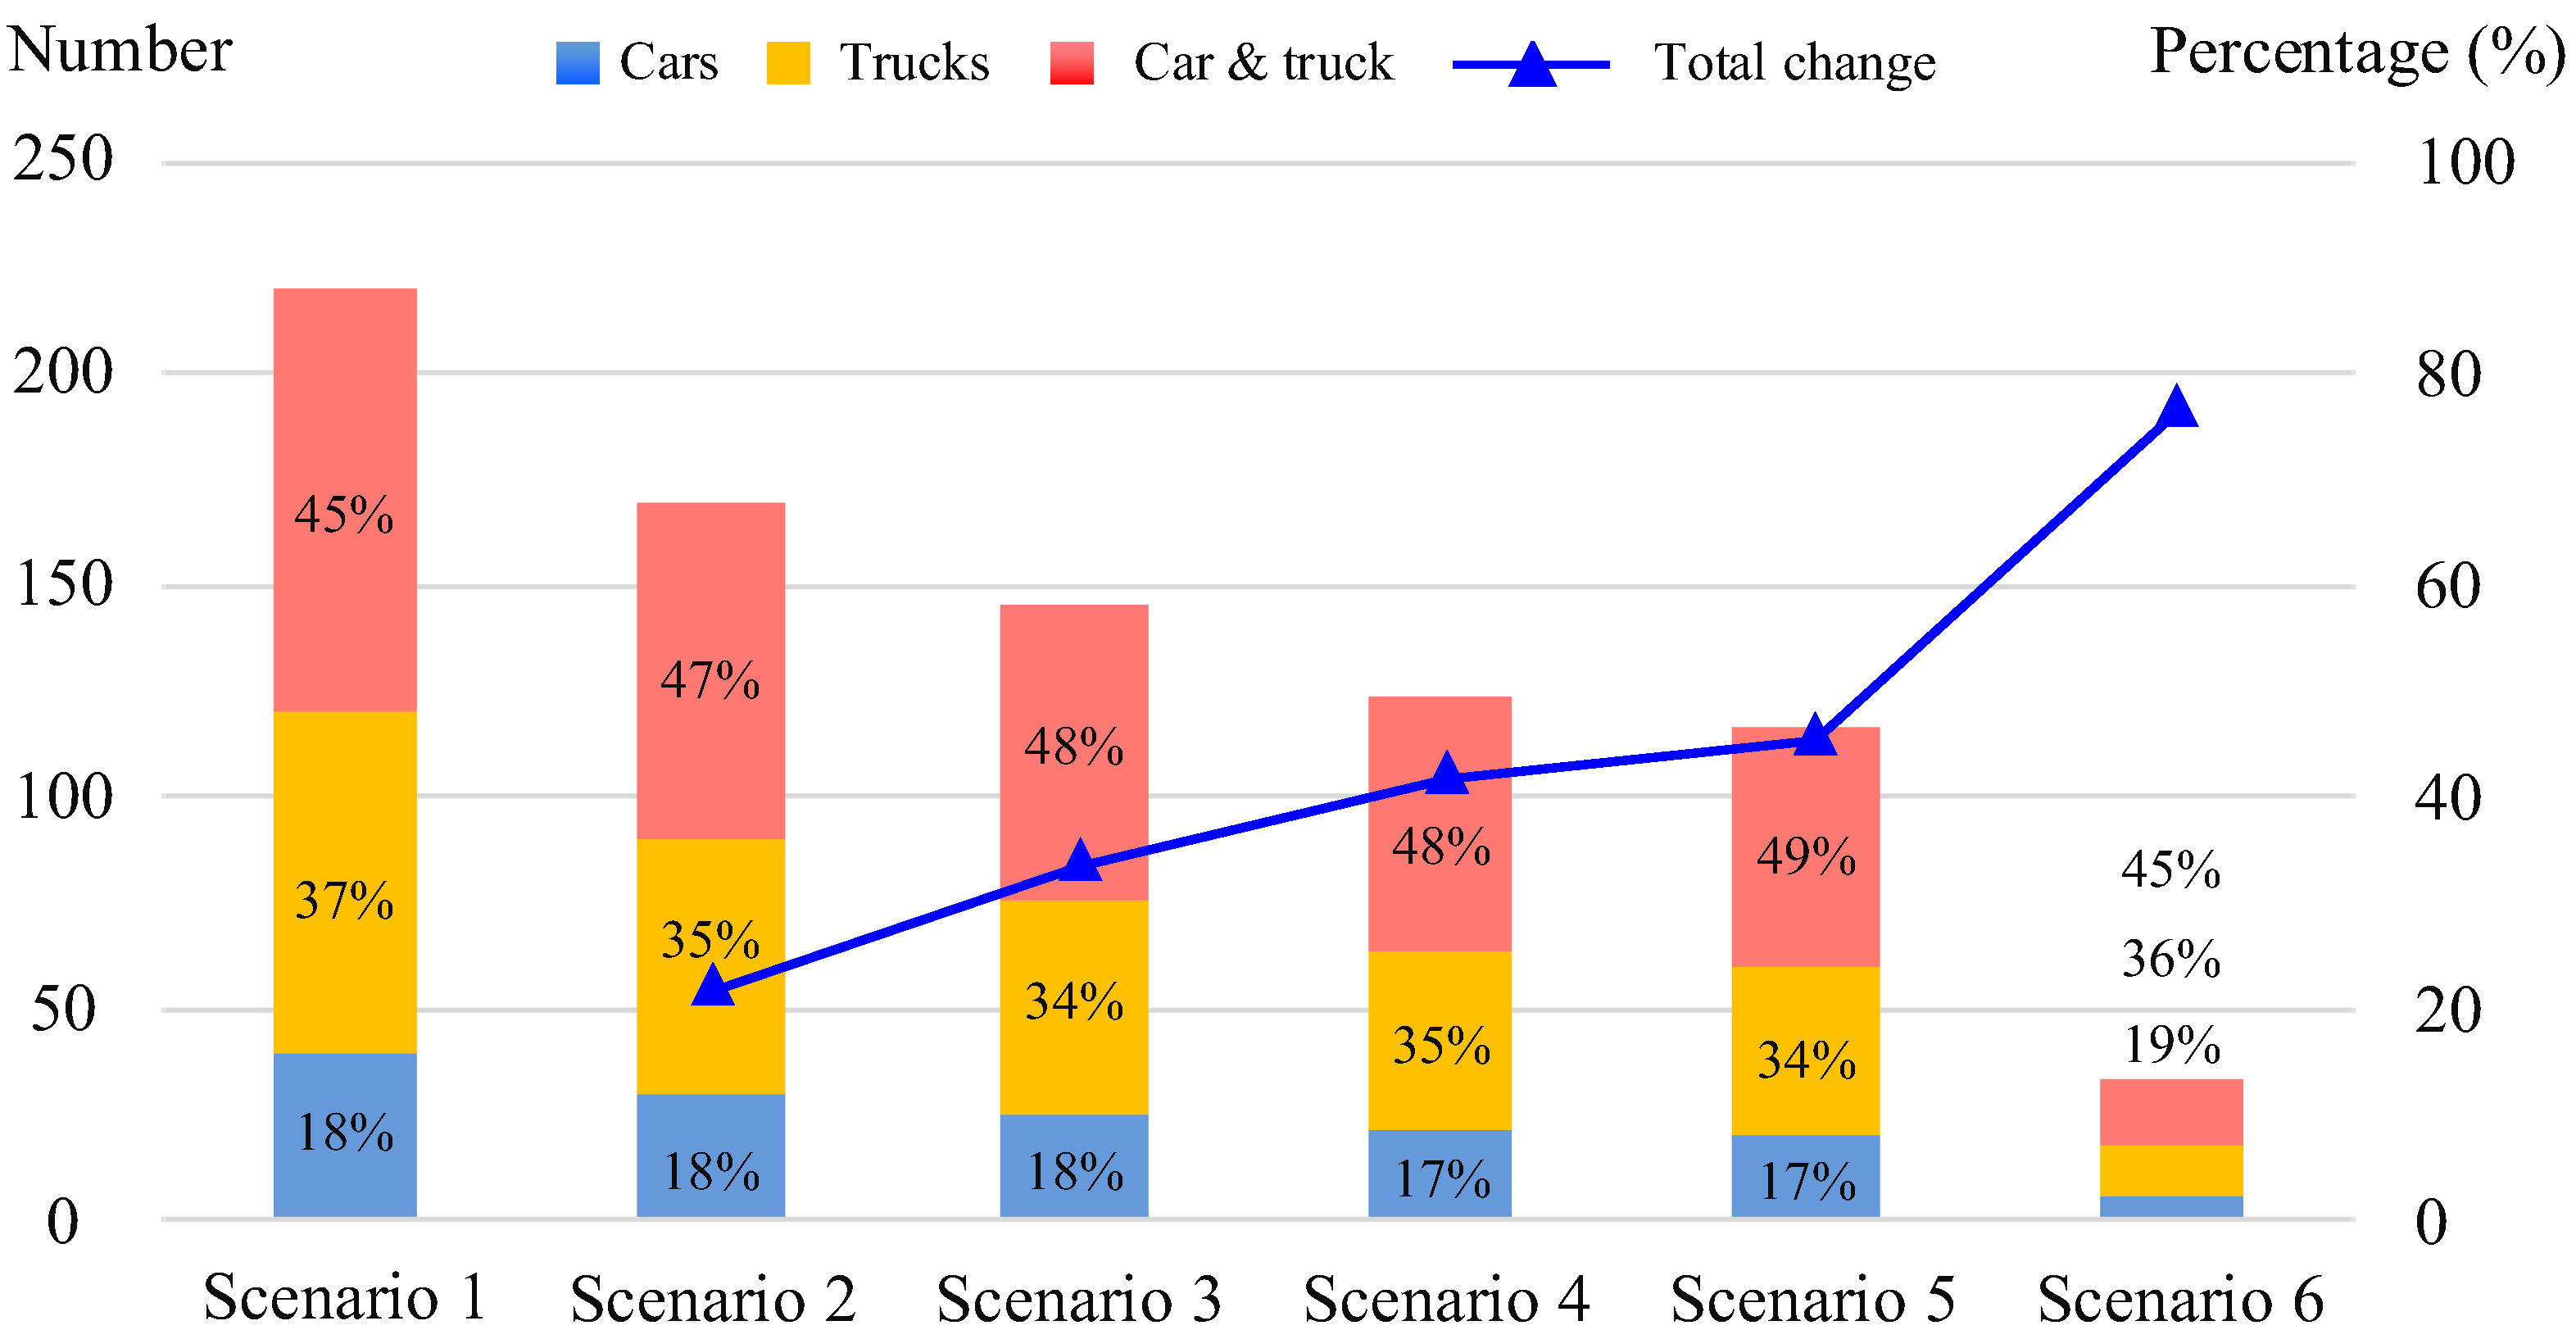
Based on vehicle types, collisions are divided into three categories: cars, trucks, and car & truck. The collision results are summarized in
Figure 10. Apparently, cars account for the least collisions under each scenario, and range from 17% to 19%. On the contrary, the largest proportion of collisions is between cars and trucks, which is about 30 percent higher than cars. However, the remaining ratio for trucks is relatively stable and lies within the interval (34%, 37%). In other words, collisions involving of trucks are more than 80%. The analysis demonstrates that trucks are most likely to be perceived as threats on traffic safety, and this is the reason that multilane separate freeway is quite necessary in high-demand cargo traffic transferred by road. During one-hour simulation, more than 210 collisions happen under Scenario 1. After reforming the freeway to separate organization mode, nearly 50 collisions are reduced according to the comparison between Scenario 1 and Scenario 2. The following experiments also provide further evidence of operation effectiveness of hierarchical guidance strategy and cooperative V2I application. Specifically, the total number of collisions in Scenario 6 is decreased to about 30. Besides, the improvement in amplitude noticeably increases with the decrease of collisions, as indicated by the rising blue line in
Figure 10. Particularly, the total changes under the first four scenarios gradually increase from 20% to 45%, while the percentage in Scenario 6 sharply rises to nearly 80%. The finding suggests that government should vigorously promote the market of CAVs and V2I technologies for the sake of safety.
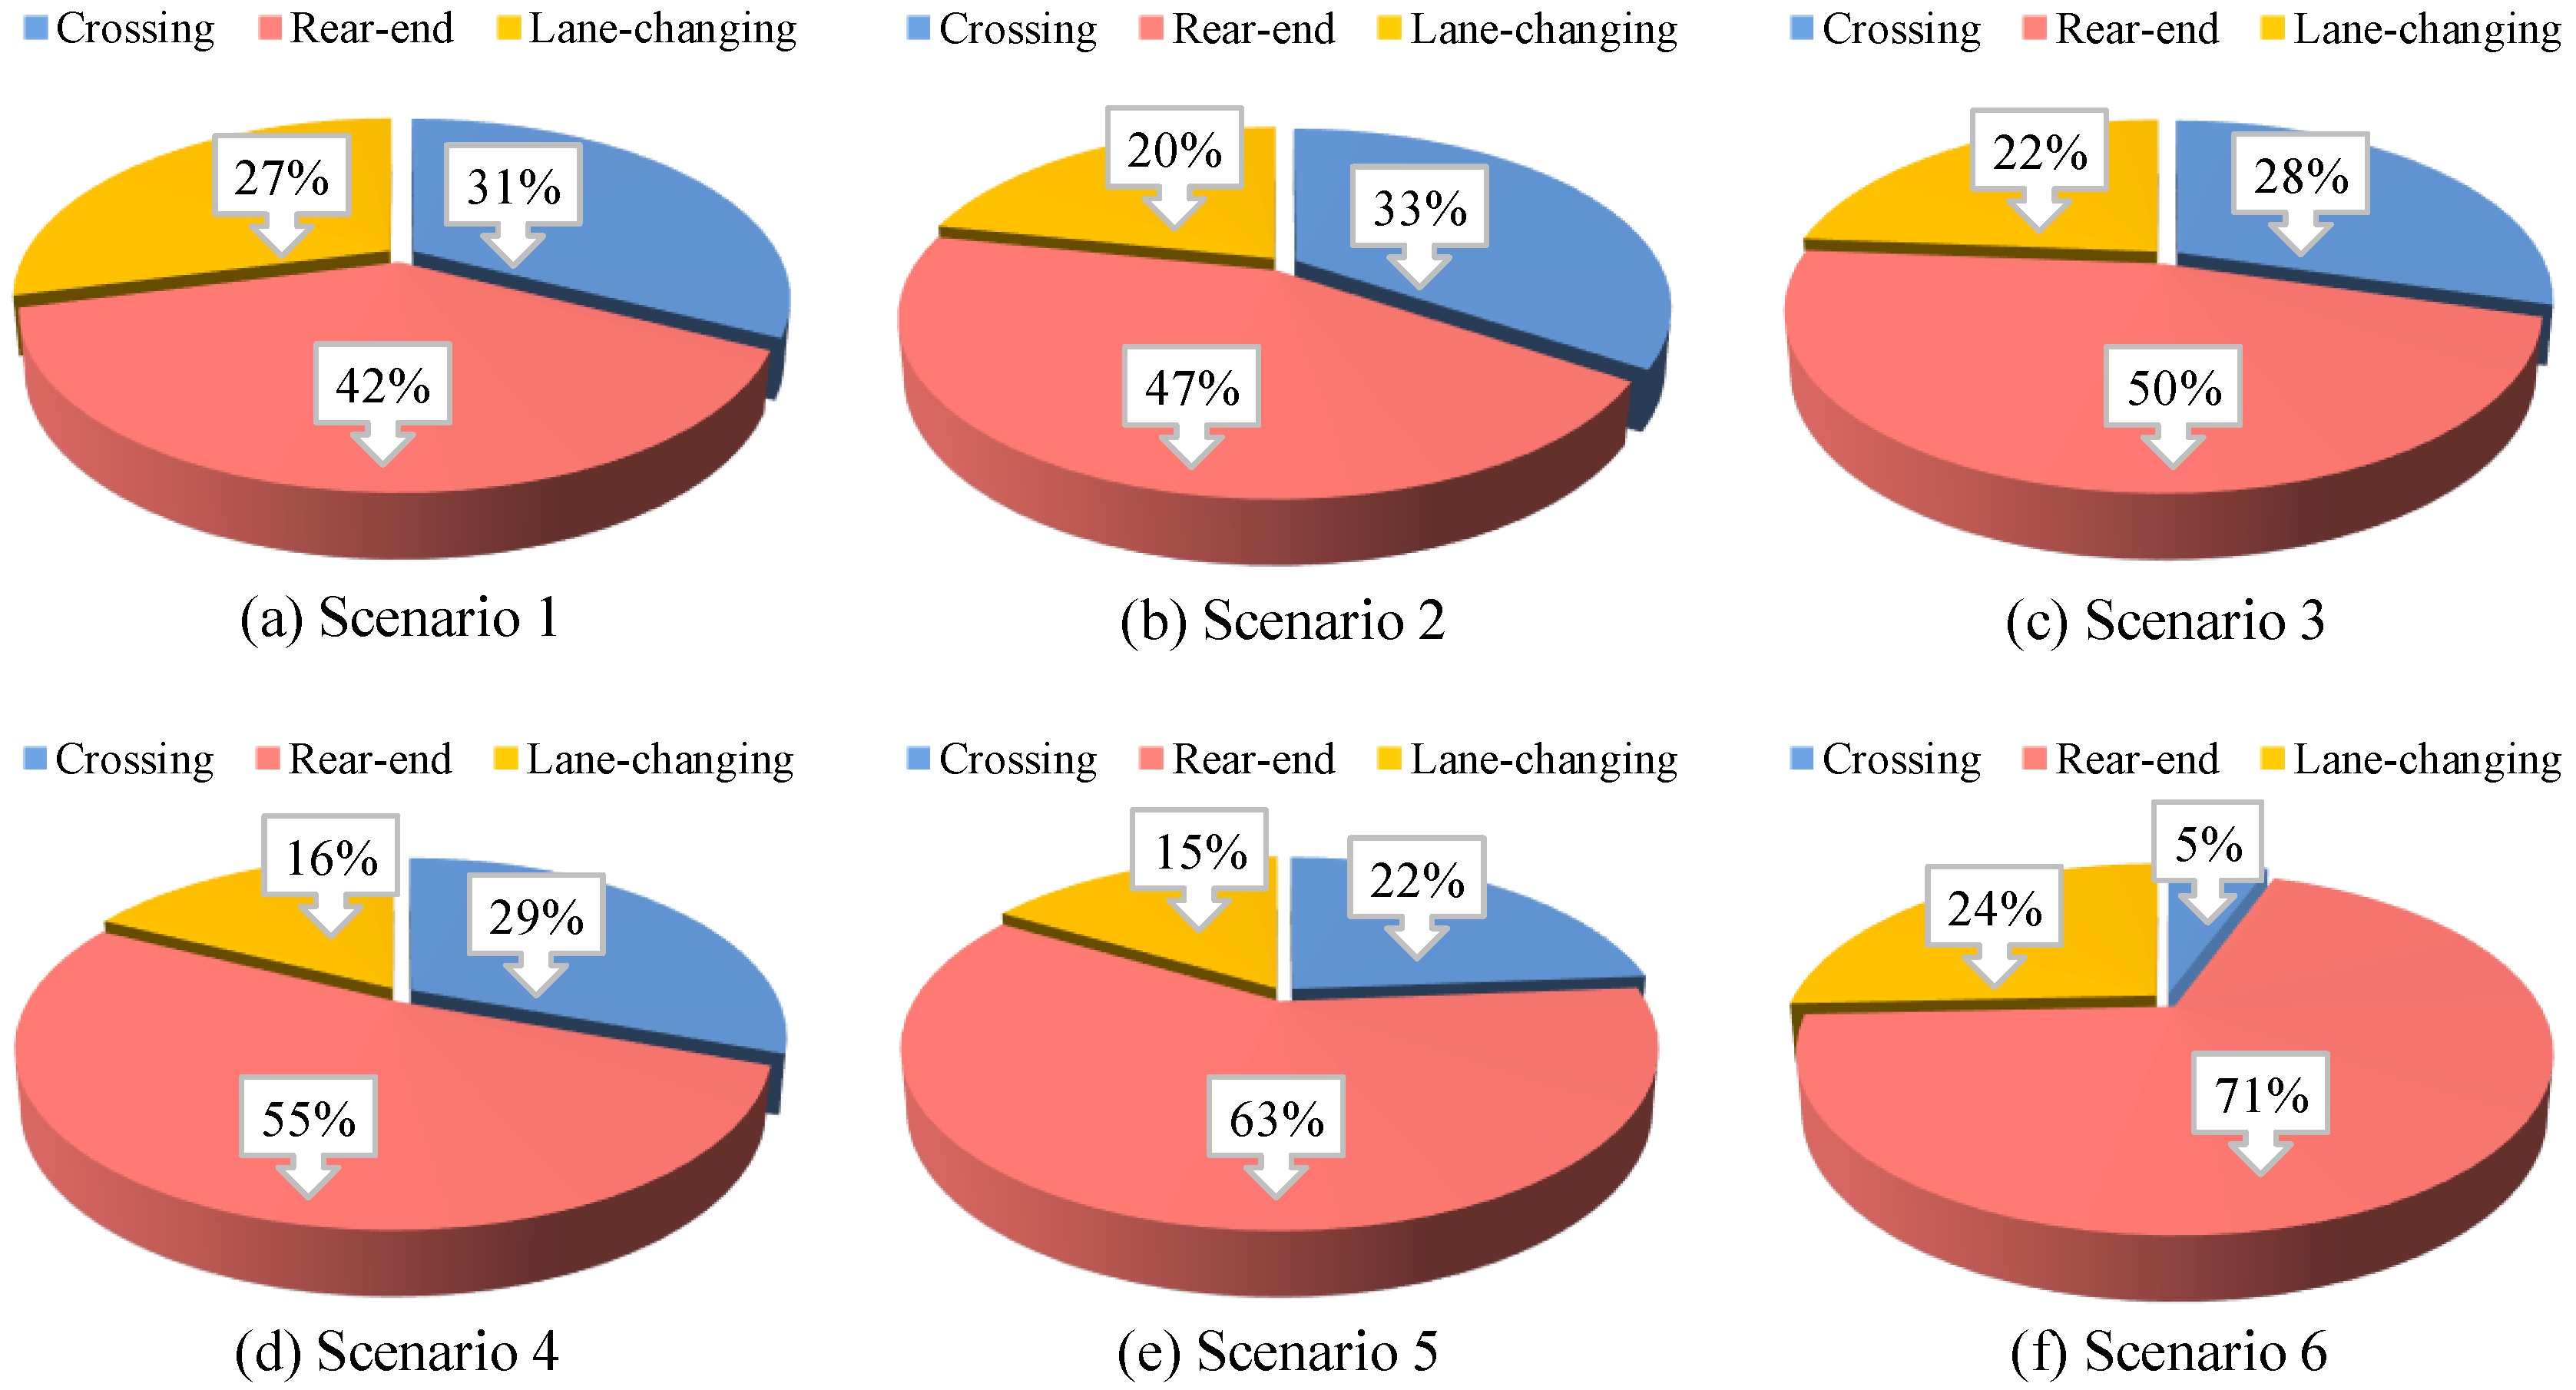
To examine the effects on collision types defined by conflict angle, percentages of all collisions are summarized via the external module SSAM. Each pie chart in
Figure 11 is divided into three slices to illustrate the proportion of potential collisions. Intuitively, the rear-end type accounts for the most collisions under all traffic scenarios. With the application of guidance strategy and V2I technology, it starts to exceed 50% from Scenario 3, and reaches the peak 71% under Scenario 6. It is well known that the bigger the conflict angle, the more severe the collisions. So a rear-end collision is a relatively recommended way to minimize damage when facing unavoidable collisions. In this case, Scenario 6 is proven to be the safest condition besides the amount of total collisions summarized in
Figure 10. Furthermore, the most unsafe collisions of lane-changing occur the least in Scenario 5 because of the hierarchical guidance strategy. Compared to lane-changing, the amplitude of proportion fluctuation in crossing and rear-end is much bigger among six scenarios. Take the crossing as an example, and the range fluctuates from 5% in Scenario 6 to 33% in Scenario 2. This means that crossing collision is probably not directly related to scenario settings.
Identifying unsafe areas provides theoretical guidance for the management of automated highway systems in the future.
Figure 12 shows the distribution of safety level at Huludao Toll Station. For each scenario, there is a noticeable difference between safety level A and F. Specifically, safety level A is normally distributed at both ends of the study freeway, while safety level F is centralized in the middle area between Section II and III. In other words, the safest area is basic section because there are more lanes in travel direction and fewer vehicles in each lane. On the one hand, the hierarchical guidance strategy and V2I application gradually help to widen the safe area to Section IV. On the other hand, the new technologies also enhance the safety to Level A in Section II. Besides the start/end points, there is a strong tendency that drivers travel through Section II and III safely. For Scenario 1, the safety level is still E/F, but it rises to Level A/B under Scenario 6, which indicates a significant improvement compared to the traditional condition. It is noteworthy that, in contrast to Scenario 3, changes of safety level under Scenario 4 are so extremely small to easily embody the superiority of pre-guidance.
4.4. Emission and Fuel Consumption
Nowadays, there can be little doubt that traffic-related pollutants have direct impact on the globe climate and public health.
Table 6 shows four main pollutants emitted by vehicles. Although tiny differences of emission rates are observed in four traffic conditions in
Table 3, the average emission of four pollutants keeps monotonically decreasing from Scenario 1 to Scenario 6. Cars have a similar trend to trucks, but with much more emissions in NO
x and CO
2. In contrast, CO emissions for per car are obviously more than truck. The other pollutant HC is not sensitive to scenario settings and vehicle types, and maintains low-level performance in total emissions.
Compared to HC, CO, and NOx, CO2 contributes the most of total emissions in weight, accounting for over 90%. For the monomial emission, HC caused by cars and trucks changes within the range from 0.26 g/veh to 0.32 g/veh. CO emissions of cars and trucks in Scenario 6 drop respectively by over 10% and 30% compared with Scenario 1. The gap of NOx emission between cars and trucks is remarkably bigger than HC and CO. For cars, NOx emission is less than 1 g/veh while it exceeds 30 g/veh for each truck. However, the biggest gap is observed in CO2, where the emission of per truck is 8–10 times as much as a car. In the total amount, the emission for each truck in Scenario 6 is dropped to 4228.62 g by over 25%, while only 567.14 g pollutant is emitted by a car. Therefore, trucks are the essential emission source in road traffic. Also, the above analysis demonstrates that both separate organization mode and V2I technology can dramatically reduce pollutant emissions, especially in CO2.
Carbon emission, contributed by HC, CO, and CO
2, is an important independent indicator because of its direct relation to the atmospheric concentration of pollutants, as shown in
Figure 13. Obviously, trucks contribute to the majority of carbon emission since cars emit much less carbonaceous pollutants, which is consistent with
Table 6. The total number of carbon is gradually decreased from 1800 g/veh to 1000 g/veh. Expectedly, the maximum and minimum exist in Scenario 1 and Scenario 6, respectively. The other scenarios are improved by 15–37% except the V2I environment. Particularly, the increase in Scenario 3 is relatively small if adding the last three guidance steps to Scenario 2, which verifies that the lagging guidance approaching to the terminal has a little effects on carbon emissions. In contrast, guidance in advance plays a critical role in carbon reduction. However, Scenario 6 is generally the best condition with the minimum damage to environment and public health, which is one of benefits from V2I technology applications.
To this end, further investigations are conducted to assess the impact of multilane separate freeway on fuel consumption, as shown in
Figure 14. Similar to pollutant emissions, fuel consumption by cars is considerably lower than trucks. Each car consumes less than 300 g under all scenarios, but at least 1300 g of fuel is burnt in a truck and the maximum even reaches 2230 g in Scenario 1. Generally, the fuel consumption declines steadily from Scenario 1 to Scenario 6. Compared with carbon emissions in
Figure 13, fuel consumed by the last four scenarios is decreased by a larger percentage. For example, fuel consumption in Scenario 5 is decreased by 57% while carbon emissions decline only by 37%. In addition, fuel consumption in Scenario 6 is decreased by 80%, which is the maximum improvement among all scenarios. Therefore, Scenario 6 is best recommended for development of energy-saving and emission-reduction technology.
5. Conclusions
This study attempts to comprehensively assess the multilane separate freeway and deeply investigate the impact of the new organization mode on efficiency, safety, emission, and fuel consumption in the case of Huludao Toll Station in Liaoning Province, China. Six scenarios are designed and simulated based on the hierarchical guidance strategy via Vissim and MATLAB platforms, including Scenario 1 with the conventional roadway, Scenario 2 without guidance strategy, Scenario 3 with the last three step guidance, Scenario 4 with the first three step guidance, Scenario 5 with full six step guidance, and Scenario 6 in a cooperative V2I environment. Additionally, the separate mode is applied in the last five scenarios and Scenario 1 is served as a control group. The major results of numerical simulation experiments are concluded as follows:
(1) According to the mean speed, toll plaza and channels are the sections with the lowest efficiency. From the global perspective, the mean speeds along the roadway rank as the order of scenario from 1 to 6. It has the similar tendency in the increase of mean speed and the decrease of SD. With the application of hierarchical guidance strategy and V2I technology, mean speeds of cars and trucks are improved by 12–45% while the SD is reduced by 15–60%.
(2) The delay follows a distribution with a single peak, and reaches the peak around toll plaza, where traffic congestions and queues potentially occur. Compared to Scenario 1, the average delay is reduced over 10 s under Scenario 2, which proves the effectiveness of separate organization mode. Also, the delay under Scenario 5 with the hierarchical guidance strategy is reduced by 30 s and 40 s for cars and trucks, respectively. Accordingly, new technologies can dramatically reduce the queue length and vehicles in the queue.
(3) Based on surrogate safety measures of conflict angle and rear-end collision risk index, the safety analysis reveals that truck-related collisions occupy the majority, and the percentage is approximately 80%. The total number of collisions in Scenario 6 is decreased by nearly 80% while those of the other four scenarios are below 50%. Moreover, the safety level under Scenario 1 is between E and F, but it rises to Level A/B under Scenario 5 and 6, which indicates a significant improvement in safety by the hierarchical guidance strategy and V2I application.
(4) Consistent with above findings, the analysis of emission and fuel consumption also demonstrates the superiority of new technologies. Although tiny differences of emission rates in HC, CO, and NOx, CO2 contributes the most of total emissions in weight. Specifically, over 1000 g CO2 is decreased for trucks under Scenario 4–6 while the maximum for cars is less than 150 g. Besides, fuel consumption by cars and trucks is decreased by 47% and 80% under Scenario 6, respectively. The monotonous curve directly proves that Scenario 4 performs better than Scenario 3 because of pre-guidance before toll channels.
Therefore, the new mode in freeway organization helps to separate trucks from the hybrid flow and it is demonstrated that the multilane separate freeway has obvious advantage in efficiency, safety, emission, and fuel consumption. Also, the reasonable hierarchical guidance strategy and cooperative V2I technology are recommended measures for energy-saving and emission-reduction. However, other aspects of separate freeway need more attention in future work, such as the economic effects of construction, market penetration of intelligent vehicles, other types of vehicles and sections in freeways.


