Article

Evaluating the Thermal Performance of Wet Swales Housing Ground Source Heat Pump Elements through Laboratory Modelling

by
Carlos Rey-Mahía
1,
Luis A. Sañudo-Fontaneda
1,2,*,
Valerio C. Andrés-Valeri
3,4,
Felipe Pedro Álvarez-Rabanal
1,
Stephen John Coupe
2 and
Jorge Roces-García
5
1
INDUROT Research Institute, GICONSIME Research Group, Department of Construction and Manufacturing Engineering, University of Oviedo, Campus of Mieres, Gonzalo Gutierrez Quiros s/n, 33600 Mieres, Spain
2
Centre for Agroecology, Water and Resilience, Coventry University, Ryton Gardens, Coventry CV8 3LG, UK
3
Instituto de Obras Civiles, Facultad de Ciencias de la Ingeniería, Universidad Austral de Chile, General Lagos 2086, Campus de Miraflores, Valdivia 5090000, Chile
4
GITECO Research Group, University of Cantabria, Avenida de los Castros 44, 39005 Santander, Spain
5
Department of Construction and Manufacturing Engineering, University of Oviedo, Campus of Gijón, Pedro Puig Adam s/n, EDO6, 33203 Gijón, Spain
*
Author to whom correspondence should be addressed.
Sustainability 2019, 11(11), 3118; https://doi.org/10.3390/su11113118
Submission received: 28 February 2019 / Revised: 26 May 2019 / Accepted: 28 May 2019 / Published: 3 June 2019

Abstract

:
Land-use change due to rapid urbanization poses a threat to urban environments, which are in need of multifunctional green solutions to face complex future socio-ecological and climate scenarios. Urban regeneration strategies, bringing green infrastructure, are currently using sustainable urban drainage systems to exploit the provision of ecosystem services and their wider benefits. The link between food, energy and water depicts a technological knowledge gap, represented by previous attempts to investigate the combination between ground source heat pump and permeable pavement systems. This research aims to transfer these concepts into greener sustainable urban drainage systems like wet swales. A 1:2 scaled laboratory models were built and analysed under a range of ground source heat pump temperatures (20–50 °C). Behavioral models of vertical and inlet/outlet temperature difference within the system were developed, achieving high R2, representing the first attempt to describe the thermal performance of wet swales in literature when designed alongside ground source heat pump elements. Statistical analyses showed the impact of ambient temperature and the heating source at different scales in all layers, as well as, the resilience to heating processes, recovering their initial thermal state within 16 h after the heating stage.

1. Introduction

The built environment impacts the wider environments whilst threatening natural ecosystems in urban areas by reducing green spaces [1]. Rapid urbanization is at the core of the problem with its subsequent land-use change and being described as one of the most influential factors affecting flooding problems in urban environments [2]. In addition, Palazzo et al. [3] put a spotlight on stormwater management when referring to rainwater as a primary risk to urban resilience. Furthermore, Cai et al. [4] identified thermal changes in cities produced by urbanization processes. As a consequence, the concept of urban resilience has taken off in recent years, providing an insight into multidisciplinary contexts, such as socio-ecological systems and their sustainable management under highly complex and variable adaptive systems and climate change scenarios [5]. In this new urban context, Li et al. [1] suggested the implementation of multifunctional approaches through urban regeneration strategies, also highlighted by Peña et al. [6] under the concept of multifunctional landscapes. Widening this view, La Rosa et al. [7] pinpointed urban regeneration as the main way to achieve sustainable urban environments, especially when looking at health and wellbeing for citizens [8]. Therefore, transitioning towards a new paradigm of resilient cities through multifunctional green spaces, has been targeted under the concept of urban green infrastructure (UGI) [9].
Moving on towards the urban water paradigm shift, defined by Morison and Brown [10], authors, such as Perales-Momparler et al. [11] and Gonzales and Ajami [12], specified sustainable stormwater techniques as the main engineering and architectural route to water reuse and rainwater control with the aim to achieve secure water resources. Palazzo et al. [3] also brought into the picture the main philosophy behind this new approach to water management. It consists of outlining how the new concept of adaptive urban design works alongside rainwater rather than against it which has been historically the main way to deal with urban water. Following on from these new approaches, eco-hydrology has arisen as a new term for urban design and diagnosis which allows understanding of long-term patterns in urban climate and hydrology from an environmental appreciation [13]. ‘Sponge cities’ are perhaps the most easily identifiable eco-hydrological approach under the new urban water paradigm, bringing a wider comprehensive philosophy of urban development and water management [2]. The ‘Sponge Cities’ concept works with what it was defined as green corridors which allow landscape connectivity, supporting the overall ecosystem health and biodiversity conservation [14]. Continuing along these lines, Bortolini et al. [15] stressed the need to widen the ability of green spaces to ensure ecosystem services (ES) on the basis of multi-disciplinary approaches.
The United Nations (UN) released the 2030 Agenda for Sustainable Development as ‘a plan of action for people, planet and prosperity. It also seeks to strengthen universal peace in larger freedom’ [16]. This document includes the millennium development goals [17] which relate directly to the previously defined urban resilient paradigm and the need to design and implement Nature-Based Solutions (NBS) at the very centre of the previously defined multifunctional approaches. The European Union (EU) has also stressed the importance of NBS and their urban implementation through green infrastructure (GI) strategies at all levels of society and the different stakeholders and sectors involved in the urban environment and its territorial planning [18]. Prior to this document, the EU defined holistically the role of GI in order to protect the ecosystem state and biodiversity, in promoting ES, societal health and wellbeing; the development of a green economy, and sustainable land and water management [19].
However, there are more questions that still are not fully answered, representing a knowledge gap to achieve the so-called food-energy-water (FEW) nexus [20]. Other authors, such as Zhang et al. [21] and Fan et al. [22], focused on the need to develop the FEW nexus in order to adopt the 2030 Agenda for Sustainable Development, incorporating other environmental, social and economic systems. Returning to the provision of ES and water management, Pappalardo et al. [23] stated how sustainable urban drainage systems (SUDS) have become the most utilized stormwater techniques to reach ES in GI-based urban plans. In this context, SUDS contribute to four main pillars as per defined by the UK CIRIA [24]: Water quantity, water quality, biodiversity and amenity. It is important to note that SUDS are often referred to as low impact development (LID) and stormwater best management practices (BMP) by other authors [25]. Just a few authors, such as Tota-Maharaj et al. [26] and del Castillo-García et al. [27], have explored the link between Energy and Water within the FEW nexus, combining ground source heat pump (GSHP) technology and permeable pavement systems (PPS). GSHP plays a key role in the production of clean energy as per stated by Gupta and Irving [28], who centred their efforts in helping dwellings to adapt to climate change by reducing carbon consumption. This point has been supported by literature, being represented by authors, such as Nathanail et al. [29], in order to achieve sustainability in the wider urban environment. This path has been also taken by Price et al. [30] through the creation of a new methodology for planning development using GSHP and SUDS as indicators, empowering the need for multifunctional purpose engineered elements in the city.
Charlesworth et al. [31] identified future prospects for GSHP and PPS, emphasising the application of horizontal heat pump technology in greener SUDS; an idea supported by Tota-Maharaj et al. [26] who identified paths towards the exploration of GSHP technology, previously used in PPS, in ‘greener’ SUDS, such as wetlands. Andrés-Valeri et al. [32] pioneered the plan to housing GSHP elements in the structure of a wet swale, transferring the previously developed concepts for PPS into swales, highlighting the need to further develop research to fill this key gap in the current knowledge.
This research aims to further develop the use of GSHP combined with wet swales in order to lead the path towards the progress of the Energy-Water nexus. In addition, previous work by Abrahams et al. [33] depicted the potential of swales, designed under a new biological concept, including flood resilience, biomass production, sewage purification and biodiversity enhancement, to reach food production. This new scenario sets, in combination with the present work, the full FEW nexus, pioneering a new SUDS design. Specific objectives were also established, being condensed as follows:
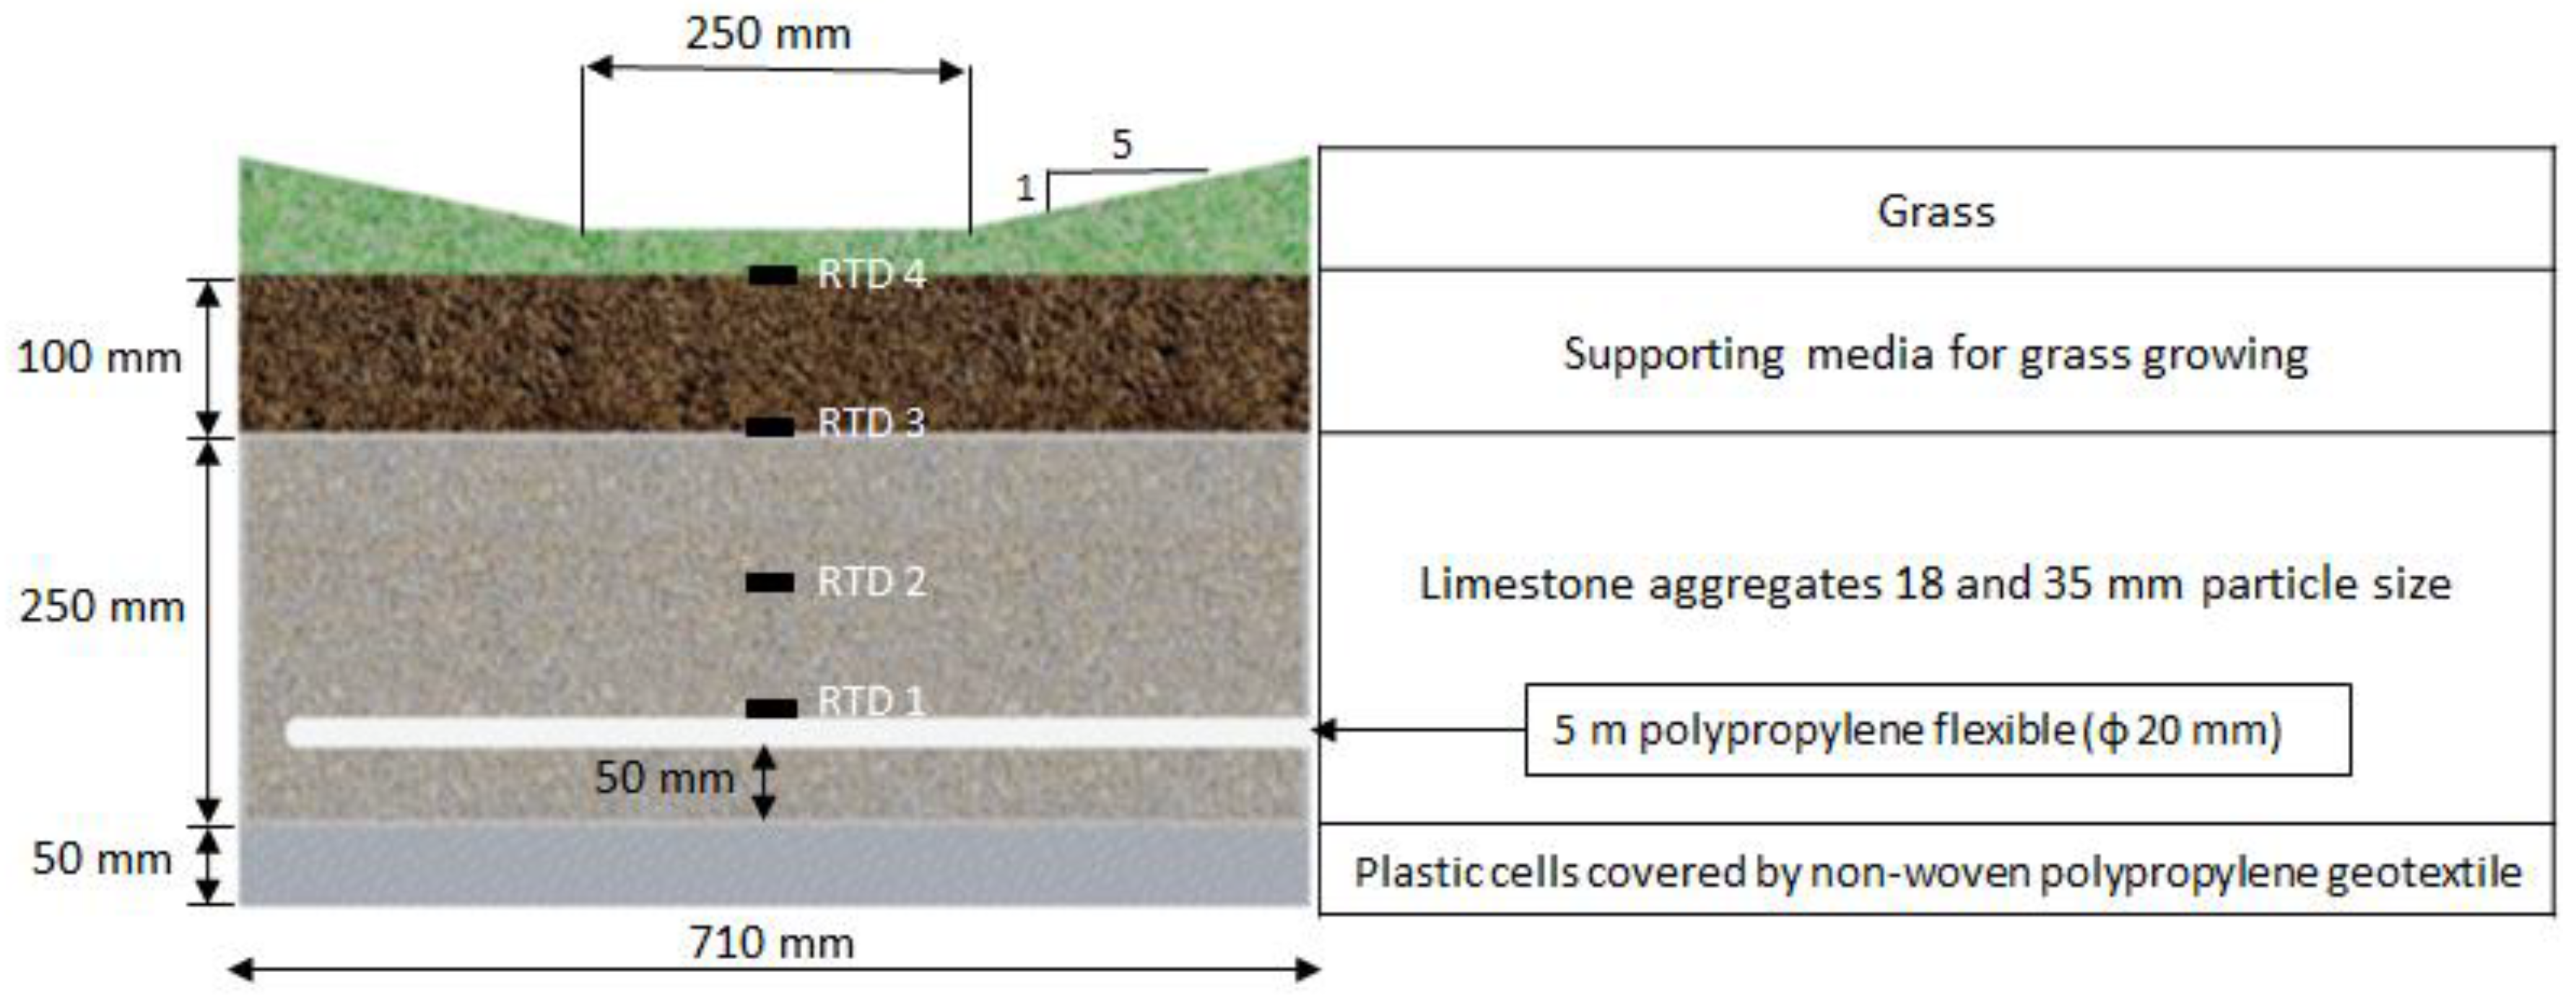
  • Overall description of how the structure of a 1:2 scaled laboratory model for a wet swale responds under a range of temperatures (20 up to 50 °C) and consequent performance of the GSHP system;
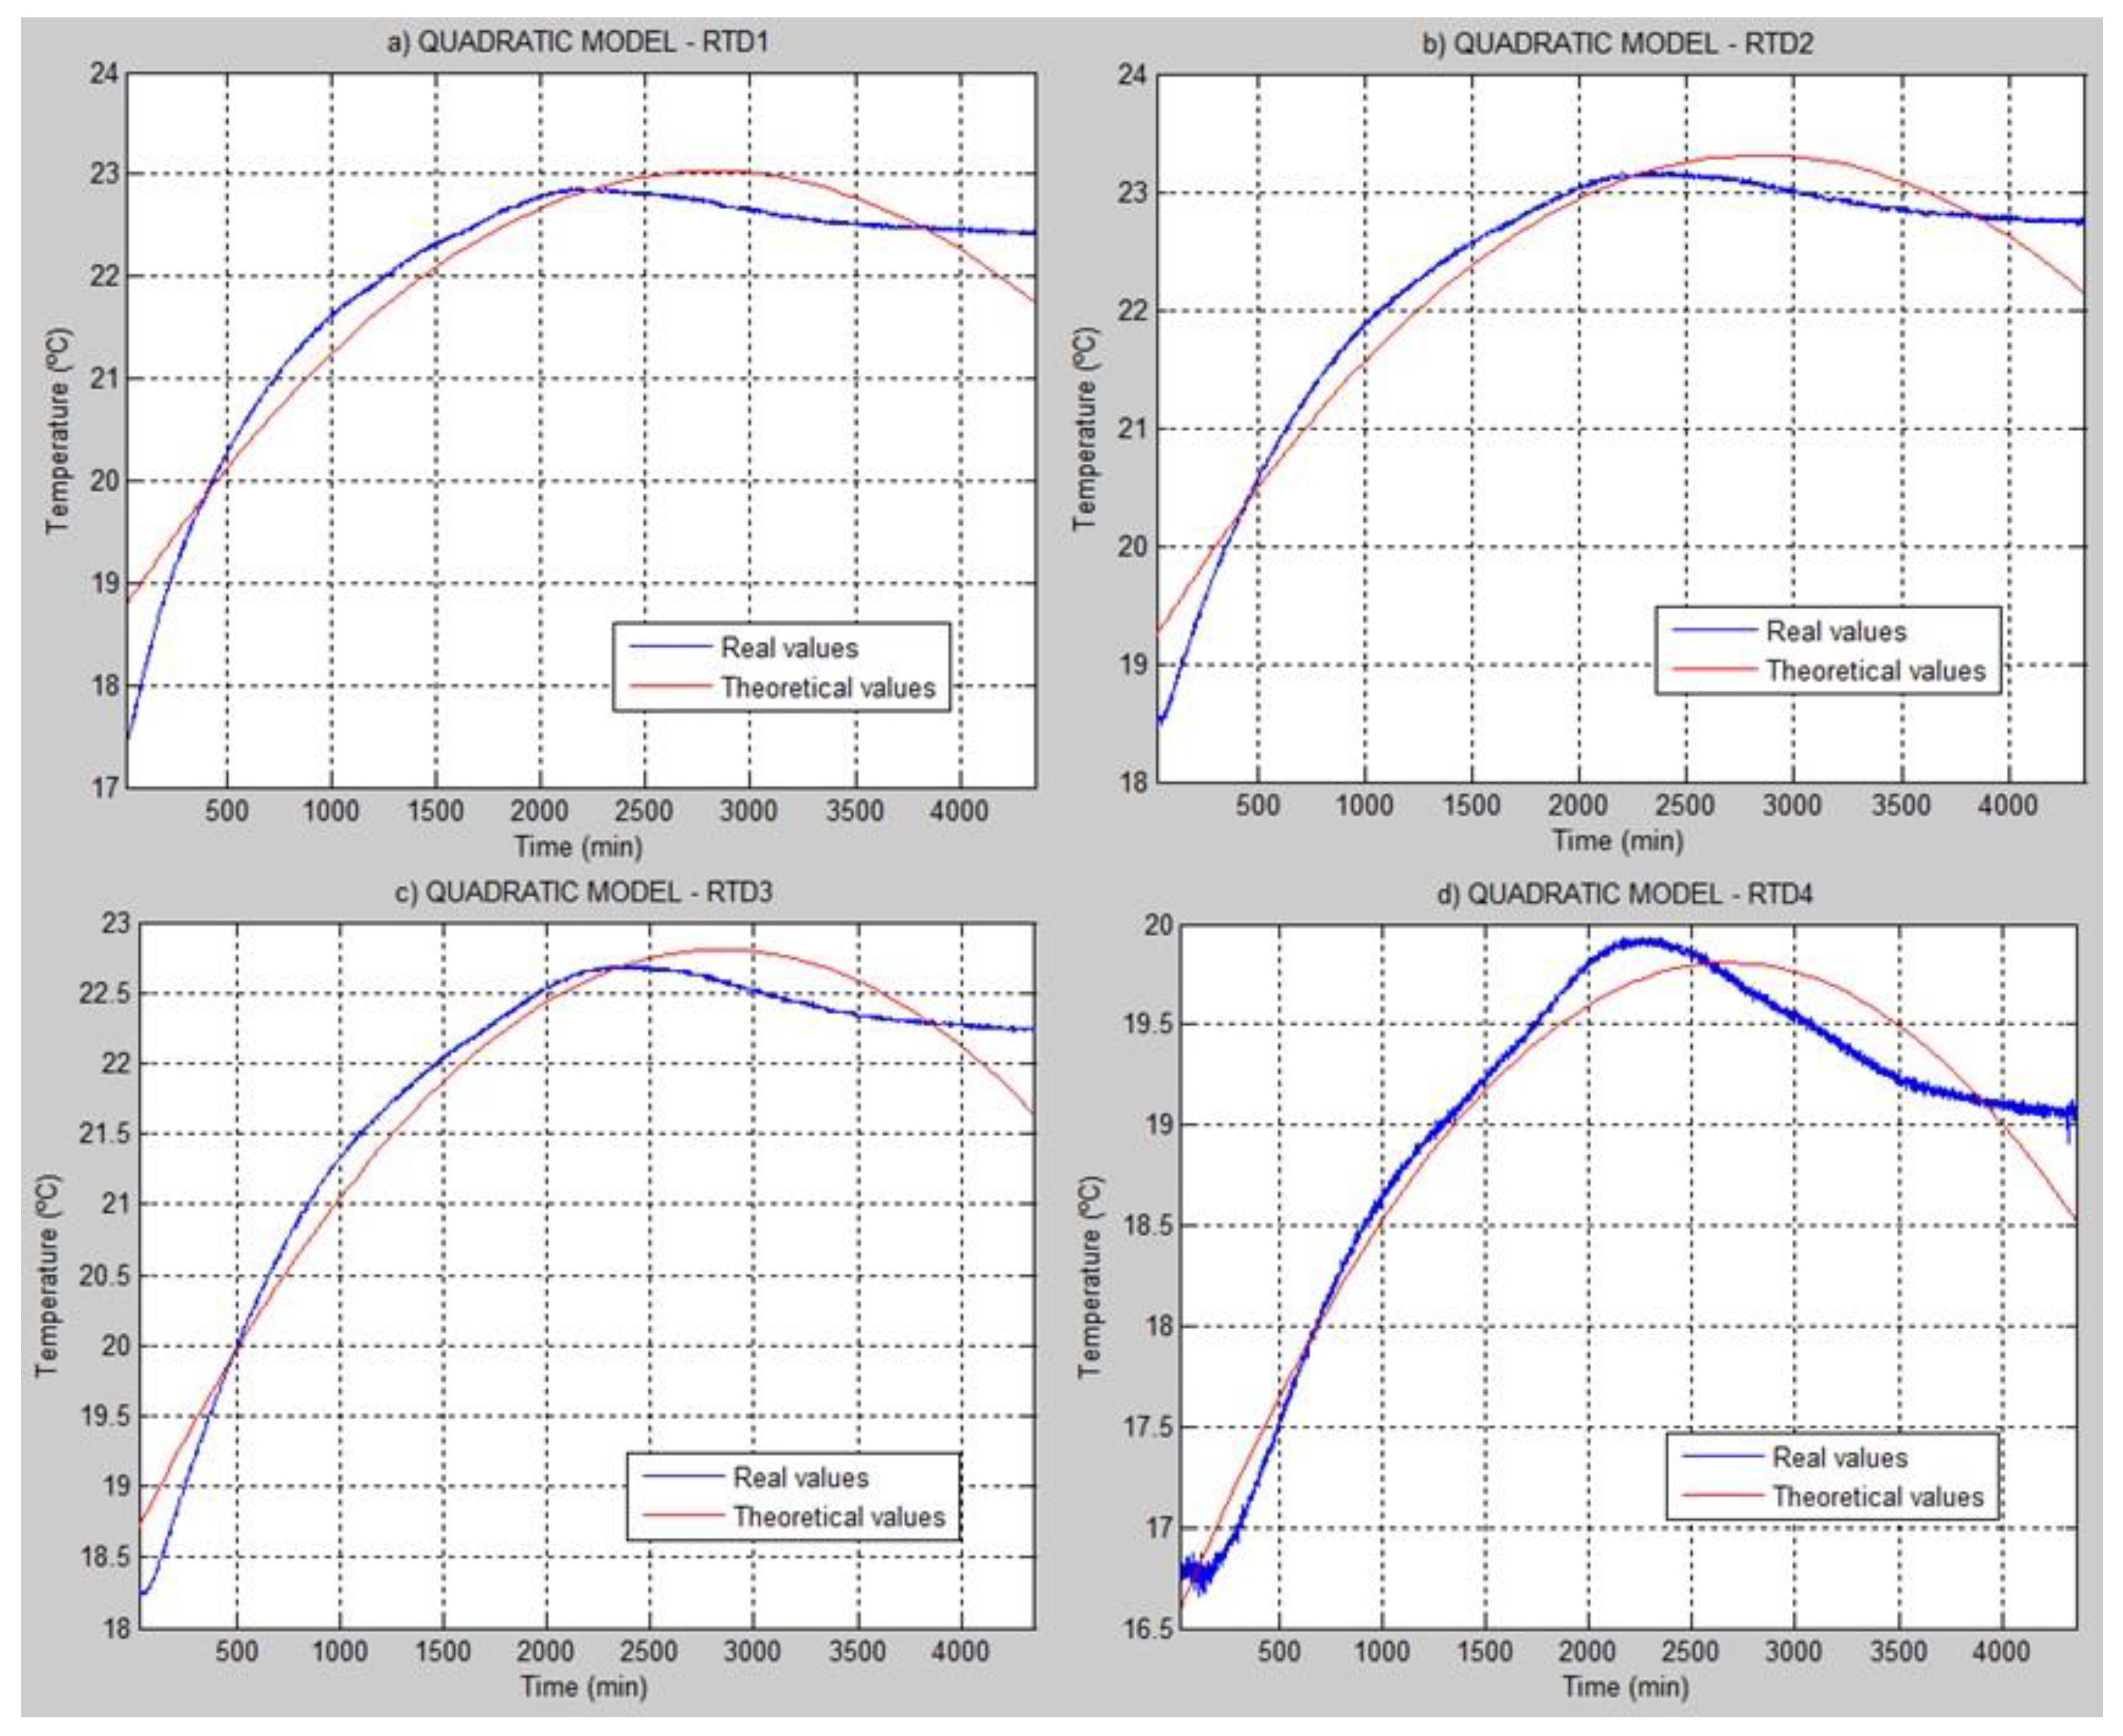
  • Development of behavioral models for the vertical and inlet/outlet temperature difference within the wet swale structure.
With these specific objectives the hypotheses tested in this research relates to two main aspects: (a) The usual range of temperature of performance of GSHP devices might affect the overall thermal performance of a wet swale; (b) Green infrastructure, such as wet swales can be designed housing GSHP elements.
The main conclusion from this research is that wet swales presented good resilience to heating and cooling processes under standard performance temperature of GSHP. This research represents the first attempt to depict the thermal performance of wet swales when designed alongside GSHP elements based on the scientific literature consulted for this research.

2. Materials and Methods

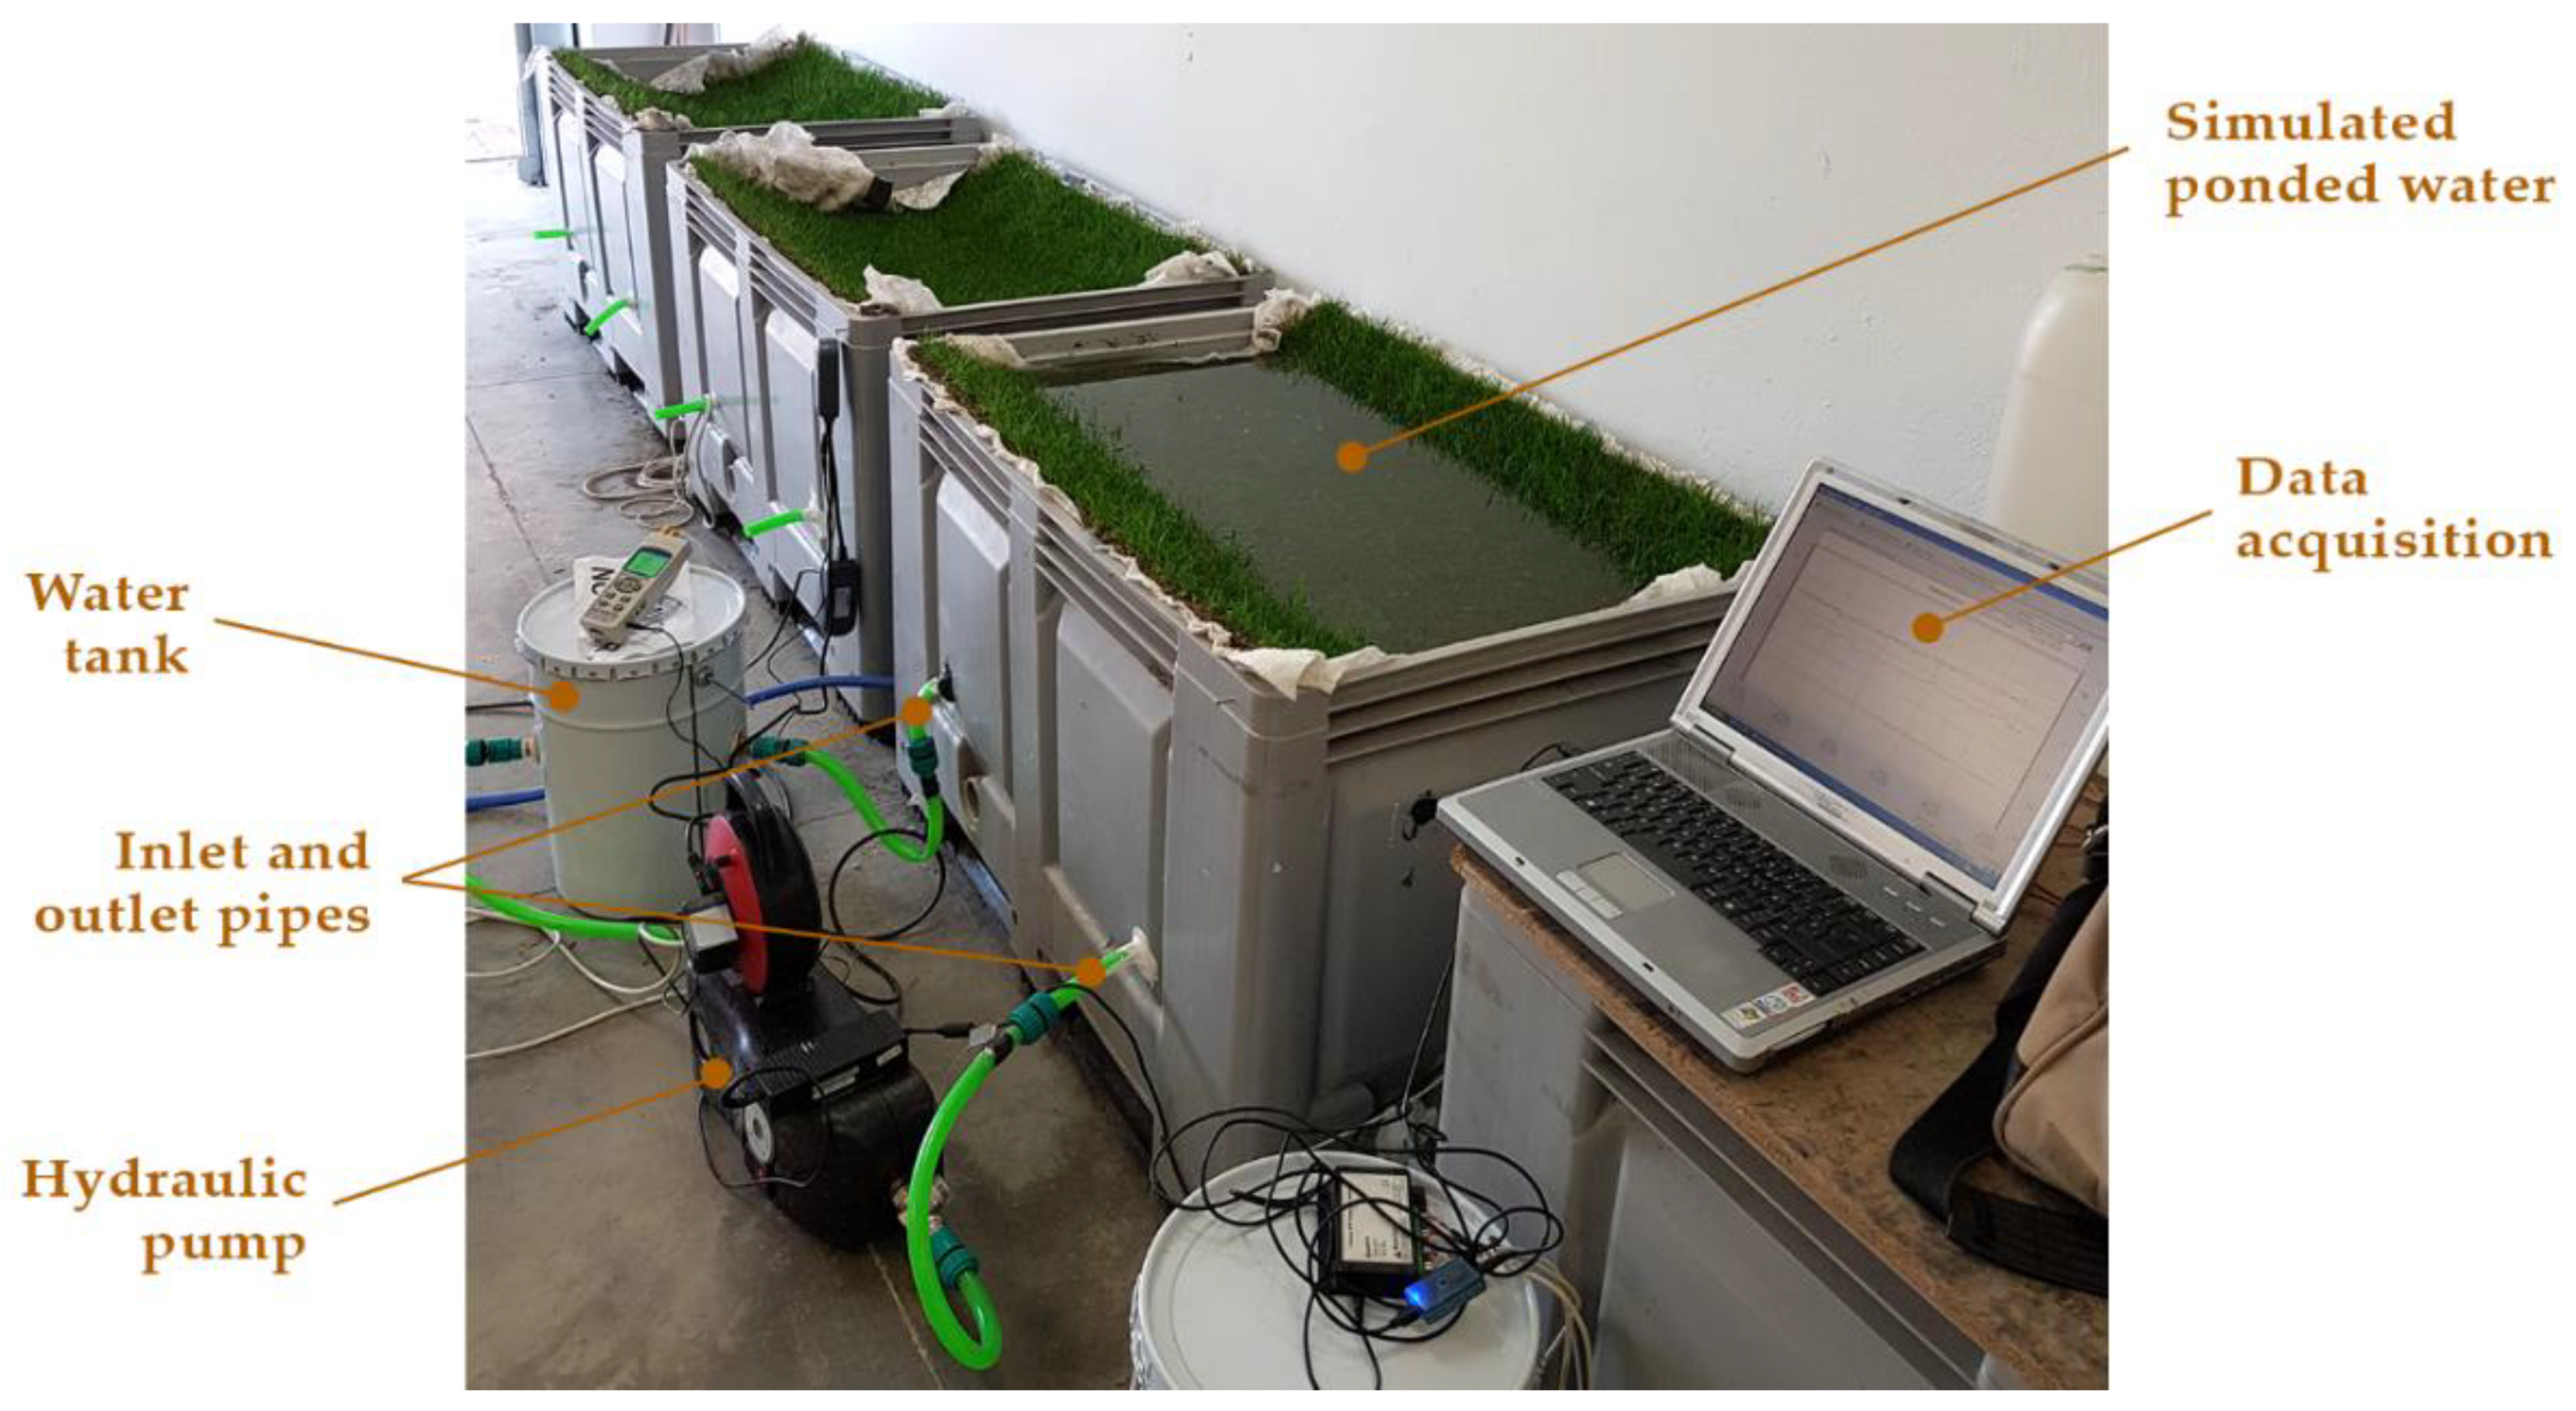
2.1. Materials and Experimental Set-Up

The structure of the wet swale selected to be modelled at a laboratory scale in this research was designed after identifying the materials and geometries most commonly used in the literature. Fardel et al. [34] established four types of swales as follows: Standard, dry, wet and bioswales. In addition, wet swales were defined by Winston et al. [35] as swales functioning under conditions of ponded water or soil moisture at near saturation. Subsequently, Fardel et al. [34] carried an extensive literature review of the geometries and design specifications for 59 swales designed across the world, finding depths for the surface layer ranging between 15 mm up to 530 mm. Besides, media and other intermediate layers, as well as, the bottom layer when included in the profile, have been reported to reach deeper depths. As an example, Andrés-Valeri et al. [36] designed a field experiment using a total depth of 500 mm measured from the bottom part of the surface including the surface layer and the bottom layer. Supporting this work, the UK CIRIA SUDS Manual suggests depths between 500 mm and 2000 mm, recommending the use of a geomembrane liner at a minimum depth of 500 mm when infiltration to the ground needs to be prevented due to unfavorable groundwater conditions [24]. Thus, the layers and materials showed in Figure 1 constituted the structure of the laboratory models tailored made for this research.
Then, three identical models at a 1:2 scale were built housed by 1110 mm × 710 mm × 610 mm high density polyethylene containers (HDPE) based upon the previous wet swale design (Figure 2). The temperature was monitored by using K thermocouple sensors placed at different heights measured from the bottom of the sub-base layer (100, 200, 300 and 400 mm) in order to identify different patterns of behaviour depending on the material and the depth of the profile, being respectively named as: RTD1, RTD2, RTD3 and RTD4. These sensors allowed the definition of the vertical temperature variation of the system. Furthermore, two K thermocouples were installed at the inlet and outlet points of the pipe in order to measure the horizontal variation of the circulating fluid within the simulated looping element during the whole experiment (Figure 2). In addition, the ambient temperature was registered all over the duration of the experiments.
A 15 L insulated tank was utilized in order to function as a reservoir for the recirculation of the water through the GSHP simulated system. An electric resistor was introduced to the tank with the aim to heat the water up to the required temperature of the system. The tank was also connected to a 43 W hydraulic pump (Figure 2) which recirculated the water through the looping element.
Finally, a constant water height was maintained over the surface layer during the whole duration of the experiments, as it can be seen in Figure 2, in order to replicate the scenario of ponded water required by the literature to be considered as a wet swale [35].

2.2. Experimental Methodology

Constant water flow was circulated at a 1 L/min rate through the 5 m polypropylene flexible pipe which simulated the geothermal looping pipe for a GSHP device over the whole duration of the experiment. Temperatures were registered at 1 min intervals, using a computer connected to all sensors as shown in Figure 2, permitting data acquisition in real-time (Figure 2).
Water was then circulated through the system at 20, 30, 40 and 50 °C. These temperatures were selected as the usual operating temperature for most of the heat pumps utilized in GSHP systems which upper limit has been encountered to be around 50 °C based upon data from the Energy Saving Trust [37].
Three replicates were used for each test at all temperatures, supporting statistical soundness. Thus, statistical analyses were designed accordingly using MATLAB software. These analyses consisted on the development of regression models. The method of least squares (MLS) was utilized, as well as R2 and co-linearity to reach the best fit. These later analyses also provide information about the quality of the models obtained as described by [38,39]. In addition, the accuracy of the models was quantified through adjusting the goodness of fit between the theoretical values and those from laboratory results. With this aim, relative and absolute errors, as well as the root mean square (RMS) values, were calculated in order to support the goodness of fit for the developed models following from the statistical methodology proposed by authors, such as Fernández-Martínez et al. [40]. This proposed method consisted of measuring uncertainty in civil engineering applications especially dedicated to structural materials.
Prior to that, pre-tests were conducted with the goal to identify the optimum duration for the experiment. For this reason, heating experiments were run between 73 and 95 h, reaching the temperature models obtained in Figure 3 a good level of fit after 8 h, based on the statistical models constructed. Quadratic models were the best fit for this stage. Based upon the previous finding, the heating stage of the experiment was fixed at 8 h duration, whilst the cooling stage was defined to last for 16 h. Therefore, each experiment was run over 24 h in total divided into the previously cited stages.
Furthermore, the heating stage consisted in heating the water in the tank (Figure 2) until it reaches the temperature of the experiment (20, 30, 40 or 50 °C depending on the experiment). Water is kept at that temperature for 8 h duration and, then the resistor is disconnected, commencing the cooling stage for the next 16 h. Thus, no heating is provided by the resistor during this later stage, allowing the system to cool down. This stage allows identifying whether the wet swale layers are more or less resilient to heating processes through the evaluation of the temperature variation within the system.

3. Results and Discussions

The results from this research were divided into two main sections: Vertical and inlet/outlet temperature difference variabilities; including a general discussion at the end, presenting future research lines.

3.1. Vertical Temperature Variation

The temperature variation registered at each layer of the wet swale for the different temperatures of operation of the simulated GSHP system were represented through the development of behavioral models as can be seen in Table 1. All models obtained high values of R2 and errors were also calculated in order to check the goodness of fit in all models.
These models depended on the temperature of operation and the duration time of the heating stage (Table 1).
Behavioral models obtained for 20 °C showed that the surface layer represented by the RTD4 sensor (the furthest from the heating source) had the lowest R2 value, but presenting the lower error value (Table 1). Furthermore, higher temperatures of operation (30 °C, 40 °C and 50 °C) produced higher R2 for the behavioral models in all depths within the wet swale profile as represented by the sensors (Table 1).
Table 1 also shows that higher variation was found in those models for the simulated GSHP housed by the swale while operating under higher temperatures (40 °C and 50 °C) as per indicated by the values obtained for the absolute error. This error also highlighted that RTD1 and RTD2 sensors registered the highest values, indicating that lower areas within the wet swale cross-section (ranging between 100 and 200 mm) were more influenced by the heating source under high temperatures of operation in the system (Figure 4).
Furthermore, the ambient temperature was steady during all experiments as can be seen in Figure 4 with little variation registered (temperature range registered between 15.5 and 17.0 °C). Ambient temperature has an influence on the surface water temperature as shown in Figure 4 for all temperatures of performance of the GSHP. The tendency for the temperature of the surface water registered by the sensor RTD4 is to converge at the same ambient temperature despite the temperature of performance of the GSHP, even in those cases with high temperatures (40 and 50 °C). The presence of water is key to cool the temperature down through evapotranspiration and heat transfer processes. Nevertheless, the remaining layers of the wet swale were affected by the temperature of performance of the system registering increases in temperature during the experiment ranging between 1.5 °C up to 8.0 °C for 20 and 50 °C respectively (Figure 4). This discussion provides a key point to consider when designing the wet swale from an ecological and biological view, especially when considering plant/vegetation growing as the temperature increase affects the supporting media for grass growing (Figure 1) as indicated by the temperature sensor RTD 3 in Figure 4. This increase in temperature might affect grass growth, and should be considered as future research looking at the best species to be used if the wet swale is designed in combination with GSHP. In addition, special attention should be taken when designing dry swales which performance is more variable from a hydrological perspective as they have a variable head of water and no presence of ponding water after infiltration. This difference of saturation would influence the heat transfer processes, modifying the temperatures within the profile of the dry swale.
A cooling stage was measured after the heating was disconnected, identifying the resilience of the system to recover the initial temperature of the wet swale layers before the experiment. Results showed that the temperature of operation of the GSHP impacted on the temperature range between the vertical sensors (RTD1, RTD2, RTD3 and RTD4) as can be seen in Figure 5.
Temperatures registered by the upper sensor within the wet swale profile (RTD4) were usually inferior in comparison to those registered by intermediate sensors, such as RTD2 and RTD3 for temperatures of operation of the GSHP system, in the top temperature range (40 °C and 50 °C) as per indicated in Figure 4. On the contrary, for lower temperatures of performance (20 °C and 30 °C), sensors RTD1 and RTD4 showed higher variation. This outcome provides an interesting insight into how ambient temperature influences the surface layer of the system for temperatures of performance similar to those registered outside the wet swale. If the GSHP system is working under temperatures above the ambient ones, this later temperature contributes to blurring the temperature variation (Figure 5). As a consequence, the climate at the chosen location will influence the resilience of the wet swale to recover from the heating stage, influencing the future design of the system as a key parameter.
Trend lines for vertical temperature variation under the temperatures of performance of the GSHP elements were also developed to further depict these scenarios as can be seen in Table 2 and Figure 4. Height values are given in m from the bottom of the sub-base layer as indicated in Figure 1.

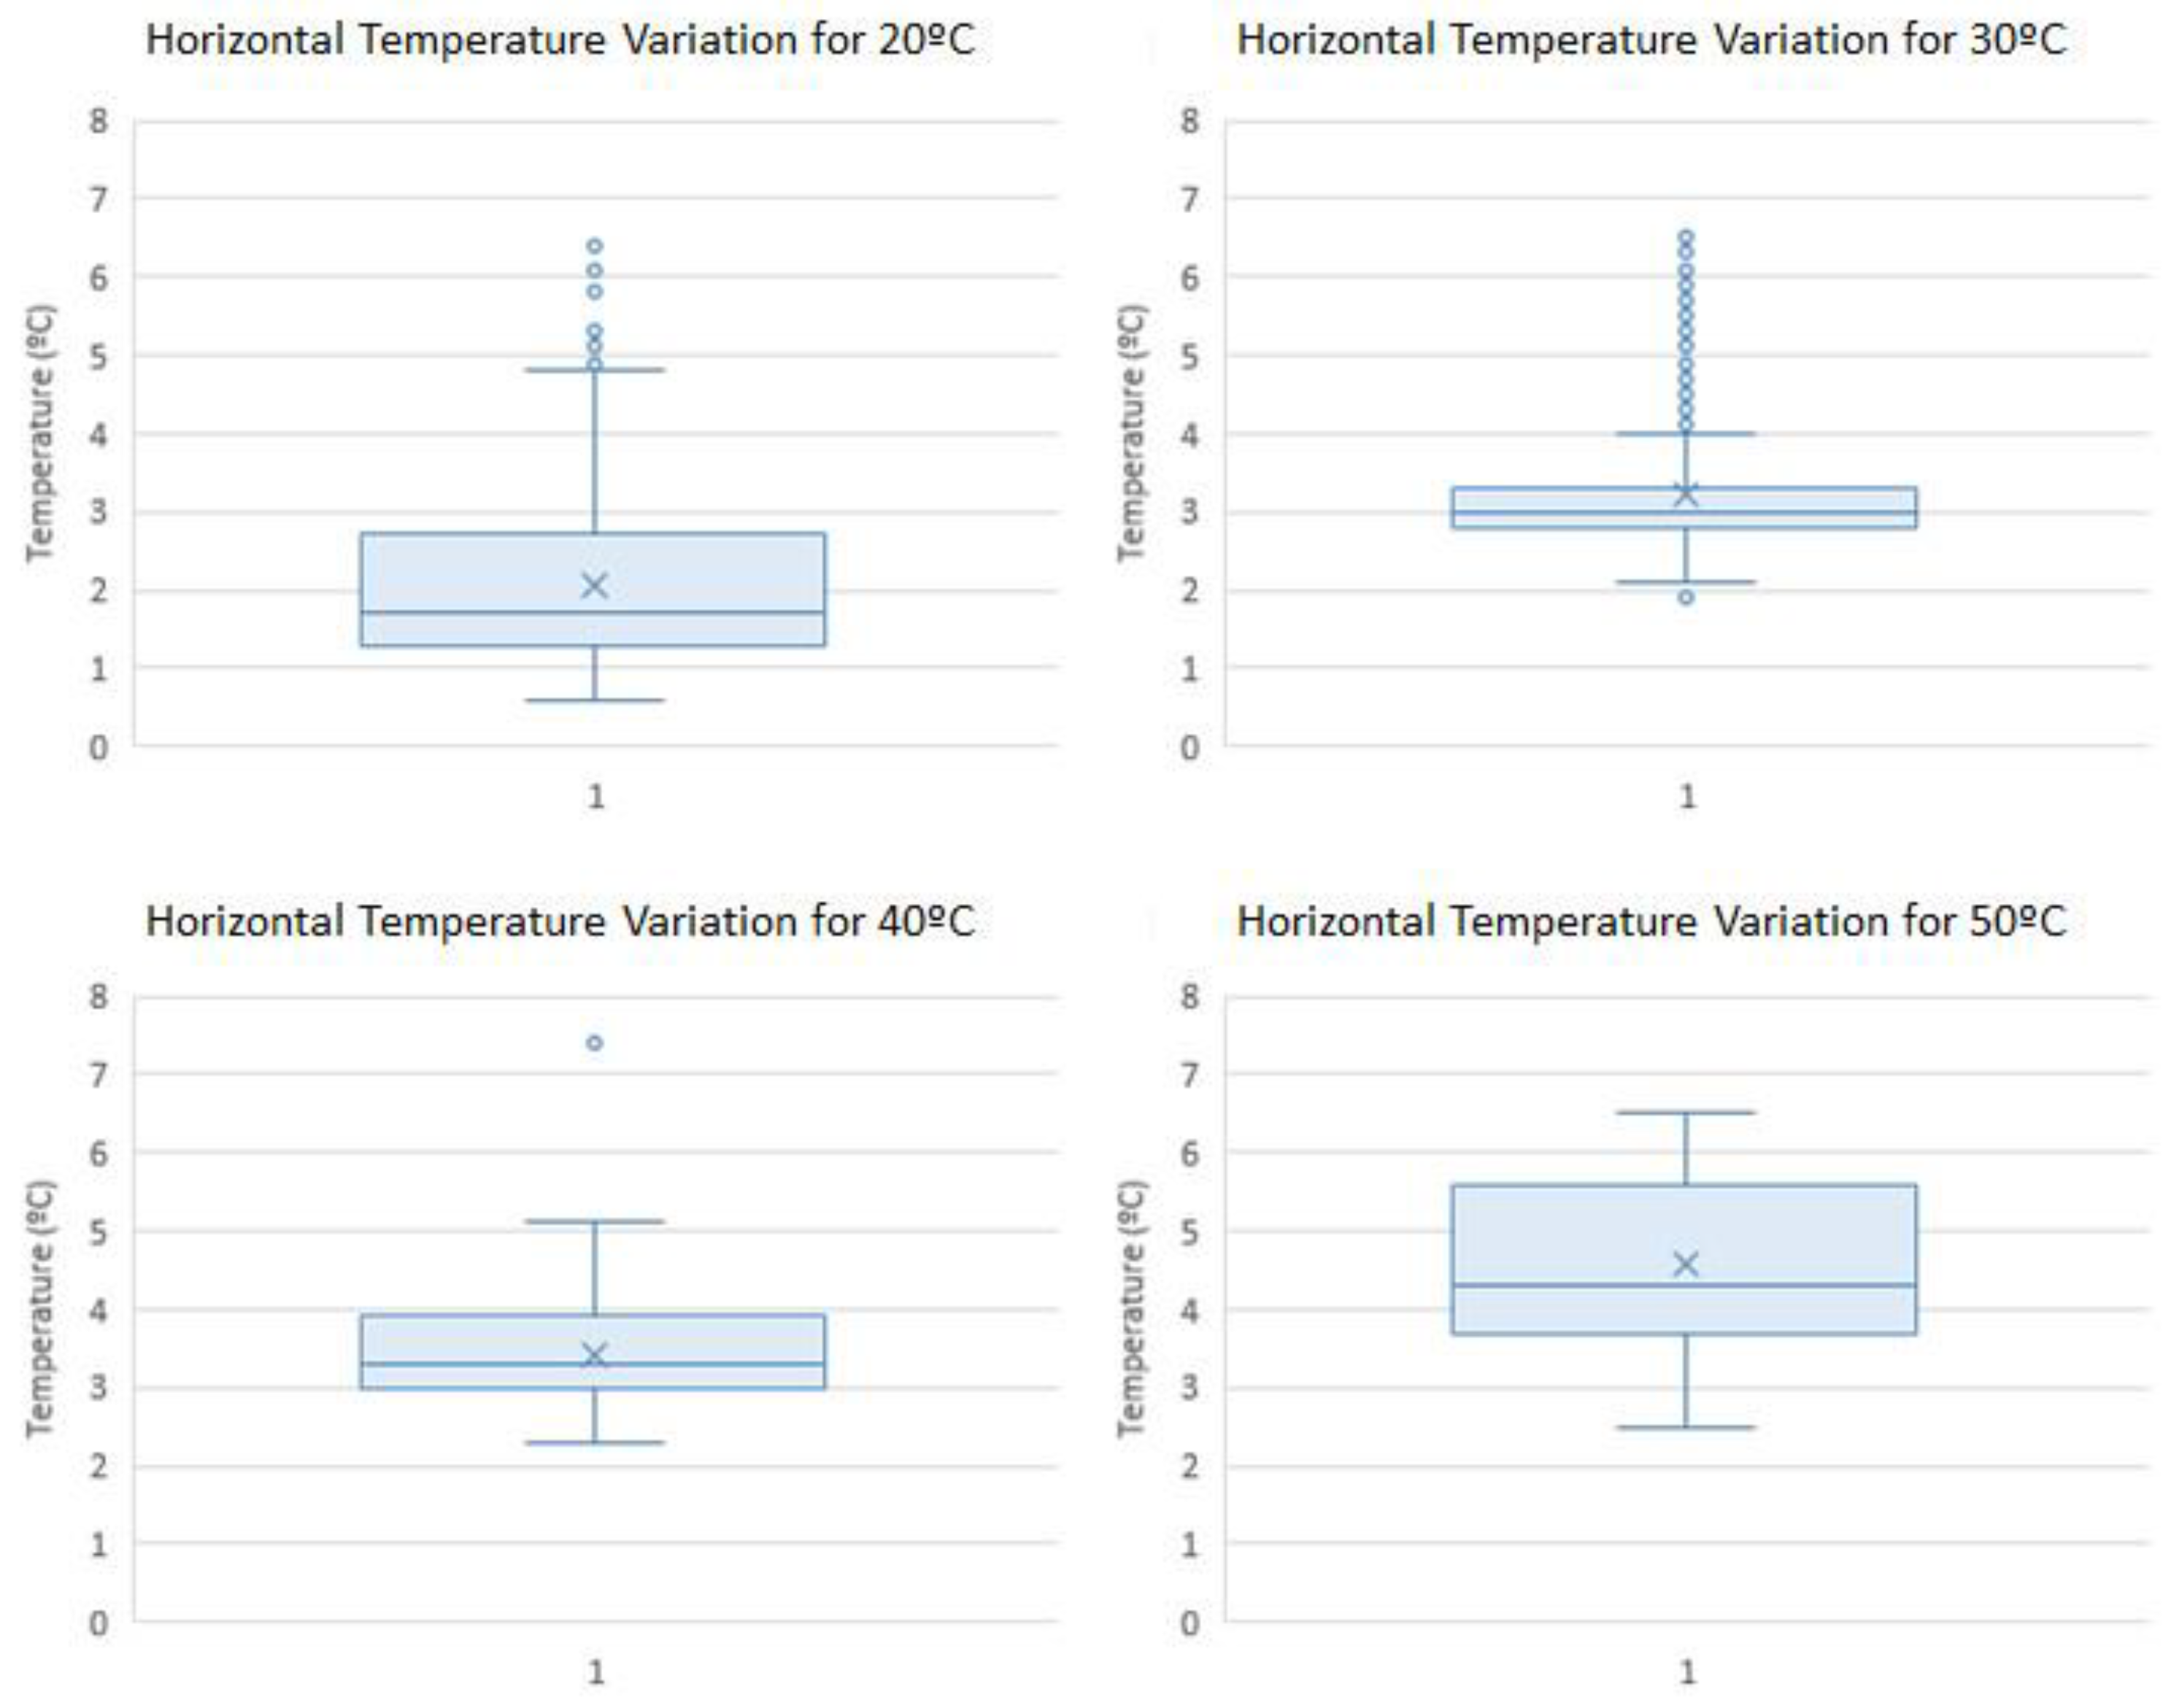
3.2. Horizontal Thermal Variation

Inlet/outlet temperature difference variation between the inlet and outlet points of the system averaged between 2.15 °C in the experiments carried out under 20 °C of the operation performance of the GSHP up to 4.60 °C working under the top temperature of the range (50 °C) (Figure 6). Low variation was registered in those cases related to 30 °C and 40 °C whilst higher variation was found for the bottom and upper temperatures of operation (20 °C and 50 °C) (Figure 5).
Results from Figure 6 are supplemented by those from the temperatures registered at the outlet point of the horizontal looping system (Figure 1 and Figure 2) plotted versus time in Figure 7. Average values can be widely interpreted, presenting a steady behaviour during the heating stage. The water is heated inside the tank (Figure 2) and then recirculated through the simulated looping system during the 8 h of the duration of this stage. A steady temperature is reached between 10 and 20 min since the beginning of the experiment, maintaining temperatures slightly lower than those simulated for the GSHP elements (20, 30, 40 and 50 °C).

3.3. General Discussions and Future Research Directions

Based upon the findings of this research, wet swales represent a good opportunity when compared with PPS combined with GSHP elements, considering the depth limitation of 500 mm for standard PPS design described by Charlesworth et al. [31]. Swale structures usually go beyond 500 mm depth, overcoming the limitation suggested by Charlesworth et al. [31] to the Coefficient of Performance (CoP). Land-take would be of a similar kind than the one necessary for the installation of a GSHP system within a PPS structure, and therefore, this solution could be used at a domestic scale, as well as commercial schemes. Swales are often used as the main drainage asset for roads and parks, representing a highly transferable technique in urban and rural environments.
Future research directions can be divided into two main steps. The first one being orientated towards laboratory experiments and modelling in order to better understand the heat transfer characteristics and processes within wet swale structures, prior to developing full-scale experiments which could validate first step findings. This addresses a key technological gap before possible commercialization of these systems. This study has provided relevant insights into how the different layers of a wet swale perform under different temperatures of operation by the GSHP system described by the Energy Saving Trust [37]. The outcomes obtained in this study have responded to the gaps identified by Andrés-Valeri et al., 2018 [32] and have further developed the understanding of the nexus between swales and GSHP, connecting to other studies carried out in other SUDS devices, such as Tota-Maharaj et al. [26].
Moreover, future research should follow on the analyses of heat transfer processes which allow further understanding of the thermal performance of the system whilst addressing key factors related to the CoP for these heat exchange systems. In this line, the use of a perimeter layer which isolates the system from horizontal losses is strongly recommended to improve the robustness of the experiment.
The next step of the laboratory experiments should also focus on numerical simulations in order to complement the laboratory experiments on the thermodynamic behaviour of the GSHP. A final step should look at characterising the CoP, allowing the determination of control strategy and balance of the plant when wet swales are exploited as a heat sink.
Further research into other types of swales, as described by Fardel et al. [34], could be conducted in order to apply the findings from this research to varying designs of swales. The next type of swale suggested for development would be the dry swale. Dry swales mainly differ from wet swales based on the lack of standing water over their surface layer at all time. This further research would supplement the findings from this research analysing the impact of standing water on temperature variation.

4. Conclusions

The hypotheses are confirmed as the application of temperatures within the usual range of performance of GSHP elements affected the overall thermal performance of the wet swale layers, presenting varying impacts. Furthermore, wet swales showed good resilience to heating processes in standard performance of GSHP elements, recovering the initial temperature in all their structural layers after 16 h. This represents an opportunity to use wet swales as multifunctional devices for stormwater management and energy saving.
Intermediate layers around 200 mm from the bottom part of the simulated laboratory model (represented by RTD2 sensor) were found to register higher variation as can be seen in the behavioral models for the vertical temperature trend of the system working under all temperatures of operation. The layer closest to the heating source was affected by the system under the heating stage, showing high resilience during the cooling stage for low temperatures (20 °C and 30 °C).
Surface layers were also affected by ambient temperature, as this effect is more noticeable for lower temperatures between 20 °C and 30 °C. However, higher temperatures of operation between 40 °C and 50 °C augmented the resilience of the surface layer, with this effect being blurred by the ambient temperature.
Inlet/outlet temperature difference was found to be lower when operating under temperatures between 30 °C and 40 °C, being higher for the extreme temperatures tested in these experiments (20 °C and 50 °C).
Development of behavioral models for the vertical and inlet/outlet temperature difference of a wet swale operating under a usual range of temperatures of the pump has been obtained, representing the first attempt in the literature consulted, to describe the thermal performance of this green infrastructure when designed alongside GSHP elements.
This research opens a new line to explore the Water and Energy nexus, contributing to new areas of development associated with ‘greener’ SUDS, such as swales. In addition, this research complements previous findings by Abrahams et al. [33] in meeting the FEW nexus, pioneering a new way of designing SUDS.

Author Contributions

Conceptualization, L.A.S.-F., S.J.C. and V.C.A.-V.; literature review J.R.-G and L.A.S.-F.; methodology, L.A.S.-F., S.J.C., V.C.A.-V. and C.R.-M.; formal analysis, C.R.-M.; investigation, V.C.A.-V., L.A.S.-F. and C.R.-M.; data curation, C.R.-M.; writing—original draft preparation, all authors; writing—review and editing, all authors; supervision, F.P.Á.-R., S.J.C., V.C.A.-V. and L.A.S.-F.; project administration, L.A.S.-F.; funding acquisition, L.A.S.-F., S.J.C. and F.P.Á.-R.

Funding

This research was funded by the following Institutions: Coventry University through the project “Investigation of green infrastructure as a combined technique for Bioretention, Flood Resilience and Renewable Energy”; the Gijon City Council and the IUTA through the projects SV-18-GIJON-1-23; the FICYT through the GRUPIN project Ref. IDI/2018/000221, co-financed with EU FEDER funds; and the University of Oviedo through the project PAPI-17-PEMERG-22.

Acknowledgments

The authors wish to acknowledge the CAWR, Coventry University, for the administrative support; and the GITECO Research Group, University of Cantabria, for housing the laboratory experiments.

Conflicts of Interest

The authors declare no conflict of interest. The funders had no role in the design of the study; in the collection, analyses, or interpretation of data; in the writing of the manuscript, or in the decision to publish the results.

References

  1. Li, Q.; Yu, Y.; Jiang, X.; Guan, Y. Multifactor-based environmental risk assessment for sustainable land-use planning in Shenzhen, China. Sci. Total Environ. 2019, 657, 1051–1063. [Google Scholar] [CrossRef] [PubMed]
  2. Chan, F.K.S.; Griffiths, J.A.; Higgitt, D.; Xu, S.; Zhu, F.; Tang, Y.-T.; Xu, Y.; Thorne, C.R. “Sponge City” in China—A breakthrough of planning and flood risk management in the urban context. Land Use Policy 2018, 76, 772–778. [Google Scholar] [CrossRef]
  3. Palazzo, E. From water sensitive to floodable: Defining adaptive urban design for water resilient cities. J. Urban Des. 2019, 24, 137–157. [Google Scholar] [CrossRef]
  4. Cai, D.; Fraedrich, K.; Guan, Y.; Guo, S.; Zhang, C. Urbanization and the thermal environment of Chinese and US-American cities. Sci. Total Environ. 2017, 589, 200–211. [Google Scholar] [CrossRef] [PubMed] [Green Version]
  5. Meerow, S.; Newell, J.P.; Stults, M. Defining urban resilience: A review. Landsc. Urban Plan. 2016, 147, 38–49. [Google Scholar] [CrossRef]
  6. Peña, L.; Onaindia, M.; Fernández de Manuel, B.; Ametzaga-Arregi, I.; Casado-Arzuaga, I. Analysing the Synergies and Trade-Offs between Ecosystem Services to Reorient Land Use Planning in Metropolitan Bilbao (Northern Spain). Sustainability 2018, 10, 4376. [Google Scholar] [CrossRef]
  7. La Rosa, D.; Privitera, R.; Barbarossa, L.; La Greca, P. Assessing spatial benefits of urban regeneration programs in a highly vulnerable urban context: A case study in Catania, Italy. Landsc. Urban Plan. 2017, 157, 180–192. [Google Scholar] [CrossRef]
  8. La Rosa, D. Accessibility to greenspaces: GIS based indicators for sustainable planning in a dense urban context. Ecol. Indic. 2014, 42, 122–134. [Google Scholar] [CrossRef]
  9. Pauleit, S.; Ambrose-Oji, B.; Andersson, E.; Anton, B.; Buijs, A.; Haase, D.; Elands, B.; Hansen, R.; Kowarik, I.; Kronenberg, J.; et al. Advancing urban green infrastructure in Europe: Outcomes and reflections from the GREEN SURGE project. Urban For. Urban Green. 2018, 40, 4–16. [Google Scholar] [CrossRef]
  10. Morison, P.J.; Brown, R.R. Understanding the nature of publics and local policy commitment to Water Sensitive Urban Design. Landsc. Urban Plan. 2011, 99, 83–92. [Google Scholar] [CrossRef]
  11. Perales-Momparler, S.; Andrés-Doménech, I.; Hernández-Crespo, C.; Vallés-Morán, F.; Martín, M.; Escuder-Bueno, I.; Andreu, J. The role of monitoring sustainable drainage systems for promoting transition towards regenerative urban built environments: A case study in the Valencian region, Spain. J. Clean. Prod. 2017, 163, S113–S124. [Google Scholar] [CrossRef]
  12. Gonzales, P.; Ajami, N.K. An integrative regional resilience framework for the changing urban water paradigm. Sustain. Cities Soc. 2017, 30, 128–138. [Google Scholar] [CrossRef] [Green Version]
  13. Cai, D.; Fraedrich, K.; Guan, Y.; Guo, S.; Zhang, C.; Zhu, X. Urbanization and climate change: Insights from eco-hydrological diagnostics. Sci. Total Environ. 2019, 647, 29–36. [Google Scholar] [CrossRef] [PubMed]
  14. Zhang, Z.; Meerow, S.; Newell, J.P.; Lindquist, M. Enhancing landscape connectivity through multifunctional green infrastructure corridor modeling and design. Urban For. Urban Green. 2019, 38, 305–317. [Google Scholar] [CrossRef]
  15. Bortolini, L.; Semenzato, P.; Almási, B.; Csizmadia, D.; Kowalski, P.; Racoń-Leja, K.; Aarrevaara, E.; Scherzer, C. Multidisciplinary approaches for programming ecosystem services of urban green spaces. In Proceedings of the Acta Horticulturae, International Society for Horticultural Science (ISHS), Leuven, Belgium, 31 October 2018; pp. 411–414. [Google Scholar]
  16. United Nations. Transforming Our World: The 2030 Agenda for Sustainable Development; United Nations: New York, NY, USA, 2015. [Google Scholar]
  17. United Nations. The Millennium Development Goals Report; United Nations: New York, NY, USA, 2015. [Google Scholar]
  18. European Commission. Supporting the Implementation of Green Infrastructure; European Commission: Brussels, Belgium, 2016. [Google Scholar]
  19. European Commission. The Multifunctionality of Green Infrastructure; European Commission: Brussels, Belgium, 2012. [Google Scholar]
  20. Huckleberry, J.K.; Potts, M.D. Constraints to implementing the food-energy-water nexus concept: Governance in the Lower Colorado River Basin. Environ. Sci. Policy 2019, 92, 289–298. [Google Scholar] [CrossRef]
  21. Zhang, P.; Zhang, L.; Chang, Y.; Xu, M.; Hao, Y.; Liang, S.; Liu, G.; Yang, Z.; Wang, C. Food-energy-water (FEW) nexus for urban sustainability: A comprehensive review. Resour. Conserv. Recycl. 2019, 142, 215–224. [Google Scholar] [CrossRef]
  22. Fan, J.-L.; Kong, L.-S.; Wang, H.; Zhang, X. A water-energy nexus review from the perspective of urban metabolism. Ecol. Model. 2019, 392, 128–136. [Google Scholar] [CrossRef]
  23. Pappalardo, V.; La Rosa, D.; Campisano, A.; La Greca, P. The potential of green infrastructure application in urban runoff control for land use planning: A preliminary evaluation from a southern Italy case study. Ecosyst. Serv. 2017, 26, 345–354. [Google Scholar] [CrossRef]
  24. Woods Ballard, B.; Wilson, S.; Udale-Clarke, H.; Illman, S.; Scott, T.; Ashley, R.; Kellagher, R. The SuDS Manual; CIRIA: London, UK, 2015; p. 968. [Google Scholar]
  25. Fletcher, T.D.; Shuster, W.; Hunt, W.F.; Ashley, R.; Butler, D.; Arthur, S.; Trowsdale, S.; Barraud, S.; Semadeni-Davies, A.; Bertrand-Krajewski, J.-L.; et al. SUDS, LID, BMPs, WSUD and more—The evolution and application of terminology surrounding urban drainage. Urban Water J. 2015, 12, 525–542. [Google Scholar] [CrossRef]
  26. Tota-Maharaj, K.; Scholz, M.; Coupe, S.J. Modelling Temperature and Energy Balances within Geothermal Paving Systems. Road Mater. Pavement Des. 2011, 12, 315–344. [Google Scholar] [CrossRef]
  27. Del-Castillo-García, G.; Borinaga-Treviño, R.; Sañudo-Fontaneda, L.A.; Pascual-Muñoz, P. Influence of pervious pavement systems on heat dissipation from a horizontal geothermal system. Eur. J. Environ. Civ. Eng. 2013, 17, 956–967. [Google Scholar] [CrossRef]
  28. Gupta, R.; Irving, R. Assessing the potential of ground source heat pumps to provide low-carbon heating and cooling in UK dwellings in a changing climate. In Proceedings of the Air Conditioning and the Low Carbon Cooling Challenge, London, UK, 27–29 July 2008; p. 14. [Google Scholar]
  29. Nathanail, J.; Banks, V. Climate change: Implications for engineering geology practice. Geol. Soc. Lond. Eng. Geol. Spec. Publ. 2009, 22, 65–82. [Google Scholar] [CrossRef]
  30. Price, S.J.; Terrington, R.L.; Busby, J.; Bricker, S.; Berry, T. 3D ground-use optimisation for sustainable urban development planning: A case-study from Earls Court, London, UK. Tunn. Undergr. Sp. Technol. 2018, 81, 144–164. [Google Scholar] [CrossRef]
  31. Charlesworth, S.M.; Faraj-Llyod, A.S.; Coupe, S.J. Renewable energy combined with sustainable drainage: Ground source heat and pervious paving. Renew. Sustain. Energy Rev. 2017, 68, 912–919. [Google Scholar] [CrossRef]
  32. Andrés-Valeri, V.C.; Sañudo-Fontaneda, L.A.; Rey-Mahía, C.; Coupe, S.J.; Álvarez-Rabanal, F.P. Thermal performance of wet swales designed as multifunctional green infrastructure systems for water management and energy saving. In Proceedings of the International Research Conference on Sustainable Energy, Engineering, Materials and Environment, Mieres, Spain, 25–27 September 2018; p. 18. [Google Scholar]
  33. Abrahams, J.; Coupe, S.; Sañudo-Fontaneda, L.; Schmutz, U. The Brookside Farm Wetland Ecosystem Treatment (WET) System: A Low-Energy Methodology for Sewage Purification, Biomass Production (Yield), Flood Resilience and Biodiversity Enhancement. Sustainability 2017, 9, 147. [Google Scholar] [CrossRef]
  34. Fardel, A.; Peyneau, P.-E.; Béchet, B.; Lakel, A.; Rodriguez, F. Analysis of swale factors implicated in pollutant removal efficiency using a swale database. Environ. Sci. Pollut. Res. 2019, 26, 1287–1302. [Google Scholar] [CrossRef]
  35. Winston, R.; F Hunt, W.; Kennedy, S.; Wright, J. Evaluation of Permeable Friction Course (PFC), Roadside Filter Strips, Dry Swales, and Wetland Swales for Treatment of Highway Stormwater Runoff; North Carolina Department of Transportation: Raleigh, NC, USA, 2011. [Google Scholar]
  36. Andrés-Valeri, V.C.; Castro-Fresno, D.; Sañudo-Fontaneda, L.A.; Rodriguez-Hernandez, J. Comparative analysis of the outflow water quality of two sustainable linear drainage systems. Water Sci. Technol. 2014, 70, 1341–1347. [Google Scholar] [CrossRef]
  37. Energy Saving Trust Domestic Ground Source Heat Pumps: Design and Installation of Closed-Loop Systems—A Guide for Specifiers, Their Advisors and Potential Users; Energy Savin Trust™: London, UK, 2007; p. 24.
  38. Steel, R.G.D.; Torrie, J.H.; Dickey, D.A. Principles and Procedures of Statistics: A Biometrical Approach, 3rd ed.; McGraw-Hill Series in Probability and Statistics; McGraw-Hill: New York, NY, USA, 1997; ISBN 9780070610286. [Google Scholar]
  39. Novales, A. Análisis de Regresión; Universidad Complutense de Madrid: Madrid, Spain, 2010; p. 116. [Google Scholar]
  40. Juan Luis, F.-M.; Zulima, F.-M.; Denys, B. The uncertainty analysis in linear and nonlinear regression revisited: Application to concrete strength estimation. Inverse Probl. Sci. Eng. 2018, 1–25. [Google Scholar] [CrossRef]
Figure 1. Cross-section of the laboratory wet swale model.
Sustainability 11 03118 g001
Figure 2. Experimental set-up.
Sustainability 11 03118 g002
Figure 3. Statistical quadratic models for the temperature sensors RTD1, RTD2, RTD3 and RTD4 during the pre-tests.
Sustainability 11 03118 g003
Figure 4. Vertical temperature variation during the cooling stage.
Sustainability 11 03118 g004
Figure 5. Vertical temperature variation during the cooling stage.
Sustainability 11 03118 g005
Figure 6. Box-plot showing the average values for the inlet/outlet temperature difference provided by the system under the different operational temperatures of the simulated GSHP system.
Sustainability 11 03118 g006
Figure 7. Average values for the outlet temperature difference under the different operational inlet temperatures of the simulated GSHP system.
Sustainability 11 03118 g007
Table 1. Behavioral models of vertical thermal variation under the four temperatures of operation selected for the simulated ground source heat pump (GSHP) system in the experiment, depending on the time in minutes.
T (°C)SensorBehavioral ModelR2Absolute Error (%)Relative Error (%)RMS Error (%)
20RTD1 T   ( ° C ) = 2.9079 · 10 06 · t 2 + 0.0038 · t + 15.2110 0.984515.06180.19670.6867
RTD2 T   ( ° C ) = 3.5333 · 10 06 · t 2 + 0.0038 · t + 15.5638 0.984213.94690.17750.6359
RTD3 T   ( ° C ) = 3.3094 · 10 06 · t 2 + 0.0038 · t + 15.2652 0.99199.62830.12520.4390
RTD4 T   ( ° C ) = 9.7249 · 10 07 · t 2 0.0002 · t + 15.0351 0.90257.16940.09890.3269
30RTD1 T   ( ° C ) = 6.3338 · 10 06 · t 2 + 0.0095 · t + 15.9646 0.99966.57080.07620.2996
RTD2 T   ( ° C ) = 5.0091 · 10 06 · t 2 + 0.0083 · t + 16.8260 0.998111.57990.13060.5280
RTD3 T   ( ° C ) = 2.8594 · 10 06 · t 2 + 0.0066 · t + 16.3455 0.99868.55910.09870.3902
RTD4 T   ( ° C ) = 2.8594 · 10 06 · t 2 + 0.0066 · t + 16.3455 0.99869.54160.12410.4350
40RTD1 T   ( ° C ) = 1.0367 · 10 05 · t 2 + 0.0152 · t + 15.9599 0.995429.80530.32781.3590
RTD2 T   ( ° C ) = 1.4382 · 10 05 · t 2 + 0.0177 · t + 16.5443 0.996929.62660.30931.3508
RTD3 T   ( ° C ) = 9.6683 · 10 06 · t 2 + 0.0143 · t + 15.8760 0.999114.24370.15800.6494
RTD4 T   ( ° C ) = 6.8632 · 10 06 · t 2 + 0.0143 · t + 15.8760 0.999125.32490.32961.1547
50RTD1 T   ( ° C ) = 1.7541 · 10 05 · t 2 + 0.0239 · t + 15.4303 0.998926.13990.26581.1918
RTD2 T   ( ° C ) = 1.9195 · 10 05 · t 2 + 0.0250 · t + 16.5089 0.998134.97410.33801.5947
RTD3 T   ( ° C ) = 1.3551 · 10 05 · t 2 + 0.0206 · t + 16.5089 0.998116.87820.17530.7695
RTD4 T   ( ° C ) = 8.4280 · 10 06 · t 2 + 0.0005 · t + 15.1394 0.991426.83870.34741.2237
Table 2. Polynomic trend lines for vertical variation of the temperatures represented in Figure 4.
Temperature (°C)Behavioral ModelR2
20 T   ( ° C ) = 3.250 · z 2 + 12.933 · z + 23.298 0.9657
30 T   ( ° C ) = 1.543 · z 2 + 6.747 · z + 13.720 0.9968
40 T   ( ° C ) = 1.889 · z 2 8.169 · z + 16.195 0.9997
50 T   ( ° C ) = 1.475 · z 2 + 2.225 · z + 0.025 0.9308

