Household Income Diversification and Food Security: Evidence from Rural and Semi-Urban Areas in Ethiopia


College of Economics and Management, Huazhong Agricultural University, Wuhan 430070, Hubei, China
*
Author to whom correspondence should be addressed.
Sustainability 2019, 11(12), 3232; https://doi.org/10.3390/su11123232
Submission received: 2 May 2019
/
Revised: 7 June 2019
/
Accepted: 10 June 2019
/
Published: 12 June 2019
(This article belongs to the Section Sustainable Agriculture)
Abstract
:Reducing food insecurity remains a major public policy challenge in developing countries. Food insecurity becomes severe in areas where households highly depend on undiversified livelihoods. However, studies linking household income diversification to food security are limited. This study, therefore, examined the effect of income diversification on food security in the Ambo district, Ethiopia. A survey of rural (n = 175) and semi-urban (n = 175) households was conducted. The Simpson’s index of diversity (SID) was used to measure the level of household income diversity. Food security (access) was measured using the daily calorie consumption (nutrition-based) and the household food insecurity access scale (HFIAS) (experience-based) methods. Consequently, we used binary logistic regression and ordinary least squares (OLS) estimation methods to determine the effect of household income diversity on food security. The instrumental variable (IV) method was also employed to overcome an endogeneity bias. The results revealed that the level of household income diversification was low, and the majority of households were food insecure. The binary logistic and the second-stage least square (2SLS) regression results suggested that income diversification contributes significantly and positively to food security in the study areas. Therefore, we conclude that income diversification reduces food insecurity by enhancing households’ access to food.
1. Introduction
The current rate of food insecure people has caught the attention of governments and development agents in the world. The Food and Agriculture Organization (FAO) reported that 10.9% of the world, 20.4% of Africa and 31.4% of Eastern Africa people were undernourished in 2017 [1]. “Food security exists when all people, at all times, have physical, social, and economic access to sufficient, safe, and nutritious food that meets their dietary needs and food preferences for an active and healthy life.” as stated in [2]. A previous study shows that in many developing countries, the condition of household food security depends mainly on physical and economic means (accessibility) [3]. Berry et al. stated that economic, social, and environmental sustainability are essential for the accessibility to food for all people. Hence, the authors argued that without integrating sustainability to food security, it is impossible for policymakers to mitigate food insecurity. In Ethiopia, about 80% of the society lives in rural areas where there are not sufficient infrastructural facilities and also where the majority of the households are smallholders [4]. Exacerbated by the lack of infrastructural facilities, drought, weather variability, and others, food insecurity becomes a major challenge in rural Ethiopia. Endalew et al. [5], for instance, stated that about 10% of Ethiopians were chronically food insecure and this figure increased to 15% during frequent drought periods. In addition, in 2018, the Global Food Security Index (GFSI) of the Economist Intelligence Unit (EIU) ranked Ethiopia as 100th among 113 countries with food affordability, availability, quality, and safety. According to the EIU [6] index, Ethiopia is a state with 28.8% prevalence of undernourishment, 201 kcal/person/day of intensity of food deprivation, and very low results (performance) in diet diversification, sufficiency of food supply, micronutrient availability, and food consumption as a share of household expenditure and proportion of population under the global poverty line.
The Ethiopian government and other development partners have implemented various policy interventions and programs to improve the food security conditions of the citizens. For instance, through the Productive Safety Net Program (PSNP), eight million chronically food insecure people have been supported since 2005. However, households continuously receiving food aid cannot build sustainable resilience for food insecurity in the long run; unless supplemented by households’ asset building mechanisms [7]. Moreover, other studies suggested that the improvement in infrastructure, credit services, and social capital ultimately enhanced the food security situation of households [8,9]. Although Ethiopian public expenditure on infrastructure and other facilities is reasonably increasing at the present time as compared with before, reducing food insecurity becomes a challenge in the country [10].
Evidence in the literature indicates that income diversification and food security are closely related. Income diversification provides additional income that relaxes the financial constraint on households. Subsequently, households spend more on their basic needs including food, clothing, education, and healthcare. Thus, multiple sources of income with reliable amounts are essential to ensuring food for households [11]. Moreover, a study showed that the prevalence of child stunting and underweight was lower among farmers with off-farm incomes as compared with families without off-farm incomes [12]. The same study also stated that diversification of off-farm activities contributed to higher food production by easing capital constraints on the households, and therefore it was used to produce food.
A study showed that food insecurity in Ethiopia is derived primarily from dependence on undiversified livelihoods based on low-output rain-fed agriculture [13]. However, studies linking household income diversification to food security in Ethiopia are limited. For instance, Michlera and Josephson [14] measured the effect of crop diversity on the poverty status of households and suggested that families who grow a diverse set of crops are less likely to be poor as compared with households specializing in their crop production. In addition, income diversification of non-farm and off-farm activities (such as off-farm employment, petty trade, and selling charcoal and firewood) was used as a coping strategy during severe food insecurity among rural households, especially when agricultural production was affected by drought [5,10,15]. Similarly, Mentamo and Geda [8] reported that households diversify their livelihood more when driven by despairing conditions such as acute food insecurity. Therefore, this study examined the effect of income diversification on food security (access) among rural and semi-urban households of the Ambo district, Ethiopia and determined the status of household income diversity and food security in the study areas.
In addition to contributing to the sparse body of empirical literature, the results of this study may influence policymakers to begin shifting their strategy focus from specialization and intensification to sustainable livelihood diversification to reduce poverty and attenuate food insecurity.
2. Materials and Methods
The primary objective of this study was to examine the effect of income diversification on food security in the study areas. Hence, both quantitative and qualitative approaches were employed in the study.
2.1. The Study Site
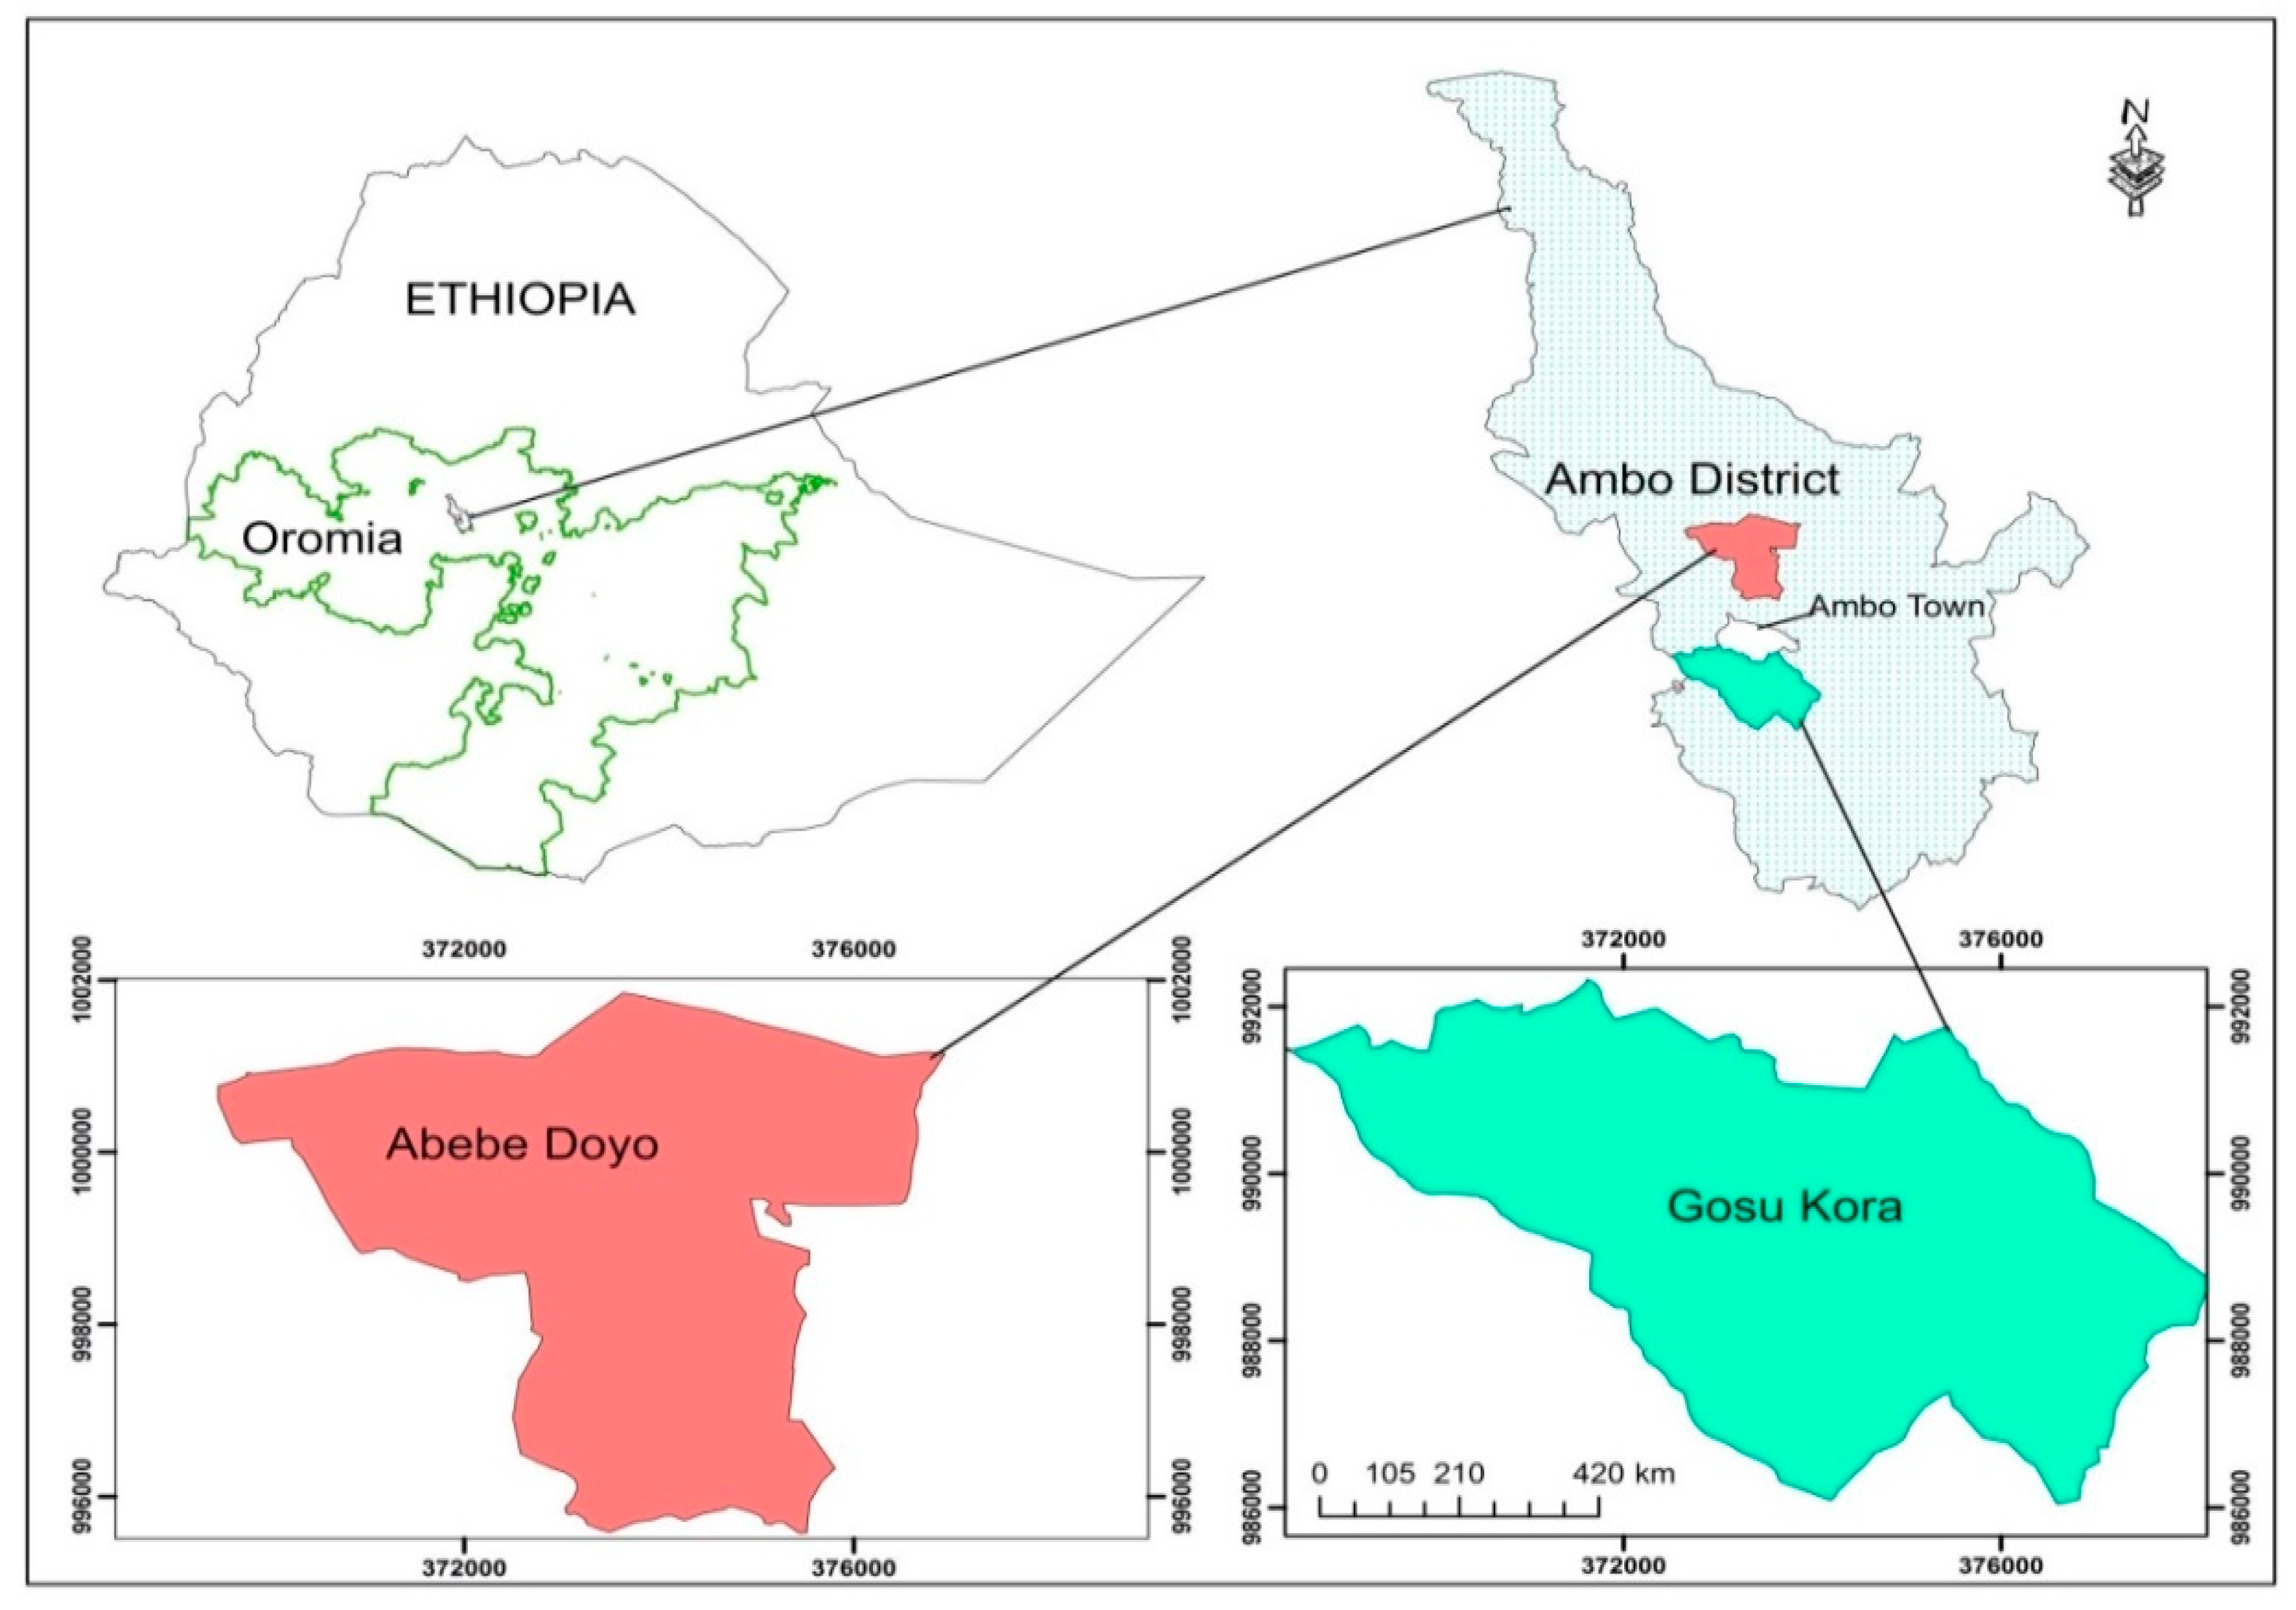
This study was conducted in the Ambo district, located in Oromia Regional State, Ethiopia (Figure 1). Currently, the district has 32 kebeles (kebele is a local name given for the smallest administrative unit in Ethiopia), which cover a total area of 78,359.25 hectares (ha), with a population of 113, 087. The area is characterized by a climate with an annual average temperature of 15–29°C and 800–1000 mm of rainfall. Most of the farmers in the district are smallholders and are faced with increasing landlessness due to rapid population growth in the district. Land and property rights remain vested in the state leaving the majority of smallholder farmers to only usufruct rights, as pertains throughout the country. The district has two crop production seasons which are belg (the temporary crop production periods which constitute the sowing time (February to April) and the harvesting time (June to September) and meher (the main production season that constitutes the sowing period (April to July) and the harvesting time (October to December) [16]. Crops such as wheat, teff (Eragrostis teff), barley, sorghum, and maize are among the main products of the district. The staple food of the people is enjera (local food similar to chapatti but larger) made from teff, and also wheat, barley, maize, and sorghum. The primary livelihood of the people in the study area is agriculture. Moreover, some households engage in non-farm and off-farm activities.
2.2. Data Collection
Primary data were collected from the head of households and/or a person responsible for preparing meals. The household heads responded after discussing with a person(s) responsible for the preparation of food, whenever needed. The study employed two different questionnaires to conduct the survey. First, an administered structured questionnaire was developed to collect the annual income and food consumption in the households by considering a recall period of seven days. Second, we adapted the Household Food Insecurity Access Scale (HFIAS), which consisted of nine occurrence questions that captured the severity of household food insecurity from a mildly insecure form (worrying about having enough food) to the most severely insecure form (going the whole day without eating) [17]. The questionnaire was translated into Afaan Oromoo (local language), and data were collected by four well-trained enumerators who documented responses, from February to April 2018.
2.3. Sampling Procedures
In this study, the Abebe Doyo kebele (also called the rural area in this study) and the Gosu Kora kebele (the semi-urban area) were purposively sampled. The selection criteria for the two kebeles were observable differences in socioeconomic activities based on their proximity to a nearby town (Ambo town in this case) (Figure 1). In addition, the expected difference in cost of living between rural and semi-urban areas (higher in semi-urban), signified the difference in household participation in various socioeconomic activities. The lists of all residents were obtained from the Ambo district office. Thereafter, 175 respondents were selected randomly from each kebele. The samples represented 15% of the total households of Abebe Doyo and 14% of the total households of Gosu Kora based on the sample size recommendation by Kumar; who suggested that one should select 10–20% of the accessible population for a target sample [18].
2.4. Measuring Food Security
Various approaches have been used to measure different dimensions (availability, access, utilization, and stability) of food security. However, it was not been easy to get a single measure that was comparable over time and places, and also captured all these dimensions at the same time [19,20,21,22].
Most researchers and policymakers use two commonly used measures of food insecurity which are household calorie consumption (nutrition-based) and a measure related to household perspectives on food security (experience-based) [17]. These two household-level measures assess one dimensions of food security which is access to food. Hence, in this study, to measure the household food security status (access), the study used both daily adult equivalent per capita calorie consumption (nutrition-based), a quantitative approach, and the experiential measure, a qualitative approach.
To determine the calorie intake of individuals, we used the Ethiopian food composition table, part III, which was developed by the Ethiopian Health and Nutrition Research Institute (EHNRI) [23]. We identified 103 food items out of 769 food items that were commonly used in the study areas. Hence, the foods eaten by the family members in the last seven days were collected. We used local common instruments such as bowl, sack, cup, can, pot, spoon, kerepe, and others to measure the size of food, and converted them into kilograms. However, the foods consumed outside of the home and the possible food wastes were not considered. Nevertheless, in rural Ethiopia, people do not commonly buy and eat outside the home, except in a few cases when people may be offered food by their neighbors, friends or relatives. Moreover, we observed that the magnitude of food waste after table (leftovers) in rural areas of the country is smaller than the food waste in urban areas.
Concerning the experience-based measurement, the HFIAS measure used by the U.S to estimate the prevalence of food insecurity in the country was adapted [20]. The measure was designed to capture the predictable reactions and responses of a household indicating that food was of insufficient quality and quantity, and that there was anxiety over the food supply (for the period of the previous 30 days in our case). Finally, to facilitate the application of the statistical model, the food insecurity continuous data were converted into a binary form by classifying households as food secure, where the household did not experience any food insecurity situations and rarely worried about having enough food, or otherwise, as food insecure [17].
2.5. Data Analysis
Researchers have used different methods to measure the level of household income diversity. The Herfindahl–Hirschman index, Shannon’s diversity index and Simpson’s index of diversity (SID) are among the most commonly used measures [24,25]. Recently, the SID has been widely adopted to measure the effect of income diversity on rural livelihood [8,11,25]. Therefore, we adapted the SID method for this study, and it is specified as follows:
where, SID is the Simpson’s index of diversity, N is a total number of sources of income, and is the proportion of household income coming from ith sources. The value of SID always falls between 0 and 1. The SID was equal to zero if a given household had only one source of income and approached one as the number of sources of income increased. The closer the value of the index was to one, the more the degree of diversification, and the closer the value of the index was to zero, the more the degree of specialization.
Additionally, the daily calorie intake method (reported undernourishment or nutrition-based) and household perceptions on food security (experience-based) were used to measure food security (access). Hence, in this study, the average daily minimum calorie intake of a moderately active adult equivalent, 2280 kilocalorie (kcal), was used as the food security threshold [14,26]. Consequently, the food security index (FSI) was determined as follows [25].
where, FSI is the food security index (status) of ith household, is the actual daily per capita calorie intake of the ith household, and R is the recommended per capita daily calorie intake (2280kcal). When, FSI ≥ 1, the given household was categorized as food secure, otherwise, it was categorized as food insecure.
A binary logistic regression was also employed to determine the effect of household income diversification on food security. For estimating the logit model, the dependent variable was food security which takes a value of 1 if the household is food secure and 0 if not. Thus, mathematically the logit model was specified as follows [27]:
where, is the probability of household being food secure.
where i = 1, 2, 3…n, is intercept, is regression coefficients to be estimated, is a disturbance term that affects but not observed by the researcher, and is vectors of independent variables.
The probability that a household was food insecure is:
Then, the odds ratio is written as:
The left-hand side of Equation (4), , is simply the odds ratio in favor of food secure. It is the ratio of the probability that a household is secure in food to the probability that the household is not secure in food. Finally, by taking the natural log of Equation (4) the log of odds ratio is written as:
where, is log of the odds ratio in favor of food secure, which is not only linear in but also linear in the parameters.
Moreover, multiple linear regression was used to determine the effect of income diversity on the food security index. The model is specified as follows [27]:
where, is the food security index; , , … are explanatory variables; 0 is the intercept, 1 is the slope coefficient on , is the coefficient on , and so on; and is error term.
The study employed an instrumental variable (IV) method to overcome the omitted variable bias and the possibility of reverse causality where the food security condition of a household determines the level of household income diversification (an endogeneity bias). Thus, the household income diversity index was treated as an endogenous variable and access to credit service, proximity to market, and having training or special skill in craftsmanship were considered as instruments. This approach is similar to that used by Babatunde and Qaim [12] in different contexts. Studies suggested that access to credit and proximity to a market encourage households to engage in various economic activities, and therefore income diversity increases [28,29]. Additionally, if the head of the household or any other family member has training or a special skill in craftsmanship, it initiates that family to engage in different non-farm activities available in their area. Zerai and Gebreegziabher [30], for instance, identified that households with special skills initiated the households to look for non-farm activities in addition to farm work. Similarly, Amogne et al., [31] suggested that the lack of entrepreneurial training was among the main factors that limited households to not look for additional sources of income.
The chosen instruments were valid (did not have direct correlation with food security) because of the following reasons: First, in Ethiopia, government and private financial institutions give credit to rural households with a strict follow-up to ensure that the farmers utilize the money for the intended purpose (mainly to do a business or to finance their agriculture). Hence, credit services are not aimed at buy food materials. Secondly, in rural Ethiopian situations, the lack of infrastructural facilities (road and transportation) exacerbates the food security condition and prohibits households from accessing the market rather than the distance to the market. In this study, for instance, the average distance from a household to the nearby market (Ambo town) was only 1.53 hours. Third, special skills, training or experience of households encourages them to get involved in different income generating activities which impacts the food security status of the households.
Finally, an independent samples t-test was used to determine whether the mean of the SID and daily calorie intake of the rural and semi-urban households were statistically different from one another or not.
3. Results
3.1. Descriptive Analysis
Descriptive analyses of key variables were performed for each kebele and total (pooled) respondents (Table 1). The respondents’ level of education, access to credits and market, special skills or training in craftsmanship, total annual income, level of income diversity (SID), average daily calorie intake, and FSI differed markedly between the two study areas. In most of the analyses, the Gosu Kora households recorded better results than the Abebe Doyo households. We performed a t-test analysis on the SID and calorie intake (the main variables, Table 2) to validate the statistical significance between the two kebeles.
3.2. The SID and Daily Calorie Consumption of Households of the Two Study Areas: The Mean Comparison
The mean comparison of the SID and daily calorie intake between the two kebeles is presented in Table 2. The results of the independent samples t-tests showed that the mean SID and daily calorie consumption of the Gosu Kora households were significantly higher than that of the Abebe Doyo households.
3.3. Sources of Household Income and Their Contribution
The shares of household income from the basic economic activities in the study areas with agriculture alone contributing 83% of total income in the Abebe Doyo households and 55% of total income in the Gosu Kora households (Figure 2). On the other hand, non-farm, off-farm, and other activities contributed 24%, 7%, and 14% to the income of Gosu Kora households, respectively; and contributed 8%, 3% and 6% to the income of households in Abebe Doyo households, respectively.
3.4. Food Security Situation of Households
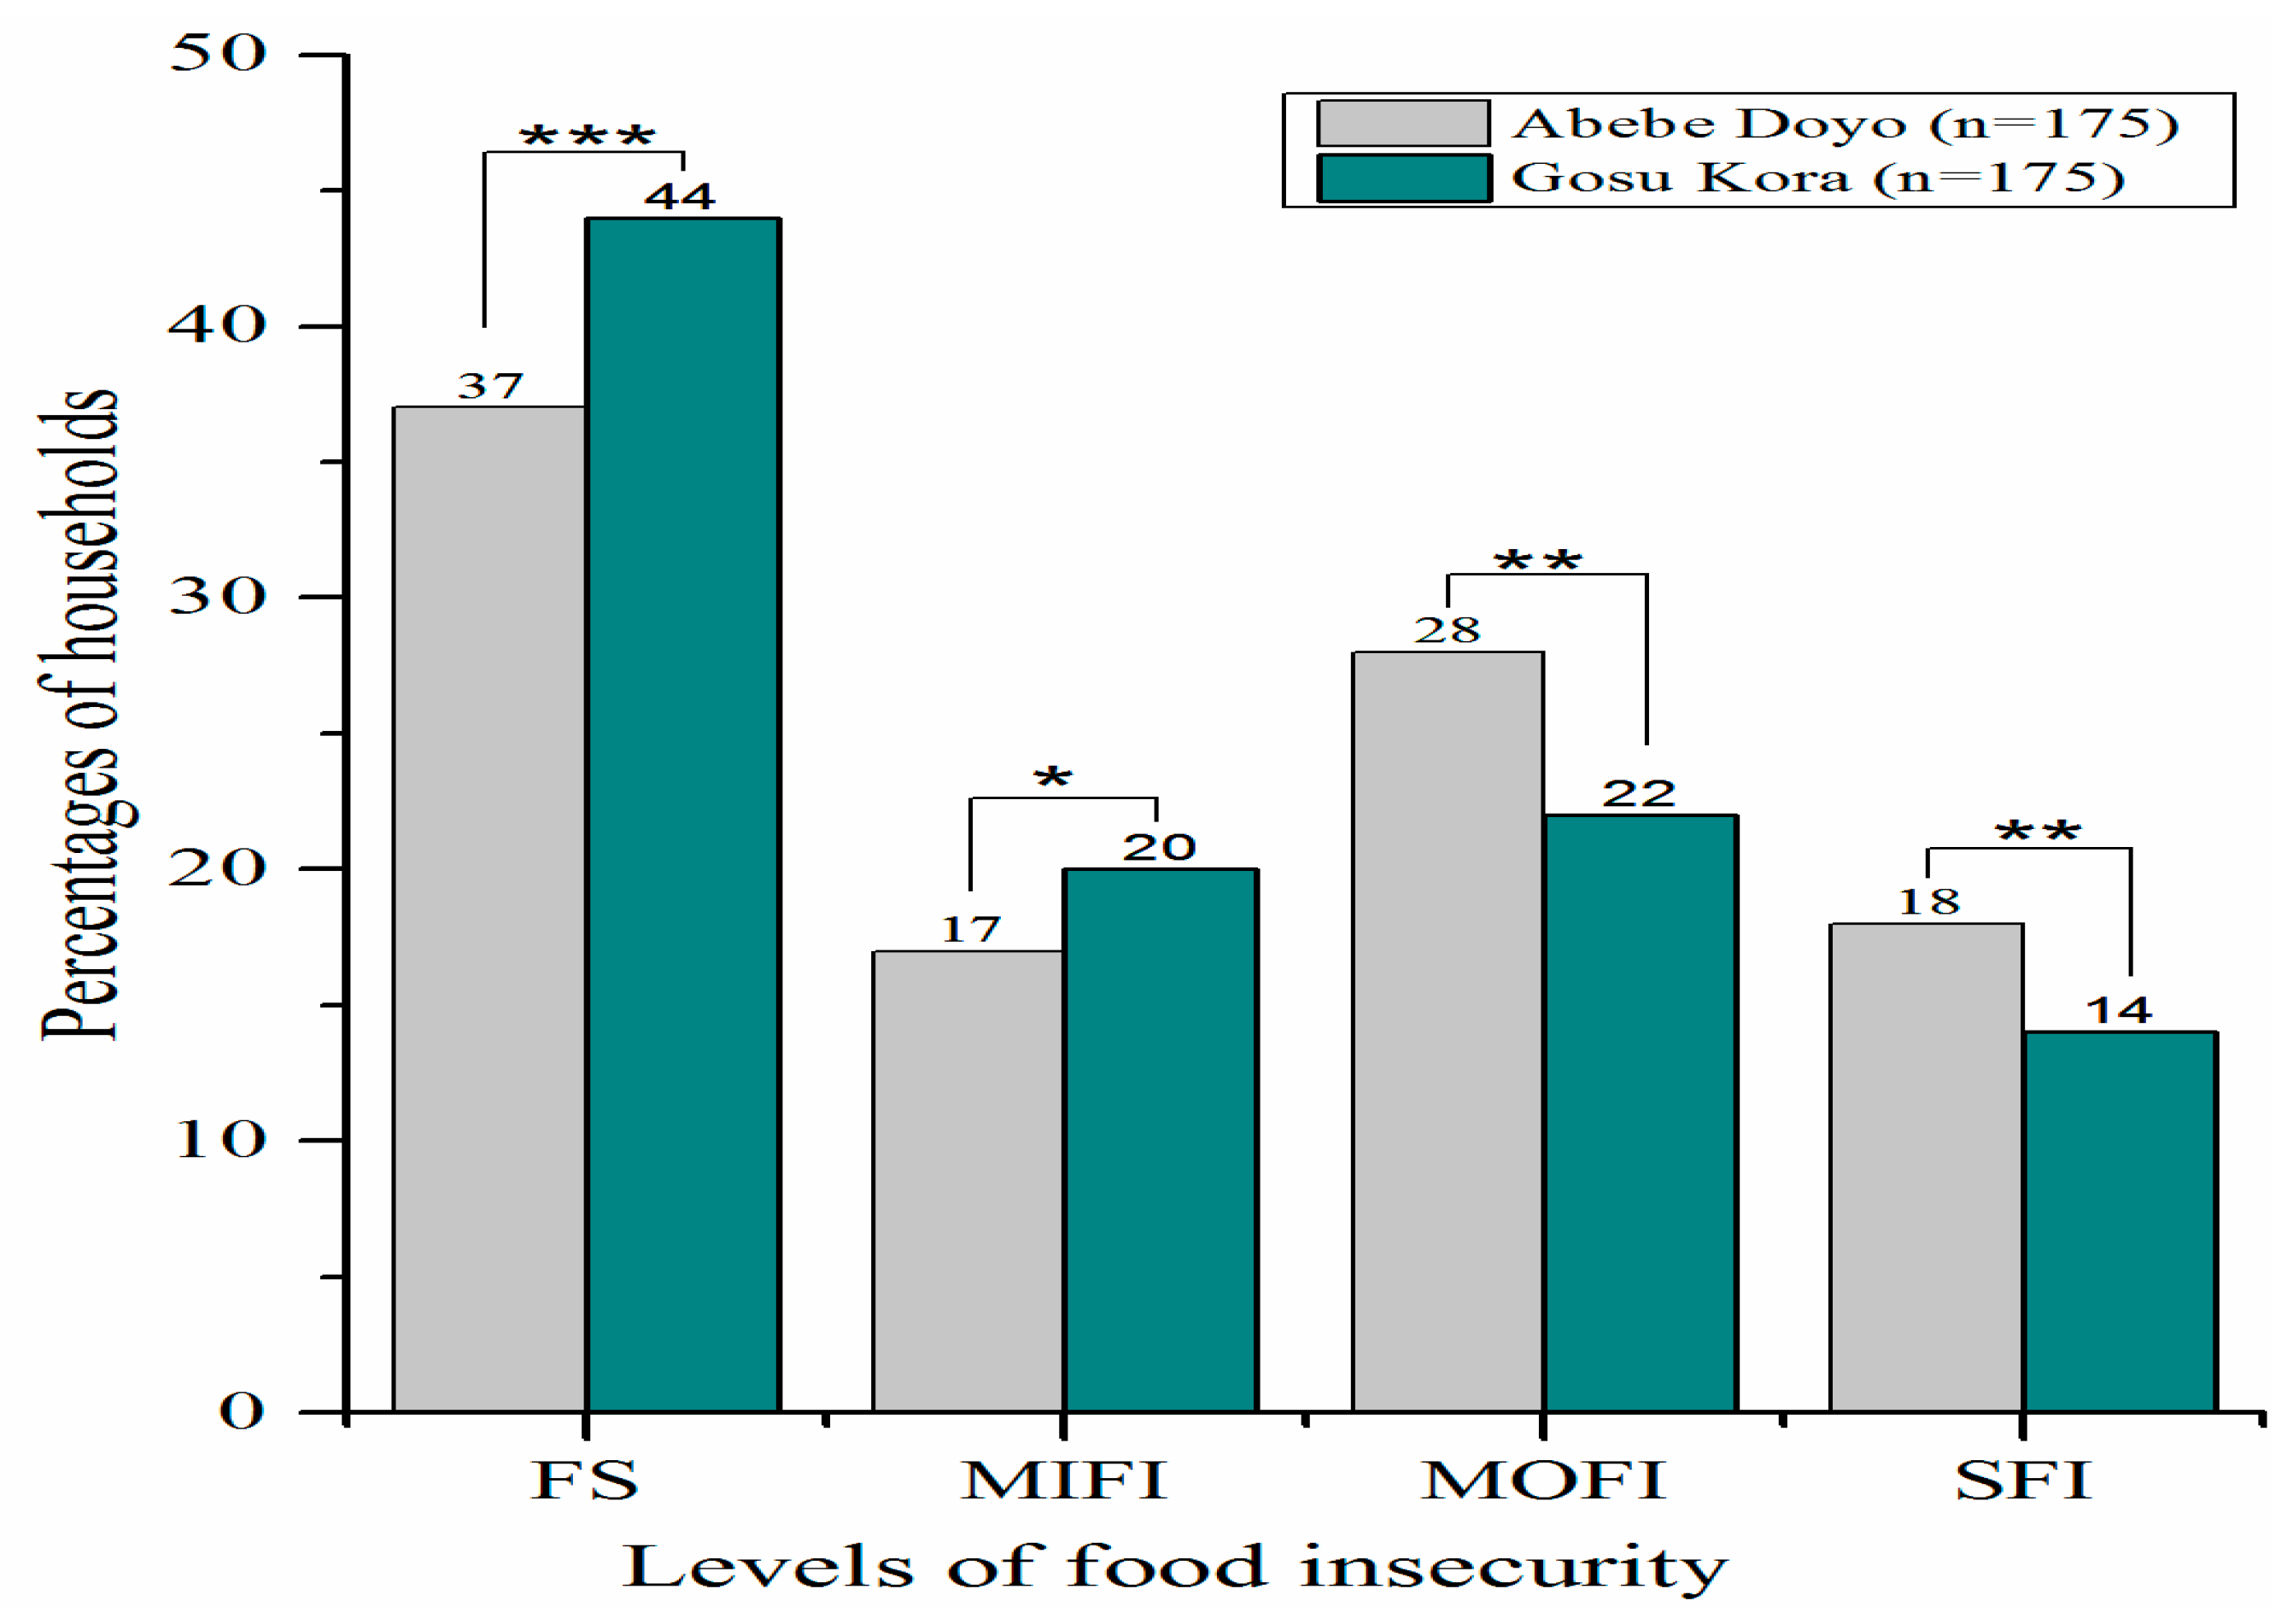
Figure 3 and Figure 4 illustrate the food security status of households according to the two measures employed (nutrition-based and experience-based), respectively. Thus, the majority of households were food insecure in both kebeles in the case of the nutrition-based measure (Figure 3).
Households were classified into four levels of food insecurity which were food secure (FS), mildly food insecure (MIFI), moderately food insecure (MOFI) and severely food insecure (SFI) using the experience-based measure (Figure 4). Thus, 37% of Abebe Doyo and 44% of Gosu Kora households were food secure (did not experience any of the food insecurity conditions or rarely worried about having enough food). On the other hand, 18% of Abebe Doyo and 14% of Gosu Kora households were severely food insecure (often reduced the volume and number of meals), while the rest of the respondents were mildly and moderately food insecure.
3.5. The Effect of Household Income Diversification on Food Security: The Result of Binary Logistic Regression Analysis
Binary logistic regression was performed to assess the effect of income diversification on food security in the two study areas using nutrition-based and experience-based measures (Table 3 and Table 4). The existence of severe multicollinearity problem between continuous and discrete explanatory variables was checked using the variance inflation factor (VIF) and the contingence coefficient (CC), respectively. The VIF (Xi) result for all variables shows that the data had no serious problem of multicollinearity (Table A1 of Appendix A).
Dependency ratio, farmland size, income, and income diversity index (SID) were statistically significant for both Kebeles, whereas, access to agricultural extension service was significant only for Abebe Doyo based on the model. However, education was significant only for households in the Gosu Kora (Table 3). Thus, a one-year increase in education was associated with a 1.3 percentage point increase in the probability of a household being food secure in the Gosu Kora kebele. However, the effect of education on food security was not significant for the Abebe Doyo households despite its positive impact. An increase in dependency ratio by 1% was associated with 14.6 and 26.3 percentage points decrease in the probability of households being food secure in the Abebe Doyo and the Gosu Kora, respectively.
The marginal effect also showed that having access to agricultural extension services increased the probability of households being food secure by 7.3 percentage points in the Abebe Doyo keble, while it was not significant for the Gosu Kora kebele households. An increase in farmland size by 1 ha correlated with 15.1 and 17.5 percentage point increases in the probability of the respondents being food secure in the Abebe Doyo and the Gosu Kora, respectively. Moreover, a 1 Birr increase in the Abebe Doyo household total income was associated with a 0.9 percentage point increase in the probability of households being food secure, while the corresponding 1.5 percentage point increase was recorded for the Gosu Kora households.
The results also showed that an increase in income diversity increased the probability of households being food secure in both kebeles. According to the nutrition-based measure, a 1% increase in the value of the SID was associated with 15.9 and 24.8 percentage points increase in the probability of households being food secure in the Abebe Doyo and the Gosu Kora kebeles, respectively.
We also used a qualitative method to measure food insecurity (experience-based) in addition to the nutrition-based method (Table 4).
Similar to the nutrition-based method, the experience-based method also showed that income diversification enhanced the food security condition of households. Hence, a 1% increase in the value of the SID was associated with 32 percentage point increase in the probability of households being food secure in the Abebe Doyo kebele and 50.6 percentage point increase in the Gosu Kora area. Farmland size and total income contributed positively to food security in both kebeles, while extension service made a positive contribution in the Abebe Doyo kebele only with a dependency ratio contributing negatively in the Gosu Kora kebele (Table 4).
3.6. The Effect of Income Diversity on Food Security Index: The Result of the 2SLS Regression Analysis
The previous results have suggested that household income diversification had a positive effect on food security in both rural and semi-urban areas. To increase the robustness and generalization of the result, we used the OLS regression method based on the total sample to estimate the effect of income diversity on the FSI by employing the IV method to avoid endogeneity biases of the model. Hence, the 2SLS regression analysis results are displayed in Table 5, whereas, the results of the OLS and the first-stage regressions are depicted in Table A2 of Appendix B. The value of the Durbin–Wu–Hausman chi2 test shows that the instruments (access to credit service, proximity to market, and having training or special skill in craftsmanship) were robust, and thus considering income diversity as an endogenous variable and applying the IV method was acceptable (Table 5).
Similar to the nutrition-based and the experience-based methods, the 2SLS regression revealed that income diversity contributed positively to food security. Thus, a 1% increase in the income diversity index increased the household food security index by 17%. Moreover, extension service, farmland size, and total income contributed positively to food security, while family size and dependency ratio contributed negatively to the model (Table 5).
4. Discussion
The descriptive statistics, t-test, binary logistic regression, and second-stage least square (2SLS) regressions presented resembling results from the study. The mean SID from the t-test indicates that the households of Gosu Kora (the semi-urban area) had a diversified income significantly higher than that of the Abebe Doyo households (the rural area). By implication, rural households have a predisposition to specialization than diversification, while the semi-urban households diversify their income moderately. This may be attributed to the significant contribution of agriculture alone (83%) to household income (Figure 2), whereas, the non-farm, off-farm, and other income contributed only 17% to the total household income. However, the dominance of agriculture in its share of household income is not surprising as it accounts for more than 80% of all exports and employment in Ethiopia [32,33]. Similarly, previous studies reported significant variations in the level of household income diversity across different study areas. These differences were ascribed to demographic factors, household income level, crop productivity of the study areas, and access to market [8,9,29].
Moreover, the average daily adult equivalent (AE) calorie consumption of households in Abebe Doyo was comparatively lower than households in Gosu Kora. However, the majority of households sampled were food insecure in both study areas (Figure 3 and Figure 4). Additionally, the average daily AE calorie consumption of both the Abebe Doyo and the Gosu Kora households were below the amount proposed by the FAO [26] (2280 kcal), which the study used as a food security threshold. Thus, the average shortfalls were 694 kcal (2280 kcal minus 1586 kcal) for the Abebe Doyo households and 500 kcal (2280 kcal minus 1780 kcal) for the Gosu Kora households, respectively. These shortfalls are higher than the 201-kcal deprivation intensity reported at the country level by the EIU [6]. These variations may have arisen from the differences in socioeconomic and demographic characteristics of households, institutional facilities, agro-climatic conditions, and weather variability across regions in Ethiopia [32,33]. Non-farm, off-farm and other sources (interests from deposit, remittances, and transfer payments) contributed significantly to the Gosu Kora household income as compared with the Abebe Doyo household income. On the other hand, the Abebe Doyo households generated significantly more income from agricultural activities as compared with the Gosu Kora households. This is consistent with results from a previous study by Demissie and Legesse [28] where smallholders generally generated a large income from agriculture and a low income from non-farm and off-farm activities in rural Ethiopia.
The binary logistic regression (nutrition-based) showed that education positively contributed to food security in the study areas. However, it was not statistically significant in the case of the Abebe Doyo kebele. Education empowers households to seize different business opportunities available in their areas and even take the initiative to start their own businesses. As a result of the relaxed household income constraint, ultimately the expenditure on food materials increases. In the current study, the increase in income was also associated with the improvement of household food security. Sanusi et al. [34] reported that an increase in income could significantly move households out of their state of food insecurity. Again, previous studies showed that education has a significant positive effect on food security [11,34,35]. This was however, inconsistent with reports by Fekadu and Mequanent [32].
An increase in dependency ratio deteriorated the food security condition of households in both study areas. It might be expected that as the number of dependent individuals (below 15 and above 65 years old) increases in the family, few individuals take responsibility for feeding the whole family. In a study conducted in the Afar National Regional State of Ethiopia, Siraje and Bekele [36] also reported that a high dependency ratio influenced the state of household food security. The report of the Ethiopia Rural Socioeconomic Survey (ERSS) by the Central Statistical Authority (CSA) and the World Bank [37] established that the Oromia Regional state of Ethiopia had the highest average household size of 5.5 persons, out of which only 46.9 were of working age (15–64 years). Accordingly, there were significant regional differences in terms of family size and dependency ratio in the country as evidenced in this study.
Farmland size owned by the farmers was positively associated with food security. Owning large farmland is an indicator of wealth in rural Ethiopia, since farmers use farmland as collateral to access credit as well as rent out farmland to generate income to use for farming. The CSA and World Bank [37] reported that the average household annual income from land rental is 1,176 Birr in Ethiopia.
The effect of income diversification on food security (measured by both nutrition-based and experience-based approaches) in both cases indicated that income diversity contributed positively to food security. However, some variables that were significant in the case of the nutrition-based method were not significant in the case of the experience-based method for the same households, and vice versa. For instance, the dependency ratio was significant for both kebeles in the nutrition-based method, whereas, it was not significant for the Abebe Doyo households in the experience-based measurement. These variances are acceptable since these measures capture different aspects of food security (quantitative vs. qualitative) even though both of them measure one of the pillars of food security (i.e., access to food). The experience-based method depends on households’ perception, which may have introduced some degree of subjectivity to the results [17]. An increase in the value of the SID increased the food security conditions of the households in both study areas based on the 2SLS analysis. This result is in consonance with previous studies by Robaa and Tolossa [38] and Onunka et al. [39]. The overall finding of the study affirms that income diversification enhances the food security condition of households in the study areas. Similarly, Echebiri et al. [40] recommended livelihoods diversification as an antidote to chronic food insecurity that affects the life of farming households in rural Nigeria.
5. Conclusions
This study primarily examined the effect of income diversification on food security among rural (Abebe Doyo kebele) and semi-urban households (Gosu Kora kebele). In the study areas, the income generated from non-farm and off-farm activities was small as agriculture dominated the livelihood of both rural and semi-urban households. The level of income diversification in the study area was generally low. However, semi-urban households (Gosu Kora) moderately diversified their income (mean SID = 0.426) as compared with rural households (Abebe Doyo) (mean SID = 0.206). In the Gosu Kora kebele, we found that households intentionally diversified their income sources more likely for wealth accumulation. In contrast, the poor rural households diversified their income in more conservative ways, mainly for survival.
The majority of households in the study areas were food insecure. Specifically, the prevalence of food insecurity was high in areas where there was a low level of income diversification. The binary logistic regression and the 2SLS regressions suggested that income diversification contributes positively to food security. Thus, income diversification can be a remedy for chronic food insecurity for both rural and semi-urban households in the study areas. Moreover, income diversifications for non-farm economic activities play a key role in creating employment opportunities and rural industrialization programs. However, income diversification happened on a small scale only, and thus failed to bring basic changes in the life of the households in the study areas. Therefore, we recommend that government and other stakeholders formulate policy that scales up (intensifies) income diversification to facilitate the movement of poor households out of high risk and low-return activities to productive economic activities to mitigate the prevalence of food insecurity in the study area.
This study only focused on one pillar of food security (i.e., access) to measure the status of household food security. This study also did not substantiate the economic significance of income diversification and excluded food wasted and food eaten outside in the calculation of household average daily calorie intake, which are the major limitations of this study. We observed, in the study areas, that the level of income diversification fluctuates with the agricultural production seasons, in other words, the degree of income diversification was high during the slack time of agricultural production periods and very low during the peak time. Therefore, we suggest future research examine the effect of income diversity on food security by taking the dynamics and shortcomings of this study into account.
Author Contributions
Conceptualization, B.G.E.; methodology, K.A.A. and D.A.S.; validation, B.G.E. and D.Z.; formal analysis, B.G.E.; investigation, D.A.S.; resources, D.Z.; data collection, B.G.E.; writing original draft and final, B.G.E. and K.A.A.; visualization, D.A.S.; supervision, D.Z.; funding acquisition, D.Z.
Funding
This research received no external funding.
Acknowledgments
This research was supported by the Fundamental Research Funds for the Central Universities (Program No. 2662017PY071). Therefore, we are grateful to our funding organization for the financial support we received. We also thank Kojo Ahiapka (email: [email protected]), college of Horticulture and Forestry Sciences, Department of Vegetable Science, Huazhong Agricultural University for editorial work that greatly improved the manuscript.
Conflicts of Interest
The authors declare no conflict of interest.
Appendix A

Table A1.
The variable inflation factor (VIF) and contingence coefficient (CC) test results for the continuous and discrete variables
Table A1.
The variable inflation factor (VIF) and contingence coefficient (CC) test results for the continuous and discrete variables
| Variables | Abebe Doyo (n = 175) | Gosu Kora (n = 175) | Pooled (n = 350) | |||
|---|---|---|---|---|---|---|
| VIF | 1/VIF | VIF | 1/VIF | VIF | 1/VIF | |
| Age | 1.12 | 0.89055 | 1.09 | 0.91749 | 1.07 | 0.93113 |
| Education | 1.77 | 0.58385 | 1.32 | 0.75925 | 1.59 | 0.62819 |
| Family size | 1.38 | 0.73466 | 1.19 | 0.84054 | 1.23 | 0.81080 |
| Dependency ratio | 1.03 | 0.97198 | 1.04 | 0.96362 | 1.06 | 0.94338 |
| Farmland size | 1.13 | 0.88056 | 1.13 | 0.88854 | 1.06 | 0.94211 |
| Total income | 1.09 | 0.91017 | 1.35 | 0.73970 | 1.01 | 0.99025 |
| Mean VIF | 1.37 | 1.28 | 1.27 | |||
| Variables | Value of CC | Value of CC | Value of CC | |||
| Sex | 0.008 | 0.019 | 0.060 | |||
| Extension services | 0. 070 | 0.030 | 0.112 | |||
Appendix B
Table A2.
The ordinary least squares (OLS) and first-stage regressions results.
| Variables | Food Security Index (OLS Regressions Result) | Income Diversity Index (First-Stage Regressions Result) | ||||
|---|---|---|---|---|---|---|
| Coef. | Std. Err. | t-Values | Coef. | Std. Err. | t-Values | |
| Constant | 0.513 | 0.103 | 4.97 | 0.150 | 0.076 | 1.95 |
| Male | 0.033 | 0.043 | 0.77 | 0.012 | 0.032 | 0.37 |
| Age | −0.001 | 0.002 | −0.08 | −0.002 * | 0.001 | −1.66 |
| Education | 0.017 *** | 0.005 | 3.61 | 0.031 *** | 0.003 | 9.81 |
| Family size | −0.015 ** | 0.007 | −2.12 | 0.032 *** | 0.005 | 6.58 |
| Dependency ratio | −0.267 | 0.072 | −3.72 | 0.015 | 0.053 | 0.29 |
| Farmland size | 0.007 * | 0.006 | 1.78 | 0.015 ** | 0.005 | 2.27 |
| Total income | 0.018 *** | 0.004 | 4.61 | 0.007 ** | 0.003 | 2.64 |
| Credit service | 0.099 | 0.029 | 1.36 | 0.062 ** | 0.021 | 2.87 |
| Extension service | 0.104 ** | 0.031 | 3.36 | −0.040 * | 0.022 | −1.80 |
| Distance to market | −0.017 | 0.027 | −0.62 | −0.114 *** | 0.019 | −5.84 |
| Training or special skill | 0.010 | 0.016 | 0.76 | 0.004 * | 0.021 | 1.81 |
| Income diversity index | 0.307 *** | 0.073 | 4.19 | |||
| R2 | 0.48 | 0.58 | ||||
| Adjusted R2 | 0.46 | 0.57 | ||||
Notes: Number of observations: N = 350, *** statistically significant at 99%, ** statistically significant at 95% and * statistically significant at 90%.
References
- Food and Agriculture Organization (FAO); IFAD; UNICEF; WFP; WHO. The State of Food Security and Nutrition in the World: Building Climate Resilience for Food Security and Nutrition. Rome, Italy. 2018. Available online: http://www.fao.org/3/I9553EN/i9553en.pdf (accessed on 10 June 2018).
- Food and Agriculture Organization (FAO). Rome Declaration on World Food Security. In Proceedings of the World Food Summit, Rome, Italy, 13–17 November 1996; Available online: http://www.fao.org/3/w3613e/w3613e00.htm (accessed on 15 January 2019).
- Berry, E.M.; Dernini, S.; Burlingame, B.; Meybeck, A.; Conforti, P. Food security and sustainability: Can one exist without the other? Public Health Nutr. 2015, 18, 2293–2302. [Google Scholar] [CrossRef] [PubMed]
- Ethiopian Central Statistical Authority (CSA). Ethiopia Demographic and Health Survey 2016. Addis Ababa, Ethiopia. 2016. Available online: https://dhsprogram.com/pubs/pdf/FR328/FR328.pdf (accessed on 3 January 2018).
- Endalew, B.; Muche, M.; Tadesse, S. Assessment of food security in Ethiopia: A review. Asian J. Agric. Sci. 2015, 9, 55–68. [Google Scholar] [CrossRef]
- Economist Intelligence Unit (EIU). Global Food Security Index. New York, USA. 2018. Available online: https://foodsecurityindex.eiu.com/Country/Details#Ethiopia (accessed on 3 July 2018).
- Tefera, N.; Demeke, M.; Kayitakire, F. Building Sustainable Resilience for Food Security and Livelihood Dynamics: The Case of Farming Rural Households in Ethiopia; EUR29111 EN; European Commission, Publications Office of the European Union: Ispra, Italy, 2017. [Google Scholar] [CrossRef]
- Mentamo, M.; Geda, N.R. Livelihood Diversification under Severe Food Insecurity Scenario among Smallholder Farmers in Kadida Gamela District, Southern Ethiopia. Kontakt 2016, 18, e258–e264. Available online: http://www.elsevier.com/locate/kontakt (accessed on 5 September 2017). [CrossRef]
- Adem, M.; Tadele, E.; Mossie, H.; Ayenalem, M. Income diversification and food security situation in Ethiopia: A review study. Food Sci. Technol. 2018, 4, 1–17. [Google Scholar] [CrossRef]
- Yenesew, S. Causes and coping mechanisms of food insecurity in rural Ethiopia. Agric. Biol. J. N. Am. 2015, 6, 123–133. [Google Scholar] [CrossRef]
- Dev, T.; Sultana, N.; Hossain, M.E. Analysis of the impact of income diversification strategies on food security status of rural households in Bangladesh: A case study of Rajshahi district. Am. J. Theor. Appl. Bus. 2016, 2, 46–56. [Google Scholar] [CrossRef]
- Babatunde, O.; Qaim, M. Impact of off-farm income on food security and nutrition in Nigeria. Food Policy 2010, 35, 303–311. [Google Scholar] [CrossRef]
- Devereux, S. Food Insecurity in Ethiopia: A Discussion Paper for DFID. Addis Ababa, Ethiopia. 2000. Available online: https://www.researchgate.net/publication/50200941 (accessed on 1 May 2018).
- Michlera, J.D.; Josephson, A.L. To specialize or diversify: Agricultural diversity and poverty dynamics in Ethiopia. World Dev. 2017, 89, 214–226. [Google Scholar] [CrossRef]
- Abduselam, A.M. Food security situation in Ethiopia: A review study. Int. J. Health Econ. Policy 2017, 2, 86–96. [Google Scholar] [CrossRef]
- Ethiopian Central Statistical Agency (CSA). Agricultural Sample Survey Volume IV, Report on Area and Production of Major Crops. Addis Ababa, Ethiopia. 2010. Available online: file:///C:/Users/Administrator/Desktop/Area_and_Crop_Prod_Report_Fina-2002EC%20(2).pdf (accessed on 1 April 2019).
- Broussard, N.H.; Tandon, S. Food insecurity measures: Experience-Based Versus Nutrition-Based Evidence from India, Bangladesh, and Ethiopia. U.S. Department of Agriculture, Economic Research Service. 2016. Available online: https://ageconsearch.umn.edu/record/262189/files/err-220.pdf?subformat=pdfa (accessed on 15 July 2018).
- Kumar, S.Y. Fundamental Research Methodology and Statistics; New Age International Private Limited: New Delhi, India, 2006. [Google Scholar]
- Coates, J.; Maxwell, D. Reaching for the Stars? Universal Measures of Household Food Security; UN, FAO International Scientific Symposium on Food Security and Nutrition Measurement: Rome, Italy, 2012. [Google Scholar]
- Jennifer, C.; Swindale, A.; Bilinsky, P. Household Food Insecurity Access Scale (HFIAS) for Measurement of Household Food Access: Indicator Guide, version 3; Academy for Educational Development: Washington, DC, USA, 2007; Available online: http://www.fao.org/fileadmin/user_upload/eufao-fsi4dm/doc-training/hfias.pdf (accessed on 15 July 2018).
- Carletto, C.; Zezza, A.; Banerjee, R. Towards better measurement of household food security: Harmonizing indicators and the role of household surveys. Glob. Food Secur. 2013, 2, 30–40. [Google Scholar] [CrossRef]
- Sahu, A.K.; Chüzho, Z.; Das, S. Measuring household food security index for high hill tribal community of Nagaland, India. Food Secur. 2017, 5, 155–161. [Google Scholar] [CrossRef]
- Ethiopian Health and Nutrition Research Institute (EHNRI). Food Composition Table for Use in Ethiopia, Part III; Ethiopian Health and Nutrition Research Center: Addis Ababa, Ethiopia, 1998. [Google Scholar]
- Stefan, S.S.; Zeller, M. Income diversification of rural households in Central Sulawesi, Indonesia. Q. J. Int. Agric. 2005, 44, 61–73. [Google Scholar]
- Agyeman, B.A.; Brempong, S.A.; Onumah, E.E. Determinants of income diversification of farm households in the Western Region of Ghana. Q. J. Int. Agric. 2014, 53, 55–72. [Google Scholar]
- Food and Agriculture Organization (FAO). The State of Food Insecurity in the World. Rome, Italy. 2005. Available online: http://www.fao.org/3/a-a0200e.pdf (accessed on 3 June 2018).
- Gujarati, D.N. Basic Econometrics, 4th ed.; Mc-Graw Hill Companies: New York, NY, USA, 2004. [Google Scholar]
- Demissie, A.; Legesse, B. Determinants of income diversification among rural households: The case of smallholder farmers in Fedis district, Eastern Hararghe zone, Ethiopia. J. Dev. Agric. Econ. 2013, 5, 120–128. [Google Scholar] [CrossRef]
- Dessalegn, A.; Moges, S. Determinants of rural livelihood diversification: The case of rural households in Lemmo district, Hadiyya Zone of Southern Ethiopia. J. Econ. Sustain. Dev. 2016, 7, 32–39. [Google Scholar]
- Zerai, B.; Gebreegziabher, Z. Effect of nonfarm income on household food security in Eastern Tigrai, Ethiopia: An entitlement approach. Food Sci. Qual. Manag. 2011, 1, 1–22. [Google Scholar]
- Amogne, A.; Belay, S.; Ali, H.; Amare, B. Determinants of non-farm livelihood diversification: Evidence from rain-fed-dependent smallholder farmers in north central Ethiopia (Woleka sub-basin). Dev. Stud. Res. 2017, 4, 22–36. [Google Scholar] [CrossRef]
- Fekadu, B.; Mequanent, M. Determinants of food security among rural households of Central Ethiopia: An empirical analysis. Q. J. Int. Agric. 2010, 49, 299–318. [Google Scholar]
- Nkunzimana, T.; Custodio, E.; Thomas, A.C.; Tefera, N.; Perez, H.A.; Kayitakire, F. Global Analysis of Food and Nutrition Security Situation in Food Crisis Hotspots; EUR 27879; Publications Office of the European Union: Rome, Italy, 2016. [Google Scholar] [CrossRef]
- Sanusi, R.A.; Badejo, C.A.; Yusuf, B.O. Measuring household food insecurity in selected local government areas of Lagos State and Ibadan, Nigeria. Pak. J. Nutr. 2006, 5, 62–67. [Google Scholar] [CrossRef]
- Mutisya, M.; Ngware, M.W.; Kabiru, C.W.; Kandala, N. The effect of education on household food security in two informal urban settlements in Kenya: A longitudinal analysis. Food Secur. 2016, 8, 743–756. [Google Scholar] [CrossRef]
- Siraje, I.; Bekele, A. Assessment of Food insecurity and coping mechanisms among pastoral households of Afar national regional state: The case of chifra district, Ethiopia. Ethiop. J. Agric. Sci. 2013, 23, 145–156. [Google Scholar]
- CSA; World Bank. Ethiopia Rural Socioeconomic Survey (ERSS) Report. Addis Ababa, Ethiopia. 2013. Available online: http://siteresources.worldbank.org/INTLSMS/Resources/3358986-1233781970982/5800988-1367841456879/9170025-1367841502220/ERSS_Survey_Report.pdf (accessed on 21 June 2018).
- Robaa, B.; Tolossa, D. Rural livelihood diversification and its effects on household food security: A case study at Damota Gale Woreda, Wolayta, Southern Ethiopia. East. Afr. Soc. Sci. Res. Rev. 2016, 32, 93–118. [Google Scholar] [CrossRef]
- Onunka, C.N.; Olumba, C.C. An analysis of the effect of livelihood diversification on the food security status of the rural farming households in Udi L. G.A of Enugu state. Int. J. Agric. Sci. Res. 2017, 7, 389–398. [Google Scholar]
- Echebiri, R.N.; Onwusiribe, C.N.; Nwaogu, D.C. Effect of Livelihood Diversification on Food Security Status of Rural Farm Households in Abia State Nigeria. Econ. Eng. Agric. Rural Dev. 2017, 17, 159–166. [Google Scholar]
Figure 1.
Map of the study areas.

Figure 2.
Share of household income from different sources. Notes: *** statistically significant at 99% and ** statistically significant at 95%.
Figure 2.
Share of household income from different sources. Notes: *** statistically significant at 99% and ** statistically significant at 95%.

Figure 3.
Food security status of households (nutrition-based measure). Notes: n = 175 for both Abebe Doyo and Gosu Kora kebeles.
Figure 3.
Food security status of households (nutrition-based measure). Notes: n = 175 for both Abebe Doyo and Gosu Kora kebeles.

Figure 4.
Food security status of households (experience-based measure). Notes: *** statistically significant at 99%, ** statistically significant at 95% and * statistically significant at 90%.
Figure 4.
Food security status of households (experience-based measure). Notes: *** statistically significant at 99%, ** statistically significant at 95% and * statistically significant at 90%.

Table 1.
Descriptive analyses of key sociodemographic and economic variables of the households studied.
Table 1.
Descriptive analyses of key sociodemographic and economic variables of the households studied.
| Variables | Description | Abebe Doyo (n = 175) | Gosu Kora (n = 175) | Total households (n = 350) |
|---|---|---|---|---|
| Mean | Mean | Mean | ||
| Male | Gender of household head (male = 1) | 0.91 (0.28) | 0.85 (0.86) | 88.30 (0.32) |
| Age | Age of household head (years) | 48.70 (11.94) | 46.6 (10.09) | 47.65 (11.08) |
| Education | Years of schooling of household head (years) | 4.46 (3.47) | 7.03 (3.43) | 5.75 (3.68) |
| Family size | Number of household members in adult equivalent (AE) | 6.06 (2.27) | 6.0 (2.10) | 6.03 (2.19) |
| Dependency ratio | The ratio of dependent household members to total family | 0.34 (0.19) | 0.33 (0.18) | 0.33 (0.19) |
| Credit services | The availability of credit services (yes = 1) | 0.41 (0.50) | 0.45 (0.47) | 0.43 (0.48) |
| Extension services | The availability of agricultural extension services (yes = 1) | 0.78 (0.41) | 0.62 (0.48) | 0.70 (0.46) |
| Distance to market | Time to the closest market (hours) | 2.04 (0.34) | 1.03 (0.24) | 1.53 (0.58) |
| Training or special skill | Having training or special skills on craftsmanship (yes = 1) | 0.41 (0.49) | 0.47 (0.50) | 0.44 (0.49) |
| Farmland size | Total farmland size owned by the household (ha) | 3.00 (1.61) | 2.70 (1.55) | 2.85 (1.13) |
| Total income | Total household annual current income (Birr “000”) | 6.73 (3.27) | 8.06 (3.70) | 7.40 (3.55) |
| SID | Income diversity indexes of households | 0.21 (0.24) | 0.43 (0.25) | 0.32 (0.27) |
| Calorie intake | Average daily AE calorie intake of households (kcal) | 1586 (657) | 1780 (738) | 1683 (704) |
| FSI | Household food security index | 0.70 (0.28) | 0.74 (0.32) | 0.78 (0.31) |
Note: Figures in the parentheses are values of standard deviation and exchange rate: 1 USD = 28.11 Birr as of 30 November 2018.
Table 2.
Mean comparison of the Simpson’s index of diversity (SID) and daily calorie intake between the two kebeles.
Table 2.
Mean comparison of the Simpson’s index of diversity (SID) and daily calorie intake between the two kebeles.
| Kebele | Simpson Diversity Index (SID) | Daily Calorie Intake (kcal) | ||||||
|---|---|---|---|---|---|---|---|---|
| Mean | SD | t-Value | p-Value | Mean | SD | t-Value | p-Value | |
| Abebe Doyo | 0.206 | 0.243 | −8.167 *** | 0.000 | 1586 | 657 | −2.597 ** | 0.010 |
| Gosu Kora | 0.426 | 0.258 | 1780 | 738 | ||||
Notes: *** statistically significant at 99% and ** statistically significant at 95%.
Table 3.
Effect of household income diversification on food security (nutrition-based).
| Variables | Abebe Doyo Kebele (n = 175) | Gosu Kora Kebele (n = 175) | ||||
|---|---|---|---|---|---|---|
| Std. Error | Marginal Effects | Std. Error | Marginal Effects | |||
| Male | 1.200 | 1.420 | 0.039 | 0.116 | 0.660 | 0.008 |
| Age | −0.023 | 0.024 | −0.001 | −0.043 | 0.026 | −0.003 |
| Education | 0.062 | 0.114 | 0.003 | 0.183 ** | 0.093 | 0.013 |
| Family size | −0.056 | 0.132 | −0.003 | −0.064 | 0.134 | −0.004 |
| Dependency ratio | −2.961 ** | 1.414 | −0.146 | −3.654 ** | 1.459 | −0.263 |
| Extension services | 2.242 *** | 1.134 | 0.073 | 0.913 | 0.532 | 0.061 |
| Farmland size | 0.051 ** | 0.090 | 0.151 | 0.520 ** | 1.082 | 0.175 |
| Total income | 0.175 *** | 0.086 | 0.009 | 0.215 *** | 0.075 | 0.015 |
| SID | 3.231 * | 1.777 | 0.159 | 3.481 ** | 1.721 | 0.248 |
| Constant | −1.478 | 3.004 | −2.413 | 2.096 | ||
| Nagelkerke R square | 0.48 | 0.46 | ||||
| Omnibus test | Chi-square = 42.90, df = 10, p < 0.001 | Chi-square = 49.43, df = 10, p < 0.001 | ||||
Notes: *** statistically significant at 99%, ** statistically significant at 95% and * statistically significant at 90%.
Table 4.
Effect of household income diversification on food security (experience-based).
| Variables | Abebe Doyo Kebele (n = 175) | Gosu Kora Kebele (n = 175) | ||||
|---|---|---|---|---|---|---|
| Std. Error | Marginal Effects | Std. Error | Marginal Effects | |||
| Male | 0.996 | 0.803 | 0.185 | 0.956 | 0.535 | 0.211 |
| Age | −0.004 | 0.017 | −0.001 | −0.001 | 0.018 | −0.001 |
| Education | 0.010 | 0.071 | 0.002 | 0.032 | 0.057 | 0.007 |
| Family size | 0.103 | 0.095 | 0.022 | 0.031 | 0.091 | 0.007 |
| Dependency ratio | 0.853 | 0.968 | 0.189 | −2.017 ** | 1.008 | −0.490 |
| Extension services | 0.972 ** | 0.509 | 0.191 | 0.241 | 0.37 | 0.057 |
| Farmland size | 1.230 *** | 0.521 | 0.232 | 1.523 ** | 0.643 | 0.287 |
| Total income | 0.114 ** | 0.064 | 0.025 | 0.141 *** | 0.055 | 0.034 |
| SID | 1.581 *** | 1.226 | 0.321 | 2.074 ** | 0.279 | 0.506 |
| Constant | −1.684 | 1.779 | −2.795 | 1.563 | ||
| Nagelkerke R square | 0.45 | 0.44 | ||||
| Omnibus test | Chi-square = 59.89, df = 10, p < 0.001 | Chi-square = 43.68, df = 10, p < 0.001 | ||||
Notes: *** statistically significant at 99 %, ** and statistically significant at 95 %.
Table 5.
The second-stage least square (2SLS) regression results explaining household food security.
Table 5.
The second-stage least square (2SLS) regression results explaining household food security.
| Variables | Food Security Index (FSI) | ||
|---|---|---|---|
| Coefficients | Std. Error | Z-Values | |
| Constant | 0.530 | 0.098 | 5.28 |
| Male | 0.030 | 0.045 | 0.67 |
| Age | 0.001 | 0.001 | 0.31 |
| Education | 0.004 | 0.009 | 0.39 |
| Family size | −0.027 ** | 0.010 | −2.68 |
| Dependency ratio | −0.267 *** | 0.075 | −3.57 |
| Extension service | 0.127 *** | 0.034 | 3.72 |
| Farmland size | 0.040 ** | 0.011 | 2.28 |
| Total income | 0.015 ** | 0.005 | 3.20 |
| SID | 0.170 ** | 0.036 | 2.26 |
| R2 | 0.49 | ||
| Durbin–Wu–Hausman chi2 | 0.24 ** | ||
Notes: Number of observations: N = 350, *** statistically significant at 99% and ** statistically significant at 95%.
© 2019 by the authors. Licensee MDPI, Basel, Switzerland. This article is an open access article distributed under the terms and conditions of the Creative Commons Attribution (CC BY) license (http://creativecommons.org/licenses/by/4.0/).
Share and Cite
MDPI and ACS Style
Etea, B.G.; Zhou, D.; Abebe, K.A.; Sedebo, D.A. Household Income Diversification and Food Security: Evidence from Rural and Semi-Urban Areas in Ethiopia. Sustainability 2019, 11, 3232. https://doi.org/10.3390/su11123232
AMA Style
Etea BG, Zhou D, Abebe KA, Sedebo DA. Household Income Diversification and Food Security: Evidence from Rural and Semi-Urban Areas in Ethiopia. Sustainability. 2019; 11(12):3232. https://doi.org/10.3390/su11123232
Chicago/Turabian StyleEtea, Bekele Gebisa, Deyi Zhou, Kidane Assefa Abebe, and Dessalegn Anshiso Sedebo. 2019. "Household Income Diversification and Food Security: Evidence from Rural and Semi-Urban Areas in Ethiopia" Sustainability 11, no. 12: 3232. https://doi.org/10.3390/su11123232
Note that from the first issue of 2016, this journal uses article numbers instead of page numbers. See further details here.