Assessing the Socioeconomic Impacts of Intelligent Connected Vehicles in China: A Cost–Benefit Analysis


1
State Key Laboratory of Automotive Safety and Energy, Tsinghua University, Beijing 100084, China
2
Tsinghua Automotive Strategy Research Institute, Tsinghua University, Beijing 100084, China
*
Author to whom correspondence should be addressed.
Sustainability 2019, 11(12), 3273; https://doi.org/10.3390/su11123273
Submission received: 22 May 2019
/
Revised: 6 June 2019
/
Accepted: 10 June 2019
/
Published: 13 June 2019
(This article belongs to the Special Issue Sustainable and Intelligent Transportation Systems)
Abstract
:The deployment of intelligent connected vehicles (ICVs) is regarded as a significant solution to improve road safety, transportation management, and energy efficiency. This study assessed the safety, traffic, environmental, and industrial economic benefits of ICV deployment in China under different scenarios. A bottom-up model was established to deal with these impacts within a unified framework, based on the existing theories and literature of ICVs’ cost–benefit analysis, as well as China’s most recent policies and statistics. The results indicate that the total benefits may reach 13.25 to 24.02 trillion renminbi (RMB) in 2050, while a cumulative benefit–cost ratio of 1.15 to 3.06 suggests high cost-effectiveness. However, if the government and industry only focus on their own interests, the break-even point may be delayed by several years. Hence, an effective business model is necessary to enhance public–private cooperation in ICV implementation. Meanwhile, the savings of travel time costs and fleet labor costs play an important part in all socioeconomic impacts. Therefore, the future design of ICVs should pay more attention to the utilization of in-vehicle time and the real substitution for human drivers.
1. Introduction
The increasing number of vehicles is posing severe social problems worldwide, including accidental fatalities and injuries, traffic congestion, energy consumption, and air pollution. Intelligent and connected vehicles (ICVs) have been introduced to achieve effective and sustainable mobility, with capabilities of environment sensing, information exchange, intelligent planning, and automated control [1,2]. Furthermore, ICVs will also create considerable economic benefits for both the automotive industry and other related businesses by saving operating costs and integration into a digital economy [1,3]. Thus, ICVs are regarded as a vital component of intelligent transportation systems (ITS) and a sustainable automotive industry.
China has been the largest automotive market around the world with a vehicle population of 240 million at the end of 2018, leading to many challenges in transportation management, energy security, and environmental protection. Hence, China’s government is formulating policies and expanding investment to promote the development and implementation of ICVs [4], and many enterprises are devoting themselves to relevant businesses [1]. China is regarded as one of the first regions to deploy ICVs on a large scale [5]. During this long-term evolution, a large number of resources will be needed to promote the wide deployment of ICVs and their corresponding infrastructures. Therefore, a comprehensive and in-depth study into the benefits and costs of ICVs is essential for policy makers and business managers to formulate future strategies. Additionally, a cost–benefit analysis in China will also provide a useful reference for other countries.
ICVs can be defined as a new generation of vehicle equipped with advanced sensors, controllers, and actuators as well as communication technologies to accomplish driving tasks efficiently and safely instead of human drivers [4]. It consists of three core technologies, namely automated driving systems (ADS), internet of vehicles (IoV), and in-vehicle artificial intelligence [1]. Due to its technical complexity and significant influences, it should be developed and implemented step by step.
The advanced driving assistance system (ADAS) is the first stage of the ICV’s deployment, therefore governments and enterprises in developed countries have investigated their social effects for decades. ADVISORS is one such research program supported by the European Commission to assess the impacts of several ICV technologies on road safety, driver comfort, and network efficiency. It conducted a multicriteria analysis from the perspectives of users, society, and manufacturers to rank the implementation priorities of different ADAS, and provided suggestions to overcome their deployment barriers [6]. Following this, more projects were completed including SEiSS and eIMPACT, which evaluated the socioeconomic impact of intelligent vehicle safety systems [7,8]. The assessment indicators included safety, mobility, efficiency, energy and environment, productivity, and customer satisfaction. Based on field tests, traffic simulations, and statistical methods, a cost–benefit analysis (CBA) found that all systems could improve road safety, while most of them could make both ends meet. These studies have mostly focused on economic feasibility and deployment roadmaps of separate ADAS.
Aside from the governmental concern, extensive researchers have also explored different impacts of ICV technologies. Several studies have considered ICVs as a part of ITS and conducted assessments of the whole system. Lu, Wevers, et al. [9] compared the effects of ADAS and inherently safe infrastructure based on a literature review and experts’ knowledge, with the application of gray relational analysis. The results indicated that although ADAS would be more effective in improving traffic safety, a combination of ADAS and safety infrastructure should be the most feasible solution. Psaraki, Pagoni, et al. [10] considered the impacts on road capacity and greenhouse gas (GHG) emissions of ADAS, automated highway system (AHS), and commercial vehicle operations (CVO). They found that AHS had the most significant benefits with double capacity and 20% less fuel consumption and GHG emissions, while CVO could be the most cost-effective technology to reduce GHG emissions. The other studies concentrated on the impacts of some specific ADAS [8,11,12,13,14,15,16,17,18]. For instance, adaptive cruise control (ACC) could change the longitudinal behavior directly and has attracted most researchers. Benmimoun, Putz, et al. [11] investigated the effects of ACC and forward collision warning (FCW) based on the field operational test data of about 1000 vehicles. The ADAS application decreased the number of critical time-headways by 73%, while ACC reduced the fuel consumption by 2.77% on motorways, which means that the overall fuel-saving potential for passenger cars could reach 693.9 million liters and GHG emissions could decrease by 1.7 million tons in 27 European countries. Kuang, Zhao, et al. [12] employed traffic simulations to explore the traffic impacts of ACC in China, and the results showed that the average travel time could decrease by about 30% on urban roads, and about a 10% reduction on highways and rural roads. However, these results only paid attention to partial social issues of several ADAS applications, and the ADAS were only parts of ICVs and might be replaced by future ADS.
With the emergence of new technologies and products, there is increasing literature on the benefits and costs of autonomous and connected vehicles [2,19,20,21,22,23,24,25,26,27,28,29]. Fagnant and Kockelman [19] summarized the potential impacts of autonomous vehicles in the forms of traffic safety, congestion mitigation, fuel saving, and travel demand. It was estimated that a comprehensive annual saving per autonomous vehicle could be as high as $3900 and the economic benefits would reach $442 billion in the U.S. with a 90% market penetration. Another study by Stephens, Gonder, et al. [20] estimated the upper and lower bounds of autonomous and connected vehicles’ effects on travel demand and fuel efficiency based on a literature review, and the result of potential changes in national light-duty vehicle fuel use in the U.S varied from a drop by 60% to an increase by 200%. Wadud, MacKenzie et al. [21] also used a coherent energy decomposition framework to identify the influence mechanisms of autonomous vehicles. Four scenarios composed of different assumptions about energy intensity and fleet mileage were considered, and the results indicated that total road transport energy could decline by 40% or grow by more than 100%. These studies provide a comprehensive insight into how ICVs affect different aspects of transportation, as well as quantitative analyses from a perspective of national implementation. Nonetheless, most results were limited to only a few aspects of the benefits of ICVs [20,21,22,23,24,26,27,28,29], and some considered only full autonomous vehicles [19,22,23]. They also ignored the ICVs’ enormous industry economic value, which might be the most important impetus for automotive manufacturers and technology companies to develop ICV products. An innovation in business model will be essential to commercialize ICV technologies in view of their high costs and long payback period.
To sum up the literature review above, first, the social and economic impacts of ICVs are varied and complicated, and the literature has often only focused on a limited range of functions or benefits. Moreover, the results of different aspects could not be discussed together due to their different assumptions and dimensions. Therefore, a comprehensive and coherent assessment framework is necessary to consider all key functions and major benefits in different contexts. Furthermore, many studies only worked out the potential benefits of ICVs, but did not pay much attention to their costs. A detailed cost–benefit analysis could help policy makers to better understand the rationality and affordability of ICV deployment, and then formulate implementation plans as well as establish a new partnership among different stakeholders. Finally, most studies conducted scenario analyses by assuming a certain penetration rate of ICVs, but did not indicate when that would happen. A time series forecast may offer clearer references for the automotive industry to take next steps.
This paper aims to propose a detailed and unified assessment framework to estimate the potential socioeconomic effects and costs of ICV deployment in China. The research tries to answer three questions:
- How can the socioeconomic impacts of ICVs be measured at the country level?
- Can the benefits of ICVs cover their deployment costs and how long will it take?
- What are the key factors that will influence the ICVs’ benefits and deployment?
The following study is structured in four parts. Section 2 introduces the framework and methods, as well as the literature and data sources. The quantitative results are presented and analyzed in Section 3. Some further discussions about sensitivity analysis are provided in Section 4. Section 5 concludes the whole study and makes several suggestions.
2. Materials and Methods
There are a variety of potential social and economic benefits from ICV deployment. Based on the literature review [2,7,8,19] and authors’ summary, four major aspects of benefits were studied in this paper, i.e., safety, traffic, environmental and industrial economic benefits. They reflect the major impacts of ICVs, and represent the primary concern of government, industry, and customers. Though many other impacts may also emerge, like changes in land use and parking locations [2,19], they are affected by many other factors rather than the technology itself. Therefore, we concentrated on the most important targets of sustainable mobility and industry to develop ICVs. Figure 1 explains the assessment framework, and the detailed methods and data resources are elaborated in the following part. Particularly, this paper mainly focused on the impacts of ICVs on the current transportation structure in China, and did not consider the effects of large-scale new mobility. Though ICVs enable new moving paradigms like car sharing and ride hailing [2,5], there exist great uncertainties about their regulatory policies, user acceptance, security issues, and business models. Thus, their wide implementation and influences remain to be explored in detail. However, we also tried to make a simple analysis on the impacts of car sharing, and proved that the bottom-up model proposed in this paper would allow to add in these factors in the future research.
2.1. Definition and Basic Assumptions
2.1.1. Basic Definitions and Scenarios
In order to evaluate the effects of ICVs, a specific description of technology is necessary to confirm assessment boundary. In this paper, ICV is classified as three levels according to different autonomous and connected levels, which refer to current standards and policies [4,30], as shown in Table 1. Level I ICV is a combination of L1 to L2 autonomous driving and primary connected functions, which can assist human drivers in simple driving tasks and exchange basic information. Level II ICV has a L3 ADS which can accomplish all operations in a particular situation with backup from human drivers, as well as stronger communication capabilities with surroundings and mobile internet. Level III ICV can both drive itself with a L4 to L5 ADS, and integrate into the internet of things to realize a life-cycle connection. Furthermore, the impacts of ICVs also depend on their operation environment. Thus, six vehicle types and eight road types are considered to describe different ICV usage scenarios according to existing literature [31,32], as well as Chinese vehicle and road engineering standards including CJJ 37-2016 and JTG B01-2014, as shown in Table 2 and Table 3. Moreover, A and B in Table 3 are the model parameters of the Bureau of Public Roads (BPR) function for different types of roads, which are introduced in Subsection 2.3.2.
Since the effects of ICV show great uncertainty and complexity as found in the literature review, scenario analysis approach will be employed to describe their potential ranges. This paper defines three basic scenarios. Business as usual (BAU) scenario is set as a baseline, where the transportation and automotive industry in China continue current development trend, without any impacts of ICV. Optimistic (OPT) scenario means that ICV can maximize their socioeconomic benefits in all aspects. And under the conservative (CON) scenario, ICV’s deployment may only bring small benefits or even increase the social burden. Furthermore, car sharing optimistic (CS OPT) and conservative (CS CON) scenario are set to estimate the impacts of car sharing, based on OPT and CON scenarios, respectively. It is assumed that half of the annual sales of Level III NPVs (noncommercial passenger vehicle) will be replaced by Level III CPVs (commercial passenger vehicle) from 2025, with a five-to-one replacement rate according to their use intensity [31].
2.1.2. Vehicle Stock and Fleet Penetration
A bottom-up method is used to establish the whole vehicle fleet in China. Vehicle stock and fleet penetration of ICVs are calculated by the following equations [31,34]:
where, is the stock of level i ICV in year y (unit); is the sales of vehicle type t in year (y-age) (unit); is the market share of level i ICV in the total sales in year (y-age) (%); is the survival rate of vehicle type t in the (age)th year (%); is the service life of vehicle type t (year); and is the fleet penetration of level i ICV in year y (%). When , it means conventional vehicles.
The automotive market in China has experienced a rapid development for more than 10 years, and will have a lower growth rate in the next decades. The past sales data until 2018 come from the statistics of China Association of Automobile Manufactures, and the future prediction refers to the research of Liu, Zhao, et al. [34]. Furthermore, the market share of ICV is calculated with a logistic function which is often used in innovation diffusion modelling. It is assumed that ICV started to enter the market in 2015, with a low market share at only 3% [35], and according to Technology Roadmap for Energy Saving and New Energy Vehicles in China [4], the market share of Level I and II ICVs will reach 50%, 80%, and 100% by 2020, 2025, and 2030, respectively. Besides, Level III ICV will start its commercialization in 2025 and its penetration in new vehicles will reach 10% by 2030. Based on these historical data and targets, the logistic function is calibrated and annual market share of ICVs can be then determined. Since the roadmap does not set respective targets for different vehicle types, we assume the same market share of ICVs for all vehicle types. Then the survival rate and service life of different vehicle types are extracted from existing literature [31].
The results are presented in Figure 2. The fleet penetration of Level I to III ICVs will respectively reach 57.01%, 11.05%, and 2.70% by 2030, while 8.35%, 7.80%, and 83.84% by 2050. Level II ICV may be regarded as a transitional product, thus it only occupies a relatively small part in the fleet. The whole fleet will keep growing and end up with 522.89 million by 2050. However, under the CS scenarios, the vehicle stock in China will peak at 450.81 million units in 2036 and then drop to 369.41 million units in 2050, with a significant reduction in level III ICVs. Since fewer Level III ICVs will enter the market, the fleet penetration of Level III ICVs will decrease to 1.81% by 2030, and 77.13% by 2050.
2.1.3. Vehicle Kilometers Travelled
Vehicle kilometers travelled (VKT) are the total kilometers traveled by all vehicles annually, which affects the number of accidents, fuel consumption, and emissions of the whole fleet. Different vehicle types have distinct travel distances which are subject to various factors, such as fuel costs, traffic conditions, and passenger or logistics demand. Therefore, a statistical average is usually used to describe vehicle usage intensity. Furthermore, a vehicle’s travel distance may decline as it gets older [36]. Hence, the VKT variation ratios over vehicle lifespan are taken into account. Fleet VKT of vehicle type t in year y under BAU scenario can be calculated as following [31]:
where, is the average VKT of vehicle type t in year y (km/year); and is the VKT ratio of vehicle type t in the (age)th year (%). All parameters come from relevant studies in China [31,36].
However, VKT will be significantly influenced by ICV’s deployment. On one hand, ICV may reduce VKT due to less hunting for parking places and more ridesharing. However, on the other hand, more underserved population and unmanned driving tasks are able to make use of ICVs with high-level ADS, while decreased travel costs will also lead to more travel demand and transportation modes shift. For different types and levels of ICVs, these effects will be quite different. Hence, fleet VKT with ICVs may vary from the baseline under different scenarios. The modified fleet VKT are shown in Equation (4).
where, is the effect coefficient of mechanism m on level i ICV’s VKT (%). The coefficients used in this paper are illustrated in Table 4.
Figure 3a–c show the predictions of fleet VKT. Passenger vehicles contribute the major portion to fleet VKT, followed by highway trucks. Under the BAU scenario, fleet VKT will reach 3.80 trillion kilometers in 2030 and 4.89 trillion kilometers in 2050. And there will be only little change under the OPT scenario, with an increase by 0.02% in 2030 and a decrease by 2.02% in 2050. Meanwhile, a significant growth can be observed under the CON scenario by 9.96% and 79.74%, respectively. Figure 3d indicates that if we consider the additional effects of car sharing, there will be an extra reduction in fleet VKT because of the higher mobility efficiency of CPV than NPV. Furthermore, the share in transport of CPVs increase to almost 20%, comparing to only around 1% in BAU scenario.
2.1.4. Economic Assumptions
In order to conduct CBA of ICV, monetization of all kinds of benefits is necessary. To exclude the influence of inflation, we assume that all the prices and costs in this paper, like accident costs and fuel prices, will remain the same from 2015, which means 2015 constant values are used for benefit and cost estimation. Only emission prices and vehicle costs will change significantly, due to the policy regulations and technology advancement, which will be discussed in Section 2.4.3 and Section 2.6.1, respectively. Thus, all the benefits and costs are measured in constant 2015 renminbi (RMB), and the exchange rate of U.S. dollar to RMB adopts the average value in 2015 according to National Bureau of Statistics. Other economic parameters, including total population, urban population, and per-capita gross domestic product (GDP) in China, refer to the research of Lu, Zhou et al. [31]. Moreover, this paper uses the method of present value to calculate the cumulative benefits, costs and benefit–cost ratios, with a social discount rate at 8%.
2.2. Safety Benefits
2.2.1. Impacts on Number of Accidents
Traffic safety can be defined as the expected number of fatalities and injuries in a specific area during a certain period. Hence, it consists of three primary dimensions, namely exposure, risk, and consequence [41]. Exposure describes the duration when vehicles are in danger of accidents, which can be measured in VKT. Risk represents the probability of being involved in accidents per unit of exposure, and consequence shows the expected fatalities or injuries in each accident. ICV will change fleet VKT as previously mentioned, and also reduce accident possibility by correcting driving behaviors and improving driving abilities. Therefore, the effects of ICV on traffic safety mainly apply to road exposure and risk. The impacts on the number of fatalities can be calculated as following:
where, is the decrease of fatalities in year y (person); is the number of fatalities under BAU scenario in year y (person); is the proportion of accident type a in all accidents (%); is the safety effect coefficient of function f on the fatalities of accident type a (%); and is the correcting factor of function f considering fleet penetration and road infrastructure penetration (%). The impacts on injuries can also be derived from this equation by replacing fatality-related parameters with injury-related ones.
The BAU number of fatalities can be derived from vehicle stock and fatality rate per 10,000 vehicles (FR). FR in China declined from 4.33 in 2008 to 2.06 in 2017 [42], which approaches the road safety level of U.S. in 1997 [43]. And FR in U.S. has been stable at about 1.20 since 2014 [43]. Therefore, we assume that FR in China will reach the same level in 2034 and stabilize from then on. Moreover, injury rate shows a linear correlation with FR, and it is assumed as 3.4 times greater than FR, based on historical data from 2008 to 2017 [42]. The proportions of different accident types is assumed as constant values since 2016 [42].
The safety effect coefficient measures how many accidents can be avoided with ICV functions. Based on a literature survey, all coefficients used in this paper are shown in Table 5. For Level I and II ICVs, their safety improvements are expressed as the sums of potential accident decreases caused by corresponding functions. Some types of accidents can be reduced by various functions, which results in double counting. Thus, this paper decouples these interrelationships by assuming equal weights for each function which can work in the same specific accident type, due to lack of detailed data on accident causes. For instance, Full-speed range adaptive cruise control (FSR ACC), electronic stability control (ESC), and traffic sign recognition (TSR) can all reduce the accidents caused by overspeed. So it is assumed that one third of overspeed accidents can be avoided by each function. Particularly, for Level III ICV, due to its high-level autonomous driving ability, it can cut down all kinds of accidents by 90% [3].
The fleet penetration and road infrastructure penetration of ICV functions also determine their practical effects. ICV functions can be divided into four categories according to operating mechanisms: Single-vehicle and multiple-vehicle functions either based on on-board sensors, or based on vehicle-to-vehicle (V2V) and vehicle-to-infrastructure (V2I) communication. These categories have different correcting factors, as shown in Table 6 based on [24]. Infrastructure penetration represents the proportion of road infrastructure equipped with V2I ability. The recent Chinese official plans require a 90% coverage of V2I network in cities and highways by 2020, and a full coverage by 2025. Therefore, it is assumed that the network construction can satisfy the demand of high-level ICV’s development, and infrastructure penetration is regarded as 100%.
2.2.2. Accident Costs
To monetize safety benefits, average accident costs of fatality and injury in China are estimated. Accident cost includes victim related cost, property damage, and administration cost [52,53]. The value of statistical life or injury (VSL or VSI) quantifies the potential benefits of avoiding these accidents, and it is usually expressed as a form of per-capita GDP. A wide range of ratios are recommended in different studies [52,53,54,55], and we adopt the suggestion of iRAP project that VSL is 70 times of GDP per capita [52]. VSI is also expressed as a fraction of VSL. An average ratio of different injury severity levels is calculated, according to the official guidance of U.S. Department of Transportation [55]. Furthermore, direct property damage is considered separately and historical data from 2008 to 2017 shows that it costs around 20,000 RMB per death on average [42].
2.3. Traffic Benefits
2.3.1. Impacts on Road Capacity
Under the OPT scenario, ICV can improve average travel speed with smoother driving strategy, and increase traffic density by shortening headways between vehicles. Several previous studies believe that widespread ICVs may even double current road capacity [23,29]. However, these impacts will be distinct for different vehicle and road types, because drivers of buses and trucks will remain longer headways in case of emergency brakes, and vehicles on highways will also stay farther away from others due to higher speeds. Thus, the impacts on basic capacity under ideal traffic conditions are evaluated. The road capacity can be determined as Equation (6) based on the traffic flow theory, with a modified speed–flow–density relationship [23]. Since Level I ICV only has L1 or L2 ADS without cooperation functions and is operated by human drivers most of the time, it is treated as the same type with the conventional vehicle in this equation.
where, is the capacity of road type r in year y (vehicles per hour per lane); is the design speed for road type r (m/s), as listed in Table 3; is the stock proportion of vehicle type t in year y (%); is the fleet penetration of Level II and III ICVs, which can be expressed as (%); is the time gap between two ICVs on road type r (s); is the time gap that a Level II or III ICV will keep when following a human-driven vehicle on road type r (s); is the time gap that a human-driven vehicle of type t will keep from others on road type r (s); and is the sum of length of vehicle type t and a minimum safety distance (m).
For passenger vehicles, , , and are set as 0.3 s, 0.6 s, and 0.6 s, respectively on urban roads, while 0.5 s, 0.9 s, and 1.15 s, respectively on highways and rural roads [23]. As for buses and trucks, the time gap parameters of Level II and III ICVs are the same, and the ones of human drivers can be adjusted by Huber’s equation [56].
where, is the passenger car equivalent factor of vehicle type t on road type r. According to Chinese road engineering standards, the factors for buses and trucks are 2.0 and 2.5 on urban road, and change to 1.5 and 2.5 on highways and rural roads.
Under the CON scenario, ICV may not bring such ideal improvements to road capacity. Some studies indicated that mixed traffic of ICVs and conventional vehicles might result in interference, and ICVs could not cut down headways as low as possible in consideration of passengers’ comfort and feelings [57,58]. Hence, it is supposed that there will be no increase in road capacity.
2.3.2. Impacts on Travel Time
ICV can travel at more stable speeds, change lanes and pass intersections quickly, and avoid congestion with dynamic navigation systems. To estimate the reduction in travel time, the Bureau of Public Roads (BPR) function [33] is modified as following.
where is the reduction rate of travel time on road type r in year y (%); and are the model parameters of road type r, which are shown in Table 3; is the ratio between actual traffic flow and road capacity on road type r in year y, in consideration of ICVs’ effects; and is the passenger car equivalent factor of level i ICV on road type r. equals 1.0 because Level I ICV behaves almost the same with human drivers, while and are derived from Huber’s equation with their time gap parameters [56].
Value of represents the level of service on road type r. To estimate the bounds of ICVs’ effects, it is assumed to be 0.35 under the CON scenario based on standard JTG B01-2014, which describes a free flow and ICVs’ improvements in travel time are tiny. Under the OPT scenario, traffic flow surpasses road capacity and this value equals 1.0, when ICVs will maximize their benefits in mitigating congestion.
2.3.3. Road Capacity Cost and Travel Time Value
Increasing road capacity may allow governments to reduce investment in road construction and maintenance. Therefore, the fixed investments in different roads in China are used to monetize the improvements in road capacity, according to yearbook data from Ministry of Housing and Urban-Rural Development and Ministry of Transport. An annual growth rate of 2% is assumed since 2015.
Travel time value is the cost per unit time spent on travel, and varies for drivers and passengers of different vehicle types. It is usually compared with prevailing wages, with the premise that all the time savings will be devoted to working. We employ Litman’s recommended adjustment factors to reflect specific conditions and preferences of vehicle occupants [59]. However, this paper focuses on the socioeconomic impacts, thus per-capita GDP per time unit is used to evaluate travel time value instead of personal income or wages. The average number of passengers per trip is estimated based on transportation statistics, as 2 persons for CPVs, 0.5 for NPVs, 45 for buses, and 1 for trucks.
Furthermore, travel time value will decrease due to the more efficient utilization of time, when human drivers are able to pay less or no attention to traffic conditions and spend hours working or relaxing in autonomous vehicles. Several studies indicated that for Level I ICV, travel time value would decrease by 0 to 5%, and 50% to 80% for Level III ICV [26,27]. Since Level II ICV is driven by human drivers and ADS together, an average reduction rate is applied, which means 25% to 42.5%.
2.4. Environmental Benefits
2.4.1. Impacts on Energy Consumption
ICV will affect the use intensity and energy intensity of fleet energy consumption, based on a modified Kaya Identity method [22]. On one hand, ICV can influence use intensity by changing fleet VKT, as discussed before. On the other hand, ICV will change energy intensity in three ways. First, ICV may change current vehicle configurations and designs. Extra components such as cameras, radars, LiDARs, and communication modems will consume more energy and add curb weights. And vehicles may also increase their air drag because of external installation of ICV hardware, while reduce their weights by cancelling passive safety devices and downsizing for higher occupancy. Second, ICV can improve fuel efficiency through eco-driving strategies and vehicle platooning, and platooning is more energy efficient on highways. Third, ICV can contribute to a better traffic environment. There will be less congestion in urban areas, and fewer “stop and go” activities will help reduce energy waste. However, the average speed on highways will rise, which causes larger air resistance. Besides, fewer accidents may also reduce related traffic jams and then unnecessary braking and bypassing behaviors, which have currently increased fuel consumption to some extent. All these mechanisms and their effects are listed in Table 7.
The fleet energy consumption under the BAU scenario and the OPT or CON scenarios can be calculated with Equations (10) and (11) [34].
where, is the total energy consumption of vehicle type t in year y under the BAU scenario (MJ); is the average energy consumption rate of vehicle type t in year y (MJ/km); and are the sales and average energy consumption rate of vehicle type t of fuel type ft in year y (kg/km or L/km), which are extracted from the study of Liu et al. [34]; and are the low heat value and density of fuel type ft, as shown in Table 8; and is the energy intensity effect coefficient of mechanism m (%), as illustrated in Table 7. The results of AECR are shown in Figure 4.
2.4.2. Impacts on GHG emissions
This paper considers the fleet GHG emissions in well to wheel stage. GHG emissions are proportional to energy consumption, and can be expressed as following [34]:
where, is the average GHG emission rate of vehicle type t in year y (g CO2 eq./km); and is the life cycle GHG emissions factor of fuel type ft as shown in Table 8.
2.4.3. Energy and GHG Emissions Costs
The energy savings of ICV are measured with fuel costs. The 2015 constant prices of different fuel types are presented in Table 8, and the benefit of reduction in GHG emissions is quantified with the carbon market price. Since there is no unified carbon market in China currently, we regard Beijing as a representative market and its 2015 average price of carbon credits was 41.48 RMB/tonne. It is estimated that the reasonable price will increase to about 300 RMB/tonne in China by 2030 [66], and we assume that it will not change after that.
2.5. Industrial Economic Benefits
2.5.1. Impacts on Operating Costs
The commercialization of ICV will have influences on operating costs for both automotive manufacturers and commercial fleet operators, as shown in Table 9. For automotive manufacturers, ICV may either require higher investment in new technology research and development (R&D), or reduce R&D costs by providing real-time data for optimal design. ICV can also decrease production costs since it enables software-defined vehicles to promote modularization and intelligent manufacturing. Moreover, ICV can decrease marketing costs because it makes precision marketing and remote services possible [1].
Considering the operational cost structure of commercial fleet operators, main savings of ICV fleet compared with conventional vehicle fleet lie in insurance fee, cleaning cost, and driver salary [67]. First, ICVs have lower probability to be involved in accidents, thus they can obtain a lower insurance rate. Second, Level III ICVs without drivers will need cleaning more frequently, since passengers may pollute their cockpits during nondriving activities. Third, Level III ICVs need no drivers and save labor costs. For different types of vehicles, these costs are estimated separately. Particularly, these cost savings are supposed to be the main target for automotive industry to develop ICVs, hence we presume that they will be the same for both OPT and CON scenarios.
2.5.2. Impacts on Income
ICV can not only cut down diverse costs, but also generate income for automotive manufacturers. Under the OPT scenario, an increasing user value will be realized because ICVs can strengthen the bond between users and product providers. First of all, customers are willing to pay incremental prices for ICV functions and devices. Then, users are able to enjoy digital automotive services such as on-site maintenance, intelligent charging, and online financial services, via ICVs’ communication abilities. Finally, the big data generated by ICVs may allow the automotive industry to cooperate with other industries like tourism, e-commerce, and smart home. Table 10 shows ICVs’ impacts on user values, and the same values are assumed for all vehicle types. However, users may also regard all these products and services as regular updates and will pay nothing more under the CON scenario.
2.6. Implementation Costs
2.6.1. Vehicle Costs
Though implementation of ICVs will generate a variety of benefits, extra fixed cost and variable cost are required for the fleet to achieve these goals. The extra fixed cost is the purchase cost of ICV hardware and software. In the absence of statistics for ICV prices, this paper employed a learning curve model to predict the extra fixed cost, as shown in Equation (16). Thus, the initial prices are needed to estimate the future ones. For Level I ICV, Archambault, Delaney, et al. [74] surveyed its content increases per vehicle, and the prices of Tesla Autopilot and Google autonomous vehicles are assumed as the initial values for Level II and III ICVs. Therefore, the extra fixed costs for the different ICVs are $765 (4765 RMB), $5000 (33,142 RMB), and $150,000 (934,260 RMB) in 2015, respectively.
where, is the extra fixed cost for level i ICV in year y (RMB per vehicle); is the extra fixed cost of the first production for level i ICV (RMB per vehicle), which is calibrated with aforementioned values; is the progress ratio, which implies how the cost could be decreased when cumulative production is doubled. Since there is no experience data for ICV production, the progress ratio of Ford Model T is considered as a reference: 85% [75]. According to this model, the extra prices for each level ICV will drop down to 1398, 9559, and 124,665 RMB at the beginning of commercialization in 2025, and even only about 1079, 4829, and 22,503 RMB in 2050.
Extra variable cost includes the maintenance cost and communication cost when passengers use ICV functions. The annual maintenance cost of ICV hardware and software is about 10% of the extra fixed cost. According to statistical bulletins of Chinese communications industry in 2017 to 2018, a mobile network user spends around 536 RMB on mobile data yearly on the average. We assume that Level III ICVs will double this cost because both passengers and vehicles will need such communication services. Hence, the communication costs for the different ICVs are 536, 804, and 1072 RMB per vehicle per year, respectively.
2.6.2. Infrastructure Costs
Level II and III ICVs require not only upgrading of vehicles, but also construction and operation of new infrastructure [2]. Two kinds of key infrastructure are studied, i.e., V2I road infrastructure and high-definition (HD) maps. All these constructions may be completed by 2025, according to the plans and roadmaps of Chinese government.V2I road infrastructure is composed of roadside units, traffic signal controllers, security management systems, and other elements. Thus, its deployment triggers more designing and planning, hardware purchasing, and installation and inspection costs. There are hardly any detailed cost analyses about V2I infrastructure in China, hence these costs are evaluated based on the report of U.S. Department of Transportation [76]. Furthermore, there are two types of V2I technologies: Dedicated short range communication (DSRC) and cellular V2I (C-V2I) communication. DSRC offers a safe, robust, and well-developed solution, which has been deployed in many countries such as U.S. and Japan. C-V2I is featured with higher throughput and mobility at lower costs, but its deployment still demands progress in reliability and commercialization [77]. The recent ICV policies in China tend towards the C-V2I solution, so it is believed that C-V2I infrastructure will be implemented. Since there is no relative cost study in the C-V2I solution, the same unit values with DSRC are supposed, as shown in Table 11.
HD maps are essential to ICVs because they can provide dynamic surrounding information and a priori knowledge to assist in environment perception and route planning. However, they also require greater expenses due to higher precision and more frequent updates than normal navigation maps. The data collection of HD maps can either be accomplished by specialized mapping vehicles with expensive devices like LiDARs and stereo cameras, or utilize crowdsourcing method by gathering data from running vehicles equipped with cheap sensors. The former has advantages of high precision and reliability, while the latter costs less and offers real-time updates. Therefore, a major solution to produce HD maps is to collect the initial data by professional mapping teams, and update them by numerous daily users. Their expenses are estimated based on a market survey, as indicated in Table 11.
3. Results
Based on the assessment methods and data, we conducted a comprehensive benefit and cost analysis of ICV deployment in China from 2015 to 2050. Figure 5 indicates the results under two scenarios. Under the OPT scenario, ICVs can generate 2.24, 10.46, and 24.02 trillion RMB of socioeconomic benefits in 2030, 2040, and 2050, respectively. Under the CON scenario, these values reduce to 0.28, 4.59, and 13.25 trillion RMB. The benefits will experience a rapid growth after 2030, when Level III ICVs start to enter the market on a large scale. Nonetheless, in the primary stage under the CON scenario, the increases in traffic accidents and energy consumption due to incremental fleet VKT may offset the positive effects of ICVs, which lead to a slightly negative result before 2025.
3.1. Different Types of Benefits
As shown in Figure 5, different types of benefits can be compared. Though many people have put particular emphasis on the safety benefits of ICVs, the results state that travel time cost savings may be the most significant effect. For both the OPT and CON scenarios, the reduced time costs will account for nearly half of the whole benefits, reaching 6.37 to 10.82 trillion RMB in 2050. The decrease in operating costs of fleet operators also plays a large part, with 5.90 trillion RMB in 2050. Under the OPT scenario, the improvement in road capacity will save a large amount of investment, which can be up to 3.33 trillion RMB. However, if this effect is ignored conservatively, the avoidance of fatalities and injuries would become a major contributor, corresponding to 655.26 to 924.45 billion RMB and 441.73 to 617.97 billion RMB, respectively.
More specifically, from the aspect of road safety, ICVs will save 13,099 lives and reduce 34,848 injuries in 2030 under the OPT scenario, which are 21.85% and 17.10% fewer than the BAU scenario, respectively. These numbers may go up to 53,759 and 179,683 by 2050, meaning reduction rates of 85.68% and 84.22%, thanks to the widespread application of Level III ICVs. However, things are different when we consider the CON scenario. In 2030, there will be 4482 more injured people. This is because although accident risk drops, the fleet exposure increases by almost 10% and leads to more accidents on the road. Nonetheless, this negative impact will disappear by around 2033, and all accidents will decline by about 60% in 2050.
As for traffic benefits, Level II and III ICVs show high potential in enhancing road capacity under the OPT scenario. Among all the road types, national and provincial highways have the greatest increase by 6.6% in 2030 and 121.84% in 2050. The capacity of all kinds of highways can be improved by up to more than 70%, since they permit higher design speeds. Meanwhile, urban and rural roads only have the potential to raise their capacity by no more than 50% in 2050. ICVs will also reduce travel time on different roads. An optimistic estimation is that 46.40% of travel time can be saved on second trunk roads in 2050, while the reduction will be less than 20% on highways. Additionally, the conservative results indicate that express ways will have the most significant effect, with a decrease proportion of only 10.31%. There is almost no decline in travel time on highways. Therefore, we mainly considered the time-saving effects in urban areas, and an ICV can save 1.0 to 7.7 minutes per trip in 2050. Since CPVs and urban buses (UBs) run on roads for a long period per day and carry most passengers, they will have the highest time cost savings.
ICVs can also contribute to energy savings and emissions reduction. Since the Chinese government is sparing no effort in promoting new energy vehicles, the fleet energy will decline quickly in the next few decades under the BAU scenario, and ICVs may be conducive to this target. If we can take advantage of the positive impacts of ICVs on energy efficiency and avoid noticeable VKT growth, a total energy saving of 17.86 million tonnes of oil equivalent (Mtoe) can be anticipated in 2030, which accounts for 10.63% in the fleet energy consumption in the BAU scenario. Furthermore, in 2050, this proportion will increase to 27.22%, meaning a decline of 35.68 Mtoe. However, under the CON scenario, the fleet energy consumption will increase by 1.78% in 2030 and 10.54% in 2050, since ICVs induce more people to travel in automobiles, and highway vehicles can operate at higher speeds which cause greater air drag. Additionally, the fleet GHG emissions will present a similar trend due to its linear dependence on energy consumption. The total emissions may either decrease by 77.74 and 150.07 million tonnes of CO2 equivalent (Mt CO2 eq.) in 2030 and 2050, or increase by 12.91 and 54.06 Mt CO2 eq., respectively.
3.2. Benefits for Different Types of Vehicles
All types of vehicles can benefit from ICV technologies. Owing to the large stock amount, NPVs will take up about 50% or more of the whole fleet benefits, as shown in Figure 6a,b. Therefore, NPVs are supposed to be the major market for large-scale applications of ICVs. Moreover, all vehicle types will face a temporary rise in social costs due to the negative effect of VKT growth under the CON scenario, especially for highway vehicles with higher energy consumption.
Figure 6c,d indicate the distinction among the per-vehicle comprehensive benefits of different vehicle types. NPVs have a relatively low per-vehicle value, since other commercial vehicle types will obtain extra savings in labor costs after Level III ICVs enter the market on a large scale in 2030. Urban vehicles have higher benefits than highway vehicles as reduced time costs contribute to a major part of the total benefits. For the same reason, urban buses and CPVs with the most passenger person–time on roads will acquire the highest value per unit. Hence, the government and industry should give priority to early deployment in these fields. It is estimated that each urban bus can generate 26,405 to 71,013 RMB of total benefits by 2030, and 639,393 to 1,072,641 RMB annually by 2050.
3.3. Cumulative Cost–Benefit Analysis
The deployment of ICVs requires a long period and huge investments, thus the cumulative costs and benefits were analyzed with present values in 2015, as shown in Figure 7. The cumulative benefits will experience a rapid growth after 2030, thanks to the popularization of Level III ICVs. Meanwhile, the annual cost will gradually level off since the early infrastructure construction will be finished by 2025, and ICV prices will drop down to an affordable level. All inputs can be recovered by 2028 under the OPT scenario, but this will be delayed until 2048 if all conservative assumptions are made. However, the cumulative benefit–cost ratio (BCR) could reach 1.15 to 3.06 by 2050, indicating the economic rationality and feasibility of ICV deployment under all scenarios.
Furthermore, in this paper, safety, traffic, and environmental benefits are defined as social public benefits, which are the main concern of government. Additionally, automotive and other industries pay more attention to industrial economic benefits. Under the OPT scenario, if industrial economic benefits or social public benefits are considered alone, the break-even point will be put off until 2033 or 2042. Under the CON scenario, the country cannot recover all costs with either type of benefits. Therefore, the general consensus and cooperation between government and industry are necessary to take full advantage of ICVs.
3.4. Impacts of Car Sharing
If household vehicles are partly replaced by sharing vehicles, the total benefits under CS scenarios will become a little higher at 14.93 to 24.95 trillion RMB in 2050, as shown in Figure 8. Fewer NPV sales will lead to a decrease in the manufacturers’ revenue, and the lower fleet penetration rate will also impair the ICVs’ potential to improve traffic efficiency and save travel time. However, car sharing will also greatly reduce operating costs since fewer human drivers are needed. Moreover, implementation costs of expensive Level III NPVs can be cut down by more than 20% in the end. Hence, a higher cumulative BCR at 1.53 to 3.53 is expected in 2050, and all the costs will be recouped between 2028 and 2045.
4. Discussion: Sensitivity Analysis
As stated in the introduction, the effects of ICVs are complicated and may be influenced by many factors. To have a further discussion about uncertainties, several sensitive analyses were conducted.
4.1. Technology Factor
The socioeconomic impacts of ICV technologies vary from level to level. To distinguish their effects, their comprehensive benefits were compared under the same deployment conditions, with 100% fleet penetration and other technology and economic assumptions in 2050. Figure 9 shows the results under both scenarios. In consideration of the OPT scenario, the annual BCRs were 6.62, 11.56, and 8.61 for each level. Level II ICV had the highest cost-effectiveness, since it can provide a large amount of traffic and environmental benefits at a relatively low price. Both social public benefits and industrial economic benefits can cover all of the costs for the three levels. However, under the CON scenario, the ratios declined to −0.62, 3.22, and 4.22. Negative impacts appeared for Level I ICV as the increasing fleet VKT caused more accidents and energy consumption, while also enhancing the operating costs of the automotive industry. Furthermore, Level III ICV always generated the greatest industrial economic benefits, which is an important reason why many automotive and technology companies endeavor to directly develop high-level ADS.
4.2. Deployment Factor
The aforementioned results show that reduced time costs in traffic benefits and reduced labor costs in industrial economic benefits are major contributors to the comprehensive benefits. Nonetheless, it may be hard to achieve these goals due to several realistic deployment constraints. The reduction in travel time values depends on the premise that ICVs can enable production and consumption activities in vehicles. However, some surveys have indicated that more users will tend to take a break or monitor the driving state, which will make hardly any improvements in travel time values. Figure 10a shows the result without regard to travel time value changes. In this case, the cost-effectiveness will drop down to 0.64 to 2.29 by 2050, which means it will be impossible to reach the break-even point before 2050 under the CON scenario. Furthermore, in this situation, the social public benefits alone cannot recover the cumulative costs under both scenarios, which entails the involvement of the automotive industry to exploit the economic benefits of ICVs.
Another deployment problem is whether human drivers can really be replaced by ADS. Despite targeting level III ICVs on cancelling human drivers, if they are not safe enough to substitute for human drivers, fleet operators will have to create new positions like safety drivers or fleet supervisors to ensure road safety. Thus, labor costs will be inevitable. Figure 10b indicates that in this circumstance, the investment can still be recouped at the same break-even point under the OPT scenario. However, under the CON scenario, the industrial economic benefits will face a sharp decline and the break-even point will be put off to later than 2050. Moreover, the automotive industry will not profit from deploying ICVs unless the government provides investment funds, subsidies, or other favorable policies.
4.3. Cost Factor
Two kinds of costs were studied in the CBA results, which are also highly uncertain due to various technology solutions and technical progress. Figure 11 discusses the impact of changes in vehicle fixed costs and V2I road infrastructure costs. Since historical data of ICV production are not available, the progress ratio cannot be determined and may vary in a reasonable range, usually from 70% to 95% [75]. If the production cost drops more quickly, there will be almost no other extra fixed costs for level III ICVs and the break-even point will be advanced by one to five years. Meanwhile, if the higher progress ratio is applied, level III ICVs will hold an extra cost as high as 288 thousand RMB by 2050. Additionally, the cumulative BCR is only 0.26 to 0.71, which means it will become impossible to recover all of the costs in many years.
V2I road infrastructure costs depend on its technology solution and maturity. If the DSRC solution is adopted, higher infrastructure costs are expected. However, since the infrastructure costs are relatively small when compared with vehicles costs, this variation will only put off the break-even point by three years. Additionally, there will be a tiny decrease in the cumulative BCR, which will be 0.99 to 2.66 by 2050. Therefore, even if C-V2I technology is unable to be implemented in the next few years, DSRC still offers an affordable way of building the essential network environment for ICVs.
5. Conclusions
This study established a comprehensive assessment framework to analyze the socioeconomic benefits of ICV deployment. Based on the latest policies, transportation, and market data, we provided an estimation of the future benefits and costs to deploy ICVs in China and investigated some of the key factors that will impact the cost-effectiveness of ICVs. This framework can also be employed for any other country or region to make assessments and suggestions for the government and industry.
The results indicate that according to the official roadmap, the total penetration of ICVs will attain 70.77% by 2030, and all vehicles will be equipped with different ICV technologies after 2047. However, fleet VKT may also increase by almost 80% in extreme situations, which will offset the benefits from ICV deployment. Therefore, green and sustainable transit modes, like ridesharing and carpooling, may be necessary in the ICV era. In fact, ICV is regarded as the most important solution to facilitate car sharing and travel on demand, which will be conducive to reductions in vehicle stock and VKT [2,5]. It is estimated that up to 10 household-owned vehicles could be replaced by a sharing vehicle [19]. Thus, higher benefits and lower costs can be expected to help ICVs achieve better cost-effectiveness, as the results suggest. However, the aim of this paper was to discuss the impacts of ICV technologies rather than business innovations, and only a simplified analysis on car sharing scenarios was conducted. More new travel modes should be considered in the upcoming research agenda, and further thoughtful discussions about the interaction between them and ICVs are necessary to improve this assessment framework, especially when Level III ICVs are accessible.
Different types of benefits were also discussed. First, the increase in fleet VKT under the CON scenario will cause more accidents during the early stage, but with the introduction of Level II and III ICVs, a positive road safety trend can be expected. Second, Level II and III ICVs can significantly improve road capacity by more than doubling as well as save a considerable amount of travel time on urban roads. Third, ICVs will influence the fleet energy consumption and GHG emissions by both increasing use intensity and reducing energy intensity, thus their environmental effects can be either negative or positive. Finally, ICVs are able to enhance industry income and reduce expenditure, and the savings in labor costs through the deployment of Level III ICVs will account for a large part.
By monetizing all the effects, it is estimated that the whole country will obtain 13.25 to 24.02 trillion RMB comprehensive benefits in 2050, among which the reduced time costs and labor costs are major contributors. Though increasing social costs may be possible in the early stage, the cumulative implementation costs can be recovered by 2028 to 2048. Nevertheless, if only the social public benefits or industrial economic benefits are considered, the break-even point will be delayed. Therefore, it is essential for the government and industry to create a new industry organization or partnership, which can exploit all the benefits and split the costs reasonably. Furthermore, CPVs and UBs have the highest benefits per vehicle, which should be the first field of ICV pilot deployment. However, in order to achieve break even, NPV is the most important market for large-scale commercialization.
Some single-factor analyses were also conducted. First, all levels of ICVs could realize high BCRs under the OPT scenario, and Level III ICV had the greatest potential for industrial economic benefits. Then, future in-vehicle applications and functions should be designed to help passengers take advantage of spare travel time. Additionally, if human drivers cannot be totally replaced, the government has to subsidize or fund the industry to promote ICVs. Finally, a rapid decline in ICV price is necessary to guarantee the cost-effectiveness.
This study also has several limitations. First, due to a lack of reliable and systematic data on the effects of ICVs and Chinese contexts, some assumptions and estimations refer to other industries and countries, which may influence the accuracy of the results. Second, there are other factors that may affect the deployment and benefits of ICVs, such as the aforementioned new mobility as well as user acceptance and usage frequency. If vehicle occupants doubt the ICVs’ reliability or find them uncomfortable, they may switch off the ICV functions, thus depressing their positive effects. Therefore, more deployment elements should be supplemented in the future. Third, this paper assessed the ICVs’ benefits from the perspective of the whole society rather than the stakeholders. A further study is needed to explore the corresponding benefits and costs for different stakeholders as well as how to build a new business model or ecosystem to exploit ICV technologies in a sustainable way.
Author Contributions
X.K., F.Z. and Z.L. designed the whole study; X.K. conducted data collection, modeling, results analysis and wrote the original draft paper; F.Z., H.H. and Z.L. revised and edited the paper.
Funding
This research was funded by the National Natural Science Foundation of China, grant number U1764265.
Conflicts of Interest
The authors declare no conflict of interest.
References
- Kuang, X.; Zhao, F.Q.; Hao, H.; Liu, Z.W. Intelligent connected vehicles: The industrial practices and impacts on automotive value-chains in China. Asia Pac. Bus. Rev. 2018, 24, 1–21. [Google Scholar] [CrossRef]
- Martinez-Diaz, M.; Soriguera, F.; Perez, I. Autonomous driving: A bird’s eye view. IET Intell. Transp. Syst. 2019, 13, 563–579. [Google Scholar] [CrossRef]
- Bertoncello, M.; Wee, D. Ten Ways Autonomous Driving Could Redefine the Automotive World. Available online: https://www.mckinsey.com/industries/automotive-and-assembly/our-insights/ten-ways-autonomous-driving-could-redefine-the-automotive-world (accessed on 27 March 2019).
- The Strategic Advisory Committee of Technology Roadmap for Energy Saving and New Energy Vehicles; SAE-China. Technology Roadmap for Energy Saving and New Energy Vehicles; China Machine Press: Beijing, China, 2016. [Google Scholar]
- Kuhnert, F.; Stürmer, C.; Koster, A. Five Trends Transforming the Automotive Industry; PricewaterhouseCoopers GmbH Wirtschaftsprüfungsgesellschaft: Berlin, Germany, 2018; Available online: https://www.pwc.com/gx/en/industries/automotive/assets/pwc-five-trends-transforming-the-automotive-industry.pdf (accessed on 5 June 2019).
- Wiethoff, M. Action for Advanced Driver Assistance and Vehicle Control Systems Implementation, Standardisation, Optimum use of the Road Network and Safety; SWOV Institute for Road Safety Research: Leidschendam, The Netherlands, 2003. [Google Scholar]
- Abele, J.; Kerlen, C.; Krueger, S.; Baum, H.; Geißler, T.; Grawenhoff, S.; Schneider, J.; Schulz, W.H. Exploratory Study on the Potential Socio-Economic Impact of the Introduction of Intelligent Safety Systems in Road Vehicles; VDI/VDE Innovation + Technik GmbH.; Institute for Transport Economics at the University of Cologne: Teltow, Germany, 2005. [Google Scholar]
- Malong, K.; Wilmink, I.; Noecker, G.; Roßrucker, K.; Galbas, R.; Alkim, T. Final Report and Integration of Results and Perspectives for Market Introduction of IVSS; Netherland’s Organization for Applied Scientific Research: Delft, The Netherlands, 2008. [Google Scholar]
- Lu, M.; Wevers, K.; van der Heijden, R.; Marchau, V. Infrastructure measures versus ADAS for traffic safety—Application of the grey relational analysis evaluation method. In Proceedings of the 12th World Congress on Intelligent Transport Systems, San Francisco, CA, USA, 6–10 November 2005; pp. 716–736. [Google Scholar]
- Psaraki, V.; Pagoni, I.; Schafer, A. Techno-economic assessment of the potential of intelligent transport systems to reduce CO2 emissions. IET Intell. Transp. Syst. 2012, 6, 355–363. [Google Scholar] [CrossRef]
- Benmimoun, M.; Putz, A.; Zlocki, A.; Eckstein, L. euroFOT: Field operational test and impact assessment of advanced driver assistance systems: Final results. In Proceedings of the 34th FISITA World Automotive Congress, Beijing, China, 27–30 November 2012; pp. 537–547. [Google Scholar]
- Kuang, X.; Zhao, F.; Hao, H.; Liu, Z. Intelligent Vehicles’ Effects on Chinese Traffic: A Simulation Study of Cooperative Adaptive Cruise Control and Intelligent Speed Adaption. In Proceedings of the 21st IEEE International Conference on Intelligent Transportation Systems (ITSC) 2018, Maui, HI, USA, 4–7 November 2018; pp. 368–373. [Google Scholar]
- Kiefer, R.J.; Hankey, J.M. Lane change behavior with a side blind zone alert system. Accid. Anal. Prev. 2008, 40, 683–690. [Google Scholar] [CrossRef] [PubMed]
- Lie, A.; Tingvall, C.; Krafft, M.; Kullgren, A. The effectiveness of electronic stability control (ESC) in reducing real life crashes and injuries. Traffic Inj. Prev. 2006, 7, 38–43. [Google Scholar] [CrossRef] [PubMed]
- Edwards, M.; Nathanson, A.; Wisch, M. Estimate of Potential Benefit for Europe of Fitting Autonomous Emergency Braking (AEB) Systems for Pedestrian Protection to Passenger Cars. Traffic Inj. Prev. 2014, 15, S173–S182. [Google Scholar] [CrossRef] [PubMed]
- Erke, A. Effects of electronic stability control (ESC) on accidents: A review of empirical evidence. Accid. Anal. Prev. 2008, 40, 167–173. [Google Scholar] [CrossRef]
- Ponte, G.; Ryan, G.A.; Anderson, R.W.G. An estimate of the effectiveness of an in-vehicle automatic collision notification system in reducing road crash fatalities in South Australia. Traffic Inj. Prev. 2016, 17, 258–263. [Google Scholar] [CrossRef]
- Jermakian, J.S. Crash avoidance potential of four passenger vehicle technologies. Accid. Anal. Prev. 2011, 43, 732–740. [Google Scholar] [CrossRef]
- Fagnant, D.J.; Kockelman, K. Preparing a nation for autonomous vehicles: Opportunities, barriers and policy recommendations. Transp. Res. A Policy 2015, 77, 167–181. [Google Scholar] [CrossRef]
- Stephens, T.; Gonder, J.; Chen, Y.; Lin, Z.; Liu, C.; Gohlke, D. Estimated Bounds and Important Factors for Fuel Use and Consumer Costs of Connected and Automated Vehicles; National Renewable Energy Lab. (NREL): Golden, CO, USA, 2016.
- Wadud, Z.; MacKenzie, D.; Leiby, P. Help or hindrance? The travel, energy and carbon impacts of highly automated vehicles. Transp. Res. A Policy 2016, 86, 1–18. [Google Scholar] [CrossRef] [Green Version]
- Brown, A.; Gonder, J.; Repac, B. An Analysis of Possible Energy Impacts of Automated Vehicle. In Lect N Mobil; Meyer, G., Beiker, S., Eds.; Springer Int Publishing Ag: Cham, Switzerland, 2014; pp. 137–153. [Google Scholar]
- Friedrich, B. The Effect of Autonomous Vehicles on Traffic. In Autonomous Driving: Technical, Legal and Social Aspects; Maurer, M., Gerdes, J.C., Lenz, B., Winner, H., Eds.; Springer Berlin Heidelberg: Berlin/Heidelberg, Germany, 2016; pp. 317–334. [Google Scholar] [Green Version]
- Boran, C.; Bostrom, O.; Jacobson, B.J.H.; Lie, A.; Sander, U. Saving lives with V2X versus on-board sensing systems -which will be more effective? Technology leadership brief. In Proceedings of the SAE Convergence 2012, Detroit, MI, USA, 16–17 October 2012. [Google Scholar]
- Harding, J.; Powell, G.; Yoon, R.; Fikentscher, J.; Doyle, C.; Sade, D.; Lukuc, M.; Simons, J.; Wang, J. Vehicle-to-Vehicle Communications: Readiness of V2V Technology for Application; DOT HS 812 014; National Highway Traffic Safety Administration: Washington, DC, USA, 2014.
- Rodier, C.J. Travel Effects and Associated Greenhouse Gas Emissions of Automated Vehicles; University of California, Davis: Davis, CA, USA, 2018. [Google Scholar]
- MacKenzie, D.; Wadud, Z.; Leiby, P. A first order estimate of energy impacts of automated vehicles in the United States. In Proceedings of the Transportation Research Board Annual Meeting, Washington, DC, USA, 12–16 January 2014; TRB Paper No. 14-2193. Available online: https://faculty.washington.edu/dwhm/wp-content/uploads/2016/01/MacKenzie-Wadud-Leiby-14-2193-as-submitted.pdf (accessed on 27 March 2019).
- Gucwa, M. Mobility and energy impacts of automated cars. In Proceedings of the Automated Vehicles Symposium, San Francisco, CA, USA, 14–18 July 2014. [Google Scholar]
- Talebpour, A.; Mahmassani, H.S. Influence of connected and autonomous vehicles on traffic flow stability and throughput. Transp. Res. C Emerg. 2016, 71, 143–163. [Google Scholar] [CrossRef]
- SAE On-Road Automated Vehicle Standards Committee. Taxonomy and Definitions for Terms Related to Driving Automation Systems for On-Road Motor Vehicles; SAE International: Warrendale, PA, USA, 2018; Available online: https://saemobilus.sae.org/content/j3016_201806 (accessed on 27 March 2019).
- Lu, Z.; Zhou, Y.; Cai, H.; Wang, M.; He, X.; Przesmitzki, S. China Vehicle Fleet Model: Estimation of Vehicle Stocks, Usage, Emissions, and Energy Use-Model Description, Technical Documentation, and User Guide; Argonne National Lab. (ANL): Argonne, IL, USA, 2018.
- He, N.; Zhao, S.C. Study on Urban Road Impedance Function Model—A Case Study of Dalian City. J. Highw. Transp. Res. Dev. 2014, 31, 104–108. [Google Scholar] [CrossRef]
- United States. Bureau of Public Roads. Traffic Assignment Manual for Application with a Large, High Speed Computer; U.S. Dept. of Commerce, Bureau of Public Roads, Office of Planning, Urban Planning Division: Washington, DC, USA, 1964. Available online: https://books.google.com/books/about/ Traffic_assignment_manual_for_applicatio.html?id=gkNZAAAAMAAJ (accessed on 27 March 2019).
- Liu, F.Q.; Zhao, F.Q.; Liu, Z.W.; Hao, H. China’s Electric Vehicle Deployment: Energy and Greenhouse Gas Emission Impacts. Energies 2018, 11, 3353. [Google Scholar] [CrossRef]
- AUTOTEC. A Study on Intelligent Vehicle Technology Development Trend and Market Response; China Automotive Technology & Research Center: Beijing, China, 2016. [Google Scholar]
- Huo, H.; Zhang, Q.; He, K.B.; Yao, Z.L.; Wang, M.C. Vehicle-use intensity in China: Current status and future trend. Energy Policy 2012, 43, 6–16. [Google Scholar] [CrossRef]
- Shoup, D.C. Cruising for parking. Transp. Policy 2006, 13, 479–486. [Google Scholar] [CrossRef]
- Harper, C.D.; Hendrickson, C.T.; Mangones, S.; Samaras, C. Estimating potential increases in travel with autonomous vehicles for the non-driving, elderly and people with travel-restrictive medical conditions. Transp. Res. Part. C 2016, 72, 1–9. [Google Scholar] [CrossRef]
- Fagnant, D.J.; Kockelman, K.M. Dynamic ride-sharing and fleet sizing for a system of shared autonomous vehicles in Austin, Texas. Transportation 2018, 45, 143–158. [Google Scholar] [CrossRef]
- Beijing Transport Institute. Beijing Transportation Annual Report; Beijing Transport Institute: Beijing, China, 2018; Available online: http://www.bjtrc.org.cn/Show/download/id/18/at/0.html (accessed on 27 March 2019).
- Kulmala, R. Ex-ante assessment of the safety effects of intelligent transport systems. Accid. Anal. Prev. 2010, 42, 1359–1369. [Google Scholar] [CrossRef]
- The Ministry of Public Security. Annual Statistical Report on Road Traffic Accidents 2016; Traffic Management Research Institute of the Ministry of Public Security: Beijing, China, 2017. [Google Scholar]
- National Highway Traffic Safety Administration. Fatality Analysis Reporting System (FARS) Encyclopedia. Available online: https://www-fars.nhtsa.dot.gov/Main/index.aspx (accessed on 27 March 2019).
- Wilmink, I.; Janssen, W.; Jonkers, E.; Malone, K.; van Noort, M.; Klunder, G.; Rämä, P.; Sihvola, N.; Kulmala, R.; Schirokoff, A.; et al. Impact Assessment of Intelligent Vehicle Safety Systems; Netherland’s Organization for Applied Scientific Research: Delft, The Netherlands, 2008. [Google Scholar]
- Louwerse, W.J.R.; Hoogendoorn, S.P. ADAS safety impacts on rural and urban highways. In Proceedings of the 2004 IEEE Intelligent Vehicles Symposium, Parma, Italy, 14–17 June 2004; pp. 887–890. [Google Scholar]
- Kusano, K.D.; Gabler, H.; Gorman, T.I. Fleetwide Safety Benefits of Production Forward Collision and Lane Departure Warning Systems. SAE Int. J. Passeng. Cars-Mech. Syst. 2014, 7, 514–527. [Google Scholar] [CrossRef]
- Schwesinger, U.; Bürki, M.; Timpner, J.; Rottmann, S.; Wolf, L.; Paz, L.M.; Grimmett, H.; Posner, I.; Newman, P.; Häne, C.; et al. Automated valet parking and charging for e-mobility. In Proceedings of the 2016 IEEE Intelligent Vehicles Symposium (IV), Gothenburg, Sweden, 19–22 June 2016; pp. 157–164. Available online: https://ieeexplore.ieee.org/document/7535380 (accessed on 27 March 2019).
- Kaplan, S.; Guvensan, M.A.; Yavuz, A.G.; Karalurt, Y. Driver Behavior Analysis for Safe Driving: A Survey. IEEE Trans. Intell. Transp. Syst. 2015, 16, 3017–3032. [Google Scholar] [CrossRef]
- Mittal, A.; Kumar, K.; Dhamija, S.; Kaur, M. Head movement-based driver drowsiness detection: A review of state-of-art techniques. In Proceedings of the 2nd IEEE International Conference on Engineering and Technology, ICETECH 2016, Coimbatore, India, 17–18 March 2016; pp. 903–908. [Google Scholar]
- Mathias, M.; Timofte, R.; Benenson, R.; Gool, L.V. Traffic sign recognition—How far are we from the solution? In Proceedings of the 2013 International Joint Conference on Neural Networks (IJCNN), Dallas, TX, USA, 4–9 August 2013; pp. 1–8. Available online: https://ieeexplore.ieee.org/document/6707049 (accessed on 27 March 2019).
- Malone, K.; Hogema, J.; Innamaa, S.; Hausberger, S.; Dippold, M.; van Noort, M.; de Feijter, E.; Rämä, P.; Aittoniemi, E.; Benz, T.; et al. Impact Assessment and User Perception of Cooperative Systems: DRIVE C2X; DRIVE C2X Deliverables; D11.4; European Commission: Sindelfingen, Germany, 2014; Available online: https://www.eict.de/fileadmin/redakteure/Projekte/DriveC2X/Deliverables/DRIVE_C2X_D11.4_Impact_Assessment_v1.0_full_version-1.pdf (accessed on 27 March 2019).
- McMahon, K.; Dahdah, S. The True Cost of Road Crashes: Valuing Life and the Cost of a Serious Injury; International Road Assessment Programme (iRAP): Hampshire, UK, 2008. [Google Scholar]
- Wijnen, W.; Stipdonk, H. Social costs of road crashes: An international analysis. Accid. Anal. Prev. 2016, 94, 97–106. [Google Scholar] [CrossRef] [PubMed]
- Qin, X.Z.; Li, L.X.; Liu, Y.Y. The value of life and its regional difference in China. China Agric. Econ. Rev. 2013, 5, 373–390. [Google Scholar] [CrossRef]
- Office of the Secretary of Transportation. Revised Departmental Guidance 2016: Treatment of the Value of Preventing Fatalities and Injuries in Preparing Economic Analyses; U.S. Department of Transportation: Washington, DC, USA, 2016.
- Huber, M.J. Estimation of Passenger-Car Equivalents of Trucks in Traffic Stream; Transportation Research Board: Washington, DC, USA, 1982; Available online: http://onlinepubs.trb.org/onlinepubs/trr/1982/869/869-010.pdf (accessed on 27 March 2019).
- Calvert, S.C.; Schakel, W.J.; van Lint, J.W.C. Will Automated Vehicles Negatively Impact Traffic Flow? J. Adv. Transp. 2017, 2017, 3082781. [Google Scholar] [CrossRef]
- Le Vine, S.; Zolfaghari, A.; Polak, J. Autonomous cars: The tension between occupant experience and intersection capacity. Transp. Res. C Emerg. 2015, 52, 1–14. [Google Scholar] [CrossRef]
- Litman, T. Transportation Cost and Benefit Analysis Techniques, Estimates and Implications; Victoria Transport Policy Institute: Victoria, BC, Canada, 2016; Available online: https://www.vtpi.org/tca/ (accessed on 27 March 2019).
- Gawron, J.H.; Keoleian, G.A.; De Kleine, R.D.; Wallington, T.J.; Kim, H.C. Life Cycle Assessment of Connected and Automated Vehicles: Sensing and Computing Subsystem and Vehicle Level Effects. Environ. Sci. Technol. 2018, 52, 3249–3256. [Google Scholar] [CrossRef]
- Hao, H.; Mu, Z.X.; Liu, Z.W.; Zhao, F.Q. Abating transport GHG emissions by hydrogen fuel cell vehicles: Chances for the developing world. Front. Energy 2018, 12, 466–480. [Google Scholar] [CrossRef]
- Verma, A.; Kumar, A. Life cycle assessment of hydrogen production from underground coal gasification. Appl. Energy 2015, 147, 556–568. [Google Scholar] [CrossRef]
- Turconi, R.; Boldrin, A.; Astrup, T. Life cycle assessment (LCA) of electricity generation technologies: Overview, comparability and limitations. Renew. Sustain. Energy Rev. 2013, 28, 555–565. [Google Scholar] [CrossRef] [Green Version]
- Luo, J.G.; He, B.L.; Xing, Y.T. Research on China’s Power Industry Development Roadmap. Energy China 2014, 36, 31–35. [Google Scholar] [CrossRef]
- Hao, X.; Wang, H.W.; Li, W.F.; Ouyang, M.G. Analysis of PHEV CO2 Emission Based on China’s Grid Structure and Travelling Pattern in Mega Cities. Environ. Sci. 2019, 14, 1705–1714. [Google Scholar] [CrossRef]
- Parry, I. Countries Are Signing up for Sizeable Carbon Prices. Available online: https://blogs.imf.org/2016/04/21/countries-are-signing-up-for-sizeable-carbon-prices/ (accessed on 5 June 2019).
- Bosch, P.M.; Becker, F.; Becker, H.; Axhausen, K.W. Cost-based analysis of autonomous mobility services. Transp. Policy 2018, 64, 76–91. [Google Scholar] [CrossRef]
- Viereckl, R.; Hoppe, S.; Koster, A.; Pohlmann, A.; Ahlemann, D.; Bühnen, T.; Seyfferth, J. Digital Auto Report; PwC Strategy & (Germany) GmbH: Stuttgart, Germany, 2017. [Google Scholar]
- China Intelligent Manufacturing System Integrator Consortium. System Solution Market. Research Report on Smart Manufacturing Industries; China Electronics Standardization Institute: Beijing, China, 2017. [Google Scholar]
- Bange, C.; Grosser, T.; Janoschek, N. Big Data Use Cases—Getting Real on Data Monetization; Business Application Research Center: Würzburg, Germany, 2015. [Google Scholar]
- Liu, X.P. A study on Chinese automobile insurance market. Shanghai Auto 2017. [Google Scholar] [CrossRef]
- Research Group of Chinese Truck Drivers. China Social Research Report: Group Characteristics and Labor Process of the Truck Drivers; Social Sciences Academic Press (China): Beijing, China, 2018. [Google Scholar]
- Daziano, R.A.; Sarrias, M.; Leard, B. Are consumers willing to pay to let cars drive for them? Analyzing response to autonomous vehicles. Transp. Res. C Emerg. 2017, 78, 150–164. [Google Scholar] [CrossRef] [Green Version]
- Archambault, P.; Delaney, M.; Yuzawa, K.; Burgstaller, S.; Tamberrino, D.; Duval, A. Monetizing the Rise of Autonomous Vehicles; The Goldman Sachs Group, Inc.: New York, NY, USA, 2015. [Google Scholar]
- Tsuchiya, H.; Kobayashi, O. Mass production cost of PEM fuel cell by learning curve. Int. J. Hydrog. Energy 2004, 29, 985–990. [Google Scholar] [CrossRef]
- Wright, J.; Garrett, J.K.; Hill, C.J.; Krueger, G.D.; Evans, J.H.; Andrews, S.; Wilson, C.K.; Rajbhandari, R.; Burkhard, B. National Connected Vehicle Field Infrastructure Footprint Analysis; FHWA-JPO-14-125; American Association of State Highway and Transportation Officials: Washington, DC, USA, 2014. [Google Scholar]
- Nguyen, T.V.; Shailesh, P.; Sudhir, B.; Kapil, G.; Jiang, L.; Wu, Z.; Malladi, D.; Li, J. A comparison of cellular vehicle-to-everything and dedicated short range communication. In Proceedings of the 2017 IEEE Vehicular Networking Conference, VNC 2017, Torino, Italy, 27–29 November 2017; pp. 101–108. [Google Scholar]
- Synced China. The Golden Age of HD Mapping for Autonomous Driving. Available online: https://medium.com/syncedreview/the-golden-age-of-hd-mapping-for-autonomous-driving-b2a2ec4c11d (accessed on 27 March 2019).
- Walz, E. lvl5 Looks to Crowdsourcing for Help Building HD Maps for Self-Driving Cars. Available online: https://www.futurecar.com/1236/lvl5-Looks-to-Crowdsourcing-for-Help-Building-HD-Maps-for-Self-Driving-Cars (accessed on 27 March 2019).
Figure 1.
The research framework. GHG: Greenhouse gas; ICV: Intelligent connected vehicles.
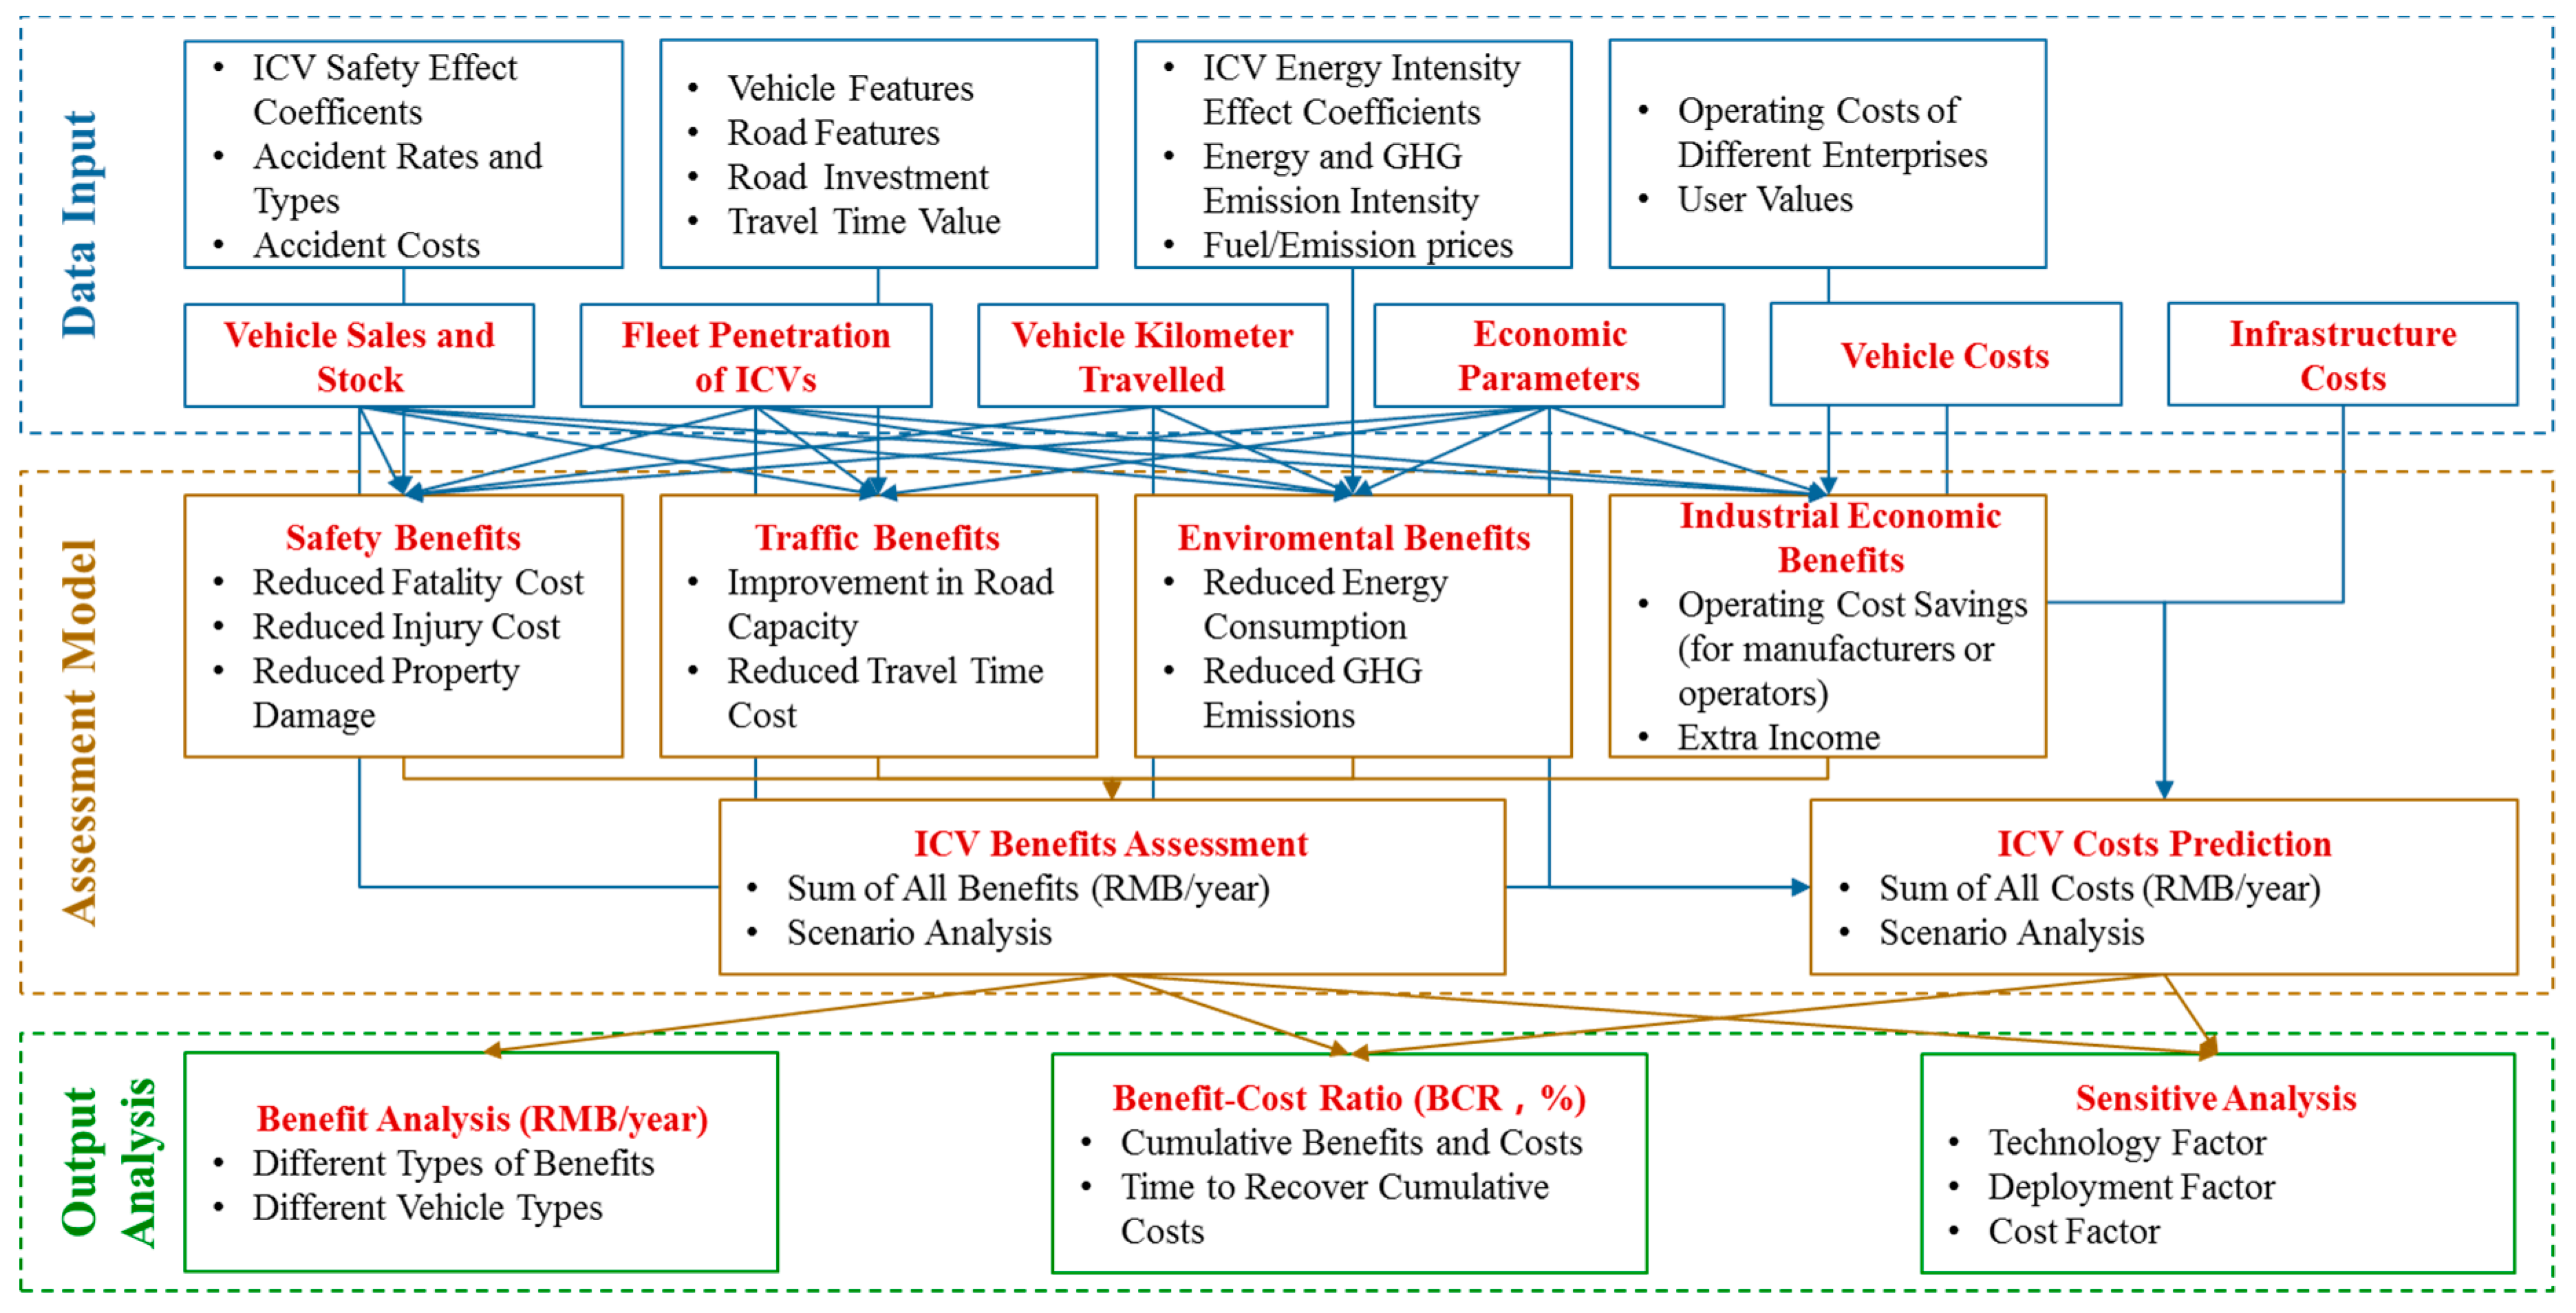
Figure 2.
Prediction of vehicle stock of different ICVs in China. CS: Car sharing.
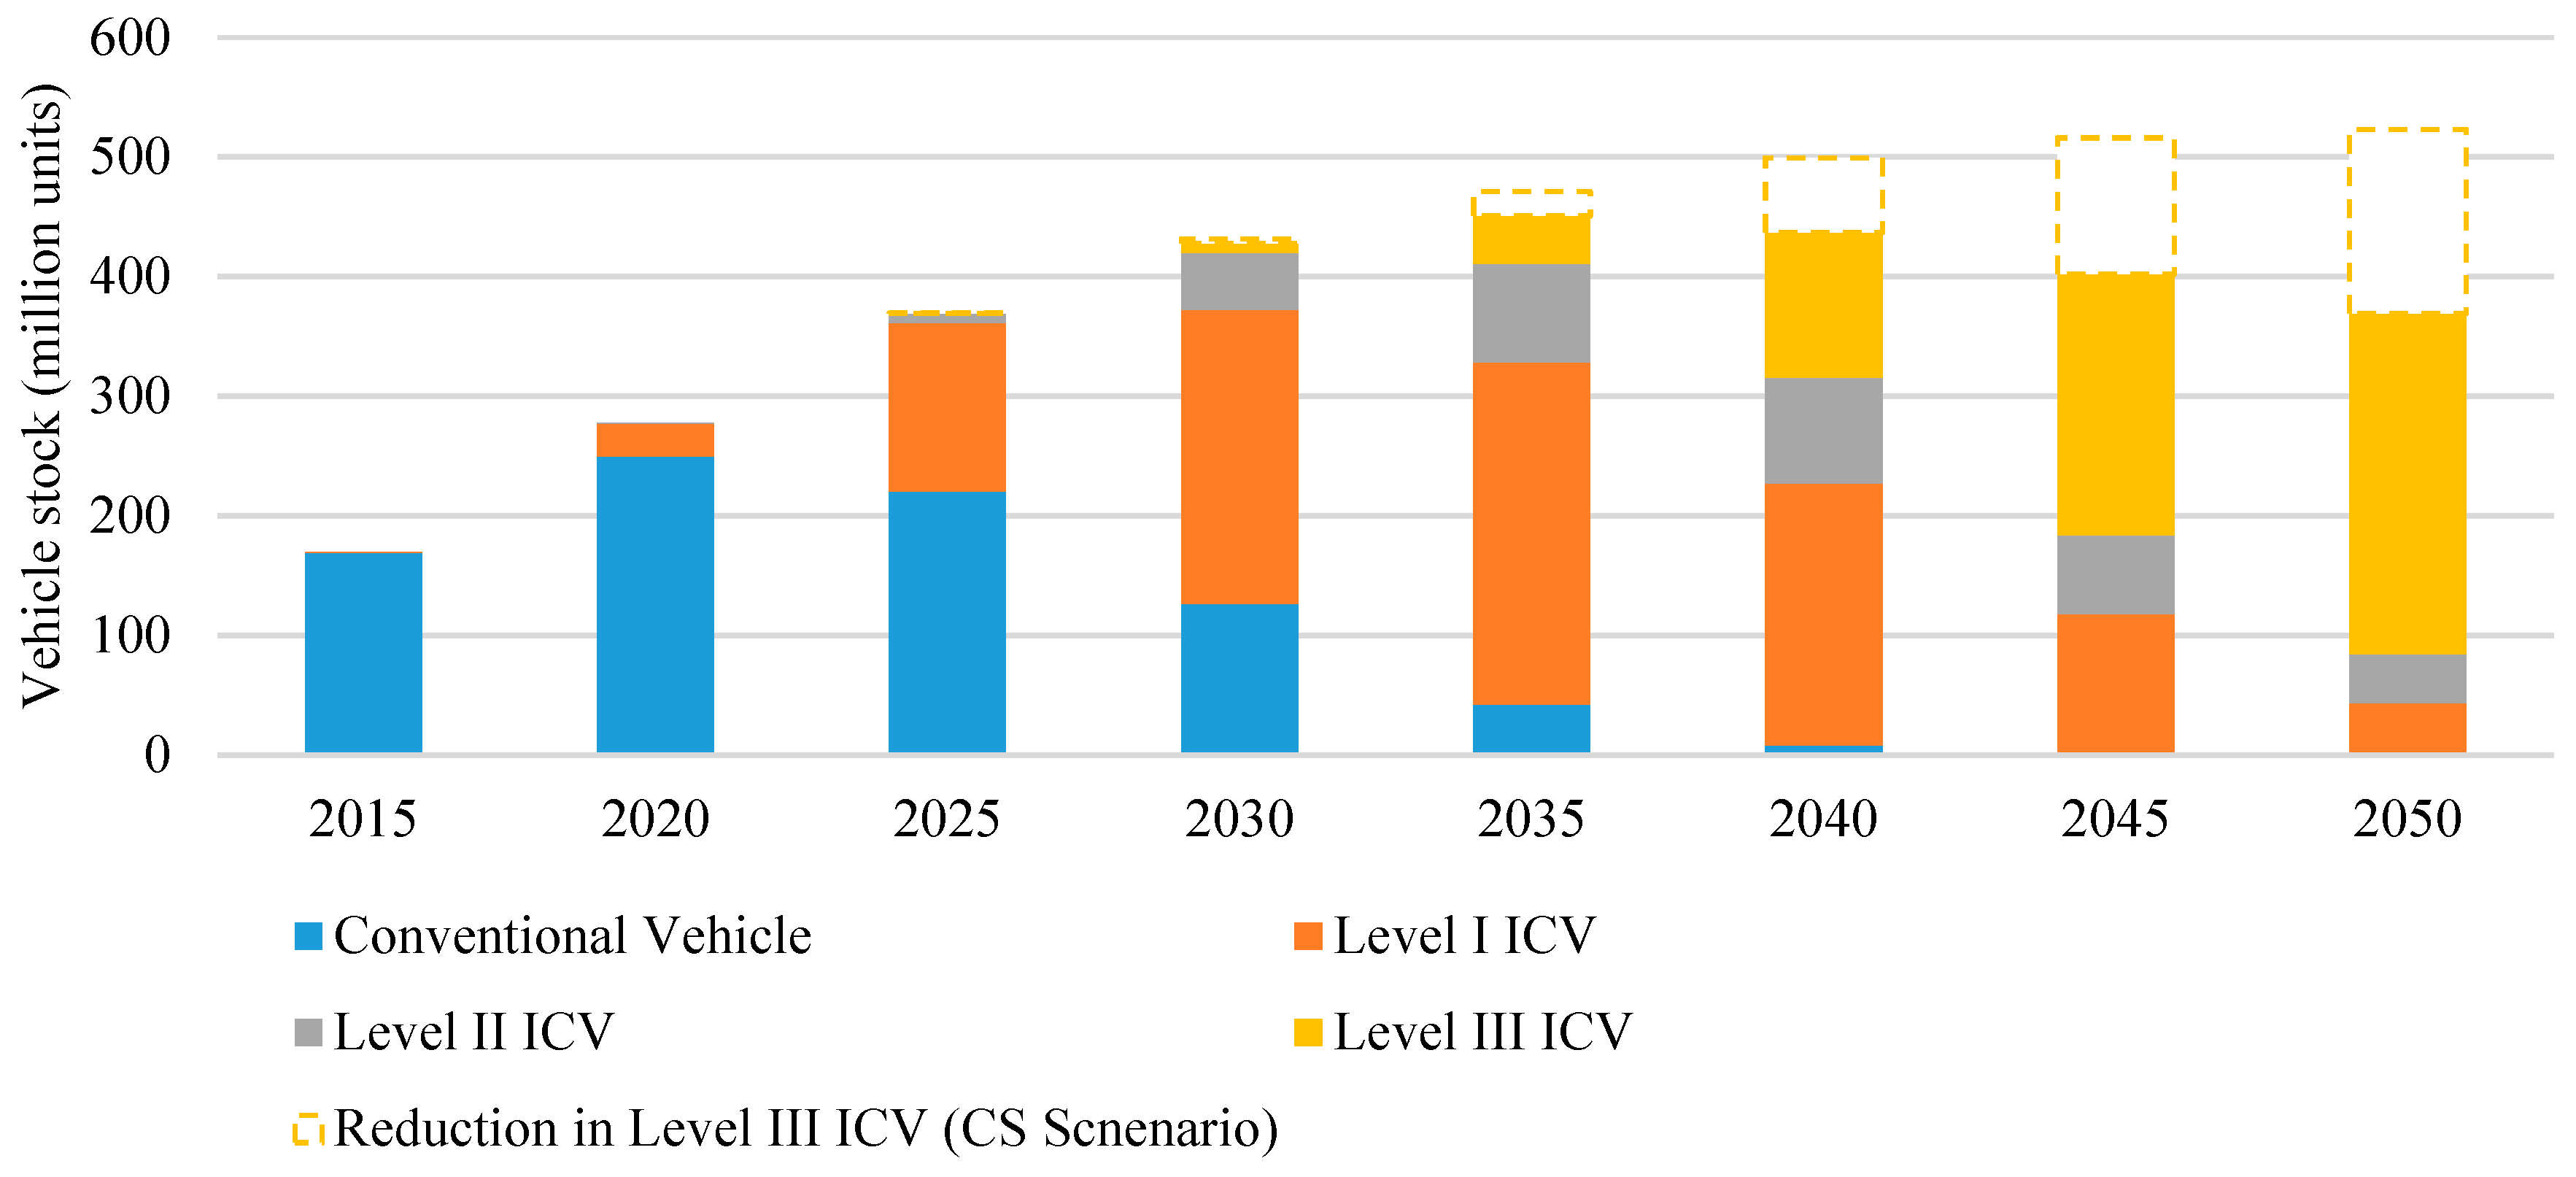
Figure 3.
Fleet VKT predictions under different scenarios: (a) Business as usual (BAU) scenario; (b) OPT scenario; (c) CON scenario; (d) all scenarios.
Figure 3.
Fleet VKT predictions under different scenarios: (a) Business as usual (BAU) scenario; (b) OPT scenario; (c) CON scenario; (d) all scenarios.
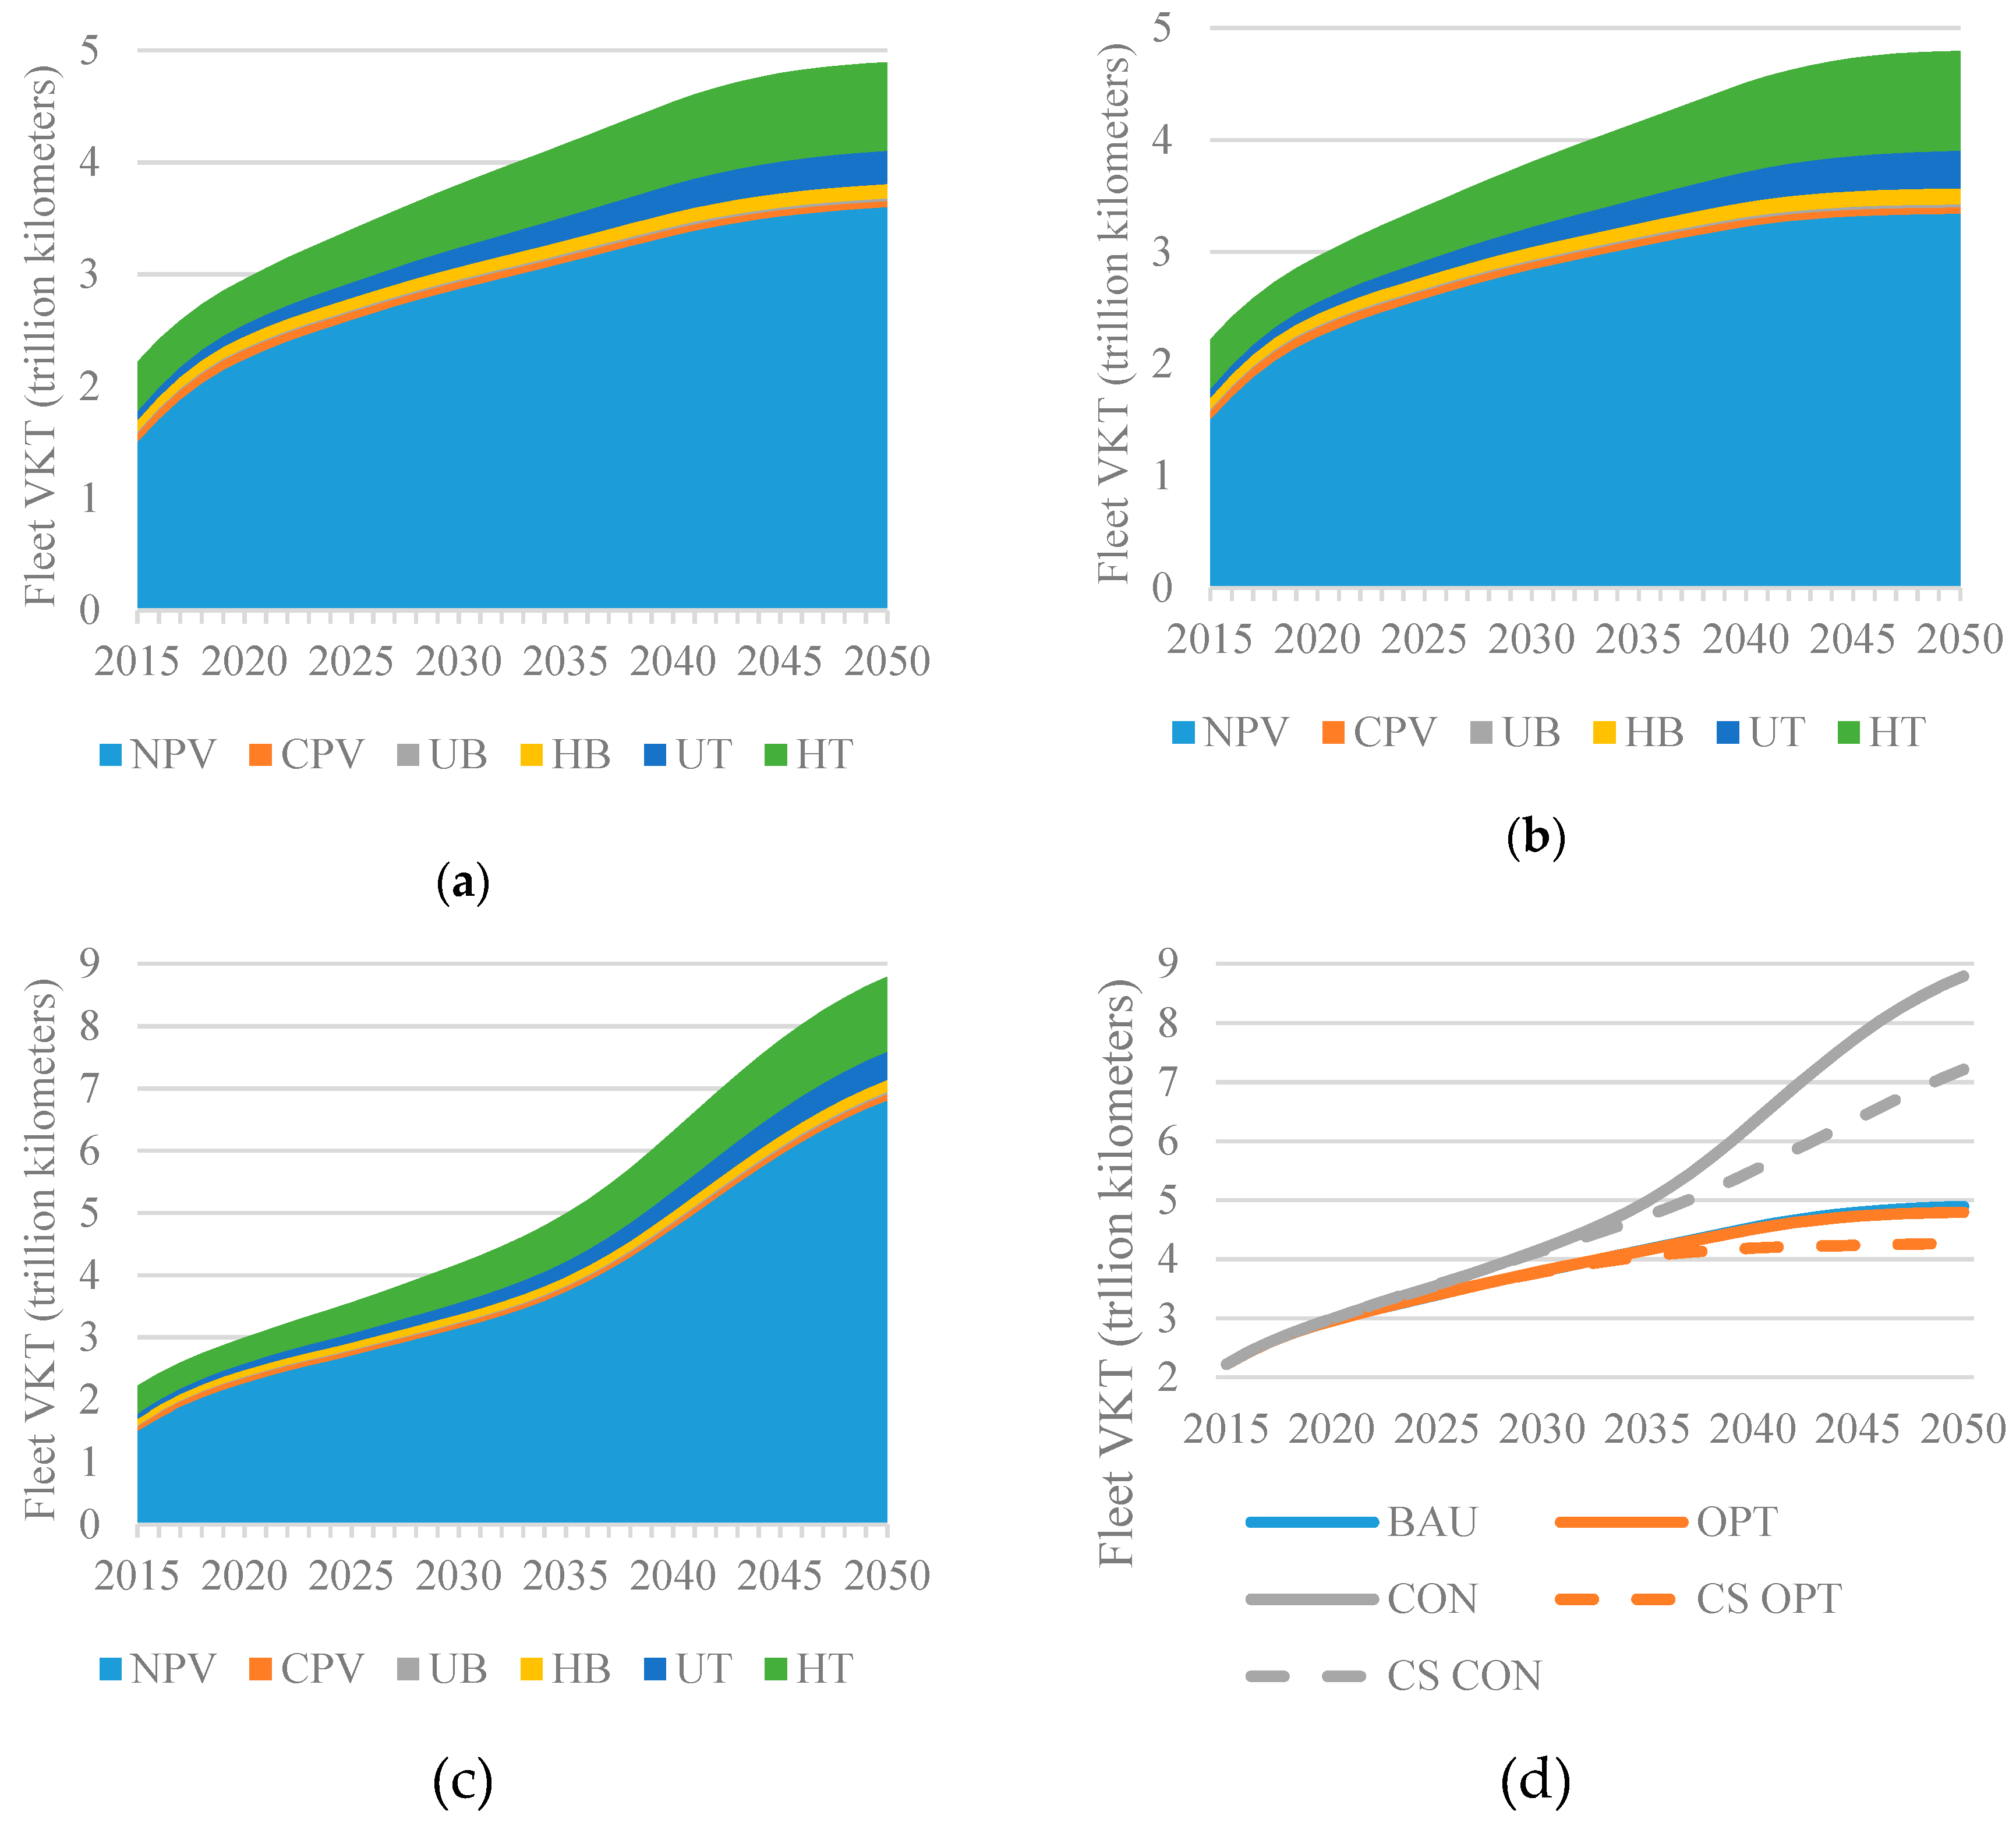
Figure 4.
The average energy consumption rate of new vehicle sales in China. AECR: Average energy consumption rate of vehicle.
Figure 4.
The average energy consumption rate of new vehicle sales in China. AECR: Average energy consumption rate of vehicle.

Figure 5.
Comprehensive benefits of ICV deployment in China: (a) OPT scenario; (b) CON scenario.

Figure 6.
Comprehensive benefits of different vehicle types: (a) Total benefit under the OPT scenario; (b) total benefit under the CON scenario; (c) benefit per vehicle under the OPT scenario; (d) benefit per vehicle under the CON scenario.
Figure 6.
Comprehensive benefits of different vehicle types: (a) Total benefit under the OPT scenario; (b) total benefit under the CON scenario; (c) benefit per vehicle under the OPT scenario; (d) benefit per vehicle under the CON scenario.
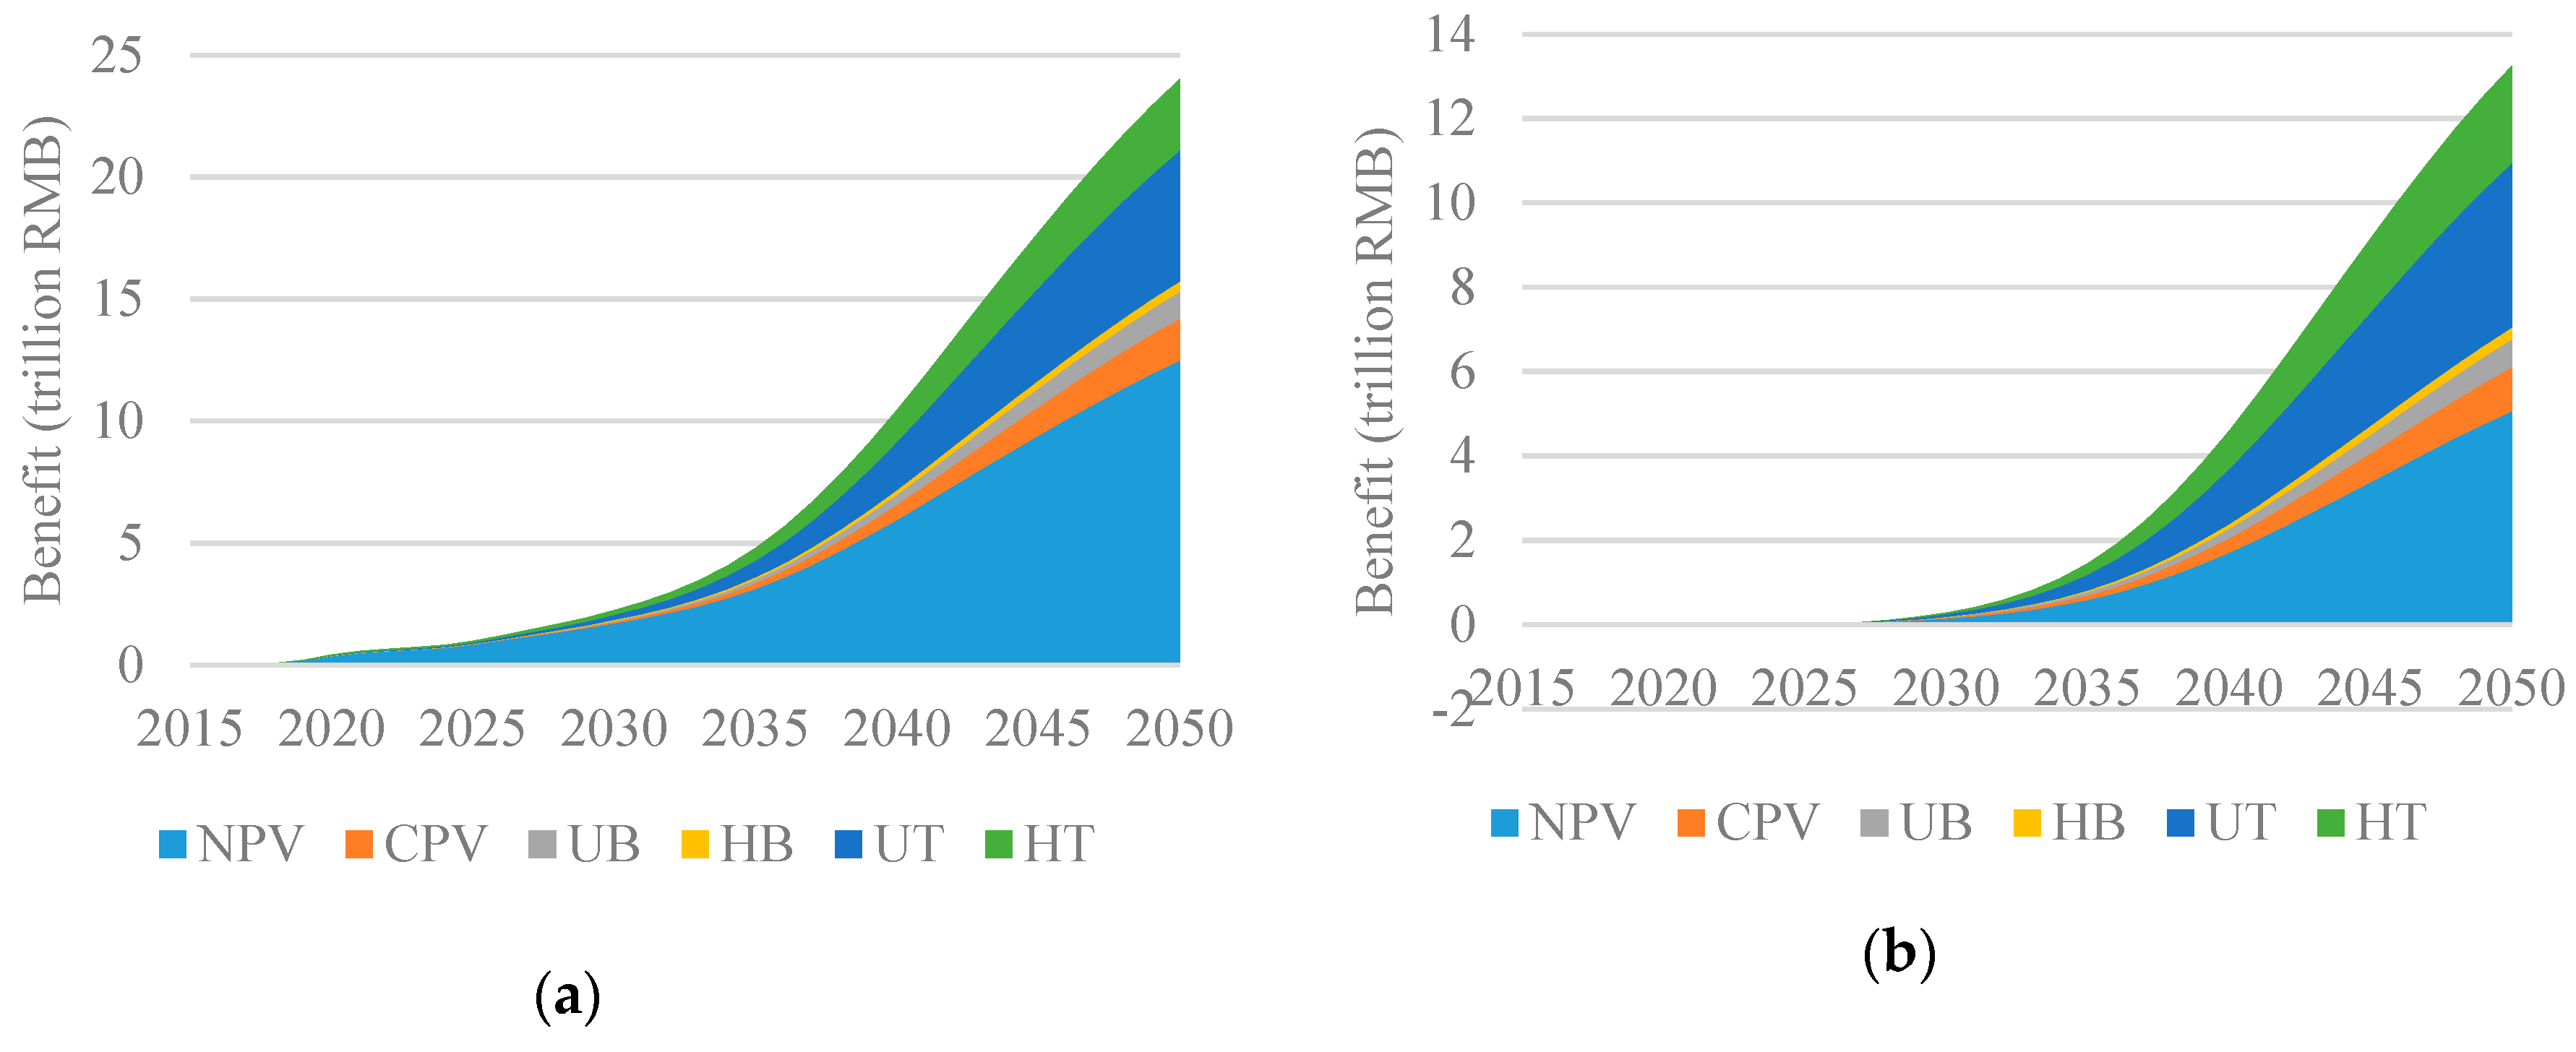

Figure 7.
Cumulative benefits and costs of ICV deployment: (a) OPT scenario; (b) CON scenario.
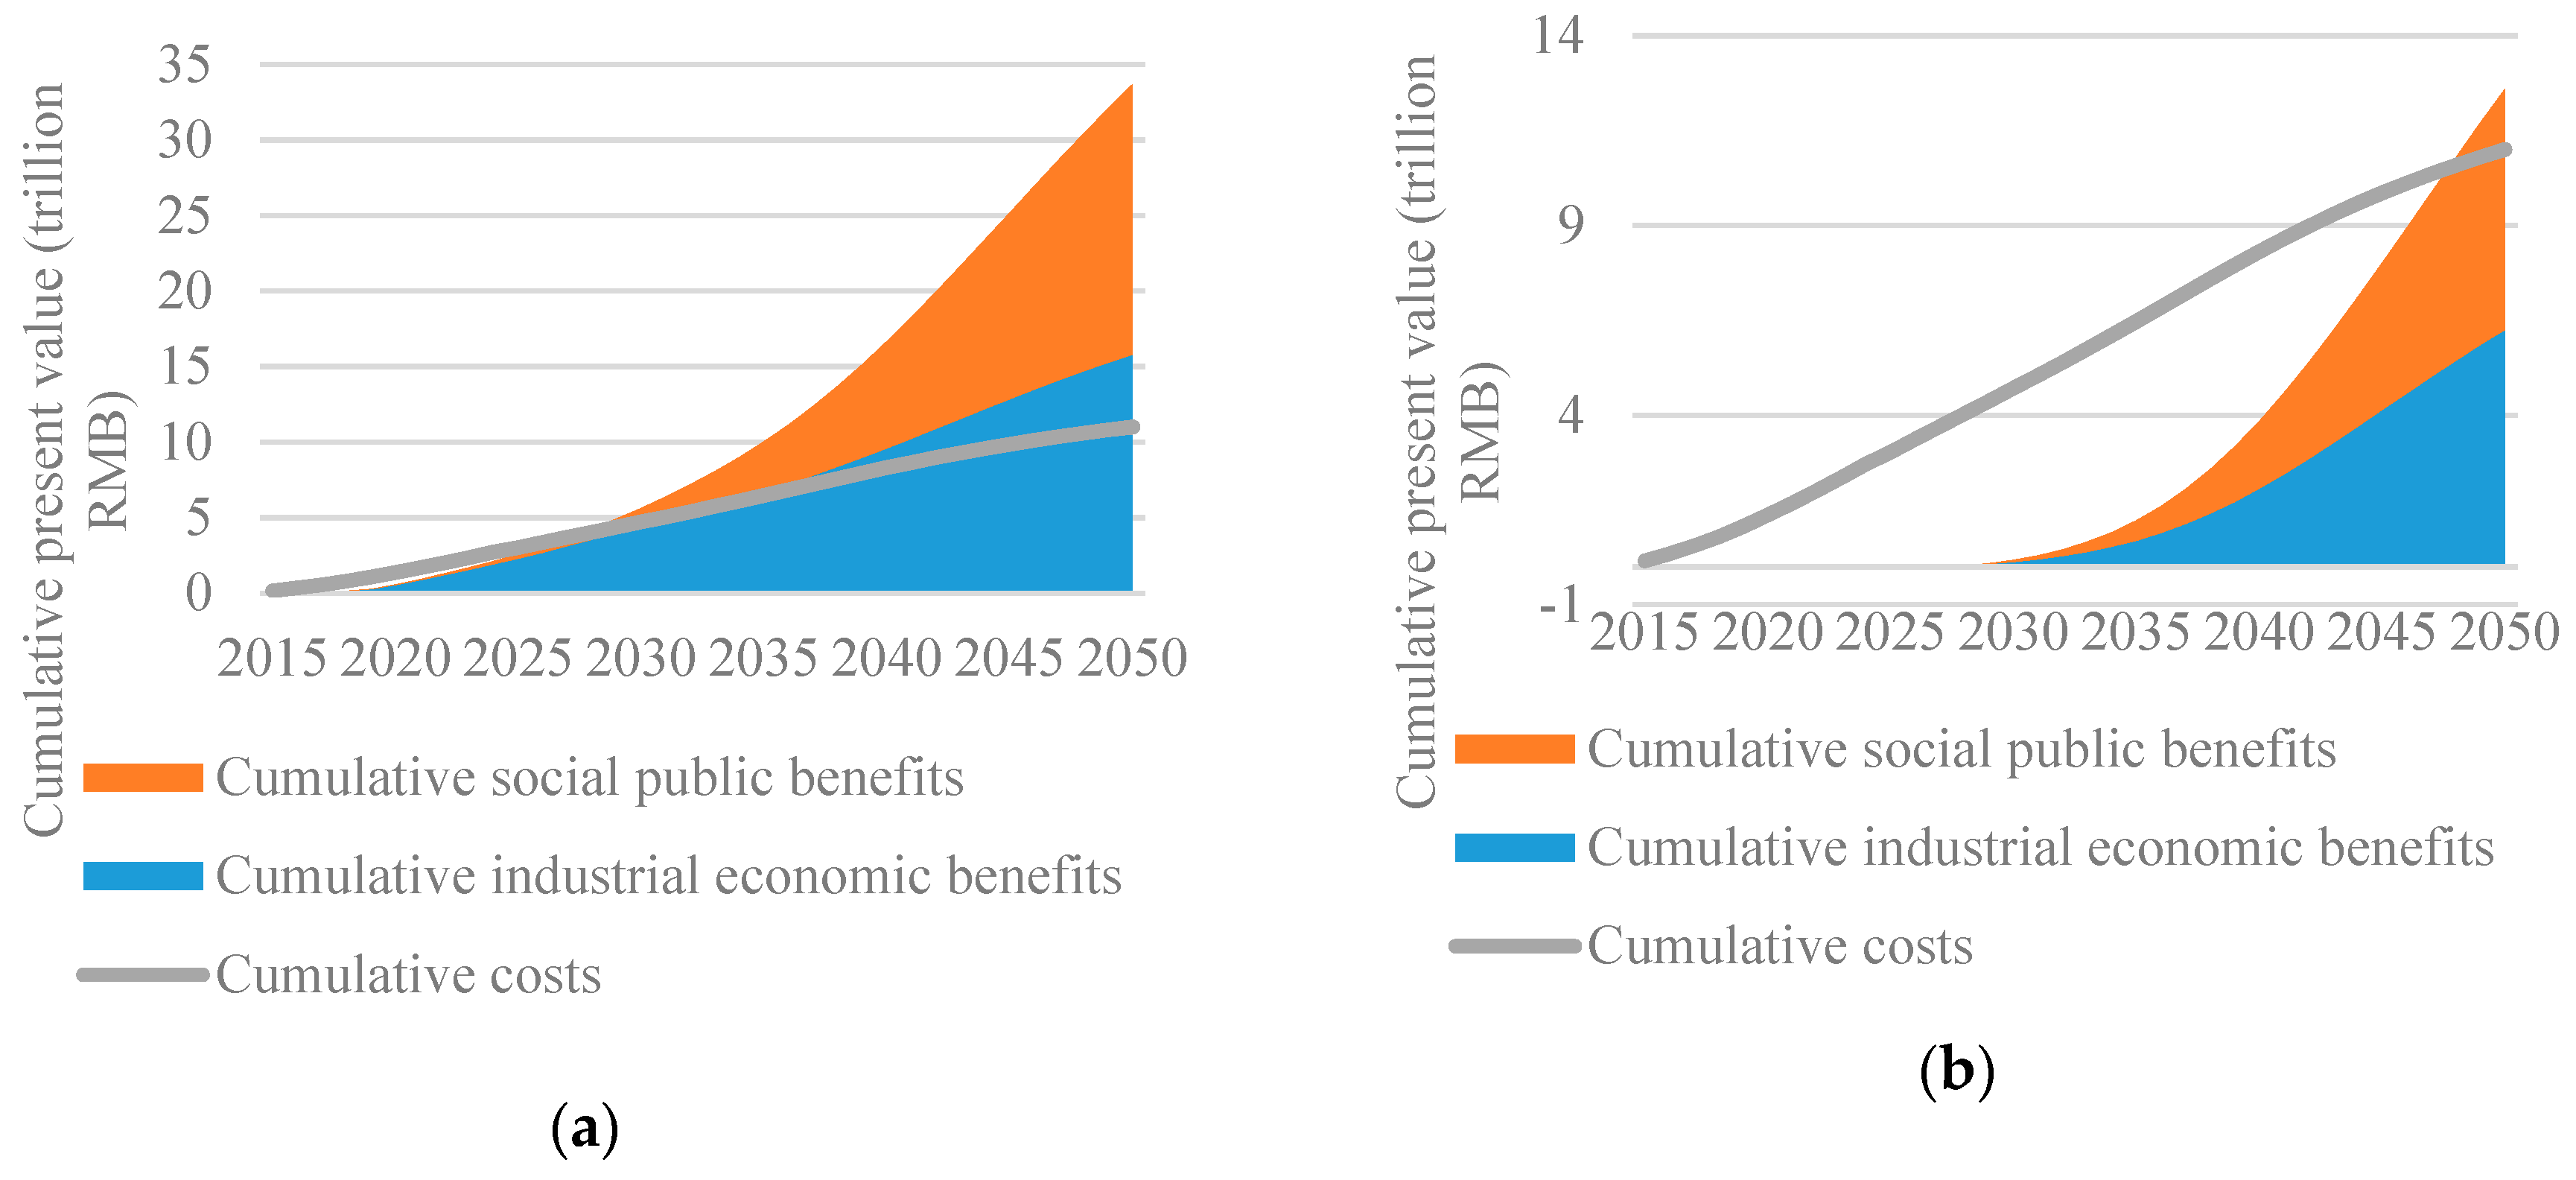
Figure 8.
Impacts of car sharing: (a) Comprehensive benefits under different scenarios; (b) cumulative benefits and costs under CS scenarios.
Figure 8.
Impacts of car sharing: (a) Comprehensive benefits under different scenarios; (b) cumulative benefits and costs under CS scenarios.
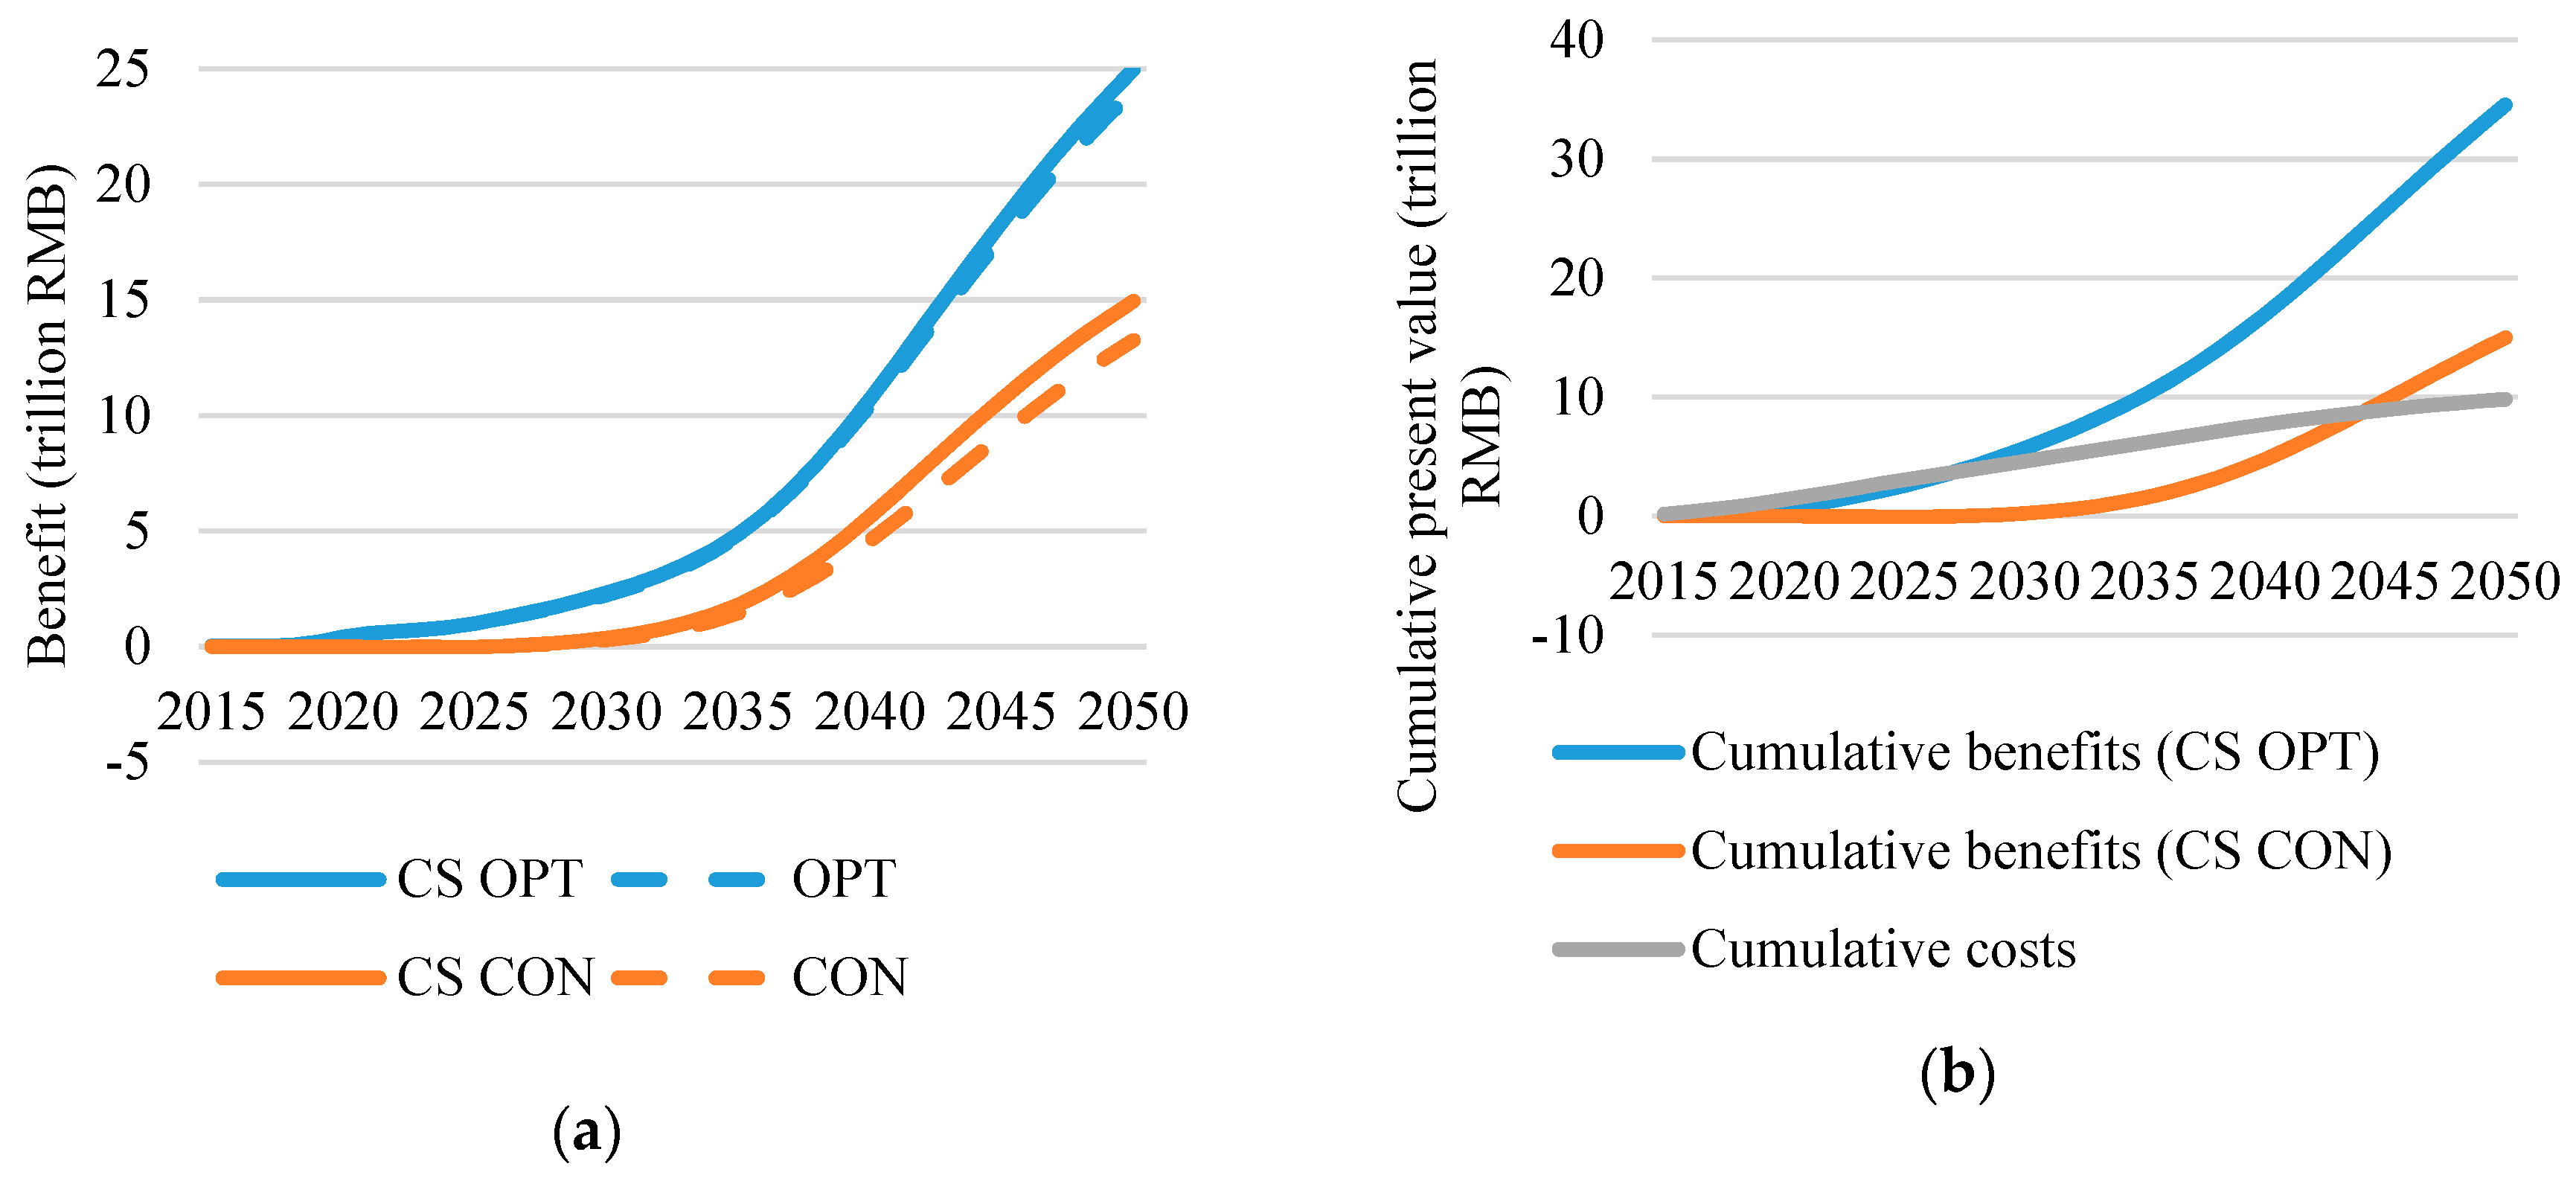
Figure 9.
Comparative CBA of different levels of ICV, with a penetration rate at 100% in 2050: (a) OPT scenario; (b) CON scenario. BCR: Benefit–cost ratio.
Figure 9.
Comparative CBA of different levels of ICV, with a penetration rate at 100% in 2050: (a) OPT scenario; (b) CON scenario. BCR: Benefit–cost ratio.
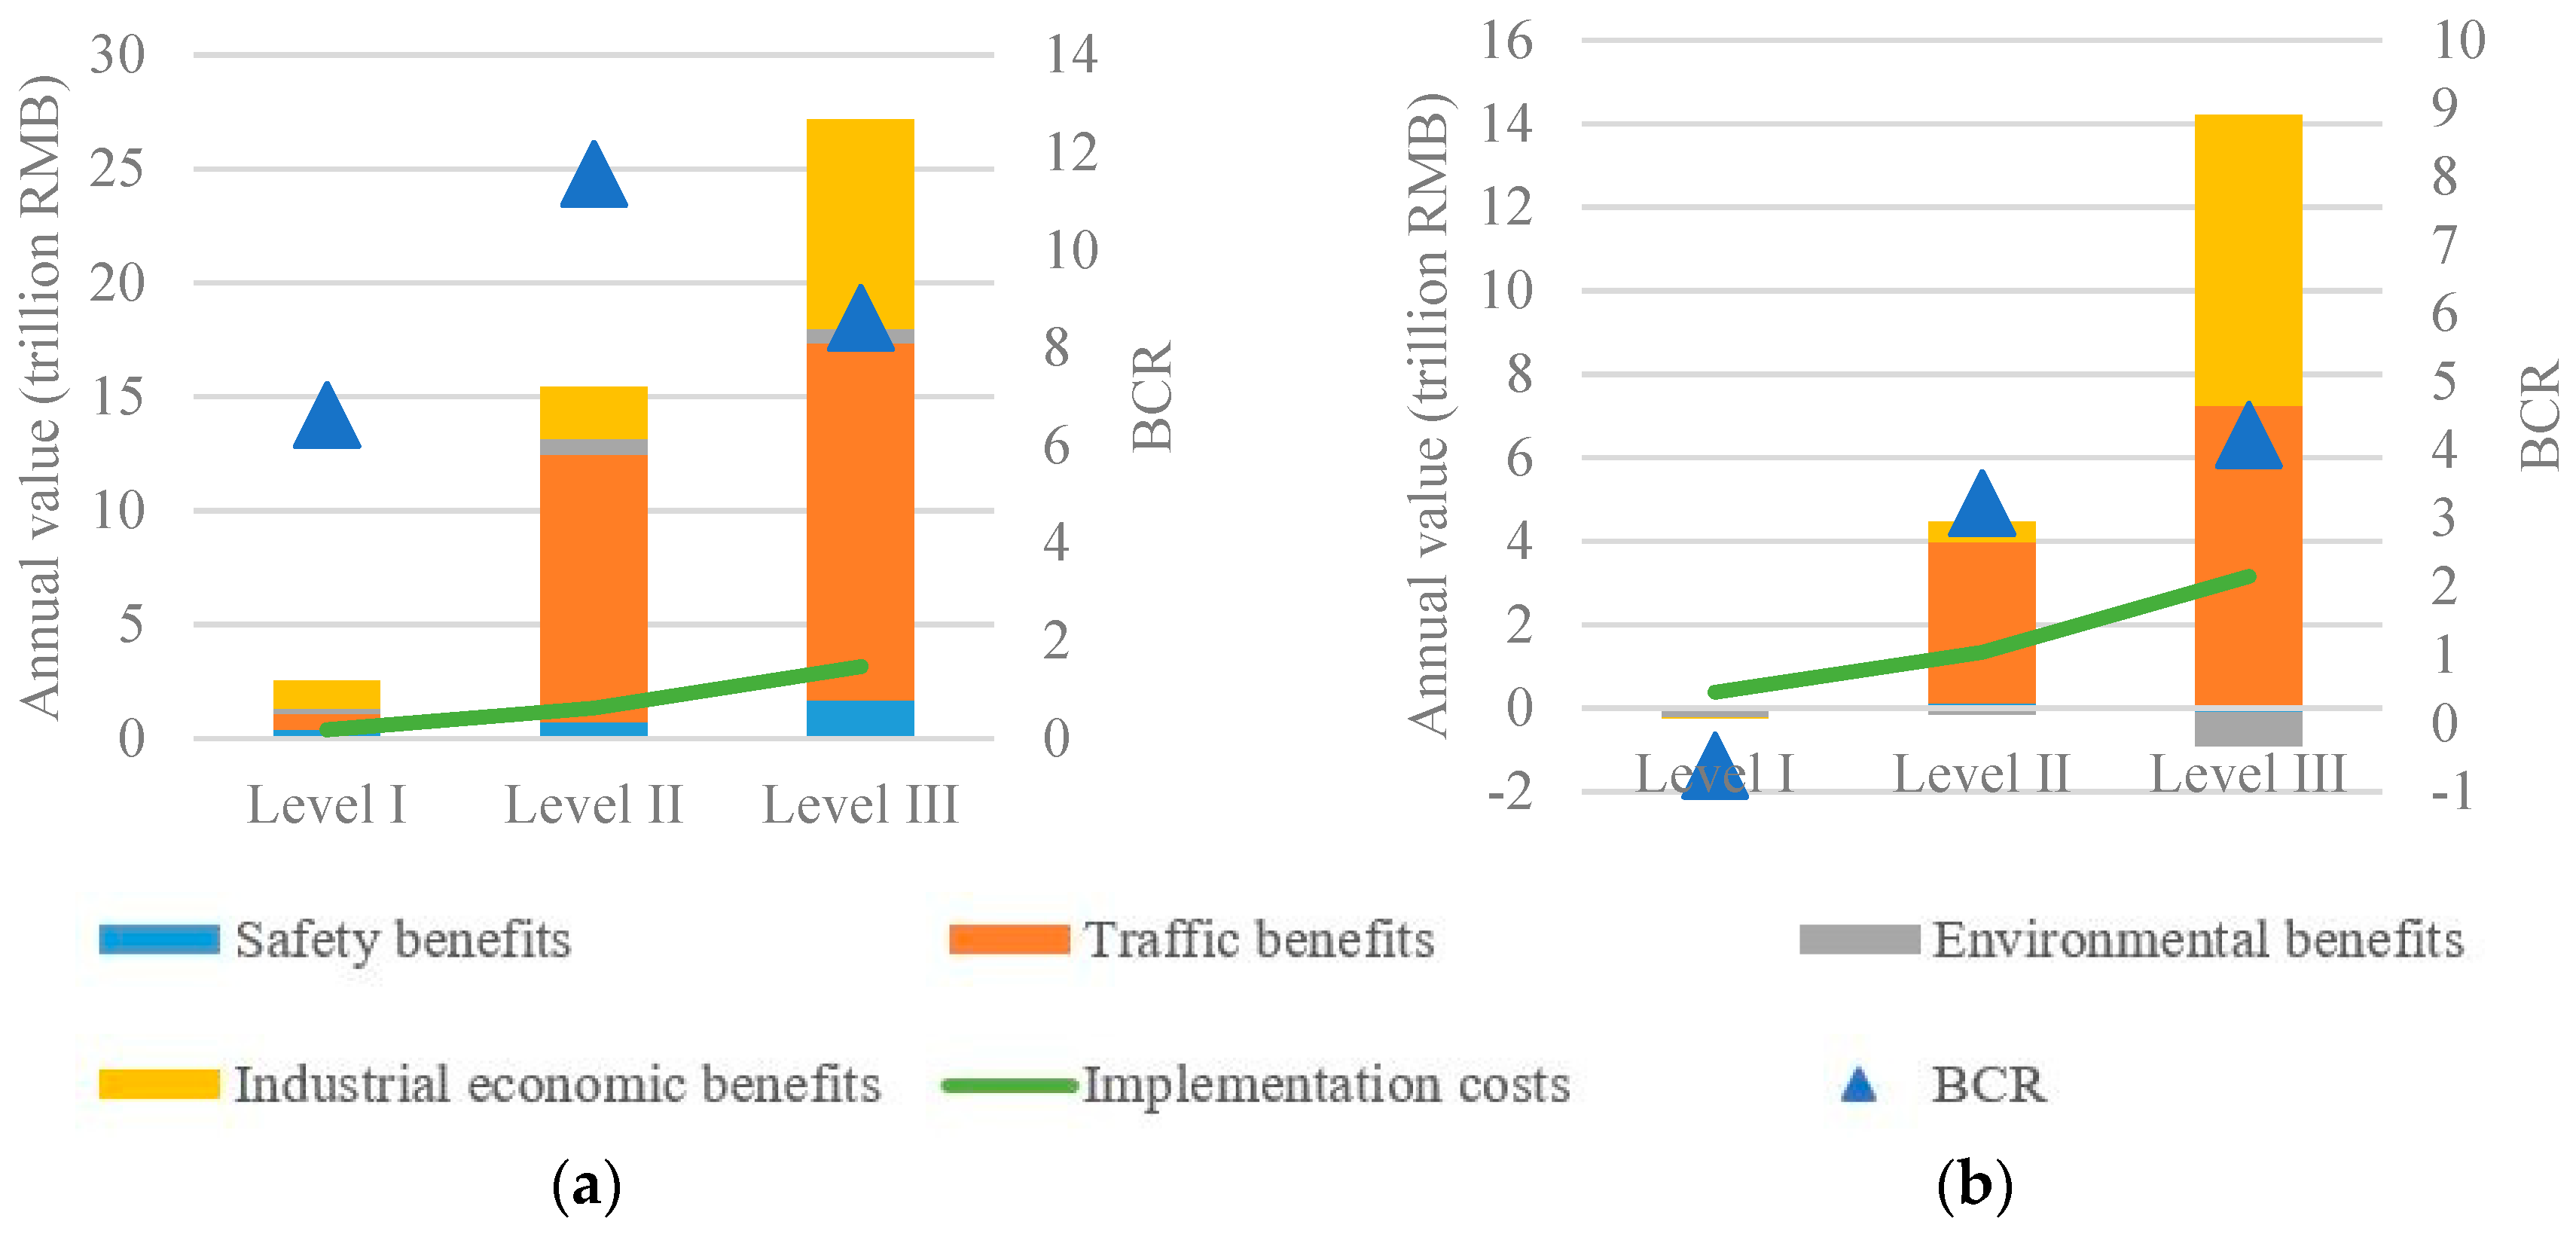
Figure 10.
(a) Sensitivity analysis of travel time value: Without considering travel time value changes; (b) Sensitivity analysis of labor cost: Without considering replacement of human drivers.
Figure 10.
(a) Sensitivity analysis of travel time value: Without considering travel time value changes; (b) Sensitivity analysis of labor cost: Without considering replacement of human drivers.

Figure 11.
Sensitive analyses of: (a) vehicle fixed cost; (b) V2I road infrastructure cost.
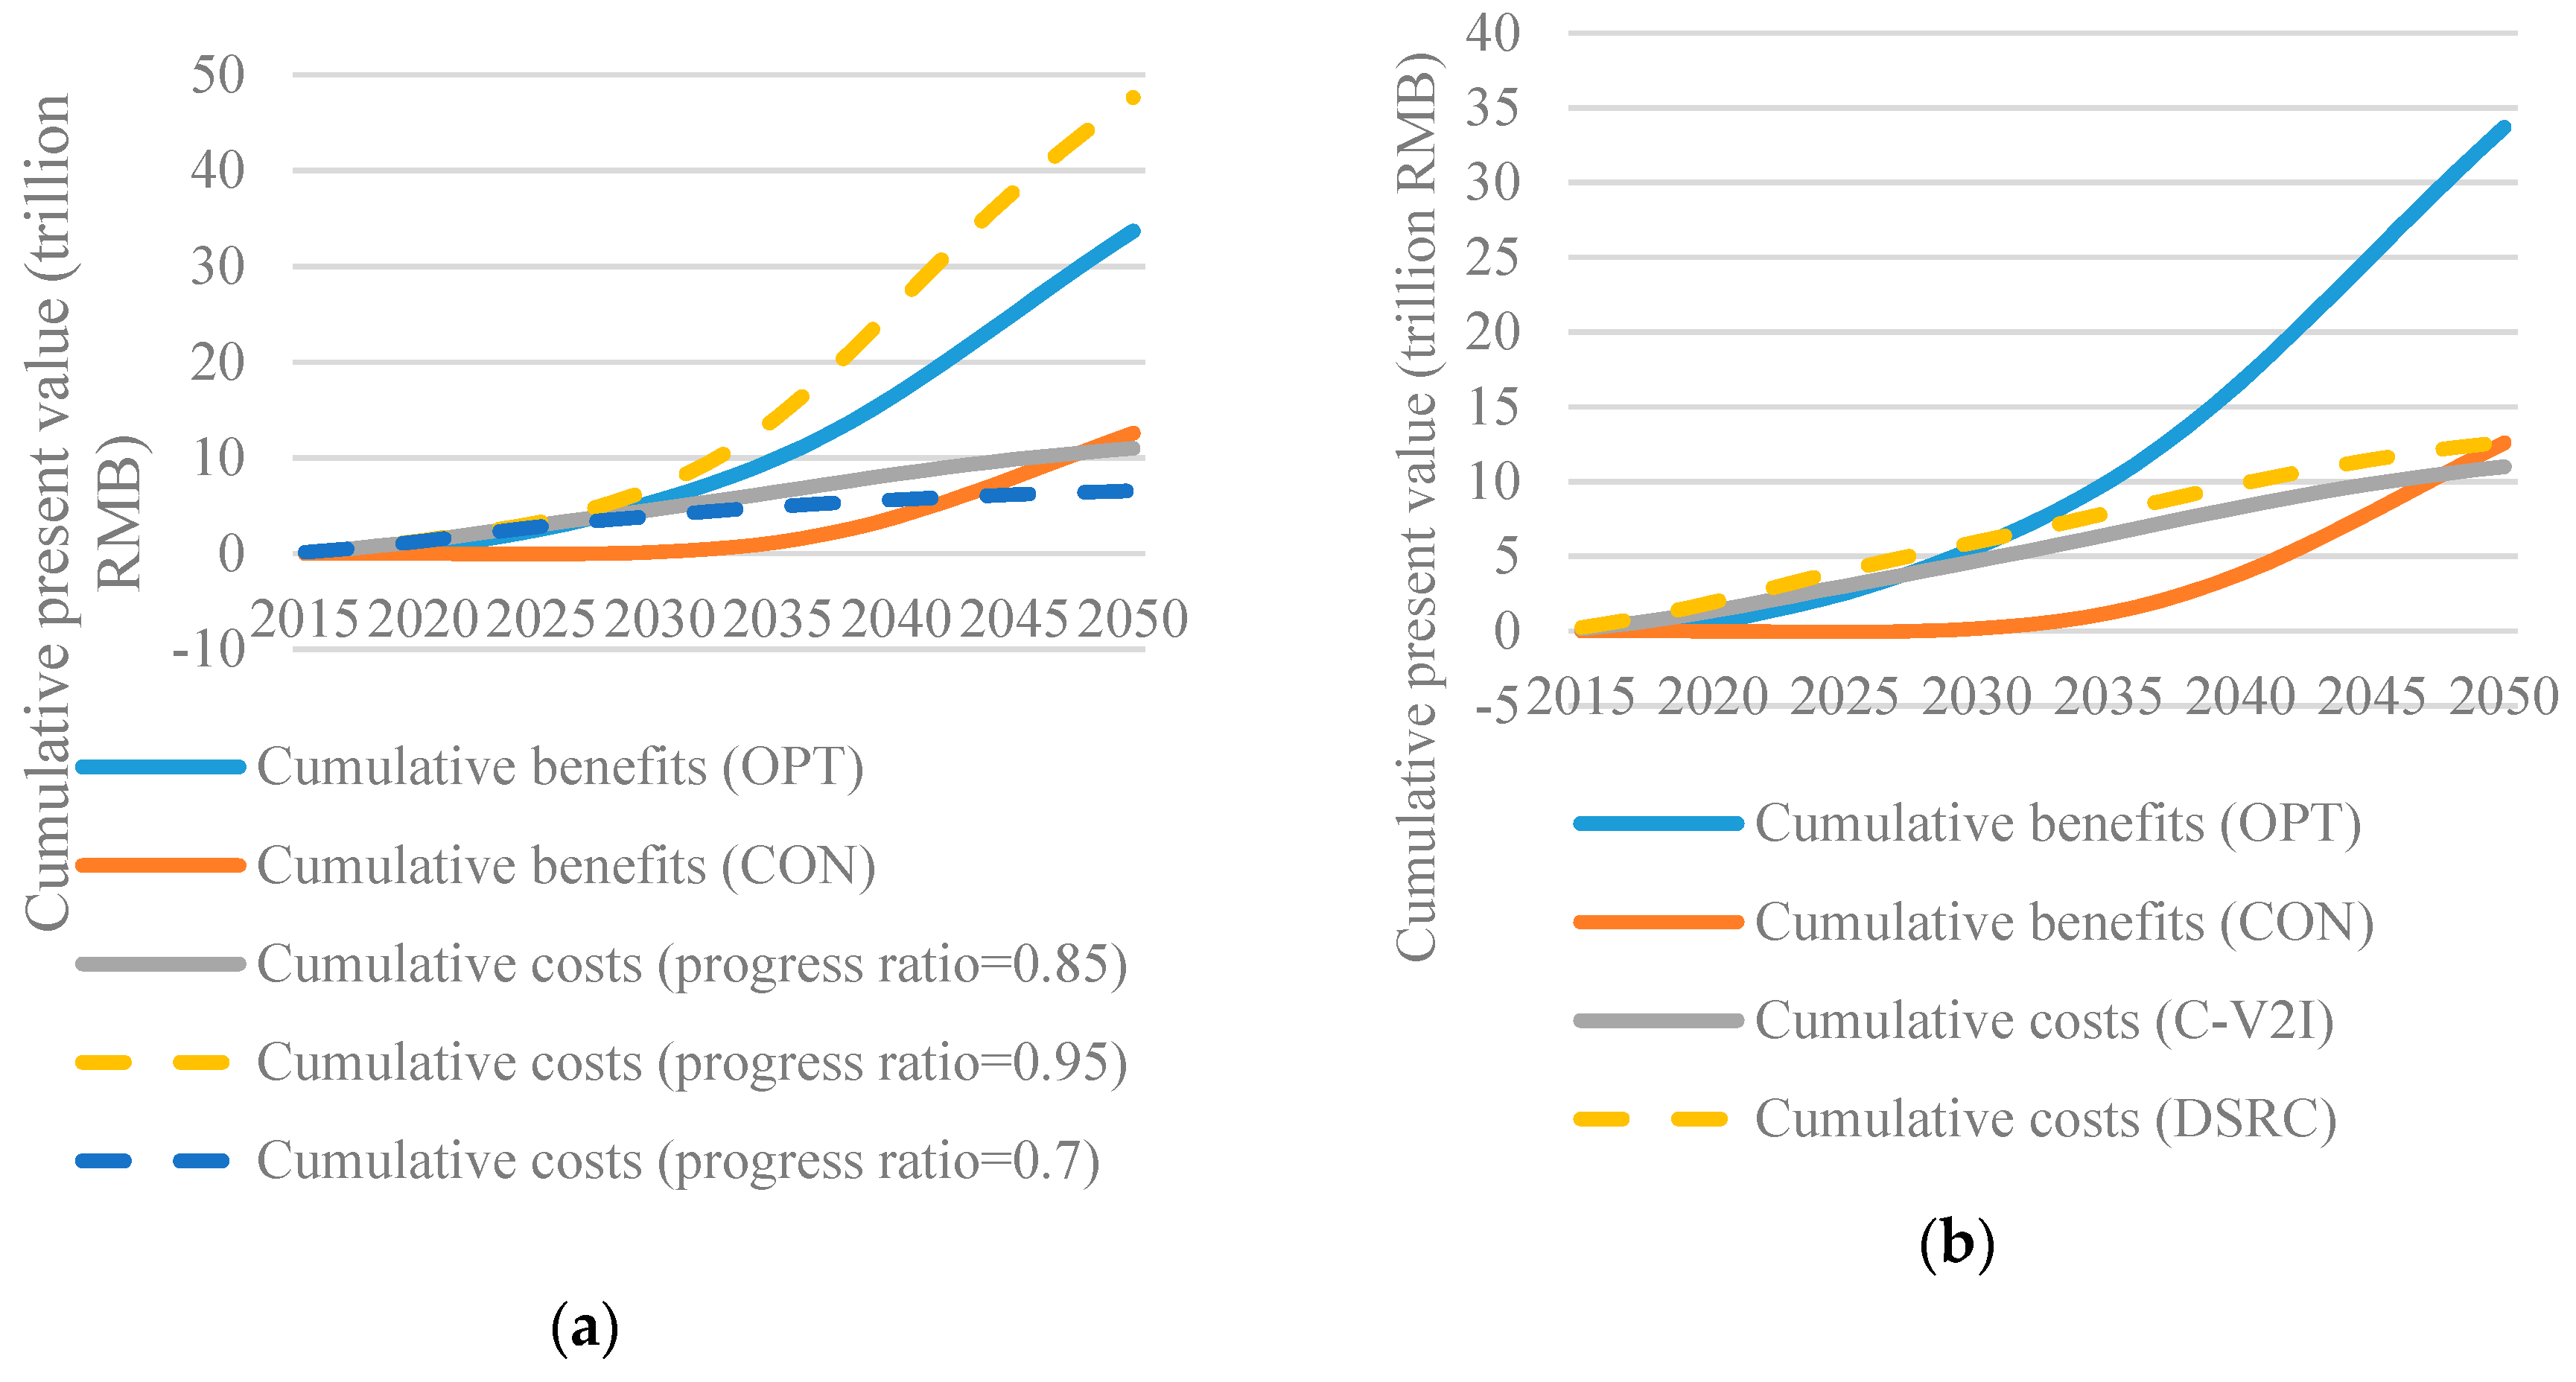

Table 1.
Different levels and functions of ICV in this paper. ADS: Automated driving systems.
| Function Types | ICV Levels | ||
|---|---|---|---|
| I | II | III | |
| Autonomous Functions [30] | Level 1 to 2 ADS | Level 3 ADS | Level 4 to 5 ADS |
| Connected Functions |
|
|
|
Table 2.
Vehicle types and features.
| Vehicle Type | Usage | Stock Assumption | Average Length (m) |
|---|---|---|---|
| Passenger Vehicle (PV) | Noncommercial Passenger Vehicle (NPV), e.g., Private, Business | Calculated on sales prediction | 4.5 [12] |
| Commercial Passenger Vehicle (CPV), e.g., Taxi, Fleet of Transportation Network Company | 2 per 1000 urban residents by 2050 | ||
| Bus | Urban Bus (UB) | 1 per 1000 urban residents by 2050 | 7 [23] |
| Highway Bus (HB) | Calculated on sales prediction | ||
| Truck | Urban Truck (UT) | Calculated on sales prediction | 10 [23] |
| Highway Truck (HT) | Proportion in truck fleet may drop to 50% by 2050 |
Table 3.
Road types and features.
| Road Levels | Design Speed (km/h) | A | B | |
|---|---|---|---|---|
| Urban Roads [32] | Express Way | 80 | 1.448 | 1.435 |
| Arterial Road | 60 | 0.905 | 3.497 | |
| Secondary Trunk Road | 40 | 0.726 | 5.897 | |
| Bypass | 30 | 0.596 | 1.457 | |
| Highways [33] | Super Highway | 100 | 0.15 | 4 |
| National and Provincial Highway | 80 | |||
| Rural Highway | 30 | |||
| Rural Roads | 20 | |||
Table 4.
Vehicle kilometers travelled (VKT) effect coefficients of different ICVs (under 100% penetration rate scenario). CON: Conservative scenario; OPT: Optimistic scenario.
Table 4.
Vehicle kilometers travelled (VKT) effect coefficients of different ICVs (under 100% penetration rate scenario). CON: Conservative scenario; OPT: Optimistic scenario.
| Mechanisms | Applied Vehicle Types | Level I and II ICV | Level III ICV | Sources | ||
|---|---|---|---|---|---|---|
| OPT | CON | OPT | CON | |||
| Less Hunting for Parking | NPV | −5% | −2% | −11% | −5% | [22,37] |
| More Travel due to Higher Efficiency | All | 4% | 13% | 14.5% | 60% | [21,27,28] |
| More Travel of Underserved Population | PV | 0 | 0 | 2% | 14% | [27,38] |
| Ridesharing | PV | 0 | 0 | −12% | 0 | [22] |
| Empty Mileage | PV | 0 | 0 | 0 | 8.68% | [39] |
| Transit Modes Shift | NPV | 0 | 0 | 0 | 10% | Estimated based on [40] |
Table 5.
Safety effect coefficients of different ICV functions (under 100% penetration rate scenario).
Table 5.
Safety effect coefficients of different ICV functions (under 100% penetration rate scenario).
| Functions 1 | ICV Levels | Accident Types [42] | Injury Reduction % | Fatality Reduction % | Sources | |||
|---|---|---|---|---|---|---|---|---|
| I | II | CON | OPT | CON | OPT | |||
| FSR ACC | √ | √ | Overspeed, improper acceleration | 16 | 30 | 16 | 45 | [44,45] |
| PCS | √ | √ | Improper braking, accident with pedestrians | 20.9 | 30.6 | 9.9 | 19.9 | [15] |
| LCA | √ | √ | Illegal lane change, illegal overtaking, improper steering | 27 | 90 | 27 | 90 | [13,44] |
| LKA | √ | √ | Driving against traffic, improper steering | 29 | 32 | 25 | 27 | [46] |
| ESC | √ | √ | Overspeed, improper steering | 7 | 35 | 21.6 | 32 | [14,16] |
| AP | √ | Illegal reverse, illegal parking | 75 | 100 | 75 | 100 | [47] | |
| NV | √ | √ | Night accidents | 0 | 20 | 0 | 20 | [44] |
| DM | √ | √ | Drunk driving, driver fatigue | 75 | 99.3 | 75 | 99.3 | [48,49] |
| AFS | √ | √ | Illegal lighting usage | 0 | 91 | 0 | 88 | [18] |
| TSR | √ | Overspeed, driving against traffic, illegal turning back, illegal road occupation | 95 | 99 | 95 | 99 | [50] | |
| eCall | √ | √ | All fatalities | 0 | 0 | 2.4 | 4.6 | [17] |
| IMA | √ | Illegal meeting, illegal overtaking, violation of traffic signals, do not give way | 22.7 | 62 | 22.7 | 62 | [25,44] | |
| WILLWARN | √ | Do not give way, road related accidents | 1.4 | 2 | 2 | 2.5 | [44,51] | |
| √ | Adverse weather | 4.7 | 6.8 | 6.2 | 13 | |||
1 Abbreviations: Full-speed range adaptive cruise control (FSR ACC); Precollision system (PCS); lane change assist (LCA); lane keep assist (LKA); electronic stability control (ESC); automated parking (AP); night vision (NV); driver monitoring (DM); adaptive front-lighting system (AFS); traffic sign recognition (TSR); emergency call (eCall); intersection movement assist (IMA); wireless local danger warning (WILLWARN).
Table 6.
Correcting factors of different ICV functions.
| Function Types | Functions | Scenario | CF(β, IP) |
|---|---|---|---|
| Single Vehicle | FSR ACC, PCS, LDW, LKA, ESC, AP, DM, TSR, eCall | Vehicle equipped | |
| Multiple Vehicle | AFS, NV | None vehicle equipped | |
| Single vehicle equipped | |||
| Both vehicles equipped | |||
| Vehicle to Vehicle | - | None vehicle equipped | |
| Single vehicle equipped | |||
| Both vehicles equipped | |||
| Vehicle to Infrastructure | IMA, WILLWARN | Neither equipped | |
| Only vehicle equipped | |||
| Only infrastructure equipped | |||
| Both equipped |
Table 7.
Energy intensity effect coefficients of different mechanisms (under 100% penetration rate scenario).
Table 7.
Energy intensity effect coefficients of different mechanisms (under 100% penetration rate scenario).
| Mechanisms | Applied Vehicle Types | Effect Coefficient | ICV Levels | Sources | ||||
|---|---|---|---|---|---|---|---|---|
| CON | OPT | I | II | III | ||||
| Vehicle Design | Direct Energy Consumption | All | 1.2% | 0.9% | √ | √ | √ | Estimated based on [60] |
| Changes in Weight | All | 1% | 0.3% | √ | √ | √ | [60] | |
| Changes in Shape | All | −8.7% | −45% | √ | √ | [21,60] | ||
| Vehicle Usage | Eco-driving | All | 0 | −20% | √ | √ | √ | [21] |
| Platooning | HB, HT | −3% | −25% | √ | √ | [21] | ||
| Traffic Environment | Less Congestion | PV, UB, UT | −2% | −4% | √ | √ | √ | [21] |
| Higher Speed | HB, HT | 22% | 7% | √ | √ | [21] | ||
| Fewer Accidents | All | 0 | −1.9% | √ | √ | [20] | ||
Table 8.
Physical and economic properties of vehicle fuels.
| Fuel Types | Density (kg/L) | Life Cycle GHG Emissions Factor (g CO2 eq./MJ) | Fuel Price 1 | Sources | |
|---|---|---|---|---|---|
| Gasoline | 43.1 | 0.73 | 100.8 | 6115.2 RMB/tonne | [34,61,62] |
| Diesel | 42.6 | 0.84 | 102.5 | 5104.7 RMB/tonne | |
| CNG | 38.9 | - | 69.4 | 5.12 RMB/liter | |
| LNG | 38.9 | 0.45 | 75.4 | 3298.4 RMB/tonne | |
| Hydrogen | 120 | - | 48.4 | 93.6 RMB/kg | |
| Electricity | - | - | 198.6 (in 2015) to 111.2 (in 2050) | 388.25 RMB/kKWh | Calculated based on [63,64] |
| PHEV 2 | 38% × Value of Fuel + 62% × Value of Electricity | [65] | |||
1 All fuel prices are the market prices on 31 December 2015 according to National Bureau of Statistics, except that hydrogen price is an estimation of experts. 2 CNG: Compressed Natural Gas; LNG: Liquefied Natural Gas; PHEV: Plug-in Hybrid Electric Vehicle.
Table 9.
Impacts on operating costs of different enterprises.
| Cost Types | Initial Cost Per Vehicle (RMB Per Vehicle Per Year) | Mechanisms | Effect Coefficient | Sources | |
|---|---|---|---|---|---|
| Automotive Manufacturers | R&D Cost | PV: 1259 Bus: 13,366 Truck: 2516 |
| OPT: −4% CON: +15.4% | [68] |
| Production Cost | PV: 67,779 Bus: 292,733 Truck: 95,401 |
| OPT: −0.2% CON: 0 | [69] | |
| Marketing Cost | PV: 6148 Bus: 24,430 Truck: 3478 |
| OPT: −10% CON: 0 | [70] | |
| Commercial Fleet Operators | Financial Cost | NPV: 3700 CPV: 8000 Bus: 5400 UT: 3000 HT: 4500 |
| Level I ICV: 0 Level II ICV: −25% Level III ICV: −50% | [67,71] |
| Cleaning Cost | 0 |
| Level III ICV: Extra 50 RMB per 40 operations | [67] | |
| Labor cost | CPV: 67,200 Bus: 54,000 Truck: 107,000 |
| Level III ICV: −100% | Based on market survey 1 |
Table 10.
Impacts on user values of automotive manufacturers under the OPT scenario.
| Value Types | Mechanisms | Additional Values of ICVs | Sources | ||
|---|---|---|---|---|---|
| Level I | Level II | Level III | |||
| Product Value (RMB per vehicle) |
| 23,504 | 33,580 | 38,866 | [35,73] |
| Service Value (RMB per vehicle per year) |
| 187 | 280.5 | 374 | [68] |
| Data Value (RMB per vehicle per year) |
| 187 | 374 | 561 | [68] |
Table 11.
Infrastructure costs for ICV deployment. DSRC: Dedicated short range communication. V2I: Vehicle-to-infrastructure.
Table 11.
Infrastructure costs for ICV deployment. DSRC: Dedicated short range communication. V2I: Vehicle-to-infrastructure.
| V2I Road Infrastructure [76] | Cost Types | Assumptions | Cost Per Unit (RMB) | Total Cost (Billion RMB) | |
| DSRC | V2I Roadside Unit Construction | A roadside unit per 600 m | 109,620 | 1480.86 | |
| V2I Backhaul Network Construction | There are respectively 1500, 1000, and 500 systems in tier 1, 2–3 and 4–5 cities in China | 249,136 | 59.29 | ||
| Traffic Signal Control System Updating | 19,931 | 4.74 | |||
| Annual Maintenance | Mainly for roadside units | 18,997 per year | 256.63 per year | ||
| C-V2X | V2I Roadside Unit Construction | Doubling communication range of DSRC, a road unit per 1200 m | 109,620 | 740.43 | |
| V2I Backhaul Network Construction | Based on existing 4G base stations | 18,685 | 69.51 | ||
| Traffic Signal Control System Updating | The same with DSRC | 19,931 | 4.74 | ||
| Annual Maintenance | Mainly for roadside units | 18,997 per year | 128.32 per year | ||
| HD Maps | Professional mapping | $5000 cost per kilometer [78] | 31,142/km | 252.42 | |
| Crowdsourcing updating | Semidynamic information, upgrading per 30 seconds, cost rate at 2 cents per mile [79] | 0.077/km | 328.04 per year | ||
© 2019 by the authors. Licensee MDPI, Basel, Switzerland. This article is an open access article distributed under the terms and conditions of the Creative Commons Attribution (CC BY) license (http://creativecommons.org/licenses/by/4.0/).
Share and Cite
MDPI and ACS Style
Kuang, X.; Zhao, F.; Hao, H.; Liu, Z. Assessing the Socioeconomic Impacts of Intelligent Connected Vehicles in China: A Cost–Benefit Analysis. Sustainability 2019, 11, 3273. https://doi.org/10.3390/su11123273
AMA Style
Kuang X, Zhao F, Hao H, Liu Z. Assessing the Socioeconomic Impacts of Intelligent Connected Vehicles in China: A Cost–Benefit Analysis. Sustainability. 2019; 11(12):3273. https://doi.org/10.3390/su11123273
Chicago/Turabian StyleKuang, Xu, Fuquan Zhao, Han Hao, and Zongwei Liu. 2019. "Assessing the Socioeconomic Impacts of Intelligent Connected Vehicles in China: A Cost–Benefit Analysis" Sustainability 11, no. 12: 3273. https://doi.org/10.3390/su11123273
Note that from the first issue of 2016, this journal uses article numbers instead of page numbers. See further details here.