Benefit–Cost Analysis of Green Roof Initiative Projects: The Case of Jung-gu, Seoul

Department of Urban Planning and Engineering, Hanyang University, 222 Wangsimri-ro, Seoul 04763, Korea
*
Author to whom correspondence should be addressed.
Sustainability 2019, 11(12), 3319; https://doi.org/10.3390/su11123319
Submission received: 22 March 2019
/
Revised: 1 June 2019
/
Accepted: 12 June 2019
/
Published: 15 June 2019
(This article belongs to the Special Issue Urban Green Spaces, Urban Forestry, Health and Wellbeing, Planning and Governance)
Abstract
:Green roofs, which have various economic, environmental and social effects, have been acknowledged as an alternative green space in urban areas. This study aims to investigate the economic feasibility of green roof projects by conducting a benefit–cost analysis on the case of Jung-gu, Seoul. The analysis estimates and compares five different scenarios applied in the study area with a 20-year operation period in all cases. This set of scenarios aims to compare the most idealistic situation with more achievable and realistic situations, to provide policy implications for green roof initiative projects in Seoul. The analysis consists of estimating six cost items and eight benefit items. Among the benefit items, two non-marketable elements are estimated by the contingent valuation method. The scenario with 100% application of a green roof, has benefits exceeding the costs with a benefit–cost ratio of 1.174. However, the other scenarios with certain prerequisites have a benefit–cost ratio that is very close, but still smaller than 1. Therefore, it is possible to claim that green roof initiative projects are economically viable under specific conditions. However, there are many restrictions to engaging in green roof constructions for entire building rooftops.
1. Introduction
Conventionally, conserving and allocating an adequate amount of land to supply green spaces has been difficult. Green roofs have been recognised as an alternative method for providing green spaces in urban areas. Due to rapid urbanisation, green spaces have been decreasing in many cities. Green roofs for buildings have been preferred as an alternative method for providing ecosystem services.
Green roofs are a green infrastructure technology that has been widely adopted in many different cities. There are two major types of green roof systems, according to their purpose and characteristics: Extensive and intensive [1,2,3]. Intensive green roofs are commonly referred to as rooftop gardens, consisting of large trees, and a variety of plant species, along with garden furniture. They often appear more similar to parks and gardens on the ground level. The building needs to be able to hold the extra weight, as this requires foundation work, soil layers with a depth greater than 15 cm, and the planting of large species. On the other hand, extensive green roofs have thinner layers of soil and smaller plant species. The plant species usually include shrubs and succulent plants, which require minimal maintenance and exert relatively little load on the building structure. As intensive green roofs have more limitations, extensive green roofs have been preferred.
Green roofs are also known to have many environmental, economic and social benefits. Many studies have proven that green roofs are effective in many aspects, including carbon sequestration, air pollutant removal, stormwater management, seasonal energy savings, urban heat island (UHI) effect mitigation, increasing rooftop membrane longevity and contributing to urban aesthetics [1,2,3,4,5,6,7,8,9].
Due to their effectiveness, many cities have been promoting green roofs through initiative programmes and policies to promote their benefits. In Seoul, South Korea, as it is especially difficult to secure land to form additional green spaces, alternative approaches to provide green spaces are required [10]. The Seoul Metropolitan Government has been running initiative programs to promote green roof construction. Their aim is to build 900 green roofs in Seoul by 2020, and more than 600 roofs have already been transformed.
Some leading cities worldwide, including Portland, Berlin, Toronto, Helsinki, Melbourne and Hong Kong, also have initiative programs run by municipalities and local governments that encourage the construction of green roofs [11,12,13,14,15]. They have guidelines or regulations regarding green infrastructures, and they provide financial support or tax abatements.
Although a green roof has many positive effects on the urban environment, it cannot be the perfect solution for every case. A green roof involves possible issues, including the additional load on the building structure, the risk of membrane failure and high costs related to construction and maintenance. As green roofs are strongly affected by weather conditions, irrigation and waterproofing should be organised thoroughly to prevent the withering of plants or any water leakage from green roof systems.
In addition, as the green roof initiative programmes and policies are funded by local governments and municipalities, the economic feasibility of green roofs should be determined. The economic feasibility of green roofs is evaluated by conducting a benefit–cost analysis. The benefit-cost analysis was used to evaluate the economic feasibility of green roofs in many cities in North America, Europe, and Asia. These cities include New York [16], British Columbia [17], Genoa [18], Helsinki [3,13], Hong Kong [15,19], Seoul [7,20] and Kuala Lumpur [21]. The results reported by previous studies are pretty different. The benefit-cost analysis results are thought to be region-specific, and therefore the analysis framework would also be different (i.e., assumptions, discount rate and operational periods). The cost and benefit items related to the construction and operation of a green roof are carefully selected and calculated. The benefit–cost ratio is also calculated, which will give an idea of how economically desirable the given policy would be in a set period. This allows different alternatives to be compared.
Therefore, the purpose of this study is to estimate the costs and benefits related to green roof initiative projects in Jung-gu in order to estimate the economic feasibility of these projects in Seoul, South Korea. The benefit–cost analysis is conducted for five different scenarios, and this is composed of two parts: Direct and indirect valuation.
2. Method
2.1. Scenarios and Assumptions
This study considers three analysis scenarios for measuring the effectiveness of green roof projects in Jung-gu, Seoul. The five scenarios are summarised in Table 1, and Figure 1 shows the different settings of the scenarios.
First, Scenario A represents the case in which the buildings in Jung-gu stay as they are for the given time. Green roof installation requires more expenses than keeping a conventional rooftop [6]. Hence, Scenario A was introduced to provide a comparison between a conventional rooftop and a rooftop with a green roof installation.
The remaining four scenarios assumed green roof constructions from different perspectives. Scenario B assumed that the green roof system was applied to all public use buildings in Jung-gu (approximately 10% by area). Scenario C measured the full effects and potential of green roof initiative projects in Jung-gu. It assumed that all buildings in Jung-gu were suitable for green roofs. Scenarios D and E were derived from the Seoul Metropolitan Government’s green roof initiative policy guidelines. The policy aims to support private buildings with an applicable roof area greater than 99 m2, and preferably aged by no more than 10 years (or that have met the requirements of the structural safety inspection) for safety reasons. Scenario D assumed that green roofs were applied to all public buildings and private buildings with a roof area greater than 99 m2 (approximately 82.4% by area). Scenario E went one step further than Scenario D, and added the extra condition of the private building being no more than 10 years old (approximately 15.11% by area).
A number of assumptions were made during the analysis process.
- The cost and benefit items considered in this study were accommodated to suit the Korean condition. Other environmental and social benefits have been emphasised in previous studies, but they have been excluded, as they do not necessarily represent Seoul or extensive green roofs. These items include habitat restoration, community area, noise cancellation, property value increase and tax abatements [2,3,6,18].
- Building structures need to be checked for eligibility to endure additional structures and weight from the green roof, which is dependent on the material or the age of the building. By Korean law, a structure safety investigation is required when adding extra structures to an existing building. In this study, we assumed that all the buildings in Jung-gu could hold extra structures and weight.
- Green roof construction costs vary according to the type, design and plant species. In this study, the type of green roof applied was an extensive green roof, and it was assumed that the type of design and the plants were the same for the purposes of evaluation.
- Green roofs are semi-permanent systems. However, as the green roof initiative project is a publicly-funded project, we set an operational period. The operational period of green roof projects in this analysis was 20 years, the average lifespan of buildings in Korea. To evaluate the overall cost of green roofs, the cost of deconstruction was also considered. In this study, the removal of green roofs was assumed at the end of the operational period.
- The appropriate discount rate should be selected, as the discount rate plays an important role in benefit–cost analysis. The discount rate used for the analysis was 4.5%, the official social discount rate in Korea. The rate was derived from the Korea Development Institute’s study on determining the discount rate for evaluating public projects [22].
2.2. Study Method
This paper provides a benefit–cost analysis of green roofs by considering cost and benefit items related to green roofs. Benefit–cost analysis is widely used to verify the economic feasibility of public projects, as it is often difficult to assert the economic effects of public projects. Benefit–cost analysis is a framework that helps forecast whether the project could enhance social welfare in the future.
To derive cost and benefit items related to the effects of green roofs, previous studies and government regulations were reviewed, then the cost and benefit items were estimated. The estimation involved calculation processes provided by the regulations, quotes from related businesses, and equations and values used in previous studies. After the calculation of cost and benefit items, the benefit–cost ratios were determined to identify the economic feasibility of green roof initiative projects.
With respect to the social benefits of green roofs, some are non-market benefits. It is not possible to value them directly, as they are not traded in the markets. These include environmental and social benefits and services. For the estimation of these values, the Contingent Valuation (CV) method was used. The CV method was used to estimate the non-market values of environmental resources [23]. There are three possible ways of determining the willingness to pay (wtp) using the CV method: Open-ended questions, the payment-card method, and the dichotomous choice questions approach. The dichotomous choice questions approach is the most widely used among the three methods, and it involves asking respondents a set of direct questions. The dichotomous choice questions approach was used in this study. It involved asking about the wtp of a selected group by asking about their wtp for the given goods or services [23]. The survey results were used to calculate the market value of environmental and social effects.
The survey questions were designed based on the reviewed literature [22,23,24,25] and divided into four sections. The first section consisted of questions about their awareness, visiting experience and thoughts on the demand for green roofs. The second section asked about their wtp for a green roof enhancing urban aesthetics in dichotomous questions (doubling and halving the original amount). The third section also asked about their wtp for a green roof as an amenity element providing comfort, and lastly, their reasons for paying/not paying a certain amount of money.
The survey was distributed to different groups of practitioners in related fields, including urban design and planning, the environment, development and real estate economic analysis and urban administration. As green roof projects are not widely recognised by the general public in South Korea, respondents who were likely to be familiar with the concept of green roofs and the initiative projects launched by the Seoul Metropolitan Governments, were chosen. The profiles of the respondents Table A1 and the results of the double-bounded dichotomous model Table A2 are included in Appendix A.
2.3. Study Area
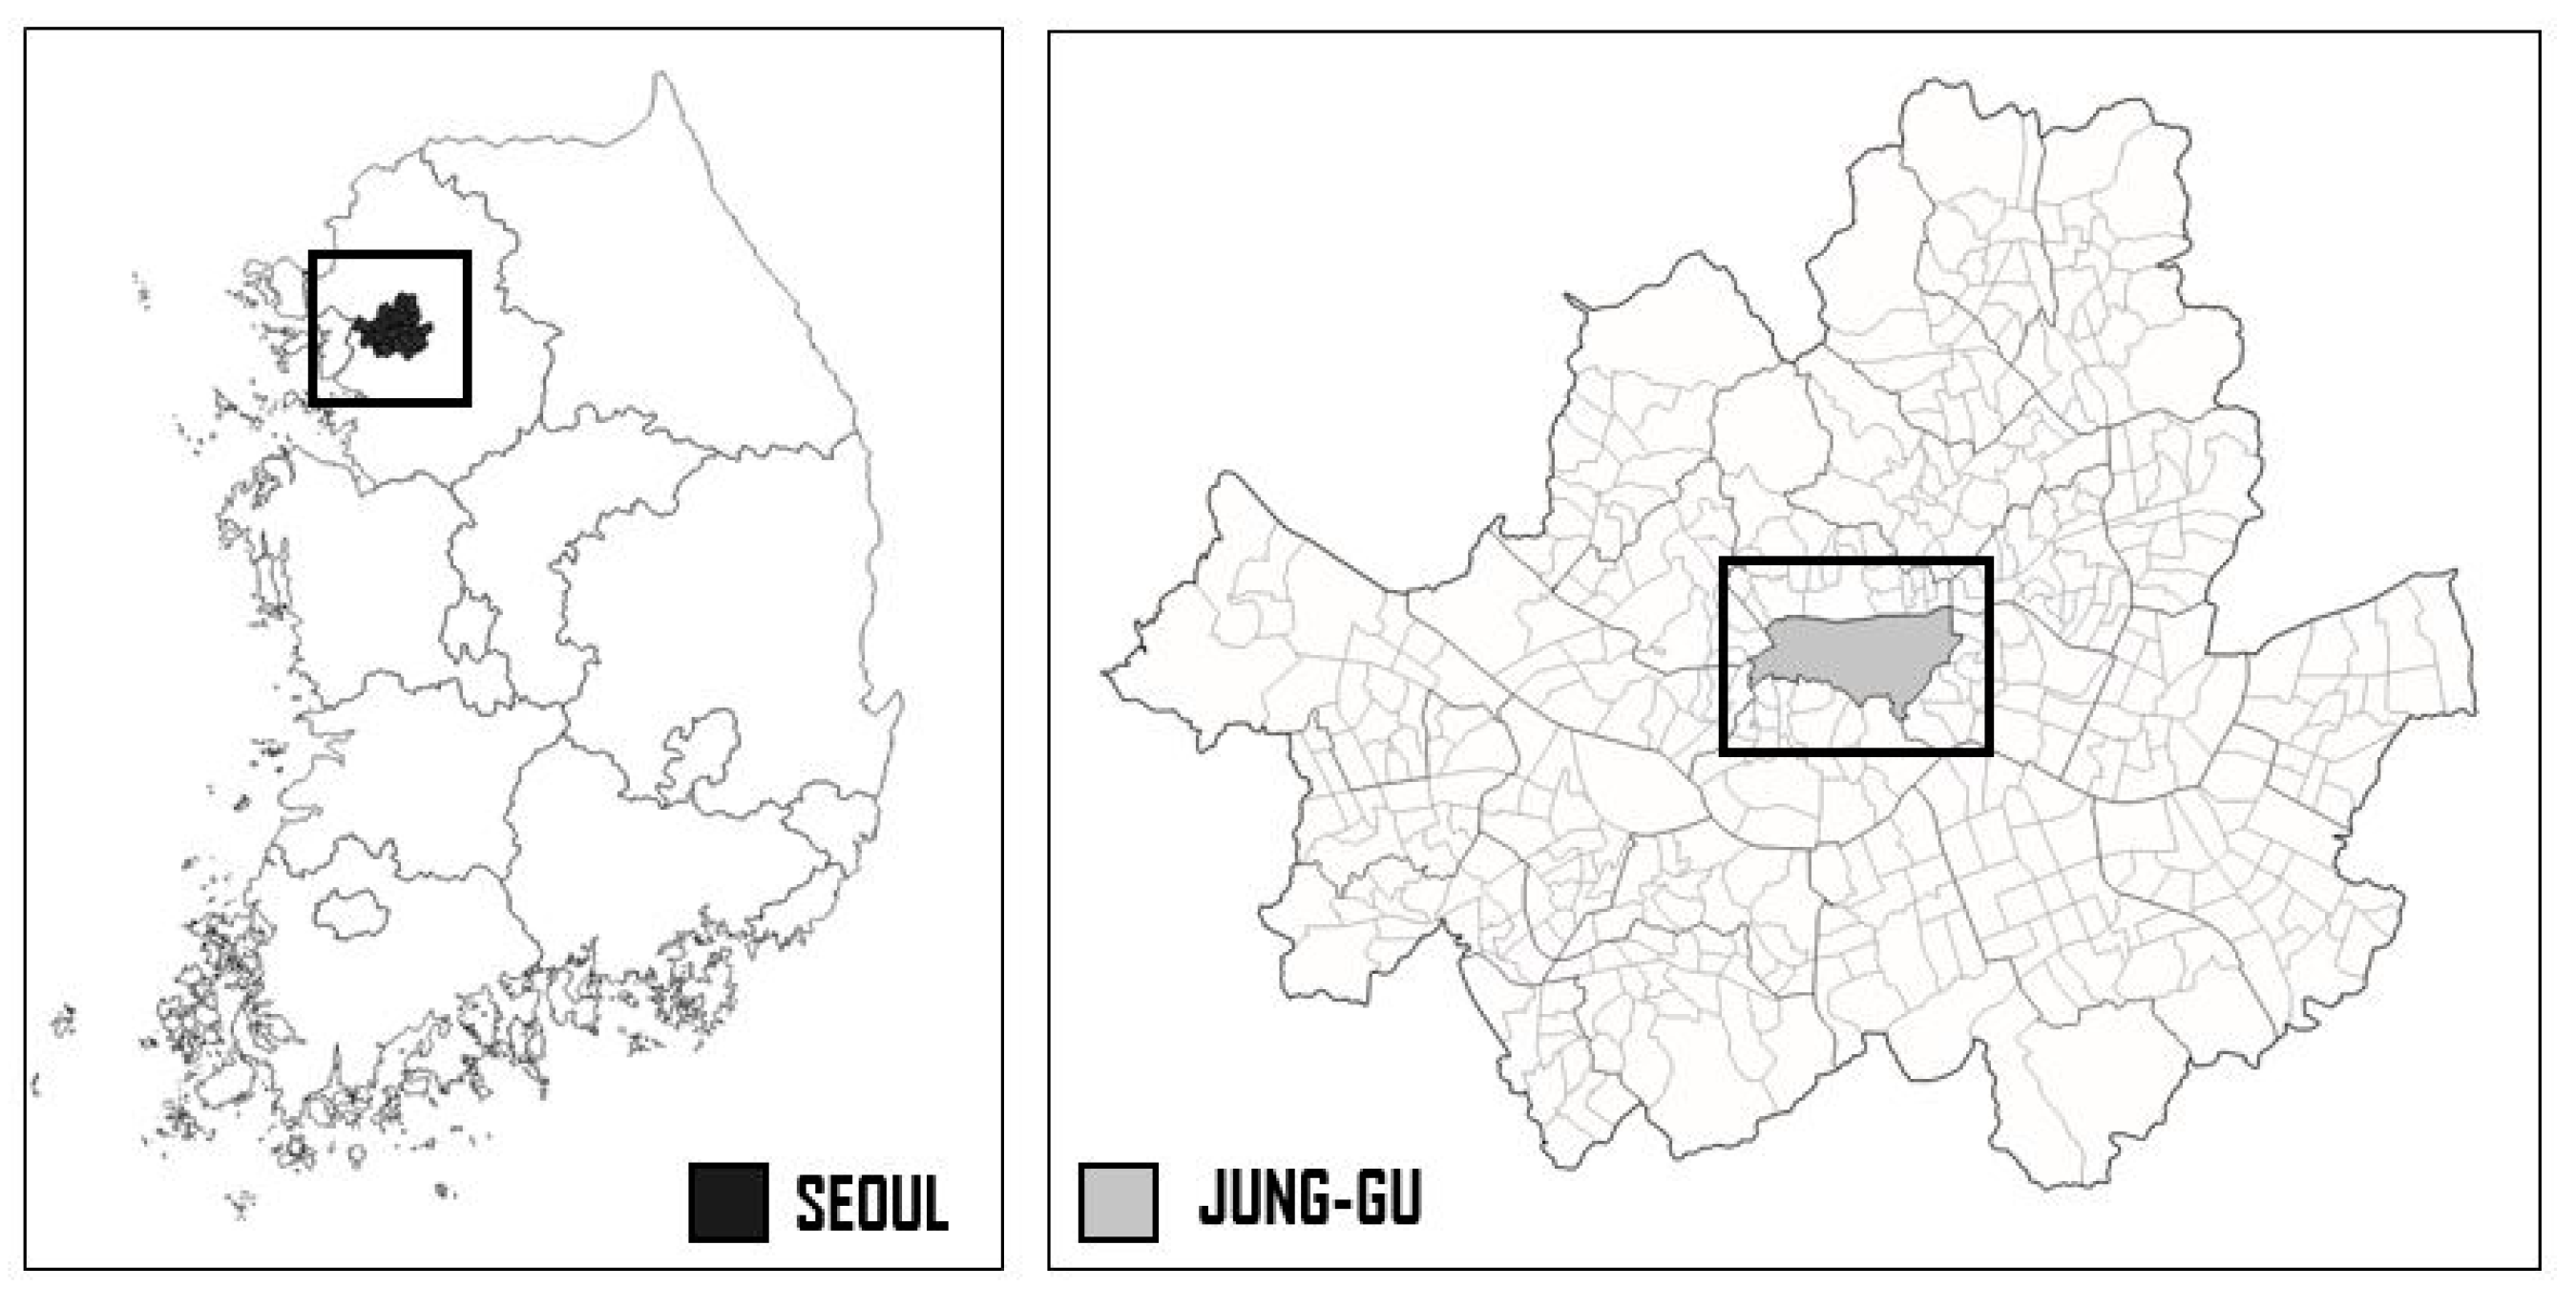
This study targets Jung-gu, Seoul. Jung-gu has the smallest area and the smallest population of Seoul’s 25 municipalities. The total area of the municipality was 9.96 km2 with a population of 12.5 million in 2018. Figure 2 shows the location of Jung-gu within Seoul, South Korea.
This area has greater significance in active green roof constructions and the initiative project, as there is higher potential to make good use of empty roof areas. Jung-gu is the smallest, yet it has high building density. Hence, the available land for additional tree planting in Jung-gu is very scarce, making it even harder to preserve empty lots to create green spaces. However, as green roofs occupy the roof area, the higher building density in Jung-gu could be useful. In this sense, this area was targeted to evaluate the economic feasibility of green roof projects.
In addition, Jung-gu has been participating actively in Seoul’s green roof initiative program since the beginning of the project. This is remarkable, because the development scheme in Jung-gu is relatively conservative, not allowing many new developments to occur. Public buildings have been strongly encouraged to plan green roofs, and it is mandatory for new constructions in Jung-gu to include green roofs. If the construction of green roofs is proven to be an economically feasible option in Jung-gu, this could be considered an effective case of providing green spaces in Seoul.
3. Varying Effects of Green Roofs
Previous studies regarding the effectiveness of green roof systems and the economic feasibility analysis of green roofs have been thoroughly reviewed to determine the cost and benefit items used in the analysis. The list of costs and benefits considered in the previous studies are summarised in Table A3 in Appendix A.
Many studies have measured and simulated the effects of green roofs in many different cities. Many of them have focused on investigating the environmental effects of green roofs. Researchers in Chicago [8] estimated the air pollutant removal effects of green roofs. Their results suggested that green roofs can mitigate air pollutant emissions to some degree. Roehr and Kong (2010) examined the different levels of the effectiveness of green roofs in terms of stormwater runoff reduction in Vancouver, Kelowna and Shanghai [9]. They found that cities with different conditions experienced varying effects from green roofs. The studies taking place in Seoul [7,20] also showed that green roofs can be used as stormwater management tools in urban areas. Literature reviews, comprehensive summaries of green roof research trends and statistical verifications have also been completed to examine the effect of green roofs from different perspectives [1,2,6,26]. In particular, Mentens et al. (2006) performed a set of statistical analyses to identify significant factors impacting the effects of green roofs [5].
Some studies have examined both the environmental and economic effects of green roofs simultaneously. A study focused on evaluating the research methodologies that had been used in previous studies, by constructing a virtual city environment [2]. Researchers from Seoul used the simulation results from the Stormwater Management Model (SWMM) analysis to estimate the environmental benefits related to stormwater runoff [7]. Researchers in Taiwan also evaluated the environmental and economic performance of green roofs in the major cities of Taiwan [27].
Many studies have also examined the cost-effectiveness of green roof systems. However, as their results have been very different, the demand for future research has continuously increased. This is not only because the costs and benefits related to green roof constructions differ due to supply and demand, but because other criteria differ as well, including climate, economic circumstances and government policies, which affect the estimation process [9,21]. The previous studies used approaches other than benefit–cost analysis, such as a Monte Carlo simulation approach [21], probabilistic economic analysis [28] and life-cycle cost analysis [6,29].
Other researchers have calculated public and private benefits separately. A benefit–cost analysis in Helsinki [13] specified possible different possible economic benefits for building owners and society.
Researchers in Kuala Lumpur used a Monte Carlo simulation approach to provide a good comparison between their results and those of previous studies due to differences in climatic and physical conditions [21]. Perini and Rosasco (2013) evaluated the economic sustainability of vertical greening systems in Genoa, Italy, through benefit–cost analysis [18]. They remarked that the ecological and environmental benefits had a significant influence on the results, as they tended to be more related to a larger scale than other items.
4. Analysis
4.1. Cost Estimation
For the cost estimation, six items were chosen. Structural Safety Inspections, Safety Management and Environment costs are mandatorily assigned by national government regulations. They follow the Enforcement Decree for calculation. On the other hand, there are no guidelines regarding construction, operational, maintenance and removal costs, so the cost estimation was based on quotes provided by a number of landscape design businesses in Seoul. The detailed estimation methods are described below.
4.1.1. Structural Safety Inspection
This section concerns the capability of holding the extra weight created by the green roof. The cost of the inspection was calculated based on the Regulation by the Ministry of Land, Infrastructure and Transport of Korea. The structural safety inspection cost was calculated as in Equation (1), where I = inspection cost per m2, A = applied area of green roof, L = labour and B = number of buildings.
Structural Safety Inspection = (I × A) + (L × B)
4.1.2. Construction
The construction cost included the overall process of green roof installation from the foundation to the cost of planting. The construction method and cost varied according to the desired type and design of the green roof. Therefore, there were no set guidelines on construction costs. The cost was calculated from the quotes provided by the landscape design businesses and the values used in previous studies [20]. The construction costs included all the initial costs involved in green roof installation: Waterproofing, structures, planting and labour. The construction cost per m2 was, in South Korean won (KRW), 131,265. The total construction cost was equal to the construction cost per unit multiplied by the total area of green roof application.
4.1.3. Operational and Maintenance Costs
This section concerns the general maintenance of green roof systems. Green roofs are natural systems, but they still require constant care. Generally, an average of two to four regular maintenance sessions is required annually for an extensive green roof. This study assumed three maintenance sessions. The maintenance cost was also provided by the same landscape design businesses as above. The average maintenance cost was KRW 12,058/m2. The operational and maintenance costs were calculated as in Equation (2) below, where M = the cost of maintenance per m2 (KRW), A = the applied area of green roof and f = the number of maintenance sessions.
Operational and maintenance costs = M × A × f
4.1.4. Safety Management and Environment
These are the additional charges related to the construction of an additional building structure. The given rates were predetermined by the type and size of existing building structures, as well as the type of new structure. These are specified by the Construction Technology Management Act Administrative Regulation Chapters 51 and 53. The given rate was multiplied by the total construction cost. In this case, green roof construction was an additional cost related to a building, so the environmental rate was 0.05% of the total construction cost. Additionally, the safe management rate of 1.86% was applied.
4.1.5. Disposal
As this study assumes the removal of the green roof after the 20-year operation period, removal and disposal costs were also considered. There is currently no report regarding green roof deconstruction in Seoul, so the removal cost was estimated based on the quotes provided from landscape design businesses. A number of previous studies have applied a portion of the construction cost as the removal cost [26]. Normally, the removal cost occurs at the very end of the operational period, so the cost becomes smaller when the discount rate is applied.
The cost of removal was calculated as in Equation (3), where D = the cost of green roof system disposal (KRW 10,000 per m2), A = applied area of green roof, N = the number of buildings and R = removal cost itself, which amounted to KRW 100,000 per building.
Removal = (A × D) + (N × R)
4.2. Benefit Estimation
Seven benefit items have been considered in this study. They mainly concern the social and environmental benefits resulting from green roofs. These items were derived from the previous studies discussed in Chapter 3 and in Table A1 of Appendix A. The environmental effects included air pollutant removal, carbon sequestration, stormwater management and cooling energy reduction. On the other hand, the social benefits included public health improvement from reduced particulate matter (PM) emissions and improved urban aesthetics and comfort.
4.2.1. Carbon Sequestration
A well-known effect of green roofs is the reduction of carbon emissions. This could be related to reducing the emissions of UHIs, but this study only concentrated on more direct effects, such as carbon sequestration.
Plants can convert carbon dioxide and water into carbohydrates and oxygen. This process is called photosynthesis, and uses sunlight as energy. Green roofs increase the mass of plants, which could facilitate the reduction of carbon dioxide emissions in urban areas.
The amount of carbon dioxide removed was based upon a previous study that measured CO2 absorption by green roofs [30]. They obtained results from experiments that consisted of the seven plant species most frequently used in Seoul’s green roofs. The carbon pricing costs approximately KRW 20,000 in South Korea [31]. The benefit of carbon sequestration was calculated by multiplying the amount of carbon dioxide removed annually by the carbon pricing in Korea.
4.2.2. Reduction in Cooling Energy Consumption
Green roofs have the potential to reduce cooling energy consumption in two different ways: Evaporation and evapotranspiration [3,4,6,13,18]. Additionally, the layers of substrates provide shade and absorb thermal energy.
The calculation was based on a study conducted in South Korea, in which Kim and Chang (2007) calculated the amount of evapotranspiration occurring on a green roof system, and translated that value into electric energy [32]. It was reported that 2.247 L of water was evaporated from each square metre of glass, which could be translated to an energy saving of 0.340 kWh/m2/day.
The saved cost of electricity was calculated as KRW 1.74/m2/h. It was assumed that cooling energy was only used during the summer period, with durations of 10 h/day. The reduced cost of cooling energy consumption was calculated as in Equation (4), where E = saved cost of electricity (KRW/kWh/m2), A = area of green roof (m2) and t = a given time.
Reduction in Cooling Energy Consumption = E × A × t
4.2.3. Stormwater Management
A factor that makes urban environments vulnerable is flood disasters. Urban flood disasters have different components relative to flood disasters in rural areas. These urban floods result from changes in urban environments, such as increases in impervious surfaces and changes in land use patterns.
Green roofs may contribute to mitigating urban floods caused by excessive stormwater runoff as the portion of green and permeable surfaces increases. Green roofs may delay the peak runoff time and reduce the discharged volume by retaining a portion of the rainwater within the system [5,7,9,33]. The rate of stormwater runoff reduction was obtained from a previous study conducted within Seoul [7]. They found that extensive green roof application in the entire study area reduced stormwater runoff by 25.6%, and by 14.7% in the case of the application of eligible roofs.
The stormwater management was calculated as in Equation (5), where M = the stormwater management cost of Jung-gu (KRW/t/day), R = the volume of stormwater runoff collected from Jung-gu, r = the rate of stormwater runoff reduction [7], G = the ratio of the green roof area in Shin and Kim’s study (2015) to the study area and t = a given time.
Stormwater Management = M × R × r × G × t
4.2.4. Air Pollutant Removal
Green infrastructures in urban environments have become popular, as they contribute to the mitigation of various air pollutants [2,6,29,34]. Trees are known to be the most effective means of reducing air pollutants. However, sparing land for trees alone is difficult in many cities. In high-density cities, it would be more practical to place green roofs to support the use of existing vegetation. Vegetation could lower the concentrations of different air pollutants through the mechanism of phytofiltration [35]. Parts of air pollutants are absorbed by the surfaces of the leaves and stems of plants, and later processed according to the plants’ metabolism. It is also reported that the presence of vegetation modifies microclimates [8].
Air quality has a great influence on the well-being of people living in cities. They are exposed to high levels of pollutants constantly, which could have an impact upon human health. In particular, children, the elderly, and people suffering from respiratory conditions are at greater risk of developing symptoms. A reduction in such air pollutants has the potential to decrease the probability of developing respiratory illnesses, asthma exacerbations and headaches [34].
Air pollutant substances are graded according to their impacts on health and the environment, and carbon monoxide (CO), ozone (O3), nitrogen dioxide (NO2), sulphur dioxide (SO2), PM (PM2.5 and PM10) and lead (Pb) are defined as the six major indicators of air pollutants [36]. Among these six major substances, three types of air pollutants were considered in the analysis: Sulphur dioxide (SO2), nitrogen dioxide (NO2) and ozone (O3), which show higher levels of concentration in the Seoul Metropolitan Government standards. The effect of green roofs related to PM will be discussed in Section 4.2.5.
The mass of removed air pollutants per unit was adopted from a report by the Korea Forest Service [31]. They reported that 1 m2 of green roofing can process 0.0052 kg/yr of NO2, 0.0024 kg/yr of SO2 and 0.0046 kg/yr of O3. The price of air pollutants per unit weight (USD) was obtained from [37], and converted into KRW. The benefit of air pollution removal was calculated as in Equation (6), where Q = the amount of air pollutant removed (kg/yr/m2), A = the area of green roofs (m2), V = the unit value of air pollutants (KRW) and t = a given time.
Air Pollutant Removal = Q × A × V × t
4.2.5. Social Benefits of Fine Particulate Matter (PM) Mitigation
The level of air pollution in Seoul has been increasing, as mentioned above, and the air pollution caused by the PM fraction has been increasing significantly. The average PM levels in Seoul have increased significantly over the years, and reached more than three times (32 µm/m3) the WHO standard of 10 µm/m3 for the annual mean both in 2017 and 2018 [38].
PM particles are either emitted directly from the source, or generated by the complex reactions of chemicals in the atmosphere. The classification is based on the particle size, such as PM10 (<10 µm in diameter) and PM2.5 (<2.5 µm in diameter). PM particles are so small that they cannot be detected by the naked eye, but they can be inhaled. Continuous exposure to air pollution could be a human health risk, and it is considered a group 1 carcinogen. It is reported that exposure to high levels of PM2.5 is related to cardiovascular and respiratory diseases and eventual mortality [39].
Green roofs could be a PM mitigation scheme in urban environments. PM particles can be deposited and accumulate on leaf surfaces, and are eventually washed away by rainwater [40]. Green roofs could contribute to PM mitigation as a greater gross area of leaf surface is provided in addition to existing green spaces in urban areas. It is also reported that shrubs have similar effects to trees in terms of PM10 removal [40].
The possible social value of PM mitigations has been estimated by the Korean Environmental Institution, and the estimated monetary value of PM mitigations was KRW 8075/person/year [41]. The National Health Insurance Service of Korea reported that the higher concentration of PM2.5 resulted in increased visits to clinics and emergency rooms [42]. The social benefit of PM mitigations was calculated as below, where C = the social benefit resulting from a decrease in the number of clinic visits (KRW) and P = the population of Jung-gu (125,725 in 2018).
Social Benefits of PM Mitigation = C × P
4.2.6. Rooftop Lifespan
Green roof constructions are known to increase the lifespan of building rooftops, as well as decrease the need for maintenance [4,13,18,21]. It is known that green roof construction could double the lifespan of the roofing membrane [14]. This doubling is due to the better protection provided by additional layers of structural support in green roof systems. The well-structured foundation of green roof systems also reduces the need for regular maintenance.
For conventional roofs, maintenance usually takes place once a year. The cost of conventional roof maintenance was obtained by averaging the prices provided by landscape businesses. The average cost was calculated as KRW 12,000/m2. The reduced expense for rooftop maintenance was calculated by multiplying the cost of routine maintenance (KRW/m2) by the operation period (year).
4.2.7. Urban Aesthetics and Comfort
The social benefits of green roofs were mainly derived from environmental services. Among the many social benefits, urban aesthetic enhancement and providing comfort were selected. These benefits were measured based on the value of appreciating green roofs in public.
Green roofs are known to contribute to urban aesthetics [43]. In particular, for cities with a high density of tall buildings, the cityscape can be relatively dull. Apartment blocks and office buildings are almost everywhere to serve the large population. Although green roofs may not have the scenic quality of urban parks and other green spaces, the literature has concluded that green roofs are perceived more positively than conventional roofs [11]. They can provide different shades of colour in the monotonous structure of the city, and can thus be appreciated by its citizens. However, as aesthetics are intangible and hard to estimate, many studies with benefit–cost analysis have omitted this value [16].
A layer of vegetation on a wall or a roof could reduce surrounding air temperatures. [8] This provides a cooling effect for the city, and eventually leads to UHI effect mitigation. Estimating UHI effect mitigation as a monetary value is difficult, so refreshment and comfort resulting from the cooling effect of the city were calculated based on the wtp of the respondents.
From the collected responses (N = 103), two wtp sets were estimated from the double-bounded model using Stata 12. The model was in the form of a modified ordered probability unit (probit) model, which allowed the direct estimation of wtp [25]. The final calculated wtp was equal to KRW 4074 for urban aesthetic value and KRW 4302 for urban comfort and amenities.
5. Results
The estimated costs and benefits are summarised in Table 2. The discount rate was not applied to the four items only occurring in the first year. As Scenario A measured the cost for a conventional rooftop, the operational and maintenance costs were the only elements estimated for Scenario A. The cost of Scenario A was KRW 477,940,070,000 (approx. USD 421 m). The total cost of Scenario B was KRW 97,707,417,368 (USD 87.9 m), that of Scenario C was KRW 981,050,020,588 (USD 981 m), that of Scenario D was KRW 789,007,356,535 (USD 681 m) and that of Scenario D was KRW 144,395,091,835 (USD 124.6 m).
On the other hand, the estimated values for total benefits were as follows. There was no financial benefit resulting from Scenario A. The total benefit for Scenario B was KRW 92,853,439,670 (USD 83.5 m), that of Scenario C was KRW 1,151,899,592,488 (approx. USD 1036 m), that of Scenario D was KRW 703,369,007,922 (USD 606 million) and, finally, that of Scenario E was KRW (USD 1112 m).
Assuming 100% green roof application, Scenario C was the only scenario with a benefit–cost ratio exceeding 1.0 (BCR = 1.174). The other scenarios with partial application had a benefit–cost ratio of slightly less than 1.0 at 0.967, 0.900 and 0.942, respectively. Table 3 shows the analysis results summary.
6. Discussion
6.1. Findings and Implications
The results of the benefit–cost analysis varied, as many effective factors operated differently. The analysis results were affected by distinctive features, such as climate, urban forms and density, economic circumstances and government policies. Therefore, green roofs could be an economically sound approach only in some cases. The major findings of this study were as follows:
- The construction cost for green roofs was approximately KRW 130,000/m2 (equivalent to USD 120), which was much higher than for countries with established green roof industries. It is reported that in countries such as Germany, Finland and the US, the average cost of green roof construction is less than USD 100 [3]. Therefore, the cost is more likely to reduce when the market for green roof infrastructure expands.
- The majority of previous studies have only considered the construction costs of green roofs. This study considered extra expenses required by law, as well as the cost of removal at the end of the operation period. Thus, the costs might have been greater than the estimated costs of previous studies.
- In terms of environmental effects, a green roof’s environmental and financial performance is not as strong as that of trees. However, green roofs are still in favour, as they could complement the existing vegetation, or be used as supplementary measures in densified areas.
- The value of the estimated wtp could have been inflated as the targeted group consisted of experts in related fields. However, 20.4% of respondents had no wtp for enhanced urban aesthetics and 17.5% for increased comfort. These results could suggest that as they were more aware of the concepts and effectiveness of green roofs, they were able to conduct an evaluation in a sound manner. The wtp value could have been different if the general public was surveyed. However, as there is a higher probability of the general public being less familiar with the costs and benefits related to green roofs, the estimated wtp might not indicate the preferences [44].
- The benefits usually surpassed the costs when full green roof coverage was assumed. Many previous studies have demonstrated that scenarios with the partial application of green roofs are not economically feasible [3,7,21,25]. However, in the case of Jung-gu, the private benefits outweighed the social benefits. This resulted from different research designs: Those studies assumed that private benefits were only enjoyed by building owners and users. However, as private benefits could also be beneficial to the citizens, this study considered that both private and social benefits were enjoyed without separation.
- The rapid urbanisation and densification have resulted in reduced green spaces. Often, the values of natural resources and environmental services in urban areas are neglected. Deploying green roofs will help to restore the green spaces in urban areas, along with providing many benefits to the environment and to society. In this sense, green roofs could be seen as an example of environmental stewardship. The term is often used to outline environmental improvement actions and efforts, which mainly concerns the assurance of having intact environmental services that are essential for present and future generations’ welfare [45]. Green roof initiative projects are indeed a collaborative effort of public and private, involving many stakeholders, such as municipal leaders, regulators, planners, designers, and building owners to make the cities more sustainable [46].
- Although the building owners own the physical contents of the green roof systems, it could be said that the society could enjoy the benefits and services provided by the green roofs. Therefore, green roof construction can be considered an improvement in public assets in some senses, whether they are owned by the public or private. To maximise the effects of green roofs, metropolitan and municipal governments should provide subsidies to encourage private building owners to construct and maintain green roofs. In the case of Seoul, the Metropolitan Government offers a portion of the construction and structural safety inspection costs.
- The Metropolitan Government should continue promoting and providing financial or social rewards to private building owners for transforming their rooftops into green roofs. For instance, the private building owners who continue to take good care of the green roof systems could receive tax reductions as a reward. There are chances that the maintenance of the green roofs to be neglected for several months and the plants would eventually wither. The construction stage is relatively well-monitored by the Metropolitan government. However, after the construction has been completed, there are no follow-up supports and check-up to keep track of the green roofs’ operations. For the purpose of providing adequate guidance and subsidies to the building owners, policy guidelines regarding green roof construction and maintenance should be provided, as there are no clear guidelines for green roof construction and maintenance.
- Concerning the scenarios with partial applications of green roofs, the scenarios with the most coverage (82.35% by area) had the smallest benefit–cost ratio (0.9), and vice versa. It is interesting to see that Scenario B, with the smallest size (10% by area), and fewest buildings (N = 201), had the highest benefit–cost ratio among these four scenarios, assuming the partial application of green roofs Table 3. This is due to the fact that some cost calculations are based on the unit price per building in South Korea. The area of the green roof is still very important, but the results suggest that there could be other influences that determine the economic feasibility of green roofs. Thus, the target group for green roof initiative projects should be selected with regard to choice and concentration strategies.
- The results obtained from previous studies are summarised in Table 4. The results differ significantly. It is reported that the results of economic feasibility studies are region-specific, as cities and nations have different values, appreciation and financial situations related to green roofs [18]. Therefore, more region-specific studies reflecting the environmental, socio-economic and physical conditions of the city are required.
6.2. Limitations and Significance
There are two limitations to this study. First, some benefit items could not be included in this study. A few benefit items, such as noise cancellation and property value, were not considered, as they are not applicable to Seoul, but the benefit of UHI effect mitigation could be estimated in further research. Furthermore, due to data availability, air pollutant removal estimation relied upon data obtained from international studies. Further research is required to obtain more suitable data for the conditions of Seoul.
The significance of this study derives from comparing more realistic and achievable scenarios to observe the effectiveness of green roof initiative projects. In addition, the social benefits of green roofs were estimated. Non-marketable benefit items were estimated using the CV method, which involved surveying the experts in the field to assess their wtp. In terms of health concerns, the social benefits resulting from possible PM mitigation were evaluated.
7. Conclusions
Seoul needs green spaces, and it has experienced some difficulty in preserving enough green spaces in such a high-density area. Green roofs, although not completely feasible, could be a new alternative source of green spaces, transforming grey rooftops to green rooftops.
This paper focused on evaluating the economic feasibility of green roof projects in Jung-gu, Seoul, by incorporating six cost and eight benefit items. The cost and benefit items were estimated, including two benefit items that consisted of the Contingent Valuation Method. Five different scenarios were applied to compare the effectiveness of green roofs.
This analysis demonstrated a number of scenarios linked to Seoul’s set priorities and realistic and relatively achievable situations. The analysis results suggested that 100% application of green roofs is an economically feasible option, as it was the only scenario with a benefit–cost ratio exceeding 1. Applying green roofs to every rooftop in Jung-gu seems very attractive, but it is very difficult to achieve in the actual urban scene. Not all of the buildings are suitable for sustaining the extra structure and weight, and even if they fit the prerequisites, it would be almost impossible to encourage every building owner to install green roofs. However, for the other scenarios, the gap between the cost and benefit values is not that significant. If the cost of construction decreases because the market for green roof infrastructures expands, there could be opportunities for the other scenarios to become economically feasible.
Author Contributions
Conceptualization, E.S. and H.K.; Methodology, E.S. and H.K.; Software, E.S.; Validation, E.S. and H.K.; Formal Analysis, E.S.; Investigation, E.S.; Resources, E.S.; Data Curation, E.S.; Writing—Original Draft Preparation, E.S. and H.K.; Writing—Review & Editing, H.K.; Visualization, E.S.; Supervision, H.K.; Project Administration, H.K.
Funding
This research received no external funding.
Conflicts of Interest
The authors declare no conflict of interest.
Appendix A
Table A1 shows the profile of respondents surveyed for estimating two non-market effects of green roofs. A total of 103 responses were collected, and as the survey targeted experts in related fields, their fields of expertise and professions were recorded. Table A2 shows the summarised results of the double-bounded dichotomous model used to calculate wtp values. The coefficient of the nonlinear combination of estimators was the final wtp value.

Table A1.
Profiles of respondents.
| (Total N = 103) | Researchers (N = 34) | Professors (N = 18) | Office Workers (N = 43) | Government Officers (N = 8) | ||||
|---|---|---|---|---|---|---|---|---|
| Specialty | N | % | N | % | N | % | N | % |
| Urban Design and Planning | 16 | 48.5 | 8 | 44.4 | 13 | 30.2 | 1 | 12.5 |
| Environments | 6 | 18.2 | 3 | 16.7 | 2 | 4.7 | 2 | 25.0 |
| Developments and Real Estates | 2 | 6.1 | 4 | 22.2 | 25 | 58.1 | - | - |
| Economic Analysis | 9 | 27.3 | 3 | 16.7 | 3 | 7.0 | - | - |
| Urban Administrative | - | - | - | - | - | - | 5 | 62.5 |
Table A2.
Results of double-bounded dichotomous model.
| Urban Aesthetics | Urban Comfort and Amenities | ||||||
|---|---|---|---|---|---|---|---|
| Variables | Coef. | t | p | Variables | Coef. | t | p |
| _con | 6621.78 | 1822.755 | 0.000 | _con | 5615.365 | 1059.479 | 0.000 |
| GR Visit experience | 1143.431 | 781.0543 | 0.143 | GR Recognition | −638.066 | 308.0425 | 0.038 |
| Demand for GR | −1691.83 | 472.9886 | 0.000 | GR Visit experience | −444.415 | 485.0295 | 0.36 |
| Expertise 1 (d) | −622.034 | 1488.786 | 0.676 | Demand for GR | −845.068 | 265.2364 | 0.001 |
| Expertise 2 (d) | −882.111 | 1733.141 | 0.611 | Expertise 1 (d) | 1035.528 | 818.0825 | 0.206 |
| Expertise 3 (d) | 850.422 | 1467.829 | 0.562 | Expertise 2 (d) | 652.77 | 999.6039 | 0.514 |
| Experiences | −88.1184 | 245.4508 | 0.72 | Expertise 3 (d) | 1654.804 | 835.5155 | 0.048 |
| Experiences | 31.35208 | 30.06153 | 0.297 | ||||
| p | 0.009 | p | 0.006 | ||||
| Wald X2 | 18.64 | Wald X2 | 19.97 | ||||
| Log Likelihood | −115.380 | Log Likelihood | −92.918 | ||||
| WTP | 4073.581 | 4.77 | 0.000 | WTP | 4301.152 | 20.32 | 0.000 |
The estimated values of cost and benefit items were derived from the variables used in previous studies. Table A3 represents the employment of different variables considered in the reviewed literature.
Table A3.
Cost and benefit items considered in the previous studies.
| Variables | Authors | |||||||||
|---|---|---|---|---|---|---|---|---|---|---|
| Carter & Keeler (2008) | Doshi & Peck (2013) | Shin & Kim (2015) | Nurmi et al. (2013) | Mahdiyar et al. (2016) | Peng & Jim (2015) | Perini & Rosasco (2013) | Wong et al. (2003) | Francis & Jensen (2017) | Feng & Hewage (2018) | |
| Groundwork | O | O | O | |||||||
| Construction | O | O | O | O | O | O | O | O | O | O |
| Maintenance | O | O | O | O | O | O | ||||
| Disposal | O | O | O | |||||||
| Others | O | O | O | |||||||
| Improved Air Quality | O | O | O | O | O | O | O | O | ||
| Stormwater Management | O | O | O | O | O | O | ||||
| Carbon Reduction | O | O | O | O | ||||||
| Rooftop Lifespan | O | O | O | O | O | |||||
| Seasonal Energy Savings | O | O | O | O | O | O | O | O | O | |
| Habitat Restoration | O | O | O | |||||||
| UHI Effect Mitigation | O | O | O | O | ||||||
| Property Values | O | O | ||||||||
| Aesthetic Values | O | O | O | |||||||
| Noise Cancelling | O | O | O | |||||||
| Tax Abatements | O | |||||||||
| Employments | O | |||||||||
References
- Getter, K.; Rowe, D. The Role of Extensive Green Roofs in Sustainable Development. HortScience 2006, 41, 1276–1285. [Google Scholar] [CrossRef] [Green Version]
- Doshi, H.; Peck, S. Methods for Estimating Economic Public Benefits from Regional Implementation of Green Roof Technology: Working Draft Paper for Review; Green Roofs for Healthy Cities: Toronto, ON, Canada, 2013. [Google Scholar]
- Nurmi, V.; Votsis, A.; Perrels, A.; Lehvävirta, S. Green Roof Cost-Benefit Analysis: Special Emphasis on Scenic Benefits. J. Benefit Cost Anal. 2016, 7, 488–522. [Google Scholar] [CrossRef]
- Oberndorfer, E.; Lundholm, J.; Bass, B.; Coffman, R.; Doshi, H.; Dunnett, N.; Gaffin, S.; Köhler, M.; Liu, K.; Rowe, B. Green Roofs as Urban Ecosystems: Ecological Structures, Functions, and Services. BioScience 2007, 57, 823–833. [Google Scholar] [CrossRef]
- Mentens, J.; Raes, D.; Hermy, M. Green Roofs as a Tool for Solving the Rainwater Runoff Problem in the Urbanized 21st Century? Landsc. Urban Plan. 2006, 77, 217–226. [Google Scholar] [CrossRef]
- Carter, T.; Keeler, A. Life-cycle Cost-benefit Analysis of Extensive Vegetated Roof Systems. J. Environ. Manag. 2008, 87, 350–363. [Google Scholar] [CrossRef] [PubMed]
- Shin, E.; Kim, H. Analysing Green Roof Effects in an Urban Environment: A Case of Bangbae-dong, Seoul. J. Asian Archit. Build. 2015, 14, 315–3222. [Google Scholar] [CrossRef]
- Yang, J.; Yu, Q.; Gong, P. Quantifying air pollution removal by green roofs in Chicago. Atmos. Environ. 2008, 42, 7266–7273. [Google Scholar] [CrossRef]
- Roehr, D.; Kong, Y. Runoff Reduction Effects of Green Roofs in Vancouver, BC, Kelowna, BC, and Shanghai, P.R. China. Can Water Resour. J. 2010, 35, 53–68. [Google Scholar] [CrossRef] [Green Version]
- Kim, J.M.; Hong, T.H.; Koo, C. Economic and Environmental Evaluation Model for Selecting the Optimum Design of Green Roof Systems in Elementary Schools. Environ. Sci. Technol. 2012, 46, 8475–8483. [Google Scholar] [CrossRef]
- Adams, S.; Marriott, D. Cost Benefit Evaluation of Ecoroofs; City of Portland: Portland, OR, USA, 2008. [Google Scholar]
- City of Toronto. Report on the Environmental Benefits and Costs of Green Roof Technology for City of Toronto; Ryerson University: Toronto, ON, Canada, 2005. [Google Scholar]
- Nurmi, V.; Votsis, A.; Perrels, A.; Lehvävirta, S. Cost-Benefit Analysis of Green Roofs in Urban Areas: Case Study in Helsinki; Finnish Meteorological Institute: Helsinki, Finland, 2013. Available online: http://hdl.handle.net/10138/40150 (accessed on 25 January 2019).
- State of Victoria. Growing Green Guide: A Guide to Green Roofs, Walls and Facades in Melbourne and Victoria, Australia; State of Victoria: Melbourne, Australia, 2014. [Google Scholar]
- Hui, S.C.M. Technical Guidelines for Green Roofs Systems in Hong Kong; The University of Hong Kong: Hong Kong, China, 2011. [Google Scholar]
- Blackhurst, M.; Hendrickson, C.; Matthews, H.S. Cost-effectiveness of green roofs. J. Artch. Eng. 2010, 16, 136–143. [Google Scholar] [CrossRef]
- Feng, H.; Hewage, K.N. Economic Benefits and Costs of Green Roofs. In Nature Based Strategies for Urban and Building Sustainability; Perez, G., Perini, K., Eds.; Elsevier: Oxford/Cambridge, UK, 2018; pp. 307–318. [Google Scholar]
- Perini, K.; Rosasco, P. Cost-benefit Analysis for Green Façades and Living Wall Systems. Build. Environ. 2013, 70, 110–121. [Google Scholar] [CrossRef]
- Peng, L.; Jim, C. Economic Evaluation of Green-roof Environmental Benefits in the Context of Climate Change: The Case of Hong Kong. Urban For. Urban Green. 2015, 14, 554–561. [Google Scholar] [CrossRef]
- Yeo, K.; Jung, Y. An Analysis of Effect of Green Roofs in Urbanized Areas on Runoff Alleviation and Cost Estimation. Seoul Inst. 2013, 14, 161–177. (In Korean) [Google Scholar]
- Mahdiyar, A.; Tabatabaee, S.; Sadeghifam, A.; Mohandes, S.; Abdullah, A.; Meynagh, M. Probabilistic Private Cost-benefit Analysis for Green Roof Installation: A Monte Carlo Simulation Approach. Urban For. Urban Green. 2016, 20, 317–327. [Google Scholar] [CrossRef]
- Ministry of Economy and Finance Korea. Amendment of the Economic Feasibility Study System. (Press Release). Available online: http://www.moef.go.kr/ (accessed on 11 August 2017).
- Venkatachalam, L. The contingent valuation method. Environ. Impact Assess. Rev. 2004, 24, 89–124. [Google Scholar] [CrossRef]
- Korea Development Institute. Guidelines to Contingent Valuation Method for Preliminary Feasibility Studies; Korean Development Institute: Seoul, South Korea, 2012. (In Korean) [Google Scholar]
- López-Feldman, A. Introduction to Contingent valuation using Stata (translated). In Aplicaciones en Economía y Ciencias Cociales con Stata; Stata Press: College Station, TX, USA, 2012. [Google Scholar]
- Francis, L.F.M.; Jensen, M.B. Benefits of Green Roofs: A Systematic Review of the Evidence for Three Ecosystem Services. Urban For. Urban Green. 2017, 28, 167–176. [Google Scholar] [CrossRef]
- Chen, C. Performance evaluation and development strategies for green roofs in Taiwan: A review. Ecol. Eng. 2013, 52, 51–58. [Google Scholar] [CrossRef]
- Clark, C.; Adriaens, P.; Tablot, B. Green Roof Valuation: A Probabilistic Economic Analysis of Environmental Benefits. Environ. Sci. Technol. 2008, 42, 2155–2161. [Google Scholar] [CrossRef]
- Wong, N.H.; Tay, S.F.; Wong, R.; Ong, C.L.; Sia, A. Life Cycle Cost Analysis of Rooftop Gardens in Singapore. Build. Environ. 2003, 38, 499–509. [Google Scholar] [CrossRef]
- Ahn, G.Y.; Han, S.W.; Lee, E.H. The Analysis of Instantaneous CO2 Uptake and Evapotranspiration of Herbaceous Plants for Artificial Roof Greening. Korea J. Environ. Ecol. 2011, 25, 91–101. (in Korean). [Google Scholar]
- Korea Forest Service. A Guideline for Developing Urban Forest Sustainability Index; Korea Forest Service: Daejeon, South Korea, 2011. (In Korean)
- Kim, S.B.; Chang, J.K. An Analysis of Environmental and Economic Benefits of Green Roof in Jung-Gu, Daegu. J. Environ. Sci. Int. 2007, 16, 603–610. (In Korean) [Google Scholar] [CrossRef] [Green Version]
- Palla, A.; Sansalone, J.J.; Gnecco, I.; Lanza, L.G. Stormwater Infiltration in a Monitored Green Roof for Hydrologic Restoration. Water Sci. Technol. 2011, 64, 766–773. [Google Scholar] [CrossRef] [PubMed]
- Chen, T.M.; Kuschner, W.G.; Gokhale, J.; Shofer, S. Outdoor air pollution: Nitrogen dioxide, sulfur dioxide, and carbon monoxide health effects. Am. J. Med. Sci. 2007, 333, 249–256. [Google Scholar] [CrossRef] [PubMed]
- Viesco, M.; Vera, S.; Jorquera, H.; Bustamante, W.; Gironas, J.; Dobbs, C.; Leiva, E. Potential of Particle Matter Dry Deposition on Green Roofs and Living Walls Vegetation for Mitigating Urban Atmospheric Pollution in Semiarid Climates. Sustainability 2018, 10, 2431. [Google Scholar] [CrossRef]
- Jayasooriya, V.M.; Ng, A.W.M.; Muthukumaran, S.; Perera, B.J.C. Green Infrastructure Practices for Improvement of Urban Air Quality. Urban For. Urban Green. 2017, 21, 34–47. [Google Scholar] [CrossRef]
- McPherson, E.G. Benefits and costs of tree planting and care in Chicago. General technical report NE-186. In Chicago’s Urban Forest Ecosystem: Results of the Chicago Urban Forest Climate Project; McPherson, E.G., Ed.; United States Department of Agriculture, Forest Service, Northeastern Forest Experimental Station: Randor, PA, USA, 1994; pp. 115–133. [Google Scholar]
- Park, S.; Ko, D. Investigating the Effects of the Built Environment on PM2.5 and PM10: A Case Study of Seoul Metropolitan City, South Korea. Sustainability 2018, 10, 4552. [Google Scholar] [CrossRef]
- Hwang, Y.; An, J.; Lee, K. Characterization of a High PM2.5 Exposure Group in Seoul Using the Korea Simulation Exposure Model for PM2.5 (KoSEM-PM) Based on Time–Activity Patterns and Microenvironmental Measurements. Int. J. Environ. Res. Public Health 2018, 15, 2808. [Google Scholar] [CrossRef] [PubMed]
- Speak, A.F.; Rothwell, J.J.; Lindley, S.J.; Smith, C.L. Urban Particulate Pollution Reduction by Four Species of Green Roof Vegetation in a UK City. Atmos. Environ. 2012, 61, 283–293. [Google Scholar] [CrossRef]
- Korea Environmental Institute. Evaluation of Air Pollution Effect on Health and Estimation of the Cost Related to the Impact; Korea Environmental Institute: Sejong, South Korea, 2015. (In Korean)
- Han, C.; Park, S.; Lee, J.; Park, H.; Kim, Y.; Jung, J. The Analysis of the relationship between Medical Services and Fatalities in Regards to PM and Respiratory Diseases: By Using National Health Insurance Data; National Health Insurance Service (NHIS) Ilsan Hospital: Seoul, Korea, 2019. (In Korean)
- Bianichi, F.; Hewage, K.N. Probabilistic social cost-benefit analysis for green roofs: A lifecycle approach. Build. Environ. 2012, 58, 152–162. [Google Scholar] [CrossRef]
- Markantonis, V.; Bithas, K. The Application of the Contingent Valuation Method in Estimating the Climate Change Mitigation and Adaptation Policies in Greece: An Expert-based Approach. Environ. Dev. Sustain. 2010, 12, 807–824. [Google Scholar] [CrossRef]
- Welchman, J. A Defence of Environmental Stewardship. Environ. Values 2012, 21, 297–316. [Google Scholar] [CrossRef]
- Weiler, S.; Scholz-Barth, K. Green Roof Systems: A Guide to the Planning, Design, and Construction of Landscapes over Structure; John Wiley & Sons: Hoboken, NJ, USA, 2009. [Google Scholar]
Figure 2.
Study area.

Figure 1.
Study area.

Table 1.
Summary of the analysis scenarios.
| Scenarios | No. of Buildings | Area (m2) | Area (%) | |
|---|---|---|---|---|
| Scenario A | Do nothing alternative | - | - | - |
| Scenario B | Only to public buildings | 201 | 289,259.69 | 10.05 |
| Scenario C | 100% appliance | 19,365 | 2,878,028.64 | 100.00 |
| Scenario D | Public: all; Private: roof area >99 m2 | 7192 | 2,369,965.68 | 82.35 |
| Scenario E | Public: all Private: roof area >99 m2; and <10 years old | 538 | 434,788.33 | 15.11 |
Table 2.
Summary of cost and benefit estimation (unit: KRW).
| Scenario B | Scenario C | Scenario D | Scenario E | |||||
|---|---|---|---|---|---|---|---|---|
| Original Value | Discounted Value | Original Value | Discounted Value | Original Value | Discounted Value | Original Value | Discounted Value | |
| Inspection | 1,813,445,565 | - | 21,186,010,470 | - | 15,674,771,640 | - | 2,717,570,064 | - |
| Construction | 37,969,769,628 | - | 377,785,388,772 | - | 311,094,334,974 | - | 57,072,634,936 | - |
| Maintenance | 3,487,893,342 | 48,035,934,933 | 34,703,269,341 | 477,940,070,000 | 28,577,046,169 | 393,568,551,492 | 5,242,677,671 | 72,203,160,701 |
| Disposal | 2,912,696,900 | 7,315,227,919 | 30,716,886,400 | 95,222,816,171 | 24,418,856,800 | 61,327,872,124 | 4,401,683,290 | 11,054,811,949 |
| Safety Management | 706,237,715 | - | 7,026,808,231 | - | 5,786,354,631 | - | 1,061,551,010 | - |
| Environment | 189,848,848 | - | 1,888,926,944 | - | 1,555,471,675 | - | 285,363,175 | - |
| Carbon Sequestration | 1,536,552,101 | 21,161,689,745 | 15,288,134,184 | 210,551,111,203 | 12,589,295,612 | 173,382,189,635 | 2,309,602,560 | 31,808,288,679 |
| Cooling Energy | 2,832,060 | 39,003,673 | 21,170,778,676 | 291,568,017,492 | 52,904,352 | 728,608,865 | 3,957,528 | 54,503,833 |
| Stormwater Management | 1,106,684,713 | 15,241,473,770 | 11,011,110,123 | 151,647,116,904 | 9,067,301,390 | 124,876,610,865 | 1,663,465,785 | 22,909,569,293 |
| Air Quality | 10,469,656 | 145,489,111 | 105,107,724 | 1,447,563,702 | 86,552,891 | 1,192,022,986 | 15,878,790 | 218,685,733 |
| PM Mitigation | 101,522,938 | 1,398,193,334 | 1,015,229,375 | 13,981,933,338 | 836,041,390 | 11,514,122,104 | 153,401,159 | 2,112,670,127 |
| Rooftop Lifespan | 3,471,116,280 | 47,804,878,023 | 34,536,343,680 | 475,641,137,834 | 28,439,588,160 | 391,675,453,467 | 5,217,459,948 | 71,855,857,391 |
| Urban Aesthetics | 249,433,451 | 3,435,245,240 | 49,433,451 | 3,435,245,240 | 249,433,451 | 3,435,245,240 | 249,433,451 | 3,435,245,240 |
| Urban Comfort & Amenities | 263,390,673 | 3,627,466,775 | 263,390,673 | 3,627,466,775 | 263,390,673 | 3,627,466,775 | 263,390,673 | 3,627,466,775 |
Table 3.
Summary of benefit–cost analysis results (unit: KRW).
| Scenario B | Scenario C | Scenario D | Scenario E | |||||
|---|---|---|---|---|---|---|---|---|
| Original Value | Discounted Value | Original Value | Discounted Value | Original Value | Discounted Value | Original Value | Discounted Value | |
| Total Cost | 47,042,667,878 | 95,993,240,488 | 473,307,290,159 | 981,050,020,588 | 387,106,835,889 | 789,007,356,535 | 70,781,480,145 | 144,395,091,835 |
| Total Benefit | 6,742,001,872 | 92,853,439,670 | 83,639,527,885 | 1,151,899,592,488 | 51,071,683,795 | 703,369,007,922 | 9,363,765,770 | 128,959,575,058 |
| Net Benefit | −40,300,666,006 | −3,139,800,818 | −389,667,762,274 | 170,849,571,900 | −335,522,327,970 | −78,575,636,598 | −60,904,890,252 | −8,372,804,762 |
| Benefit-cost Ratio | 0.967 | 1.174 | 0.900 | 0.942 | ||||
Table 4.
Summary of results obtained from previous studies.
| Authors | City | Method | Lifespan (year) | Results |
|---|---|---|---|---|
| Nurmi et al. (2013) [13] | Helsinki, Finland | BCA | 40 | Public BCR: 0.7 to 1.8 Private BCR: 0.9 to 2.2 |
| Shin & Kim (2015) [7] | Seoul, South Korea | BCA | 20 | BCR: 1.061 to 1.136 |
| Blackhurst et al. [16] | Pittsburgh, US | BCA | 30 | Social BCR: 0.80, Private BCR: 0.023 |
| Mahdiyar et al. [21] | Kuala Lumpur, Malaysia | NPV, IRR, PBP | N/A * | PBP: 3.9 years |
| Perini & Rosasco [18] | Genoa, Italy | NPV, IRR, PBP | N/A * | PBP: 16 years |
| Peng & Jim [19] | Hong Kong | BCA, PBP | 40 | BCR: 3.84. PBP: 6.8 years |
| Bianchini & Hewage [43] | New York, US | NPV, PBP | N/A * | PBP: 4.2 to 4.6 years |
| Feng & Hewage [17] | British Columbia, Canada | NPV, PBP | 40(N/A *) | PBP: 3 to 13 years |
* The payback period method determines the number of years it takes to recover the invested funds, so the time scopes of the analyses are not set beforehand.
© 2019 by the authors. Licensee MDPI, Basel, Switzerland. This article is an open access article distributed under the terms and conditions of the Creative Commons Attribution (CC BY) license (http://creativecommons.org/licenses/by/4.0/).
Share and Cite
MDPI and ACS Style
Shin, E.; Kim, H. Benefit–Cost Analysis of Green Roof Initiative Projects: The Case of Jung-gu, Seoul. Sustainability 2019, 11, 3319. https://doi.org/10.3390/su11123319
AMA Style
Shin E, Kim H. Benefit–Cost Analysis of Green Roof Initiative Projects: The Case of Jung-gu, Seoul. Sustainability. 2019; 11(12):3319. https://doi.org/10.3390/su11123319
Chicago/Turabian StyleShin, Eunha, and Heungsoon Kim. 2019. "Benefit–Cost Analysis of Green Roof Initiative Projects: The Case of Jung-gu, Seoul" Sustainability 11, no. 12: 3319. https://doi.org/10.3390/su11123319
Note that from the first issue of 2016, this journal uses article numbers instead of page numbers. See further details here.