Enhancement of Archaeological Proxies at Non-Homogenous Environments in Remotely Sensed Imagery


Eratosthenes Research Centre, Department of Civil Engineering and Geomatics, Faculty of Engineering and Technology, Cyprus University of Technology, Saripolou 2-8, 3036 Limassol, Cyprus
Sustainability 2019, 11(12), 3339; https://doi.org/10.3390/su11123339
Submission received: 3 June 2019
/
Revised: 11 June 2019
/
Accepted: 12 June 2019
/
Published: 17 June 2019
(This article belongs to the Special Issue Remote Sensing for Archaeology and Cultural Landscapes)
Abstract
:Optical remote sensing has been widely used for the identification of archaeological proxies. Such proxies, known as crop or soil marks, can be detected in multispectral images due to their spectral signatures and the distinct contrast that they provide in relation to the surrounding area. The current availability of high-resolution satellite datasets has enabled researchers to provide new methodologies and algorithms that can further enhance archaeological proxies supporting thus image-interpretation. However, a critical point that remains unsolved is the detection of crop and soil marks in non-homogenous environments. In these areas, interpretation is problematic even after the application of sophisticated image enhancement analysis techniques due to the mixed landscape and spectral confusion produced from the high-resolution datasets. To overcome this problem, we propose an image-based methodology in which the vegetation is suppressed following the “forced invariance” method and then we apply a linear orthogonal transformation to the suppressed spectral bands. The new Red–Green–Blue (RGB) image corresponds to a new three-band spectral space where the three axes are linked with the crop mark, vegetation, and soil components. The study evaluates the proposed approach in the archaeological site of “Nea Paphos” in Cyprus using a WorldView-2 multispectral image aiming to overcome the limitations of the mixed environments.
1. Introduction
The use of high-resolution satellite imagery has been widely exploited in the past for the detection of archaeological proxies [1,2,3,4,5,6,7,8]. The sub-meter resolution of satellite images has enabled researchers to work with a scale similar to actual archaeological research needs, thus supporting archaeo–landscape investigations. While the sub-meter pixel size has allowed even for the semi-automatic detection of archaeological proxies in the form of soil or crop marks [9,10,11,12,13], such fine datasets might suffer from other issues. The latest are already well known in remote sensing processing, such as the case of classification performance (e.g., the “salt and pepper” phenomenon) [14], while in general high-resolution datasets can enhance noise in any pixel-based analysis (including also noise due to radiometric errors and atmospheric effects, see [15,16]).
Spectral anomalies (in terms of reflectance) of soil or vegetation can be linked to the presence of buried archaeological remains. These archaeological proxies are mentioned in the literature as soil and crop marks, and they can be depicted from multispectral datasets due to their different spectral signature in comparison to the surrounding area. In homogeneous environments such as agricultural fields, crop marks can be recognized in the near-infrared and red edge zone of the spectrum since they usually provide lower or higher (negative and positive crop marks, respectively) reflectance in comparison with the healthy crops. To support these investigations, several image processing methods have been implemented or developed in the past to enhance the contrast of archaeological proxies and therefore make the interpretation easier. For instance, [17] have used vegetation indices and principal component analysis (PCA) to detect crop marks in the area of Llanera in Spain based on the combined use of data from the WorldView-2 satellite sensor as well as other Red–Green–Blue (RGB) and near infrared images from cameras mounted on an unmanned aerial vehicle (UAV). Various multispectral and hyperspectral vegetation indices were also investigated by [18,19] to evaluate their performance for the detection of crop marks while other researchers have worked with image processing techniques for hyperspectral datasets [20,21].
Other researchers [22] have introduced linear orthogonal equations, which aim to transform the initial n-dimensional spectral space into a new 3D spectral space. The first axis of this new 3D spectral space corresponds to the so called “crop mark component”, the second axis to the “vegetation component” and the third axis to the “soil component”. The proposed transformation is easily applicable at any medium and high spatial resolution multispectral dataset as it is a linear combination of the initial spectral bands.
The importance of such enhancement algorithms, which can improve recognition and identification through contrast enhancement, has been already highlighted by [23], who reported, however, that remote sensed algorithms might “only work within a consistent background environment and for a specific form of archaeological residue” [23]. Indeed, the results of all the above-mentioned image analysis techniques in non-homogeneous environments where the background information of the image is mixed with different types of vegetation and soil contrast the results are generally quite poor. This is due to the fact that the local contrast of archaeological proxies, as observed in high resolution images, is lost since image noise effectively increases the heterogeneity of local spectra of all targets. To overcome this problem, vegetation reflectance needs to be suppressed based on local (region) properties.
Vegetation suppression is well documented in literature mainly for geological applications (lithology) from optical satellite images. Researchers in [24] have proposed the “forced invariance” method, which can subdue the expression of vegetation and enhance the expression of the background information of an image. Their work has been further improved by [25], following masking techniques. The “forced invariance” method utilizes band statistics and it is implemented in the following steps (see more details in [24,25]): Step 1: image atmospheric correction (darkest pixel method); Step 2: vegetation index calculation (NDVI); Step 3: assessment of the statistical relationship between the NDVI and the digital number (DN) values for each band; Step 4: estimation of the best-fit smooth curve between the NDVI and the DN values; and Step 5: selection of a target average DN value and then shifting the pixel image values (for each vegetation index level) so as the best-fit smooth curve will fit the target DN.
This study proposes an image-based approach based on the fundamental work of [22,24] which can enhance archaeological proxies (crop and soil marks) in mixed environments, overcoming thus a current limitation in remote sensing archaeological research. For the aims of the study, a high-resolution image was used while a UNESCO World Heritage site in Cyprus was examined. The datasets and methods followed are presented below as well as the results and the final conclusions.
2. Case Study and Methods
2.1. The Archaeological Site of “Nea Paphos”
The archaeological site of “Nea Paphos”, located at the western part of the island of Cyprus, was selected as the case study for this research (Figure 1). The site is placed just on the outskirts of the modern city of Paphos and it is considered as the most visited site of the island, with more than 200,000 visitors annually. In 1980, the site was inscribed on the World Heritage List of UNESCO owing to its unique archaeological wealth.
According to written sources, the town of “Nea Paphos” was founded at the end of the 4th century, while in the beginning of the 3rd century B.C., when Cyprus became part of the Ptolemaic kingdom, the site became the center of the Ptolemaic administration on the island. Until the end of the 2nd century B.C., “Nea Paphos”, the capital of the island, was one of the most important political and economic centers of the region. It remained the capital of Cyprus until the 4th century A.D. After the Arab raids of the middle of the 7th century, “Nea Paphos” went through a period of decline, while it regained some of its importance during the Byzantine and the Medieval periods but from the Venetian period onwards the coastal settlement of the site was abandoned and the population began to move further inland where the present town of “Paphos” developed [26].
2.2. Landscape Fragmentation
At the site of “Nea Paphos” several local and foreign excavations have been made in the past, revealing aspects of the ancient town, while other buried archaeological features remain well hidden below the surface. These features can be partially exposed as crop or soil marks in aerial and satellite images. While buried remains in the archaeological site of “Nea Paphos” can be found at a relatively low depth beneath the topsoil, their detection is limited due to the fragmentary landscape. Within the site, beyond the already visible monuments and mosaics, other features from on-going excavations activities are also part of the landscape, such as the archaeological trenches and excavated soil, and in proximity to the excavated areas, old trenches which have been re-filled, mosaics which have been protected from the atmosphere and weather conditions and have been carefully covered etc. Moreover, different local bushes and shrubs are found in various parts of the site, while in other parts no vegetation cover is observed.
These features are placed within the protected area of “Nea Paphos”, creating thus various reflectance spectral signatures which can be depicted in high-resolution remote sensing images. For instance, as shown in Figure 2, the image segmentation of the normalized difference vegetation index (NDVI) map from the central part of the site (area in red rectangle indicated in Figure 1, left), can provide various “objects” (segments) of different area and shape characteristics. For instance, Figure 2b presents the image segmentation of the NDVI, differently colored based on the estimated area, or roundness score of each segment (Figure 2c) or the standard deviation of each segment (Figure 2d). As shown in Figure 2, the already excavated and visible archaeological site, is depicted as a homogenous area since it is clustered in the same segment. In contrast, the surrounding—non excavated part of the site—provided several small segments due to the various and scattered spectral properties of the area.
If we “minimize” the fragmental noise of the image which prohibits virtual interpretation of the site, then we can assist in a more objective interpretation towards the detection of archaeological proxies. For this reason, a specific methodology, shown in the next sub-section, was developed, implemented, and presented in Section 3.
2.3. Methodology
For the needs of the study, a high-resolution WorldView-2 image was used. The WorldView-2 sensor can provide high resolution panchromatic band of 0.46 m and eight multispectral bands at a resolution of 2 m. The image was acquired on 10 May over the archaeological site with clear sky conditions. The overall methodology is composed of three steps, after the necessary pre-processing steps, which include geometric and radiometric (with atmospheric) corrections:
- Step 1: image pan-sharpening of the multispectral bands with the panchromatic band.
- Step 2: vegetation suppression based on the force invariance method.
- Step 3: orthogonal equations providing a new 3D spectral space.
These steps are discussed in more detail below. Once the image data was collected, the multispectral WorldView-2 image was pansharpened in the Environment for Visualizing Images (ENVI) image analysis software using the Gram–Schmidt method (Step 1) [27]. The new pansharpened image is a multispectral image with a resolution of 0.46 m. Then, we implemented the “force invariance” method to suppress vegetation reflectance. The method implements first a curve flattening of the normalized difference vegetation index (NDVI) values to a target value so as to remove contrast due to vegetation (Step 2). Therefore, the new pixel values are given from the following equation:
where P new is the new pixel value of the WorldView-2 multispectral image, P original is the original pixel value, P target is the band-wise target value and P NDVI is the corresponding NDVI value. In this study, the mean value of each band was considered as P target as follow: for Band 1 P target = 280, for Band 2 P target = 366, for Band 3 P target = 194 and for Band 4 P target = 268. Then a histogram equalization was applied. More details regarding the force invariance method can be found in [24,25]. Once the multispectral image was processed then the linear orthogonal equations proposed in [22] were applied to extract a new 3-D spectral band, which enhanced crop marks, vegetation and soil (Step 3). The equations for each band are provided below (Equations (2)–(4)):
where refers to the reflectance (ρ) of the blue band (band 1), refers to the reflectance (ρ) of the green band (band 2), refers to the reflectance (ρ) of the red band (band 3) and refers to the reflectance (ρ) of the near infrared (NIR) band (band 4). The coefficients of these linear equations were estimated based on a series of phenological spectral signatures over crop marks, vegetation and soil targets (see more in [22]). In that study, [22], the hyperspectral spectroradiometric datasets where resampled using the relative spectral response (RSR) filters of the WordlView-2 sensor, followed by a principal component analysis (PCA) in order to create the initial eigenspace. The final step included the rotation of the first three principal components (PC1–PC3) to the new axis: crop mark; vegetation and soil components.
P new = P original × (P target/P NDVI)
3. Results
This section provides the results as derived from the implementation of the proposed approach. We present results from the Step 1 (image pan-sharpening), then we demonstrate outcomes from Step 2 (vegetation suppression), and we end with the final images from Step 3 (orthogonal equations).
3.1. Step 1: Gram-Schmidt Pan-Sharpening
Once the multispectral WorldView-2 image was acquired at a resolution of 2 m, the Gram–Schmidt pan-sharpening technique was implemented using the panchromatic band of 0.46 m as the high-resolution image. The results of this analysis are shown in Figure 3. The multispectral WorldView-2 image of the site at the NIR-R-G composite is shown in Figure 3a; the panchromatic band of the WorldView-2 in Figure 3b and the pansharpened WorldView-2 image in Figure 3c. Details of these images are visible in Figure 3d–f, respectively. If we compare the results of Figure 3d,f we can observe that some blurry linear features of Figure 3a,d are becoming visible in the pansharpened image (Figure 3c,f, see arrows). As the spatial resolution is improved, the various features of the archaeological site are becoming more visible. These strong evidence linear features are becoming visible only after the pan-sharpening technique. Due to their size and sharp contrast, these features are also visible in other high-resolution images such as the compressed RGB images found in Digital Globes (e.g., Google Earth, 9 December 2017).
3.2. Step 2: Vegetation Suppression
After the pan-sharpening processing, the next step was focused on the removal of the contrast of the vegetation. Hence, the “force invariance” method was implemented to suppress the vegetation reflectance. As mentioned before, the vegetation suppression was performed using the NDVI value. It should be stressed that this processing is not just the subtraction of a single value from all pixels of the image, but it is a proportional subtraction based on the NDVI profile of each pixel. Therefore, some pixels are becoming more suppressed in contrast to some others based on their pixel-based vegetation characteristics (i.e., NDVI values).
After the scatterplot of the multispectral bands against NDVI was plotted, repetitive curve fittings were estimated to remove high and low peaks of the plots. In Figure 4, we present the example from the scatterplot of the blue band (Band 1) against NDVI from rougher curve fitting (Figure 4a) to smoother curve fitting (Figure 4c).
Figure 5 presents the results after the vegetation suppression implementation. Figure 5 shows an example from the southern part of the archaeological site, before and after the vegetation suppression. The results are visualized in the NIR-R-G pseudo composite. As shown in Figure 5 (bottom), healthy vegetation tends to give high reflectance in the near-infrared part of the spectrum, which is visualized as red in the specific pseudo composite. The vegetation is found scattered in the whole area, thus limiting photointerpretation. In contrast, the force invariant image (Figure 5, top) displays a clearer view of the area, allowing easier detection of archaeological proxies (i.e., elliptical shape and linear features, indicated with arrows in Figure 5, top).
3.3. Step 3: Orthogonal Equations
The final step of the proposed methodology comprises the implementation of the orthogonal equations as proposed for the specific WorldView-2 sensor by [22]. With the application of these equations, the n-multispectral space of the WordView-2 image is transformed into a new 3D orthogonal space with the new axes as follow: (a) crop mark component; (b) vegetation component and (c) soil component.
The results from this step are presented in the Figure 6(top) and Figure 7(top) for the western and northern parts of the archaeological site of “Nea Paphos”, respectively. For evaluation purposes the same area is also shown at the pan-sharpen WorldView-2 image in Figure 6(bottom) and Figure 7(bottom). These images demonstrate that the new RGB pseudo composite, derived from the orthogonal equations (whereas red band is for “crop mark component”; green band is for “vegetation component” and blue band is for “soil component”), can enhance archaeological proxies that are saturated from the vegetation reflectance. For example, in Figure 7, the vegetation spectral signature dominates the contrast of the background soil and therefore limits the visual interpretation of the area. In contrast, some linear features can be observed, and these are indicated with yellow arrows in Figure 6. Similar results are also reported from the northern area of the archaeological site, these are shown in Figure 7.
4. Discussion
The proposed methodology presented in the previous section provided a framework where archaeological proxies can be enhanced in mixed environments, thus providing a much clearer view of the site for further image landscape investigation. As the results have demonstrated, the “force invariance” method followed by the application of orthogonal equations can minimize “noise” and therefore enhance the contrast of the archaeological proxies.
Figure 8 presents the normalized results (values range 0–1) from the comparison between the orthogonal equations with and without the implementation of the ‘force invariance’ method. This comparison was based on the following equation providing the percentage difference of the two images:
Whereas refers to the three components of the orthogonal equations (crop mark; vegetation and soil components) after the vegetation suppression, while refers to the three components of the orthogonal equations without the vegetation suppression process. Pixels with value close to zero mean that the image after the suppression is like the image without the suppression, while pixels with value close to one mean that there is a significant difference between these two images.
An interesting part from this evaluation is the capability of the force invariance method to remove the vegetation reflectance and highlight archaeological proxies: the differences between the subtraction with and without vegetation suppression is not uniform for all orthogonal components (Figure 8a–c). On the contrary, these differences are fluctuated based on the vegetation reflectance. It is therefore able to minimize the vegetation noise in areas where there is healthy vegetation (see darkest tones of grey on Figure 8a–c), whereas in areas that there is no vegetation coverage, the vegetation suppression is limited (see lighter tones of grey in Figure 8a–c). This allows better enhancement of the archaeological proxies, as this is evident from an elliptical shape detected in all orthogonal components.
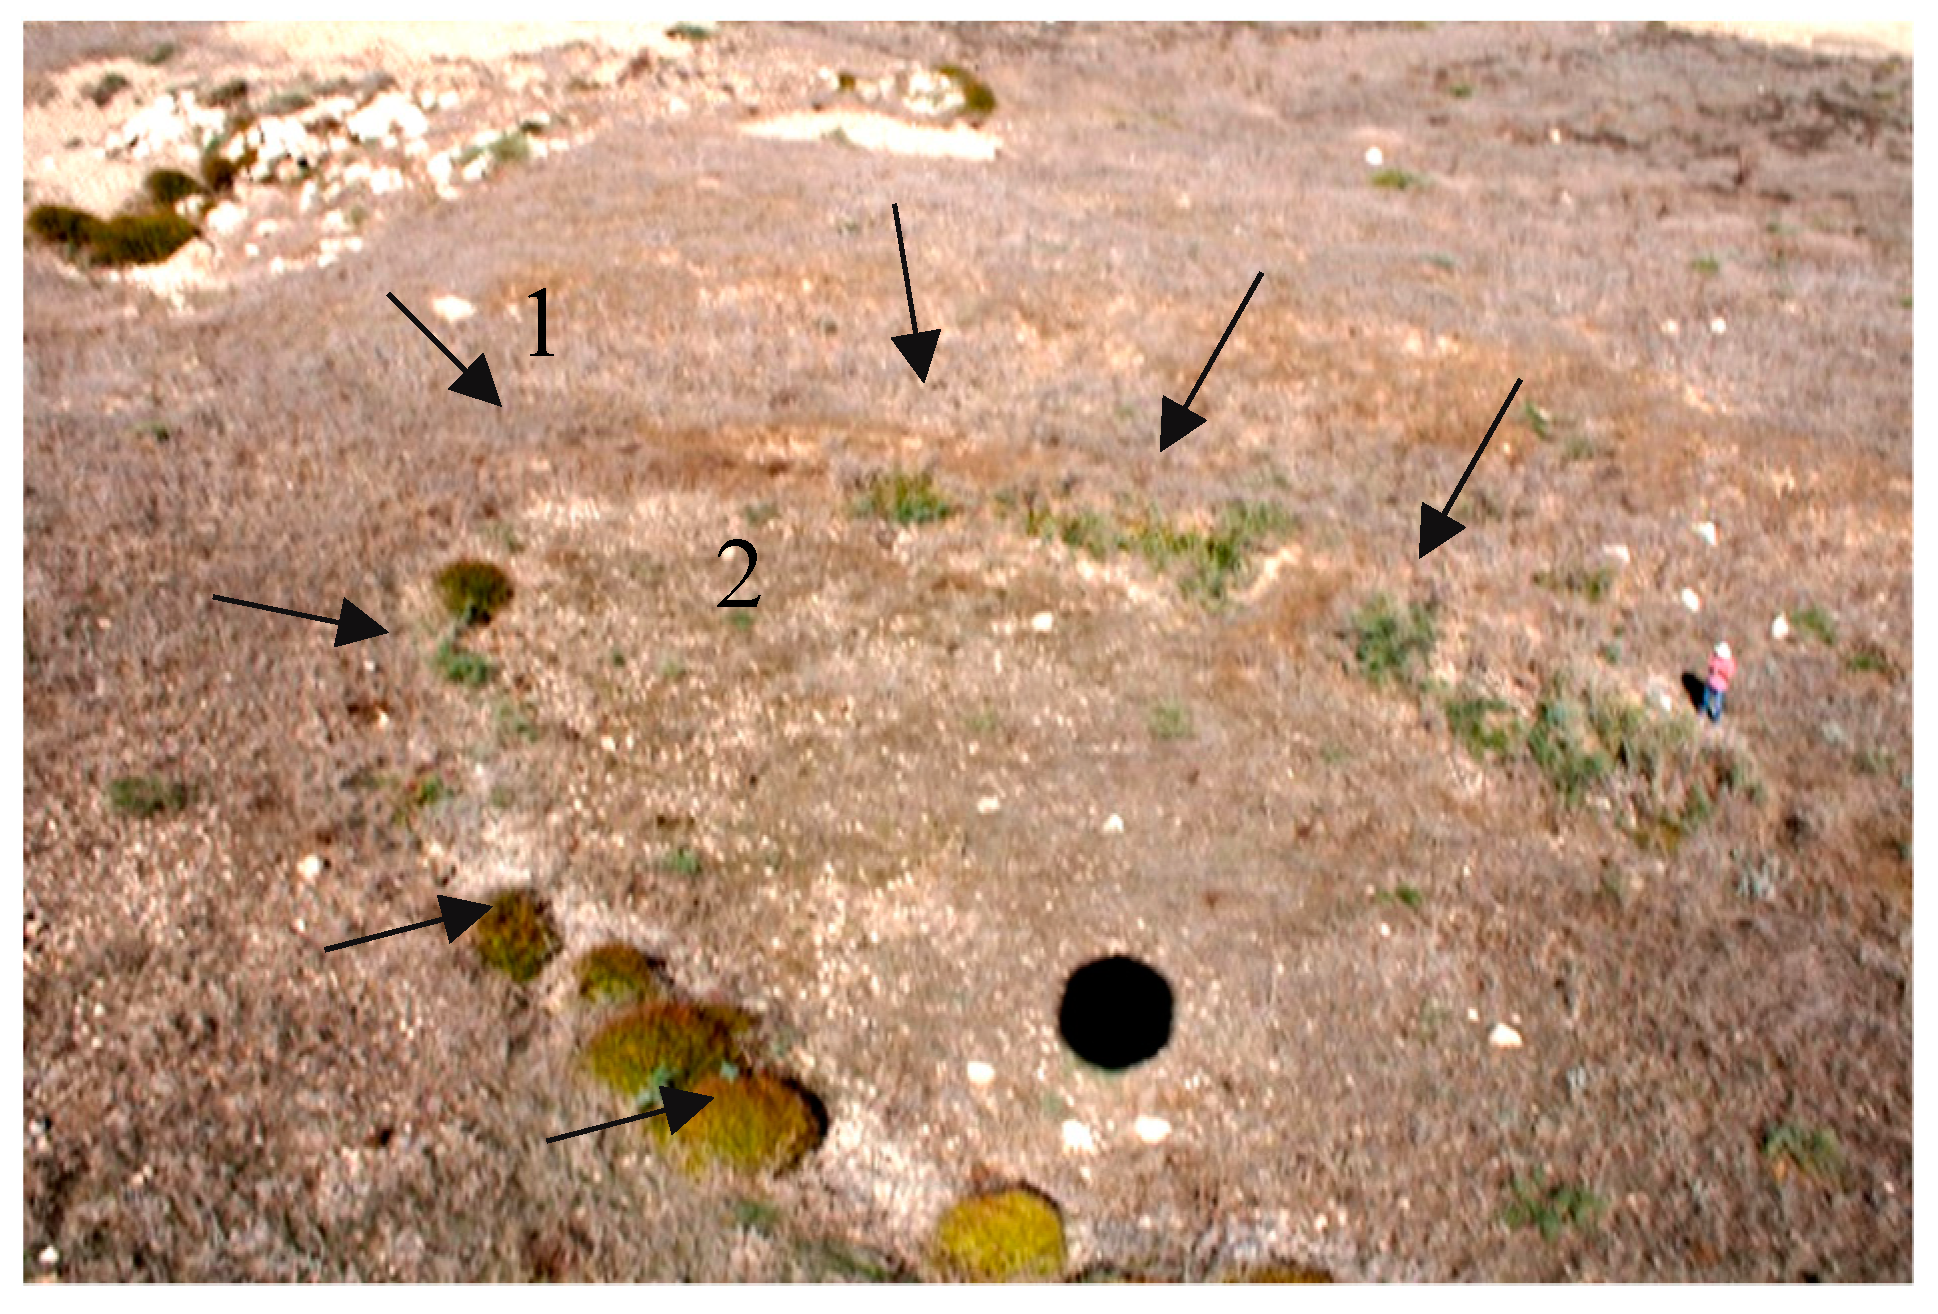
To further evaluate the results, vertical profiles over archaeological proxies have been created. Figure 9 presents an archaeological proxy with an elliptical shape (see Figure 1, area a), as depicted in: crop mark component (Figure 9a), vegetation component (Figure 9b), soil component (Figure 9c), NDVI (Figure 9d); blue band (Figure 9e), green band (Figure 9f), red band (Figure 9g) and NIR band (Figure 9h). The images are shown with same histogram enhancement techniques. The elliptical shape with dimensions of approximately 60 × 40 m, recalls the shape of an amphitheater, but this still needs to be confirmed by the archaeological excavations in the future.
Regarding the visual interpretation, it is clear that both the NDVI and NIR images (Figure 9d,h) are saturated due to the presence of the healthy vegetation which dominates the archaeological proxy. In contrary the rest of the grayscale images provide a relatively clear view of this elliptical feature. Crop mark and vegetation components (Figure 9a,b) are the best images for interpretation as they provide sharp contrast between the archaeological proxy and the surrounding area. In contrast, the soil component (Figure 9c) and the red band images (Figure 9g) are slightly blurred but still they can provide a much clearer view of the area in comparison to the NDVI and NIR images (Figure 9d,h).
A line of approximately 100 m, which crosses the elliptical shape was drawn and shown in Figure 9a (line A–B, with 1–4 points). These points fall over the remnants of the elliptical archaeological structure and have a distinctive spectral response. The results from Figure 9a,b,d are shown in Figure 10. The vertical profile indicates that the visual inspection results are aligned with this graph, since both crop mark and vegetation components (Figure 9a,b) tend to give higher contrast (see the peaks at 1–4 in comparison with the minimum values observed just before and after of the points) and therefore support interpretation. In contrast, the NDVI profile does not highlight the elliptical shape since the relative differences between that proxy and the background soil are less.
This spectral behavior, especially at the points which fall over the remnants of the elliptical archaeological structure, is also linked with the micro-topography of the area. As shown in Figure 11, there is a small height difference of approximately 5 m (3 m a.s.l. at the center of the elliptical shape and 8 m a.s.l. at the outer areas of the feature). The outer and inner outlines of the elliptical shape (i.e., points 1–2 and 3–4) are also shown in Figure 11, while more details regarding the geometry of this feature can be found in [28].
5. Conclusions
The enhancement of archaeological proxies observed in high resolution satellite images is important for archaeo-landscape studies. While various image-based enhancement techniques have been reported in the past with success, their implementation relies on the homogeneity of the landscape. In areas where the landscape is fragmented, such an approach tends to give poor results.
In order to overcome this problem, we proposed here a methodology that suppresses vegetation based on the “force invariance” method and then we applied the linear orthogonal transformation to enhance these proxies. The results have shown that the proposed methodology can indeed further support visual interpretation since the vegetation reflectance is suppressed, thus allowing the interpretation of the background information. This specific approach is not just a simple subtraction of a specific value, but it is adopted to the specific characteristics of the area (pixel-based). In order to support the visual interpretation, we firstly implemented the Gram–Schmidt pan-sharpening technique so to increase the spatial resolution of the datasets.
Of course, the overall results remain to be confirmed with archaeological research conducted in the area. This is usually achieved in terms of large landscape investigations, whereas other geospatial datasets such as archive images and maps can support the interpretation of the image and provide archaeological meaning to the detected archaeological proxies. However, as [29] argue, remote sensed methodologies, as those proposed in this study, required the “the development of experience and trust in interpreting RS (remote sensing) data”. Therefore, the exploitation of remote sensed images, and in general other non-contact remote sensing techniques such as geophysical prospection, are essential for a better understanding of the landscape.
In a case where the area of interest is considered homogenous this method is not necessary, only in cases which might require the identification of soil marks in cultivated homogenous areas. In the near future we will further investigate ways in which we can further improve algorithms for such difficult environments.
Funding
The results are part of the project “Synergistic Use of Optical and Radar data for cultural heritage applications”, (PLACES), with grant number CULTURE/AWARD-YR/0418/0007 funded by the Republic of Cyprus.
Acknowledgments
The author would like to thank the Eratosthenes Research Centre of the Department of Civil Engineering and Geomatics at the Cyprus University of Technology for its support. The author would also like to thank the Cyprus University of Technology Open Access Author Fund (Remedica Open Access Author Fund) that covered the open access publication fees.
Conflicts of Interest
The author declares no conflict of interest.
References
- Luo, L.; Wang, X.; Lasaponara, R.; Xiang, B.; Zhen, J.; Zhu, L.; Yang, R.; Liu, D.; Liu, C. Auto-Extraction of Linear Archaeological Traces of Tuntian Irrigation Canals in Miran Site (China) from Gaofen-1 Satellite Imagery. Remote Sens. 2018, 10, 718. [Google Scholar] [CrossRef]
- Sarris, A.; Papadopoulos, N.; Agapiou, A.; Salvi, M.C.; Hadjimitsis, D.G.; Parkinson, A.; Yerkes, R.W.; Gyucha, A.; Duffy, R.P. Integration of geophysical surveys, ground hyperspectral measurements, aerial and satellite imagery for archaeological prospection of prehistoric sites: The case study of Vészt˝o-Mágor Tell, Hungary. J. Archaeol. Sci. 2013, 40, 1454–1470. [Google Scholar] [CrossRef]
- Keay, S.J.; Parcak, S.H.; Strutt, K.D. High resolution space and ground-based remote sensing and implications for landscape archaeology: The case from Portus, Italy. J. Archaeol. Sci. 2014, 52, 277–292. [Google Scholar] [CrossRef]
- Agapiou, A.; Lysandrou, V. Remote Sensing Archaeology: Tracking and mapping evolution in scientific literature from 1999–2015. J. Archaeol. Sci. Rep. 2015, 4, 192–200. [Google Scholar] [CrossRef]
- Lasaponara, R.; Leucci, G.; Masini, N.; Persico, R. Investigating archaeological looting using satellite images and GEORADAR: The experience in Lambayeque in North Peru. J. Archaeol. Sci. 2014, 42, 216–230. [Google Scholar] [CrossRef]
- De Laet, V.; Paulissen, E.; Waelkens, M. Methods for the extraction of archaeological features from very high-resolution Ikonos-2 remote sensing imagery, Hisar (southwest Turkey). J. Archaeol. Sci. 2007, 34, 830–841. [Google Scholar] [CrossRef]
- Ricchetti, E. Application of optical high resolution satellite imagery for archaeological prospection over Hierapolis (Turkey). In Proceedings of the IGARSS 2004. 2004 IEEE International Geoscience and Remote Sensing Symposium, Anchorage, AK, USA, 20–24 September 2004; Volume 6, pp. 3898–3901. [Google Scholar] [CrossRef]
- Barone, P.M.; Scardozzi, G. Optical high-resolution satellite imagery for the study of the ancient quarries of Hierapolis. In Ancient Quarries and Building Sites in Asia Minor. Research on Hierapolis in Phrygia and Other Cities in South-Western Anatolia: Archaeology, Archaeometry, Conservation; Ismaelli, T., Scardozzi, G., Eds.; Edipuglia: Bari, Italy, 2016; pp. 657–668. [Google Scholar]
- Aqdus, S.A.; Hanson, W.S.; Drummond, J. The potential of hyperspectral and multi-spectral imagery to enhance archaeological cropmark detection: A comparative study. J. Archaeol. Sci. 2012, 39, 1915–1924. [Google Scholar] [CrossRef]
- Agapiou, A.; Lysandrou, V.; Lasaponara, R.; Masini, N.; Hadjimitsis, D.G. Study of the Variations of Archaeological Marks at Neolithic Site of Lucera, Italy Using High-Resolution Multispectral Datasets. Remote Sens. 2016, 8, 723. [Google Scholar] [CrossRef]
- Luo, L.; Wang, X.; Guo, H.; Lasaponara, R.; Shi, P.; Bachagha, N.; Li, L.; Yao, Y.; Masini, N.; Chen, F.; et al. Google Earth as a Powerful Tool for Archaeological and Cultural Heritage Applications: A Review. Remote Sens. 2018, 10, 1558. [Google Scholar] [CrossRef]
- Lasaponara, R.; Masini, N. Detection of archaeological crop marks by using satellite QuickBird multispectral imagery. J. Archaeol. Sci. 2007, 34, 214–221. [Google Scholar] [CrossRef]
- Rowlands, A.; Sarris, A. Detection of exposed and subsurface archaeological remains using multi-sensor remote sensing. J. Archaeol. Sci. 2007, 34, 795–803. [Google Scholar] [CrossRef]
- Huang, F.; Yu, Y.; Feng, T. Automatic extraction of impervious surfaces from high resolution remote sensing images based on deep learning. J. Vis. Commun. Image Represent. 2019, 58, 453–461. [Google Scholar] [CrossRef]
- Agapiou, A.; Hadjimitsis, D.G.; Papoutsa, C.; Alexakis, D.D.; Papadavid, G. The Importance of Accounting for Atmospheric Effects in the Application of NDVI and Interpretation of Satellite Imagery Supporting Archaeological Research: The Case Studies of Palaepaphos and Nea Paphos Sites in Cyprus. Remote Sens. 2011, 3, 2605–2629. [Google Scholar] [CrossRef] [Green Version]
- Hadjimitsis, D.; Themistocleous, K.; Agapiou, A.; Clayton, C. Monitoring Archaeological Site Landscapes in Cyprus Using Multi-Temporal Atmospheric Corrected Image Data. Int. J. Arch. Comput. 2009, 7, 121–138. [Google Scholar] [CrossRef]
- Calleja, J.F.; Pagés, O.R.; Díaz-Álvarez, N.; Peón, J.; Gutiérrez, N.; Martín-Hernández, E.; Relea, A.C.; Melendi, D.R.; Álvarez, P.F. Detection of buried archaeological remains with the combined use of satellite multispectral data and UAV data. Int. J. Appl. Earth Obs. Geoinf. 2018, 73, 555–573. [Google Scholar] [CrossRef]
- Cerra, D.; Agapiou, A.; Cavalli, R.M.; Sarris, A. An Objective Assessment of Hyperspectral Indicators for the Detection of Buried Archaeological Relics. Remote Sens. 2018, 10, 500. [Google Scholar] [CrossRef]
- Agapiou, A.; Hadjimitsis, D.G.; Alexakis, D.D. Evaluation of Broadband and Narrowband Vegetation Indices for the Identification of Archaeological Crop Marks. Remote Sens. 2012, 4, 3892–3919. [Google Scholar] [CrossRef] [Green Version]
- Bassani, C.; Cavalli, R.M.; Goffredo, R.; Palombo, A.; Pascucci, S.; Pignatti, S. Specific spectral bands for different land cover contexts to improve the efficiency of remote sensing archaeological prospection: The Arpi case study. J. Cult. Herit. 2009, 10, e41–e48. [Google Scholar] [CrossRef]
- Cavalli, R.M.; Colosi, F.; Palombo, A.; Pignatti, S.; Poscolieri, M. Remote hyperspectral imagery as a support to archaeological prospection. J. Cult. Herit. 2007, 8, 272–283. [Google Scholar] [CrossRef]
- Agapiou, A.; Alexakis, D.D.; Sarris, A.; Hadjimitsis, D.G. Orthogonal Equations of Multi-Spectral Satellite Imagery for the Identification of Un-Excavated Archaeological Sites. Remote Sens. 2013, 5, 6560–6586. [Google Scholar] [CrossRef] [Green Version]
- Beck, A. Archaeological Site Detection: The Importance of Contrast. In Proceedings of the Annual Conference of the Remote Sensing and Photogrammetry Society, Newcastle, UK, 11–14 September 2007. [Google Scholar]
- Crippen, R.; Blom, R. Unveiling the Lithology of Vegetated Terrains in Remotely Sensed Imagery. Photogramm. Eng. Remote Sens. 2006, 67, 935–943. [Google Scholar]
- Yu, L.; Porwal, A.; Holden, E.-J.; Dentith, M.C. Suppression of vegetation in multispectral remote sensing images. Int. J. Remote Sens. 2011, 32, 7343–7357. [Google Scholar] [CrossRef]
- Department of Antiquities—Nea Pafos. Available online: http://www.mcw.gov.cy/mcw/DA/DA.nsf/All/3E6F75C4C00DF59742257A78002615D2?OpenDocument (accessed on 2 June 2019).
- Li, H.; Jing, L.; Tang, Y.; Passaro, V.M.N. Assessment of Pansharpening Methods Applied to WorldView-2 Imagery Fusion. Sensors 2017, 17, 89. [Google Scholar] [CrossRef] [PubMed]
- Agapiou, A.; Hadjimitsis, D.; Alexakis, D.; Themistokleous, K.; Cuca, B. Integrated method for tracking changes in archeolandscapes using remote and close-range technologies: Monitoring of change and risk assessment methodologies. In Proceedings of the 2013 Digital Heritage International Congress (DigitalHeritage), Marseille, France, 28 October–1 November 2013; pp. 231–234. [Google Scholar] [CrossRef]
- Banaszek, Ł.; Cowley, D.C.; Middleton, M. Towards National Archaeological Mapping. Assessing Source Data and Methodology—A Case Study from Scotland. Geosciences 2018, 8, 272. [Google Scholar] [CrossRef]
Figure 1.
The archaeological site of “Nea Paphos”, located in the western part of Cyprus in the Paphos District. The site is placed in the western outskirts of the modern city of Paphos.
Figure 1.
The archaeological site of “Nea Paphos”, located in the western part of Cyprus in the Paphos District. The site is placed in the western outskirts of the modern city of Paphos.
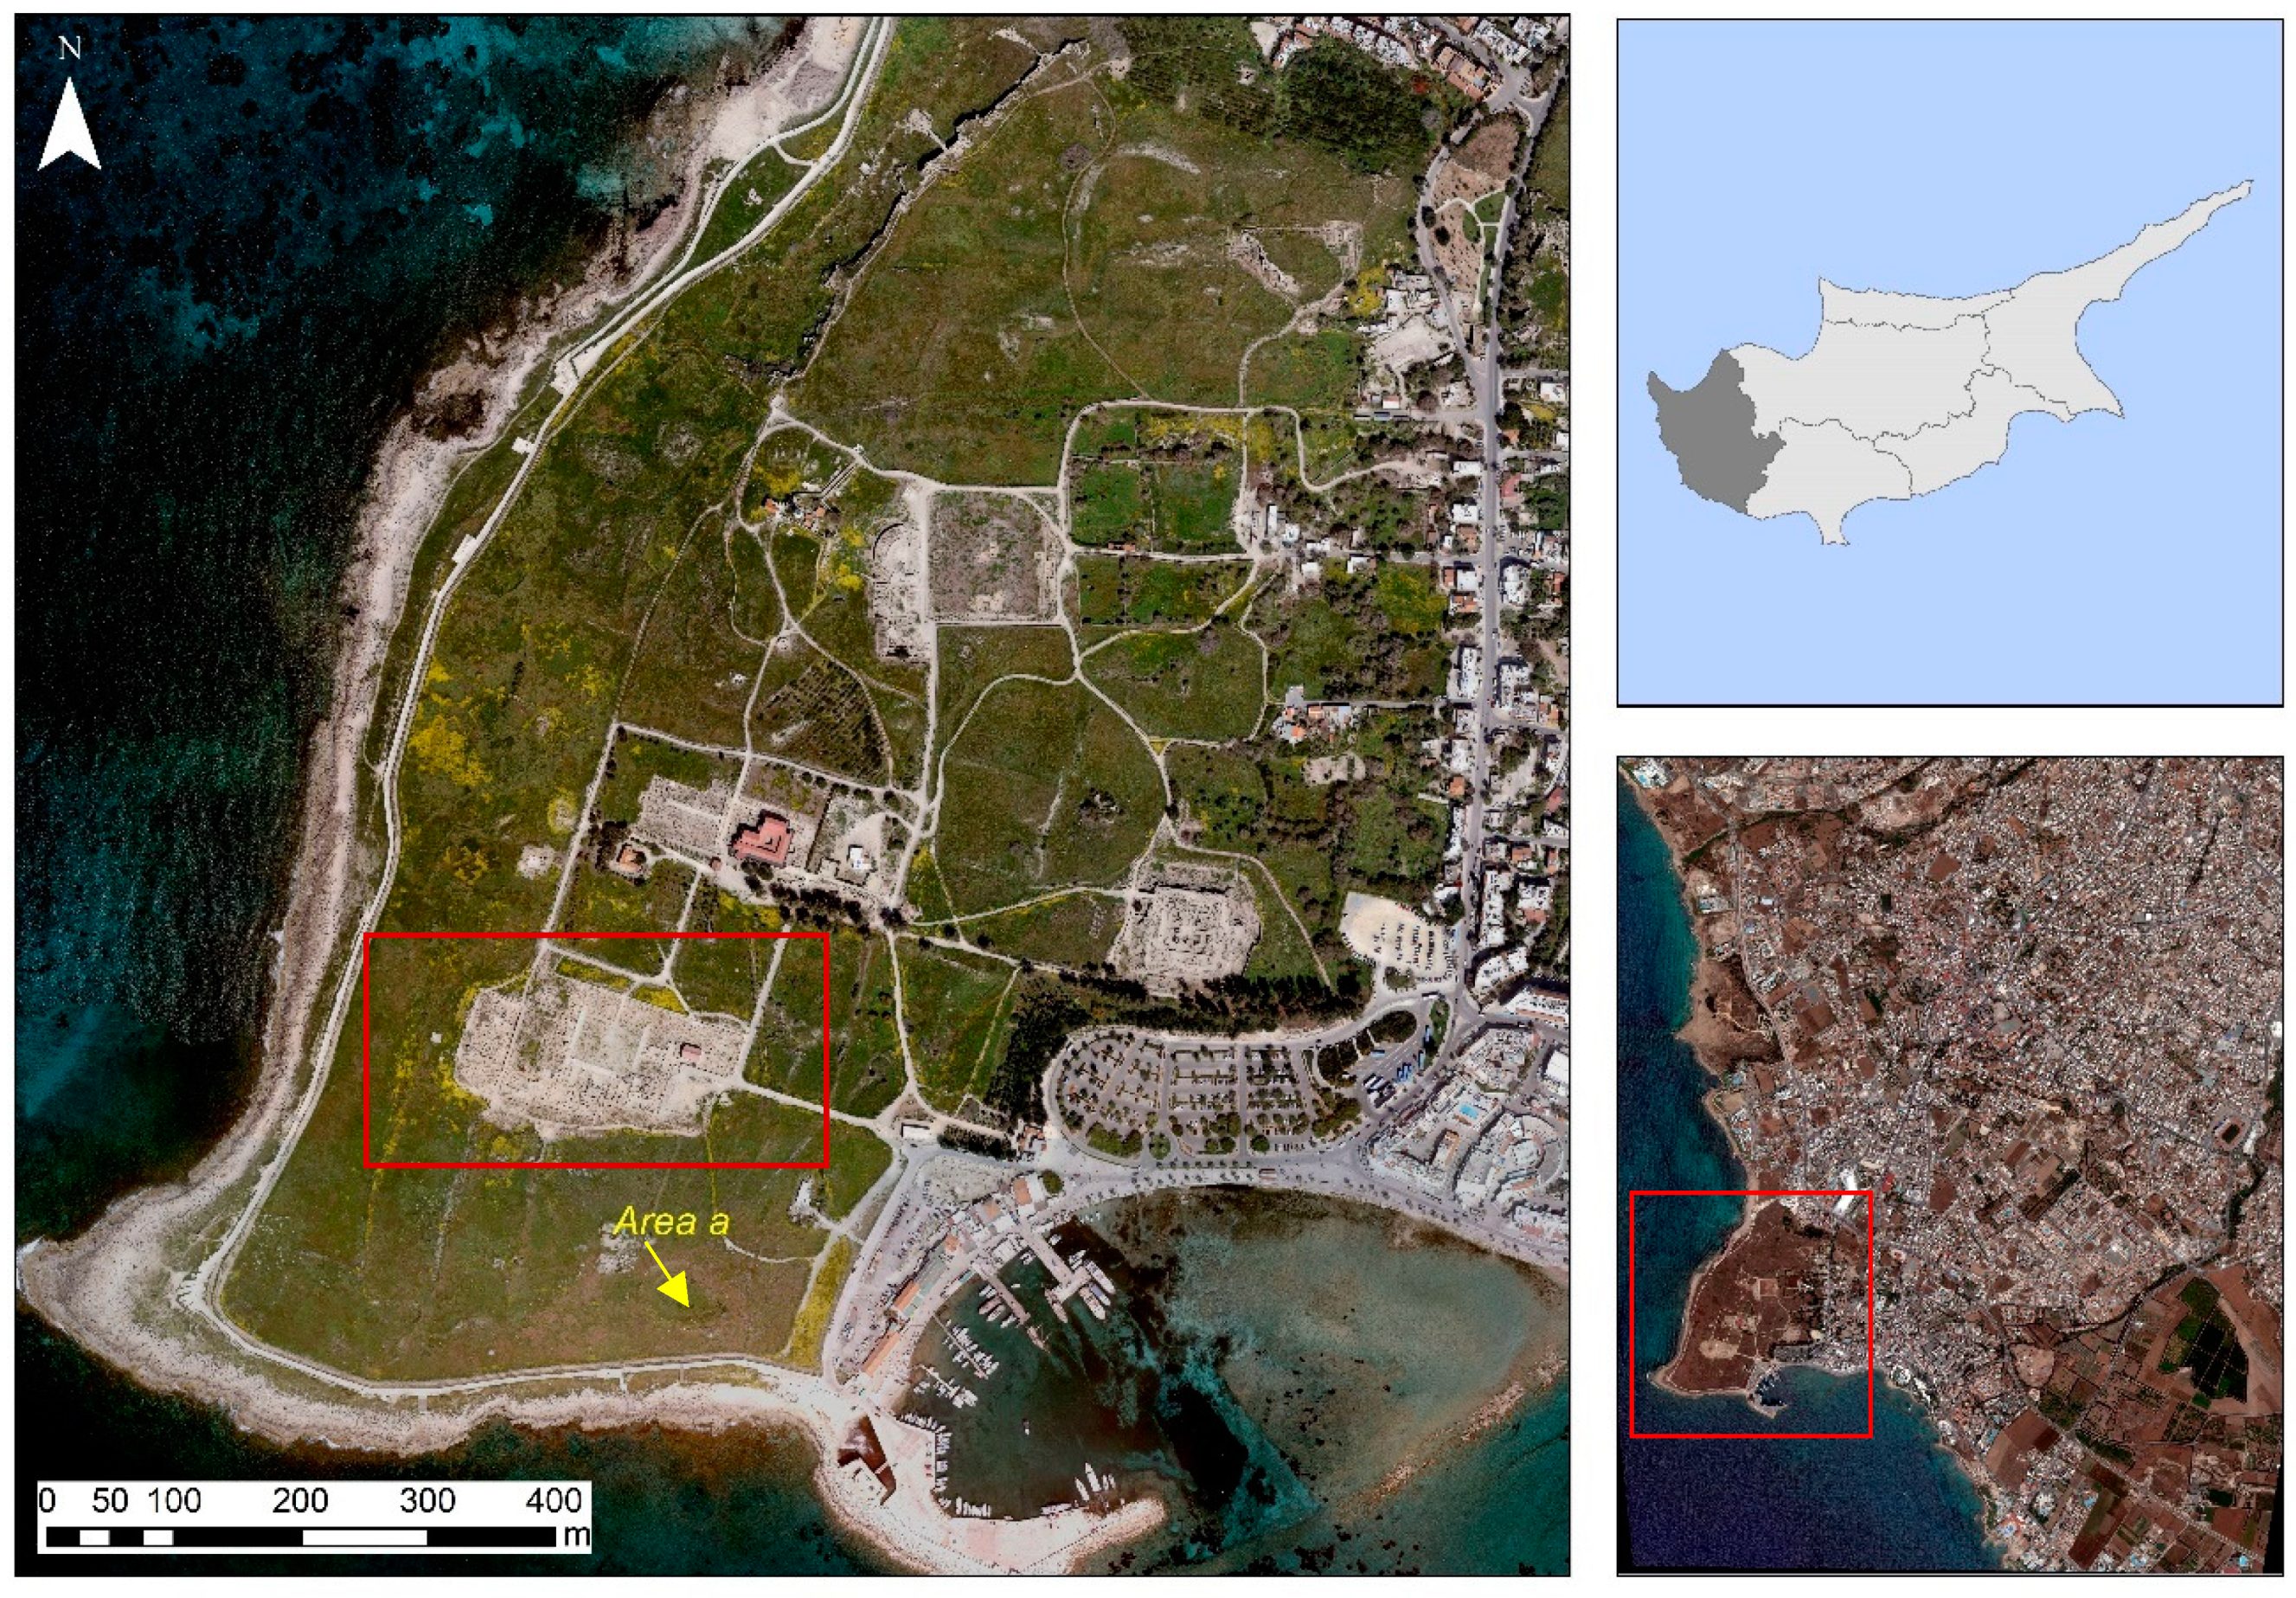
Figure 2.
(a) Normalized difference vegetation index (NDVI) map at the southern part of the site (see red rectangle at Figure 1); (b) image segmentation of the NDVI map based on area of the segments; (c) image segmentation of the NDVI map based on the roundness of the segments and (d) image segmentation of the NDVI map based on the standard deviation of the segments. The image segmentation was carried out for the NDVI map in the “Environment for Visualizing Images” (ENVI) environment.

Figure 3.
(a) Initial multispectral WorldView-2 image of the site (Near Infrared-–Red–Green composite, NIR-R-G); (b) Panchromatic band of the WorldView-2; (c) Pansharpened WorldView-2 image; (d–f) details from the area marked in rectangle in (a).
Figure 3.
(a) Initial multispectral WorldView-2 image of the site (Near Infrared-–Red–Green composite, NIR-R-G); (b) Panchromatic band of the WorldView-2; (c) Pansharpened WorldView-2 image; (d–f) details from the area marked in rectangle in (a).

Figure 4.
NDVI against blue band digital number (DN) values scatterplots with repetitive curve fits from rougher curve fitting (a), medium rougher (b) and smoother curve fitting (c).
Figure 4.
NDVI against blue band digital number (DN) values scatterplots with repetitive curve fits from rougher curve fitting (a), medium rougher (b) and smoother curve fitting (c).


Figure 5.
Vegetation suppression (NIR-R-G composite, top) and pansharpened multispectral image (NIR-R-G composite, bottom).
Figure 5.
Vegetation suppression (NIR-R-G composite, top) and pansharpened multispectral image (NIR-R-G composite, bottom).

Figure 6.
RGB pseudo composite of the orthogonal equations (R = crop mark component; G = vegetation component and B = soil component) after vegetation suppression (top) and pansharpened multispectral image (NIR-R-G composite (bottom)) from an area in the western part of the archaeological site of “Nea Paphos”.
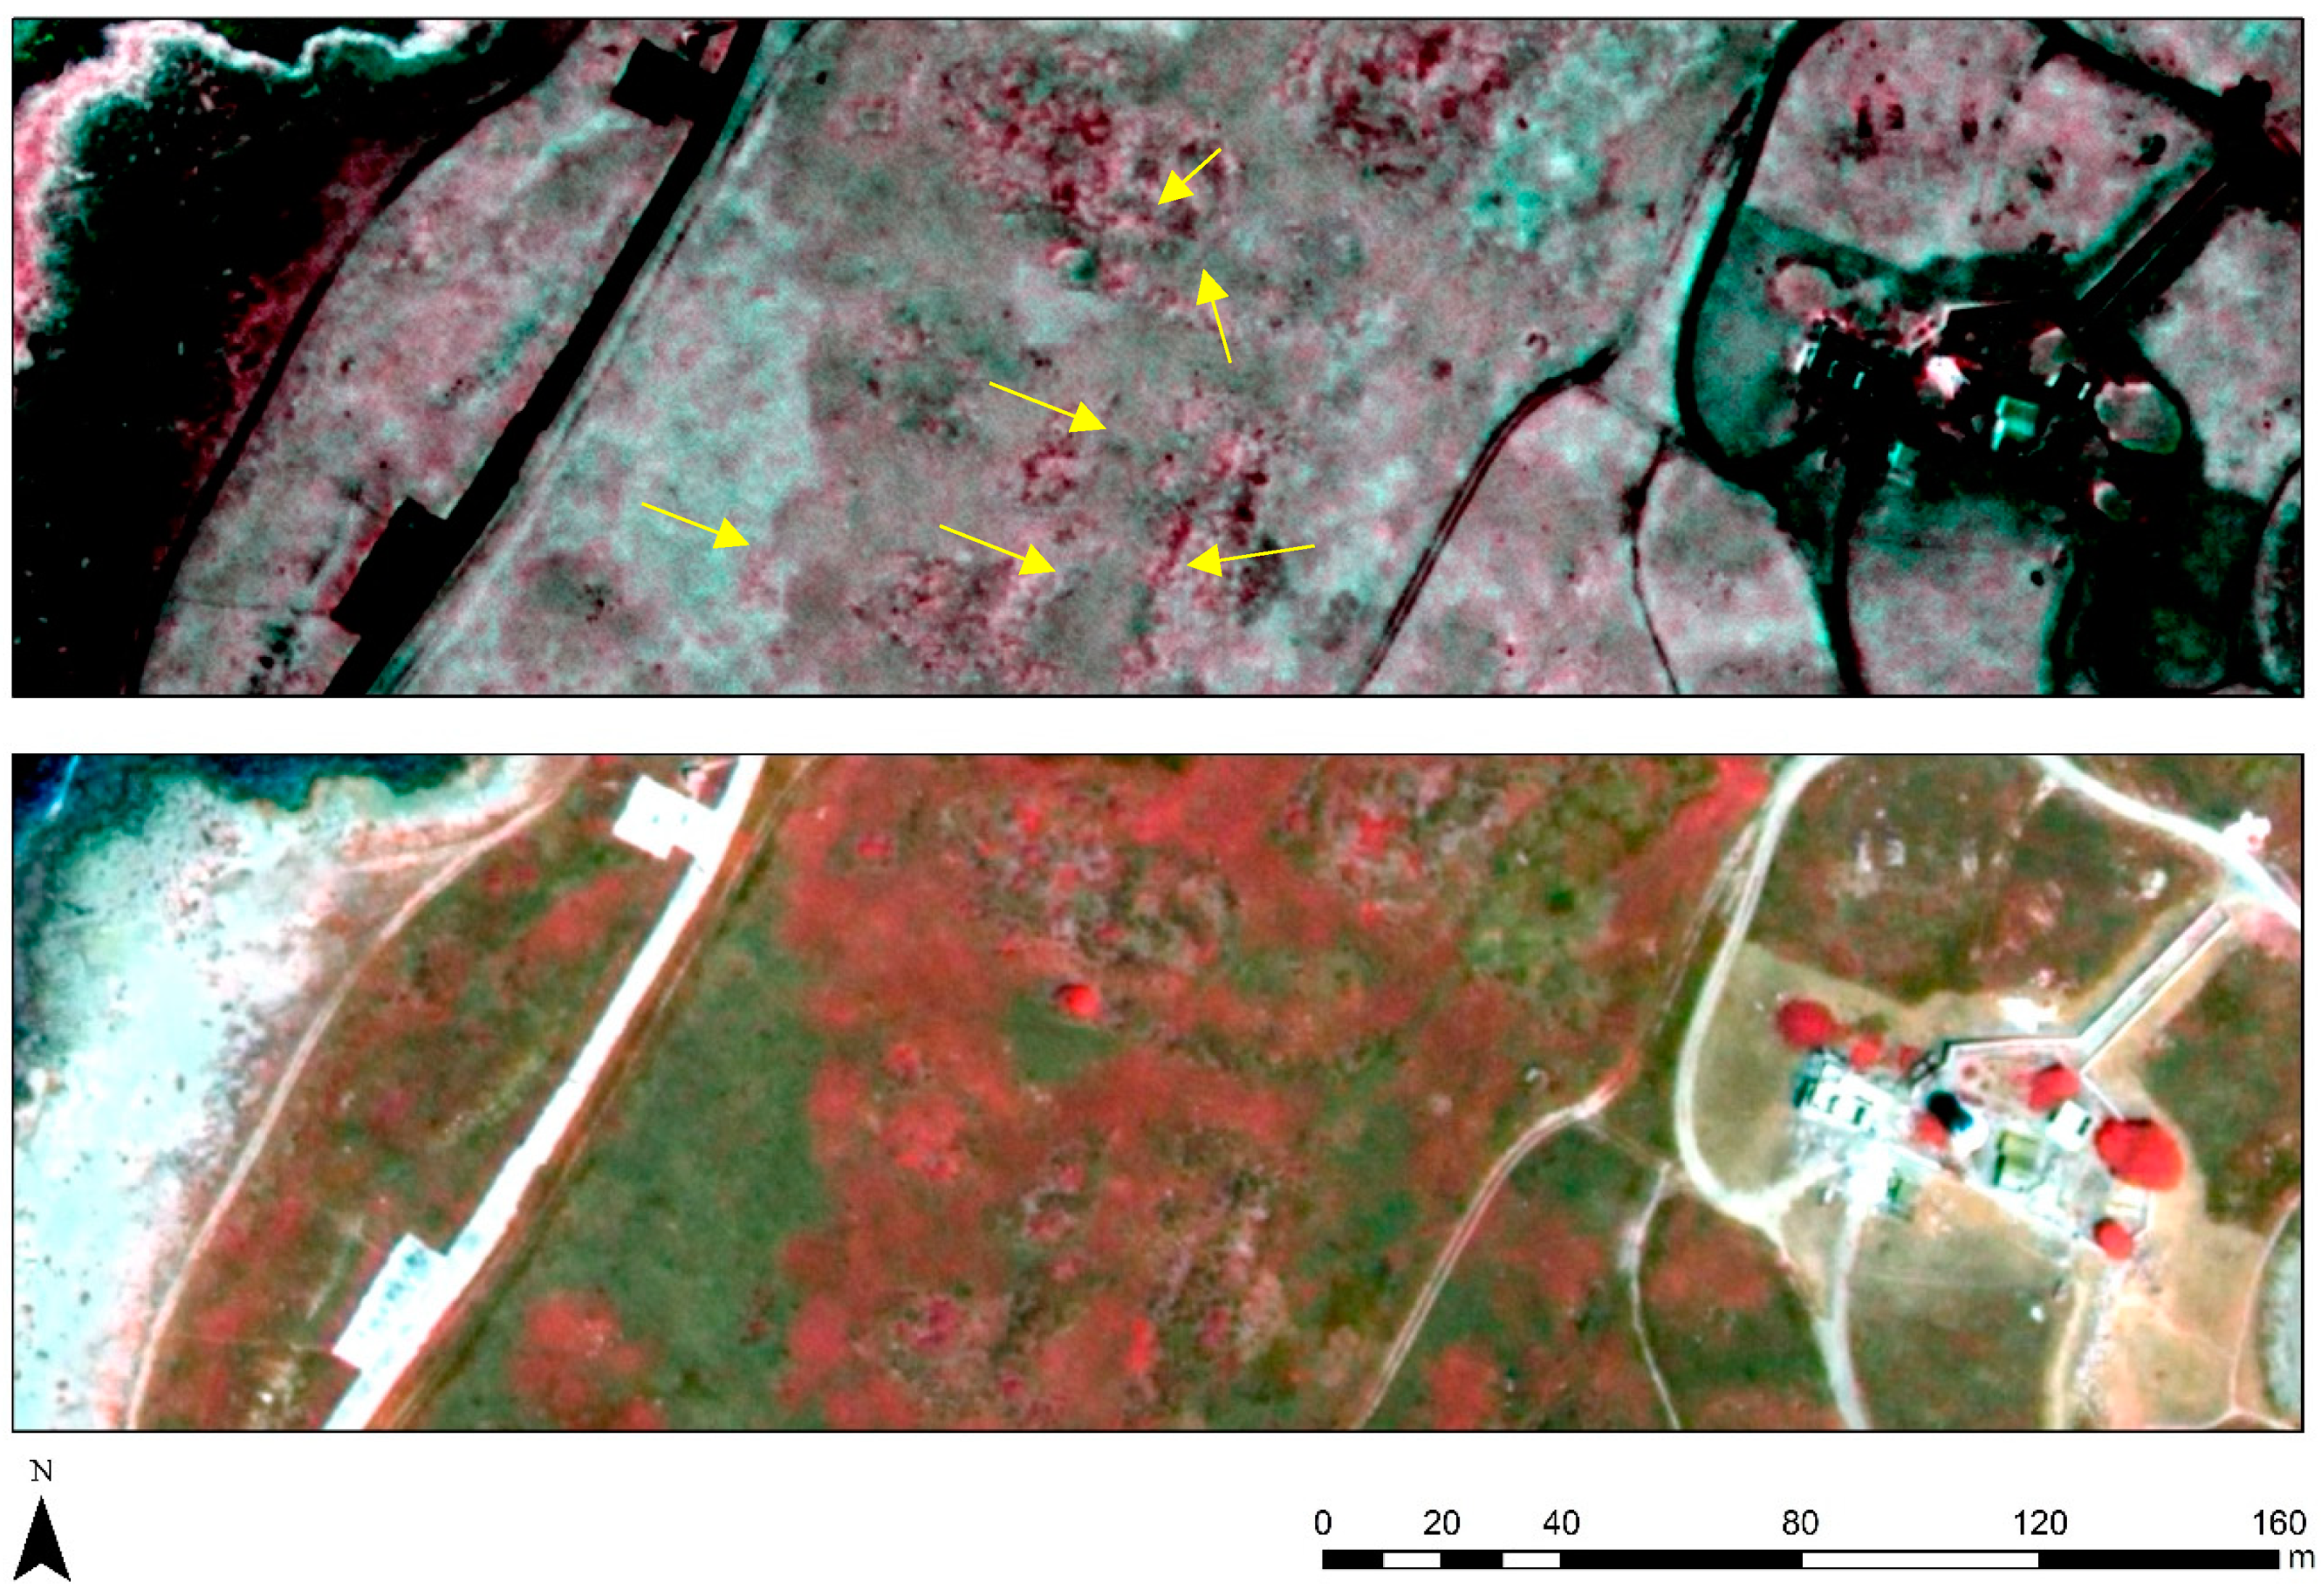
Figure 7.
RGB pseudo composite of the orthogonal equations (R = crop mark component; G = vegetation component and B = soil component) after vegetation suppression (top) and pansharpened multispectral image (NIR-R-G composite (bottom)) from an area in the northern part of the archaeological site of “Nea Paphos”.
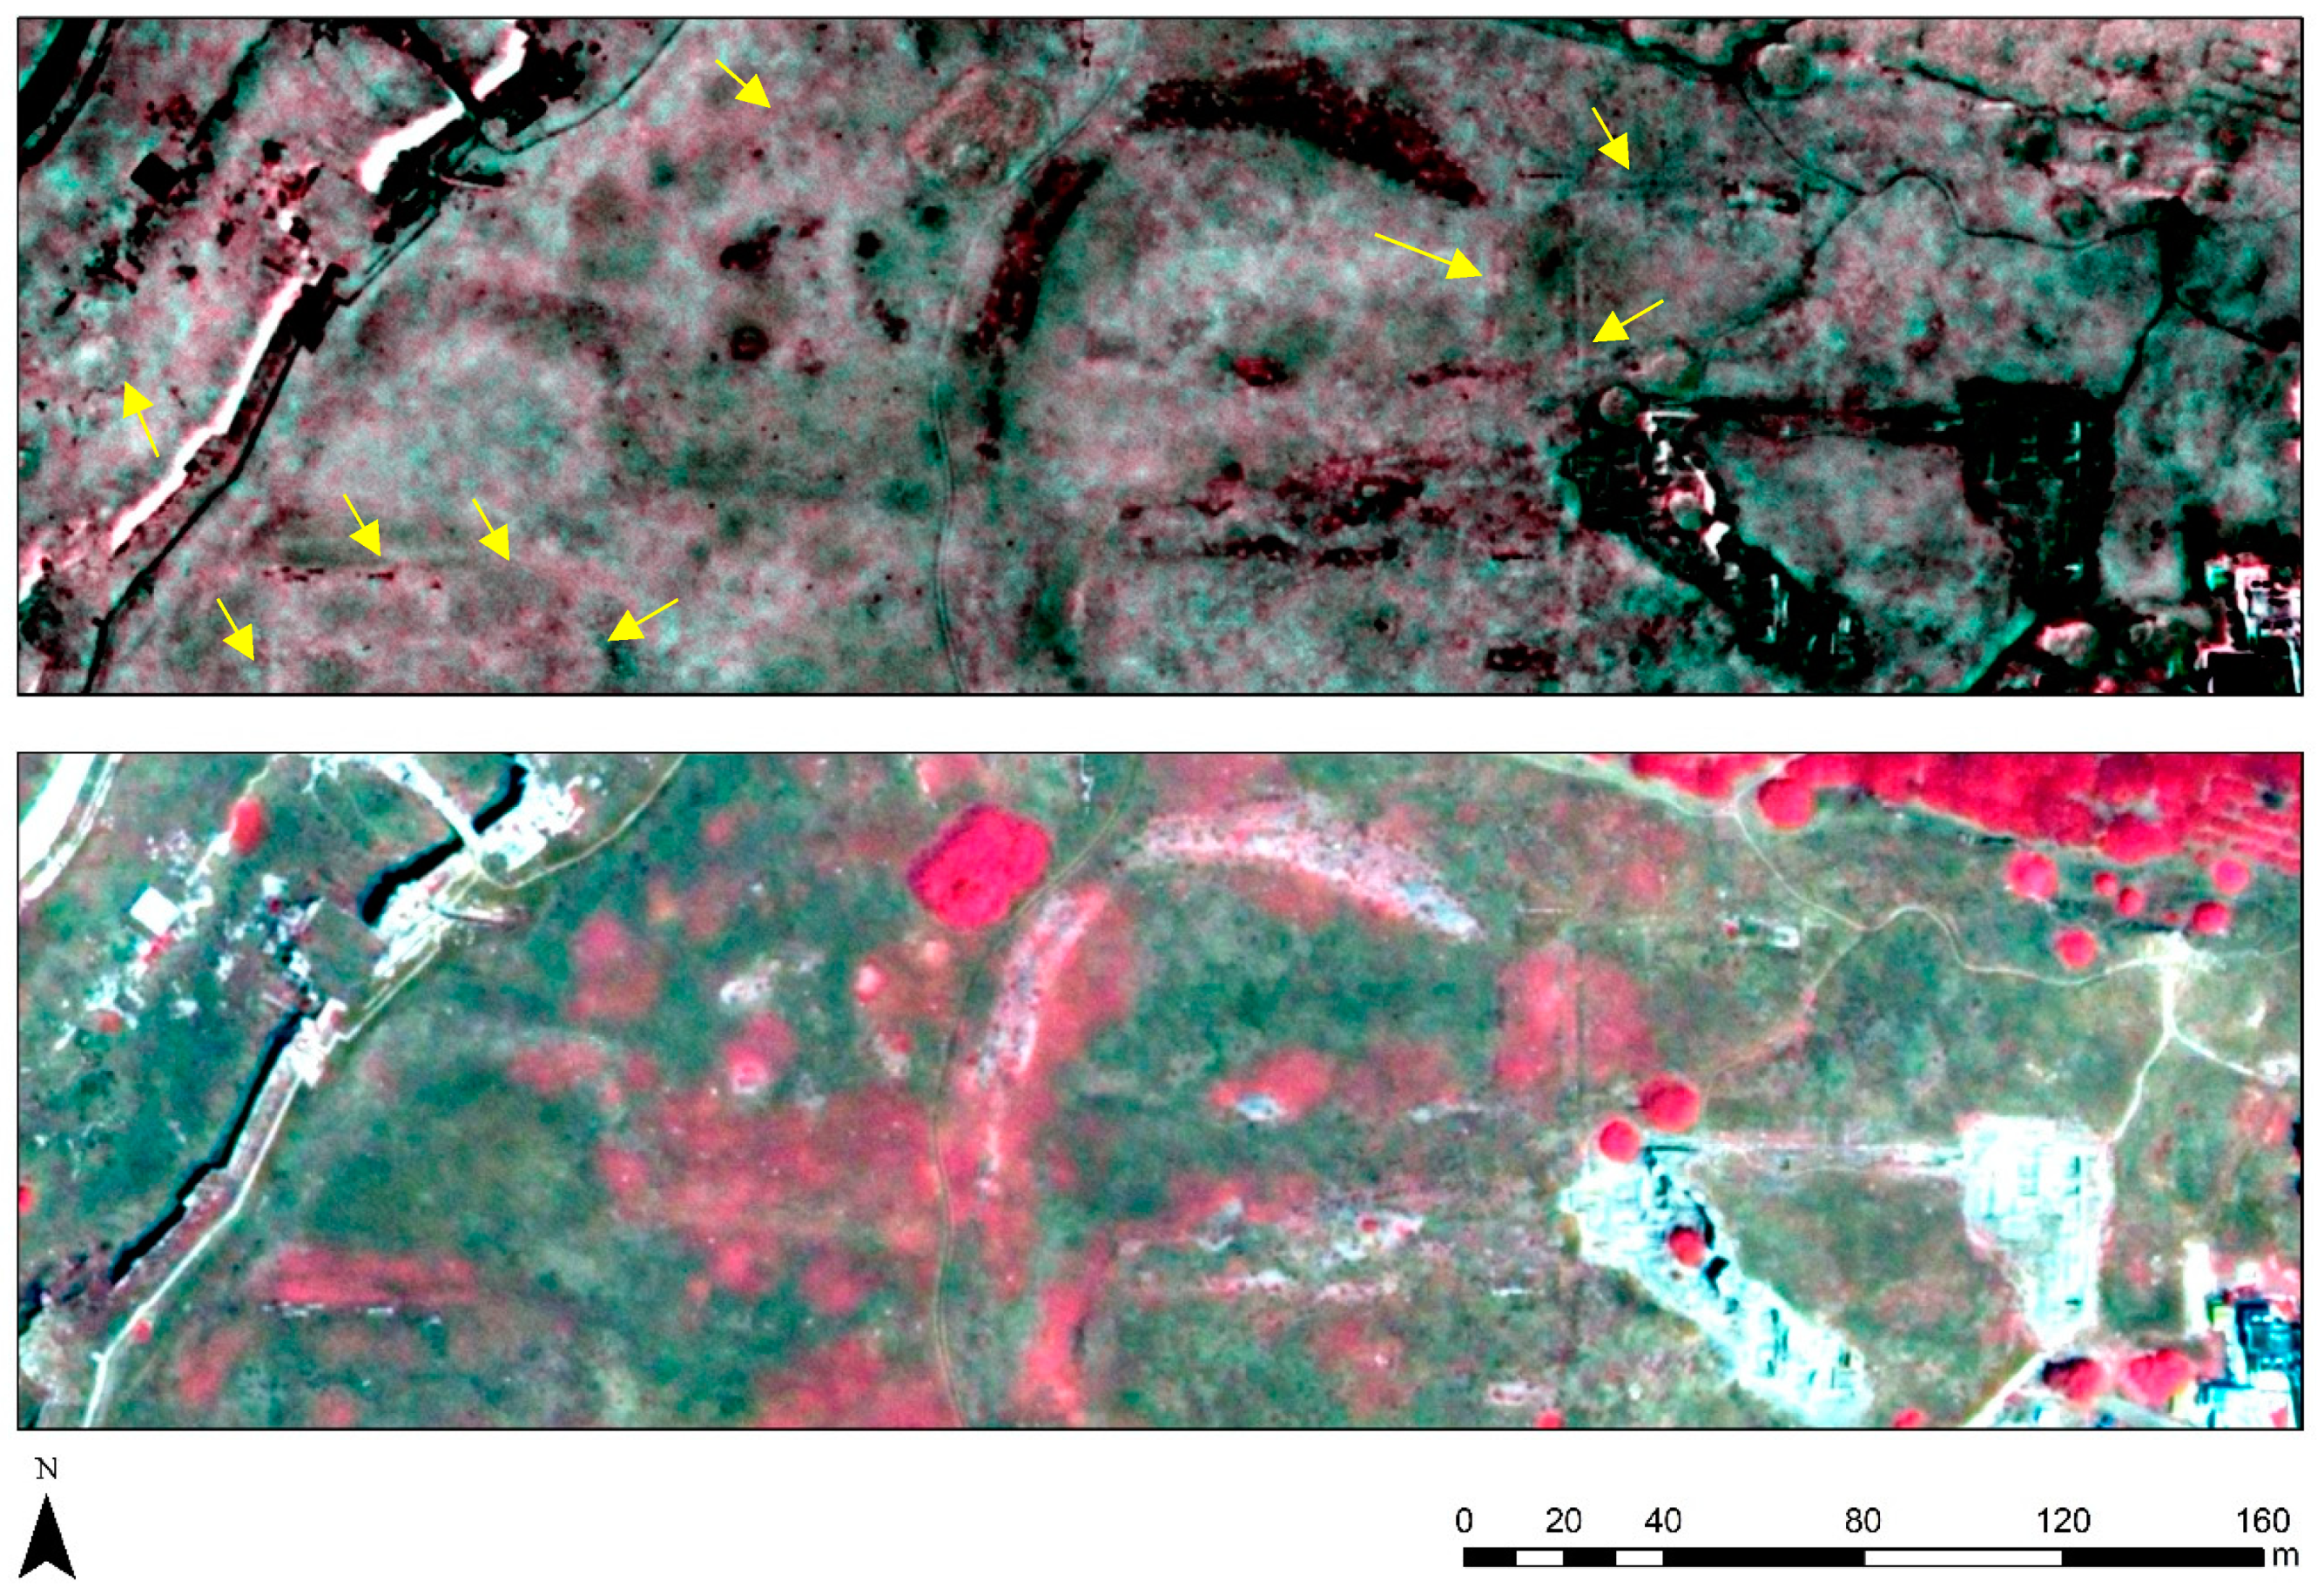
Figure 8.
Normalized difference of the crop mark (a), vegetation (b) and soil (c) components with and without vegetation suppression (step 2).
Figure 8.
Normalized difference of the crop mark (a), vegetation (b) and soil (c) components with and without vegetation suppression (step 2).

Figure 9.
An elliptical shape placed in the southern part of the archaeological site (see Figure 1, area a) as shown in: (a) crop mark component; (b) vegetation component; (c) soil component; (d) NDVI; (e) blue band; (f) green band; (g) red band and (h) NIR band.
Figure 9.
An elliptical shape placed in the southern part of the archaeological site (see Figure 1, area a) as shown in: (a) crop mark component; (b) vegetation component; (c) soil component; (d) NDVI; (e) blue band; (f) green band; (g) red band and (h) NIR band.

Figure 10.
Vertical profile of the elliptical shape of Figure 9 (line A to B) from (a) crop mark component; (b) vegetation component and (c) NDVI. Points 1–4 are shown in Figure 8a.

Figure 11.
Low altitude photograph taken from a helium balloon over the elliptical feature of “Nea Paphos”. The shape of the feature is shown with arrows. Points 1–2 of Figure 9 are also indicated.
Figure 11.
Low altitude photograph taken from a helium balloon over the elliptical feature of “Nea Paphos”. The shape of the feature is shown with arrows. Points 1–2 of Figure 9 are also indicated.
© 2019 by the author. Licensee MDPI, Basel, Switzerland. This article is an open access article distributed under the terms and conditions of the Creative Commons Attribution (CC BY) license (http://creativecommons.org/licenses/by/4.0/).
Share and Cite
MDPI and ACS Style
Agapiou, A. Enhancement of Archaeological Proxies at Non-Homogenous Environments in Remotely Sensed Imagery. Sustainability 2019, 11, 3339. https://doi.org/10.3390/su11123339
AMA Style
Agapiou A. Enhancement of Archaeological Proxies at Non-Homogenous Environments in Remotely Sensed Imagery. Sustainability. 2019; 11(12):3339. https://doi.org/10.3390/su11123339
Chicago/Turabian StyleAgapiou, Athos. 2019. "Enhancement of Archaeological Proxies at Non-Homogenous Environments in Remotely Sensed Imagery" Sustainability 11, no. 12: 3339. https://doi.org/10.3390/su11123339
Note that from the first issue of 2016, this journal uses article numbers instead of page numbers. See further details here.