Article

Identifying Dominant Stakeholder Perspectives on Sustainability Issues in Reefer Transportation. A Q-Method Study in the Port of Rotterdam

1
Department of Public Administration and Sociology, Erasmus University Rotterdam, 50, 3062PA Burgemeester Oudlaan, The Netherlands
2
Project EURECA (Effective Use of Reefer Containers through the Port of Rotterdam—A Transition Oriented Approach), Netherlands Organization for Scientific Research, NL-2509 AC The Hague, The Netherlands
3
Research Centre for Sustainable Port Cities, Rotterdam University of Applied Sciences, RDM-kade 59, 3089JR Rotterdam, The Netherlands
4
Department of Technology, Policy and Management, Delft University of Technology, Jaffalaan 5, 2628BX Delft, The Netherlands
*
Author to whom correspondence should be addressed.
Sustainability 2019, 11(12), 3425; https://doi.org/10.3390/su11123425
Submission received: 29 May 2019 / Revised: 14 June 2019 / Accepted: 18 June 2019 / Published: 21 June 2019
(This article belongs to the Special Issue International Freight Transport & Logistics)

Abstract

:
Driven by global climate concerns, seaports have formulated sustainability goals, which also require sustainability gains in the fast growing temperature-controlled logistics market—increasing energy efficiency, reducing waste, and streamlining logistics processes. This, however, requires cooperation and buy-in from a wide range of stakeholders. To explore the barriers and facilitators of such a transition, we map the interests and attitudes of cold chain actors in the Port of Rotterdam regarding sustainability issues in reefer transportation and cold chains. We identify a limited number of broadly shared perspectives using Q-methodology—a survey-based method to study subjective viewpoints (originating from psychology) that has been used only rarely in the freight transport field. The analysis yields four ‘dominant’ perspectives that together account for 46% of the variation among stakeholder viewpoints. We label these perspectives “sustainability as part of strategy”, “short term constraints”, “optimistic about technology, limited role for policy”, and “long run willingness under risk avoidance.” These perspectives are characterized by multiple factors, including the evaluation of organizational capabilities, expectations from policymakers and technology, and the time horizon stakeholder organizations consider regarding sustainability concerns. From the findings, we derive recommendations for managers and policy makers to facilitate stakeholder dialogue and possibly convergence and coalition building.

1. Introduction

The reefer container market is growing rapidly, and hence the facilitation of reefer transportation and cold chain logistics is becoming more important for container ports [1]. This presents challenges and opportunities, as this market segment with high-value cargoes not only grows rapidly but also places stringent demands on seaports’ logistics processes and energy provision to maintain an uninterrupted ‘cold’ supply chain with continuous temperature control and monitoring [2]. However, in the context of climate change and the Paris agreement of 2015, ports’ societal ‘license to operate’ increasingly depends on their ability to improve their environmental performance [3]. These sustainability goals seem at odds with the growing volumes of refrigerated containers (often called reefers), and hence the growing energy footprint of cold chain logistics in ports. As ports wish to operate more sustainably, sustainability gains also have to be made in temperature-controlled logistics, including increasing energy efficiency, reducing emissions and product waste, and streamlining logistics processes. Port authorities have formulated sustainability goals and strategies, but for these to be successful, cooperation and buy-in from actors across the entire chain is required [4]. In such a multi-stakeholder environment, divergent perspectives and interests can become a barrier to stakeholder participation [5] and hence inhibit the greening of port-related supply chains. Improving the environmental performance of seaports hence requires the management of conflicting stakeholder attitudes and interests [6].
Temperature-controlled supply chains are an area where these concerns become particularly prevalent, due to the large energy footprint of these chains—it is estimated that some 35% of a container terminal’s energy consumption is used for reefer cooling [7]—and the risks of cargo loss in case of failure of equipment or logistics processes. The objective of this study is to map the interests and attitudes of reefer transport and cold chain actors regarding sustainability issues in reefer transportation and cold chains in the Port of Rotterdam—the largest container port in Europe and the main gateway for a large part of Europe’s perishables imports, as well as the main port for the Dutch agrifood sector (the world’s second largest in terms of export volume [8]). The study addresses the questions: (1) What individual stakeholders and perspectives on sustainability issues in reefer transportation can be distinguished, and (2) can these perspectives be aggregated into a limited number of ‘dominant’ perspectives more broadly shared among stakeholders that can help inform policymaking?
We approach these questions using Q methodology, a strategy that mixes quantitative and qualitative research approaches to discern broadly shared viewpoints on an overarching theme among a diverse set of stakeholders, to compare and contrast these viewpoints, and to understand these in qualitative depth [9]. So far, this method has been most widely used in psychology, health, and environmental studies, with a limited number of studies focusing on transportation, of which—to our best knowledge—only two deal with freight transport. Kim [10] developed a typology of port users in terms of port choice decisions, and Van Duin et al. [11] studied stakeholder perspectives on urban freight consolidation. We also see the relevance of the method when addressing sustainability issues in seaports—a multi-stakeholder setting where the management of conflicting positions is relevant.
The paper is structured as follows. After the introduction (Section 1), Section 2 develops the concourse on the subject matter of the study, namely reefer transportation in the Port of Rotterdam. Section 3 describes in detail the Q methodology approach used in the study design, data collection, analysis, and interpretation. Subsequently, Section 4 presents and discusses the dominant perspectives identified. Last, Section 5 concludes and discusses the implications of the study for public and private actors, including recommendations for strategy, policy, and further research.

2. Background: Developing the Concourse

The study is conducted using Q methodology—a survey-based method to elucidate stakeholder perspectives on a topic, and identify the ‘dominant’ ones: Those most prevalent, and shared across stakeholder groups. Although little used in transportation and logistics research, Q-methodology offers the attractive possibility to discern the most prevalent attitudes and perspectives in a complex context of diverse stakeholders [11], such as a port or logistics cluster or a transportation chain.
The Q method process starts with defining the concourse on a certain topic, i.e., everything that is thought and said on all relevant aspects of the topic, in this case, sustainability issues in reefer transportation and cold chain logistics in the Port of Rotterdam. The construction of this concourse is based on different types of source material mixing structured and unstructured methods of Q-set generation [9]. First, we review the academic literature on sustainability in transport and relevant issues in reefer transportation specifically, and secondly, we identify the case specific aspects of the topic by conducting exploratory interviews, focus sessions, and from searching the professional literature.

2.1. Sustainability Issues in Reefer Transportation

Theoretically, the concourse on sustainable reefer transportation should contain the dimensions of sustainable transportation and logistics, made specific for the context of reefer handling in the Port of Rotterdam. McKinnon et al. [12] distinguish four general areas in which the environmental performance of transportation can be improved:
  • Shift to greener modes;
  • Supply chain optimizations;
  • Increasing equipment utilization;
  • Increasing fuel efficiency.
For the purpose of this study, these factors should be specified further in how they apply to (reefer) container transportation in particular. In long distance transport, the mode of transportation is a reefer container carried on a container ship. These have long eroded the market share of traditional long-haul modes for conditioned cargoes, such as the conventional reefership and air transport, and are now the dominant transport modes [1]. In hinterland container transport, a shift to greener modes generally entails a shift from road transport by truck to either barge or rail transport, which have less emissions per container/km and do not contribute to road congestion [13,14]. A sizable body of academic literature is dedicated to supply chain optimization in container transport, both from the perspective of optimizing firms’ own sub-systems and processes (e.g., Carlo et al. 2014 [15]) and the optimization of intermodal networks [16]. A particularly interesting aspect in a multi-actor setting with conflicting attitudes and interests is the coordination between supply chain actors. Van der Horst et al. [17] identified multiple categories of coordination problems that can be addressed to further optimize container supply chains. Another important issue is equipment utilization, which is mainly concerned with the repositioning of empty containers. With reefer containers this is particularly relevant, since perishables-importing regions tend to have proportionally little perishables exports, and due to the high cost of reefer containers and sensitivity of T-floors and cooling equipment, not all return cargoes are suitable to be transported in a non-operating reefer (NOR). Optimization approaches can be used to reduce the distance empty containers travel before being stuffed again [18]. Last, the fuel efficiency of transportation should be considered. This can be achieved through economies of scale, lowering speed, or investing in more fuel-efficient transportation technology.
To McKinnon’s four points, Geerlings [19] adds two more relevant considerations:
  • Reducing the overall amount of transportation, and;
  • Reducing transport distances through spatial planning.
Considering that reducing consumer demand for cooled products is not within the scope of this study, reducing the amount of transportation could still be achieved by, for example, reducing the distances travelled by empty containers, or by consolidating shipments together. Spatial planning to reduce transportation needs is also partly within the scope of this study, in so far as land use policies and location decisions can result in a reduction of transport movements and distances. A case-specific example of land use policy in the Port of Rotterdam to facilitate more efficient cold chain logistics is discussed in Section 2.2.
Besides these issues, one should add specific issues introduced by characteristics of cold chain logistics. A cold chain is a logistics chain along which a perishable or otherwise temperature-sensitive product is kept at a constantly controlled temperature to maintain product quality [2,20]. Increasingly, long-range transportation of conditioned cargoes is done using refrigerated containers or ‘reefers’ [1]. These are intermodal containers (usually 40 ft, though 20 ft and 45 ft reefers exist as well) with an integrated cooling unit that circulates cold air through the container to keep the contents at the desired temperature. In addition, reefer containers have isolated walls and an aluminum floor with T-shaped profiles that facilitate air circulation. For this containerized part of the cold chain (i.e., from the point of stuffing in the region of origin to the point of stripping at the destination), additional environmental impacts (apart from the four aspects mentioned above) can be identified: First, the energy use of the container itself, necessary for cooling. This accounts for approximately 19% of the total energy use in reefer transportation, and depends—among other factors—on the container’s contents and stowage, the temperature set point, the ambient environment, container age and quality of insulation, and refrigeration technology used [21]. The monitoring and control software on the cooling unit can be used to increase the energy efficiency of cooling [22]. At sea or inland waterways, reefers can be plugged in and powered by ship’s engines. At a container terminal, reefers are stored in reefer racks where they are plugged in and connected to the terminal’s power supply. If there is no option to plug in a reefer during transit, it can be fitted with a (diesel-powered) clip-on genset. Secondly, there are emissions from handling operations at container terminals (e.g., cranes and stacking equipment) depending on the type of equipment used, the way it is utilized, the energy source, and energy mix [23]. Next, one should also recognize the environmental impact of product waste in the case of cold chain failure [24]. When in transit the temperature deviates too much from the specified set point (often due to failing equipment or being off-power for too long), cargo quality is jeopardized and the products may be lost entirely. Last, reefer containers are increasingly being connected to the Internet of Things (IoT), which makes it possible to monitor in real time the location, temperature, and status of containers [25,26]. Although still in an early stage, this development may in the future create possibilities for better quality control and decision-making on the part of carriers, shippers, and transportation service providers [27].

2.2. The Port of Rotterdam Case

In addition to these more general issues related to reefer transportation, some aspects of the case context—the Port of Rotterdam in the Netherlands—are worth mentioning. In terms of throughput, including containers, the Port of Rotterdam is the largest port in Europe, and the largest in the world outside of Asia. In 2018, Rotterdam had a container throughput of approximately 14.5 million TEU (twenty foot equivalent unit), of which 10% to 15% were reefer containers (Port of Rotterdam, personal communication, 24 March 2019). For the case of reefer transportation, the Port of Rotterdam is a particularly interesting case, since the Netherlands are the world’s second largest exporter of agricultural products [8], an important part of which is re-export, underlining the position of Rotterdam as a perishables hub for Europe.
For hinterland transportation of containers—including reefers—trucking remains the most used modality, despite modal shift targets formulated by the port authority. With a recent port expansion, the awarding of new container terminals was based partly on sustainability criteria, including environmental monitoring systems, air quality, CO2 emissions, and a modal shift commitment to reduce the share of hinterland transport by road, in favor of rail and barge transport [28]. Since committing to a modal split target of 35% of containers being transported by road to the hinterland, the share of road transport has reduced from approximately 50% to 45%, but has stagnated in the last years.
Another important development in the Rotterdam case is the CoolPort initiative: A cold logistics cluster newly constructed at the location of a former container terminal [29]. In this case, the port authority steered its land use policy towards the clustering of activities related to cold chain logistics, including cold storage, value added services, quality and veterinarian inspection, container depots, and intermodal connectivity. In addition to the earlier literature [4,6], these examples illustrate the relevance of port policy for making port activities more sustainable and efficient.
Having outlined the relevant dimensions of sustainability in reefer transportation, the following section outlines how this concourse is operationalized in the Q methodology study design.

3. Results

As described in the section above, the first step of a Q method study is to establish the concourse on the subject matter. The construction of this concourse was based on different types of source material mixing structured and unstructured methods of Q-set generation. The first literature-based exercise helped establish the topics within the concourse, geared towards those issues relevant in a multi-actor setting:
  • Attitude towards sustainability (general);
  • Hinterland transportation modalities and modal shift;
  • Supply chain coordination and information sharing;
  • Equipment and energy use;
  • Reefer containers and technology;
  • New technologies (including ‘smart’ containers);
  • Port policy.
Secondly, we drew on professional publications and exploratory interviews and focus sessions with reefer chain actors to gather statements related to the topics within the concourse from which to sample the Q-set. These statements were collected verbatim from these stakeholders or closely paraphrased to ensure that they would come closest to the actual utterances representative of actors’ viewpoints, while also ensuring clear and concise formulation of the statements. Moreover, some statements with provocative wording were explicitly included to invite active engagement rather than passive response (as suggested by Watts and Stenner [9]). Ultimately, we reduced the 100 to 200 statements covering the full concourse to a Q-set of 37 statements that met the criteria of coverage (i.e., the sample of statements is representative of the full concourse in terms of topics and viewpoints covered) and balance (i.e., ‘seamless’ coverage, not biased towards one particular viewpoint) [9], while retaining a manageable number of statements to not make the sorting process too cumbersome. Moreover, we aimed to include those statements that would be meaningful to the broadest range of relevant stakeholders—for example, including statements on cross-chain information sharing rather than terminal yard process optimization, or on the attractiveness of barge transportation rather than specific engine configurations. Table 1 shows the Q-set as used. It should be noted that these statements were originally compiled and presented to our respondents in Dutch, and translated to English for the purpose of reporting in this study.
Next, we selected the sample of respondents—the P-set. This should include all types of stakeholders that can be expected to have a unique and/or original viewpoint on the topic and that operate in a shared context, in this case reefer transportation in or through the Port of Rotterdam. For this study, we aimed at including different stakeholder types (the port authority and the most important types of port actors, including shippers, carriers, terminal operators, logistics service providers (LSPs), transportation service providers (TSPs), etc. [30]), as well as different types of organizations within these categories: Small and large organizations, locally and internationally operating, and, for example, deep-sea as well as short-sea carriers, LSPs that include cold store operators as well as traditional forwarders, and shippers with a focus on different types of products, such as fruit, vegetables, or flowers. Within each stakeholder organization, we recruited respondents in expert or decision-making roles to ensure that their responses would reflect as closely as possible the real considerations of their organization. Q-methodology operates on the assumption that on a certain topic, there will only be a limited number of distinct coherent viewpoints that one can have, which tend to be shared by groups of like-minded stakeholders—so-called ‘finite diversity’ [31,32]. Therefore, the sampling process is purposive rather than random—focusing on including organizations that can be expected to have differing viewpoints, as explained above—and the sample size does not have to be large: A general rule of thumb is that the number of participants should not exceed the number of statements in the Q-set [9]. Considering the size of the Q-set (37 statements) and the fact that in practice, other Q-methodology studies in transportation or closely related fields tend to have sample sizes between roughly 20 and 35 participants [10,11,32,33] (notwithstanding examples with as little as 18 [34] or as many as 75 [35] respondents), we had 30 respondents complete the survey. Of these, two respondents working in different departments of the same company preferred to complete one survey together on behalf of their employer (an LSP, participant company nr. 25), and one respondent we interviewed (a transportation service provider executive) did not manage to complete the survey during the interview session, hence yielding a total of 28 completed Q-sorts. Table 2 shows the organizations and positions of respondents included. For confidentiality, the names of the organizations are omitted, and respondents will be referred to by their number and/or stakeholder organization type.
The Q-sorts were elicited from the respondents following the generally recommended protocol for Q-method data collection [36,37]. The respondents were presented the 37 statements from the Q-set in random order. They were first asked to distinguish between statements they generally agreed with, disagreed with, or were neutral towards. Following this rough ordering, we asked them to assign an explicit score to each statement reflecting the degree of (dis)agreement relative to the other statements in the Q-set. This scoring followed a forced normal distribution recommended for Q-sorting [
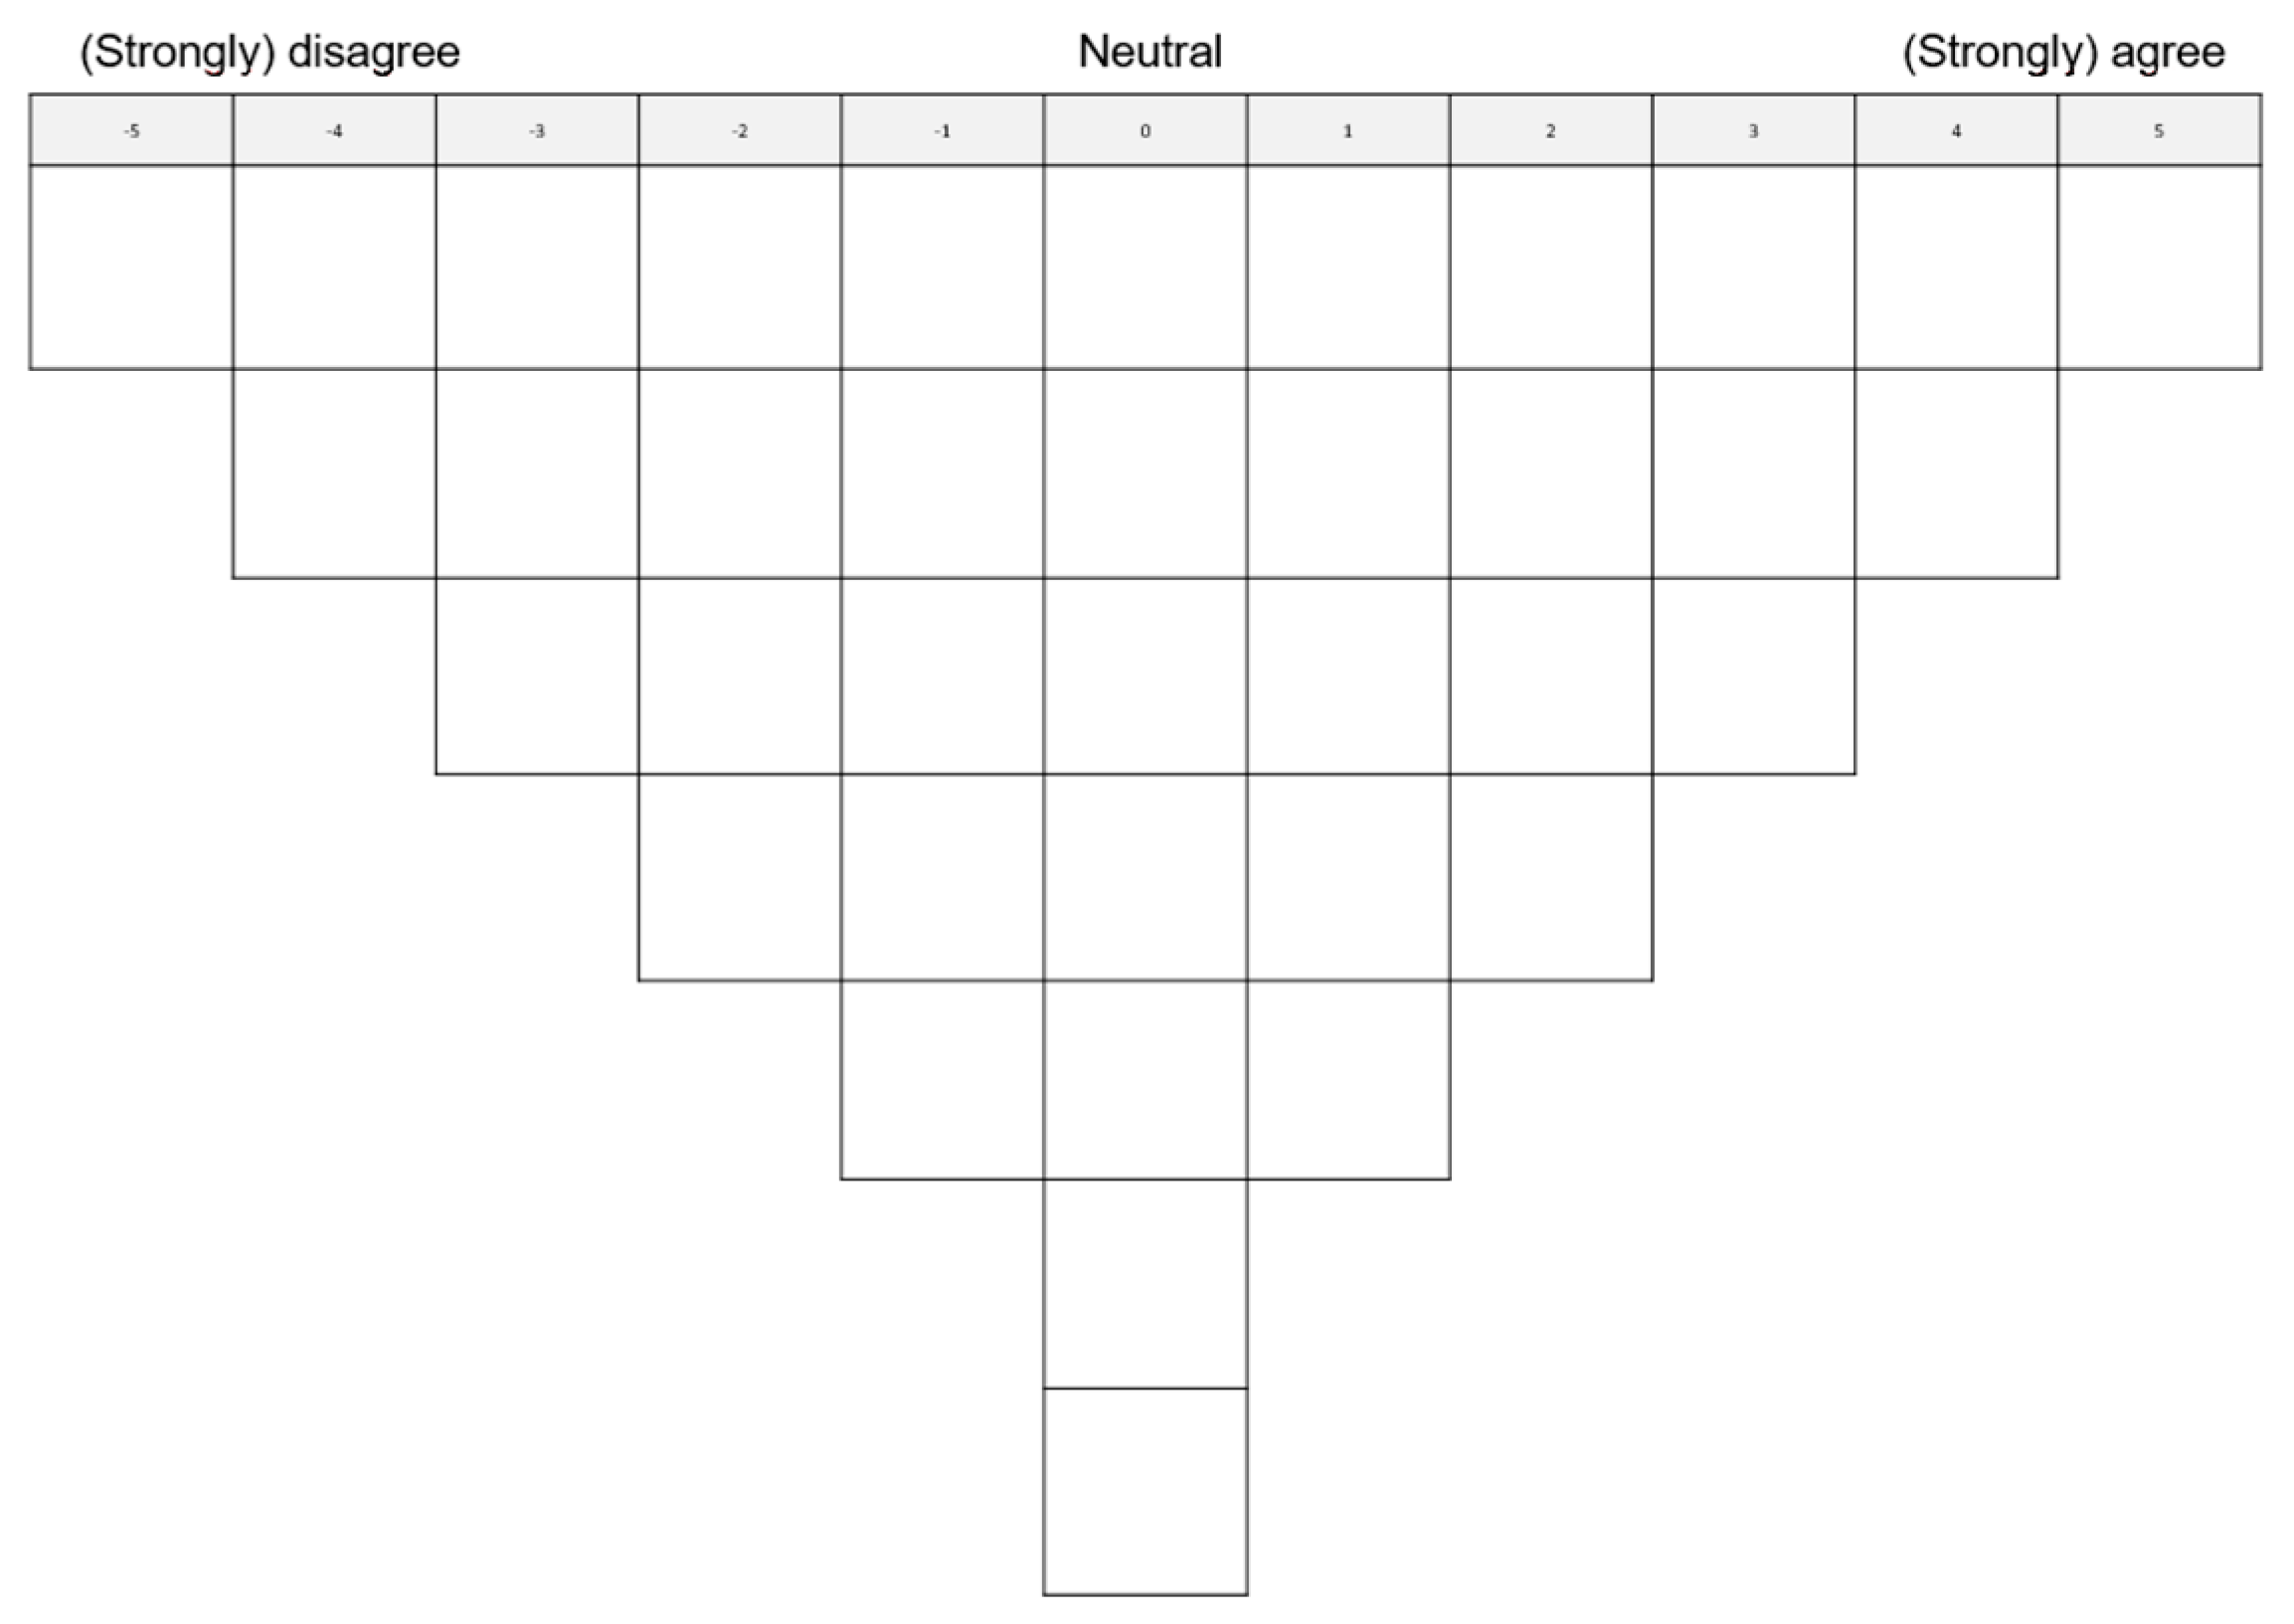
9] as shown in Figure 1, ranging from −5 (strongly disagree) to +5 (strongly agree).
Moreover, in addition to having them perform the Q-sort exercise, respondents were asked to provide some information about the organization they worked for, including:
  • The type of organization they worked for;
  • Their position;
  • Annual turnover of the organization;
  • Estimation of their modal split (respective percentages of containers being transported by inland waterways, rail, or road transport).
We asked respondents to comment more elaborately on the topics that are most relevant to their organization, and elaborate further on those statements with which they (dis)agreed the strongest. The combination of reducing stakeholders’ perspectives on aspects of an issue to a manageable number of dominant perspectives, and the contextual depth provided by their elaboration, yields a rich insight into the most important perspectives on the issue. At the end of the survey, we asked respondents whether they felt that any important aspect of the topic was missing. This yielded no important areas of omission in the Q-set.
To analyze the data, we used the Ken-Q Analysis for Q Methodology v.1.0.3. web application [38]. First, a correlation matrix between the Q-sorts is produced. The intuition behind Q methodology is that when Q-sorts correlate between respondents, there is a degree of congruence in their viewpoints on the subject [39]. These clusters of respondents with shared viewpoints can be identified using factor extraction. As suggested by Brown [40] and Watts and Stenner [9], we started by extracting seven factors from the data. In this process, the first factor that is extracted accounts for the largest amount of common variance in the data. The second factor is subsequently extracted from the residual correlation matrix, and this is repeated until the desired number of factors is extracted. Usually, in practice, after a handful of factors has been extracted from the data, the residual correlation matrix will no longer contain any meaningful residual common variance for an additional factor. These factors were rotated using the Varimax method, as is standard procedure in Q methdology [9,40]. To assess the relevance of a factor, we adhered to the Kaiser–Guttman criterion to retain those factors with an Eigenvalue higher than 1 [9,41]. Of the seven factors extracted, five satisfied this criterion. As a robustness check, we repeated the process by extracting eight factors instead, which yielded an eighth factor with an Eigenvalue of 0.1771, which does not meet the Kaiser–Guttman criterion. Furthermore, we introduced the criterion to only include those factors that have at least two respondents loading significantly after rotation [40]. This reduced the number of factors to four, since the sixth factor obtained only had one significant loading. The factors and the loadings per respondent are shown in Table 3 below.
Ultimately, we obtained four factors that constitute the four dominant perspectives on the discourse of sustainability in cold chain logistics and reefer transportation. These four factors together explained 16 + 10 + 11 + 9 = 46% of the total variance, sufficiently above the 35% to 40% threshold generally recommended [9]. In total, 18 respondents loaded significantly on one of these four perspectives (shown in the table as the No. of Defining variables), whereas the 10 others either loaded strongly on more than one perspective (hence lacking a significant loading on one of these) or none of them. The factors show high to very high reliability (average reliability coefficient = 0.8, composite reliability >0.9 for three factors and >0.8 for the fourth one). The reliability decreased slightly as the number of respondents loading significantly on a factor decreased, also evidenced by the slightly increasing standard errors of the factor Z-scores. This is understandable, as the amount of variation extracted with each subsequent factor decreased.
For every factor found, the Ken-Q application compiles an ‘idealized’ or ‘typical’ Q sort with a statement ranking that is representative of the factor extracted—for the purpose of discussing the differences between the perspectives, we treated these generated Q sorts (one for each factor) as the ‘dominant’ perspectives that clusters of respondents share to a strong degree. For interpretation, we took from these perspectives (i.e., the generated ‘typical’ Q sorts) the most salient statements (i.e., those rated with extreme agreement (scores of 4 and 5) or disagreement (scores of –4 and –5)) and those statements of which the rating differs significantly from the other perspectives, making them distinguishing of the perspective at hand as well. Furthermore, quotes from respondents’ elaborations on these statements (translated from the original Dutch to English for reporting in this paper) illustrate the considerations of the organizations that share a perspective. The interpretation of the generated ‘typical’ Q-sorts combined with information on respondents’ considerations helps formulate a coherent narrative on the underlying rationale behind these four distinct perspectives [42]. The next section discusses these characteristics of the four dominant perspectives in more detail.

4. Results

The analysis resulted in four dominant perspectives on sustainability issues in cold chain logistics and reefer transportation. This means stakeholder viewpoints on this topic can be understood to a large extent by considering these four perspectives. The interpretation of the four ‘typical’ Q-sorts and respondents’ elaborations allowed us to summarize these four perspectives under the following labels:
  • Sustainability as part of strategy.
  • Short term constraints.
  • Optimistic about technology, limited role for policy.
  • Long run willingness under risk avoidance.
These labels summarize stakeholders’ overall views on the entire discourse on the topic of reefer transportation, emphasizing the aspects most salient to them and/or that distinguish their perspective the strongest from the others. They reflect how—within these perspectives—companies view themselves and their environment, their interests and position in the sector, their expectations from policymakers (notably the port authority), and their visions, expectations, and strategies with regard to the future. The four sections below discuss these perspectives in more depth.

4.1. Perspective 1: Sustainability as Part of Strategy

Perspective 1 is shared by relatively large and often internationally operating organizations, including carriers, shippers, LSPs, and the port authority. Also, several smaller, locally operating organizations loaded significantly on this perspective. In total, seven respondents loaded significantly on this perspective.
The most positively valued statements (7, 1, and 8, see Table 4) all concern the importance of sustainability at the organizational level in setting strategic and operational priorities. Moreover, from this perspective, respondents tended to react most negatively to statements prioritizing cost reductions over sustainability improvements (statement 5) and the prospect of sustainability gains being impossible to achieve (statement 3). From this perspective, companies are already making a conscious effort to operate more sustainably, and consider themselves to be well equipped with the right means and capabilities to maintain this progress in the future. The quotes from the respondents’ elaborations on these statements further illustrate this perspective. The focus tends to be on their own efforts to prioritize sustainability, including attaining certifications, experimenting on their own with modal shift initiatives, and regular internal reporting on everything related to sustainability—even including the use of coffee cups as one respondent stated (see quotes Table 4). Respondents that loaded significantly on this perspective also emphasized the independent nature of their sustainability efforts. They do not merely follow the example of other companies (statement 13, showing a significant difference with the other three perspectives), but see themselves as independent and capable forerunners, and tend to be dismissive of governmental support or subsidies for green initiatives (Table 4, quote Respondent 23). Also, when it comes to other companies in the sector, companies with this perspective emphasized the need for a culture or mindset change, as well as their opinion that companies should be able to invest in a more sustainable direction without external help.
It might be easy for companies to let the port authority solve all their problems, but they should keep up their own trousers (Respondent 28, TSP).

4.2. Perspective 2: Short Term Constraints

The second perspective that emerges from the data is firmly juxtaposed to the first. Five respondents (a terminal, two forwarders, one short sea carrier, and inland transport organization) loaded significantly on this perspective. In terms of size and turnover, these organizations tended to be smaller than other organizations of the same type in the P-set.
From this perspective, a modal shift in hinterland transport is not feasible (yet). Statements regarding the high costs (37, see Table 5) and low performance (32, 29, and 33) of rail and barge werw rated with extreme scores, and in their elaboration on these ratings respondents cite high costs relative to truck, low reliability, congestion at terminals, and the lack of options to efficiently plug in a reefer on a train as main motivations behind this. Considering investment in more sustainable operations, organizations with this perspective emphasized the high costs (statement 6) and—accordingly—assigned this a lower priority than other perspectives (statements 1 and 8). A respondent’s elaboration on this consideration highlights that firms operate on low margins, face strong external pressure on costs and lead-time, and lack the resources, capabilities, and long-term income stability to make investments or take risks (Table 4, quote Respondent 20). At the same time, this perspective also includes a stronger willingness to share (parts of) company data (statements 17 and 18)—under the right conditions. This ties in well with the relatively high expectations from the port authority in this perspective (statements 21 and 20) to take a leading role in such initiatives. For example, a logistics service provider (respondent 6) expressed his frustration with the port authority’s focus on renting out land, rather than supporting value added activities. Elaboration from an inland transport organization representative highlights the facilitating role the port authority can take up regarding data platforms: Setting the boundary conditions and ensuring a fair and neutral treatment of participants. From this perspective, companies are facing short-term financial and operational constraints, but are willing to consider a modal shift to greener modes and participating in data sharing under the right conditions. However, these conditions have not yet been met, as trust in existing data platforms is lacking, and the performance of other modes than truck does not meet their expectations.

4.3. Perspective 3: Optimistic about Technology, Limited Role for Policy

This perspective is shared by a diverse group of stakeholder organizations of various types and sizes, including shippers, a carrier, and logistics service providers. In total, four respondents loaded significantly on this perspective.
One important observation that emerged from this perspective is the optimism about the possibilities of energy saving (statement 11 see Table 6) and data sharing (statement 19). Respondents illustrated this by referring to monitoring technology at terminals (respondent 13), energy saving software in reefer units, and new track and trace technologies implemented by container carriers (e.g., respondent 21 referring to Maersk Remote Container Management). On the other hand, respondents tended to negatively view the contribution of port policy to efficiency and sustainability issues. They do not experience support from the port authority (statement 14), nor do they expect leadership in making reefer transportation more sustainable (statements 21 and 16). Moreover, from this perspective, the recent CoolPort initiative, in which the port authority took a leading role in stimulating the clustering of cold storage, intermodal container transport, cargo handling, and value added services, is valued considerably lower than in other perspectives. In his elaboration on these points, a shipper representative (respondent 2) stated that in his view, the port authority should first and foremost do a better job in setting the right boundary conditions for efficient port processes and information management. In sum, organizations that share this perspective have positive expectations from technology, but see a limited role for policy in improving the sustainability of reefer transportation.

4.4. Perspective 4: Long Run Willingness under Risk Avoidance

A fourth perspective also emerged, distinct from the other three. It should be noted that, although significant and explaining a fair amount (9%) of variation, only two respondents (respondent 3, a LSP, and respondent 24, an industry association of the inland shipping sector) loaded significantly on this perspective.
This perspective is relatively open to reefer transport by barge rather than truck—under the condition that demands on the logistics chain allow for a longer transit time, as voiced by one respondent (Table 7, quote respondent 24). An interesting observation is that although this perspective assigns the highest score to statement 19 (“In the future, data sharing will play a larger role in improving punctuality, quality, and sustainability”), statements reflecting a willingness to share data were rated more negatively than from the other perspectives. An elaboration from one respondent (respondent 24) highlights some reservations with regard to data sharing. He believes it will become important, but that at this moment, the willingness is not there, due to the uncertainty involved, the current lack of standards, and the commercially sensitive nature of information. The same timeframe considerations are reflected in a low rating of statement 2 (“In the near future, we want to be able to offer CO2 neutral services to our clients”), in which respondents particularly objected to the “in the near future” phrase. From this perspective, investments in sustainability, as well as commitment to data sharing initiatives, take time and careful consideration. In the long run, organizations are willing to participate in data sharing and effectuating a modal shift to greener modes, but they are cautious of present risks and uncertainties, making them hesitant to act in the short term. More so than the others, this perspective envisages a considerable role of the port authority in facilitating a shift to sustainability.

4.5. Similarities between Perspectives

Having so far highlighted the differences between the perspectives, there are also some parts of the discourse on which the four perspectives share similar views. One way to assess the compatibility of the perspectives identified is to check the correlation between the factors from which the perspectives were compiled (see Table 8). The correlations are weak at best (all <0.4), but most are positive, indicating that there are indeed some areas on which the four perspectives overlap. The close to zero correlation between factors 2 and 4 (−0.0398) may reflect the distinctly short term orientation of perspective 2, and the very long term orientation of factor 4, and the very different levels of willingness to share data.
The correlation between perspectives can be traced back to certain ‘consensus’ statements, on which the perspectives overlap to some degree. These statements and their scores per factor are shown in Table 9 below.
An interesting observation concerns the relative neutrality with which all perspectives view statements related to the ‘smart’ reefer (26 and 27). Few of the respondents expect great efficiency and sustainability gains from reefer containers being integrated in the Internet of Things, and they—although some acknowledge in their elaboration the slow progress in the implementation of existing technologies in smart reefers—do not experience an urgent need to make use of this technology. Even perspective 3, characterized by optimistic expectations from technology, attaches relatively more importance to information sharing solutions and energy saving technology. Another shared view regards the attractiveness of the reefer container relative to other modes of transport for conditioned cargoes (statement 25): All perspectives prefered the reefer container over conventional reefer ships or air transport. Moreover, multiple respondents believed that major product categories that still predominantly rely on airfreight (notably flowers) will be containerized more in the future as well. There is also some consensus on statements regarding the role of the port authority (statements 9 and 22): All perspectives emphasized to a greater or lesser degree the potential role the port authority can play in improving sustainability, but in no perspective do stakeholders consider themselves particularly dependent on the port authority. Regarding hinterland transport, perspectives overlapped in their neutral evaluation of the costs of trucking (statement 37). For reefer containers, trucking is (still) the default mode of transport to and from the port area, so respondents may see its usage as a given. Interestingly, the costs of barge and rail (statements 35 and 37) were also rated rather neutrally or even negatively: Only perspective 2 strongly agreed (Z score > 1.0) with the costs of barge being too high. In their elaboration on these statements, multiple respondents concluded that costs alone did not incentivize the trucking decision, but more importantly, the flexibility, ease, and speed. Acknowledging that all perspectives agreed on statement 34 (“For us, good hinterland transportation performs well on cost, quality, and reliability criteria”), it can be surmised that all stakeholders value cost, quality, and reliability criteria, but in a mix that prioritizes speed and reliability as long as competition keeps costs at a reasonable level.

5. Discussion and Conclusions

In this study, the application of Q methodology identified four dominant perspectives that together account for 46% of the variation in viewpoints on sustainability issues in reefer transportation. Aside from the substantial variation explained by the four perspectives, several novel insights can be drawn from the results.
Before discussing the main findings and implications for policy, management, and research that can be drawn from the findings, some caveats with regard to the results are in order. The Q methodology applied is by nature inductive, taking the case information and the patterns that emerge from the data as a starting point to formulate propositions. The study was conducted in the context of the case of the Port of Rotterdam: A shared environment where stakeholders have a shared frame of reference and can thus be expected to show differing viewpoints on the same subject matter. The generalizability of findings is often a limitation of a Q methodology approach. Within a given context, there is a limited number of coherent patterns of viewpoints on a discourse that can be identified with a relatively small group of respondents (the assumption of ‘finite diversity’ [31]), but the case context may determine which aspects of the discourse become more salient to stakeholders. Hence, similar patterns may be observed in similar contexts (e.g., Western European ports), but the generalizability to very different contexts is limited.
The findings highlight the multidimensionality of stakeholder perspectives on sustainability issues, and the nuanced ways in which these differ from one another. Important differences between perspectives can stem from the way companies view themselves, their resources and capabilities (or lack thereof), their expectations of the future and technology development, and their (normative) evaluation of the proper role of formal government (e.g., a port authority) in relation to the market. All dominant perspectives that were identified are distinct from the others along several of these dimensions. Furthermore, the dominant perspectives found could not easily be reduced to one traditional categorization of stakeholders, as they cut across boundaries between stakeholder types. For example, one logistics service provider may be more comparable in attitudes to a terminal operator than to another LSP. It is valuable to highlight that while having brought stakeholder viewpoints on the topic back to no more than four dominant perspectives, we can still understand a large part of the variation in subjective attitudes among the broad and diverse fields of many different stakeholder organizations. This illustrates the usefulness of Q methodology to capture important patterns in viewpoints, while also dealing with the considerable heterogeneity among stakeholders in a given context.
The findings from this study also offer several considerations for supply chain actors, in managerial as well as policy-making roles, in three main areas.
First, the findings highlight the awareness of managers and policymakers of the growing importance of information sharing, but at the same time underscore barriers to the development of such initiatives and platforms. Across all four perspectives, respondents affirmed the importance of information sharing and improving inter-firm coordination, but due to the complexity and uncertainty involved, lacking capabilities, or fearing for their own competitive position, it is not attractive to be a first mover. Nor would other parties in the sector necessarily trust a first mover, especially if it concerns an already dominant party in the market—having the resources and capabilities necessary to take this first step. Leading firms in the market that consider starting data sharing initiatives should recognize the need to overcome this lack of trust among other supply chain actors for their initiative to be successful. In this aspect, there may be a potential role for policy. Port authorities, as well-connected organizations with considerable capabilities, and generally perceived and trusted as a neutral party, are well positioned to help overcome barriers to coordination and innovation by taking a leading role in data sharing initiatives. Especially with willing but smaller organizations with limited resources, there is a potential for sustainability gains that can be realized by supporting these organizations with knowledge and capabilities that allow them to act on their ambitions. In doing so, port authorities that pursue sustainability goals in a complex logistics context may consider expanding their scope beyond the traditional ‘landlord’ role and positioning themselves as more innovative and entrepreneurial cluster managers.
Secondly, the study findings also have several managerial implications for market actors wishing to develop their (sustainable) business models in cold chain logistics. The findings highlight the fact that a modal shift will not happen unless the right boundary conditions are met. Several respondents highlight the potential attractiveness of barge and rail transport as a cost-effective alternative to trucking, that can benefit from the bundling of flows of reefer and dry containers. However, in the studied case, while barge transport can (at a feasible route and distance) compete with truck transport on costs, it is used only to a limited extent. In addition, rail transport—still almost never used for operating reefers—needs better options to power reefers on board. If intermodal barge and rail are to be a competitive alternative to truck, the speed, ease of use, and particularly the reliability of these modalities have to improve. In this context, reducing holdup risk and increasing the reliability of barge and rail transport requires the coordination of activities of several actors, including terminal operators, LSPs, and transportation service providers to a degree that is still lacking [17]. Additionally, aside from improving reliability, the attractiveness of these services for reefer transport can also benefit from new logistics concepts that allow for service differentiation through more flexible planning of intermodal shipments, such as the development of synchromodal transport services [43]. Considering the differing characteristics of reefer cargoes (in particular related to the time-sensitivity of different goods), a more differentiated service offer (i.e., combining different transport modes to meet a particular client’s time and cost preferences) in combination with more reliable service will likely facilitate a modal shift of reefer cargoes to more sustainable modalities. For port authorities, stimulating the development of a differentiated service offered to users with different preferences in their port cluster can contribute to the creation of added value and enhancement of port competitiveness [30].
Third, another interesting observation regards the development of the ‘smart reefer.’ While carriers are investing heavily in innovation and outfitting their reefers with sensors and other IoT devices, other reefer chain stakeholders do not seem to expect much from this technology in terms of improving their own processes. Therefore, it would serve container carriers and technology developers well to consider customer needs in their product development, and leverage their marketing to increase awareness of the possibilities of their smart containers.
For researchers, the findings highlight the usefulness of Q-methodology—a method used rarely so far in port and transportation research—to elucidate the most widely shared concerns in a complex and diverse network of stakeholders. Having now identified the perspectives on sustainability issues in reefer transportation and cold chain logistics that are dominant in the Port of Rotterdam context, the study findings invite several interesting questions for future research to address. Most importantly, (1) can similar patterns be observed in similar port contexts? Additionally, (2) how exactly can convergence on issues that require broad cooperation and coalition building, such as a modal shift and data sharing, be stimulated? Furthermore, the depth of understanding of stakeholder attitudes achieved in this study is illustrative of the valuable contribution Q methodology can make to stakeholder analysis and management, and port policy. Although still scarcely used in the field of freight transport and ports, it may in the future be applied to problems of a similar nature where the identification and reconciliation of conflicting viewpoints, objectives, and interests is desirable. Examples of these problems include congestion issues around container terminals, enacting an energy transition in still fossil fuel-oriented seaports, eliciting stakeholder requirements for infrastructure planning, and conflicts at the port–city interface.
Finally, the study findings provide new insights about the barriers that need to be overcome to realize sustainability gains in multi-actor logistics contexts. While there is already an awareness of the need for improving the sustainability performance of (cold chain) logistics, change is slow to come about and the differences between the dominant perspectives discussed highlights several reasons why. A considerable group of actors lacks the capabilities or the flexibility to invest in sustainability improvements, due to their narrow margins and their customers putting a strong pressure on costs and lead-time. Another group may be reluctant to change their own behavior, either due to an expectation that technology will gradually improve sustainability performance, due to hesitation and uncertainty about which changes to make, or in a belief that their own efforts are futile unless other issues outside their control are addressed first. Also, expectations from policy are not unequivocal: Some parties prefer policymakers not to interfere in the market, whereas others expect a leading role in standard setting and platform development. These tensions lead to a present situation of deadlock in the Rotterdam-oriented cold chain logistics sector, and perhaps in other contexts as well. Changing locked-in perceptions and behavior and realizing a transition towards more sustainable transport remains a major challenge for chain actors across the board.

Author Contributions

Conceptualization, B.C., R.v.D., H.G.; methodology, B.C., R.v.D.; software, B.C.; validation, B.C., R.v.D., H.G..; formal analysis, B.C.; investigation, B.C., R.v.D., H.G.; resources, B.C., R.v.D., H.G. data curation, B.C.; writing—original draft preparation, B.C.; writing—review and editing, B.C., R.v.D., H.G.; visualization, B.C.; supervision, R.v.D., H.G.; project administration, H.G.; funding acquisition, H.G., R.v.D.

Funding

The authors are working in research project EURECA (Effective Use of Reefer Containers Through the Port of Rotterdam—A Transition Oriented Approach), with project number 438-15-505 of the Netherlands Organization for Scientific Research (NWO), co-financed by SmartPort, ABB, and Seamark. None of the funding organizations were involved in the study design, interpretation or analysis of data, or the writing of the manuscript.

Acknowledgments

The authors would like to thank all respondents for their cooperation, and Josephine Terwindt (Delft University of Technology) for assisting in the data collection process.

Conflicts of Interest

SmartPort, a funding partner in the EURECA project, has provided the authors with the contact details of potential respondents. No funding organization was involved in the design of the study; in the collection, analyses, or interpretation of data; in the writing of the manuscript, or in the decision to publish the results.

References

  1. Arduino, G.; Carrillo Murillo, D.; Parola, F. Refrigerated container versus bulk: Evidence from the banana cold chain. Marit. Policy Manag. 2013, 8839, 1–18. [Google Scholar] [CrossRef]
  2. Mercier, S.; Villeneuve, S.; Mondor, M.; Uysal, I. Time-temperature management along the food cold chain: A review of recent developments. Compr. Rev. Food Sci. Food Saf. 2017, 16, 1–21. [Google Scholar] [CrossRef]
  3. Lam, J.S.L.; Notteboom, T. The greening of ports: A comparison of port management tools used by leading ports in Asia and Europe. Transp. Rev. 2014, 34, 169–189. [Google Scholar] [CrossRef]
  4. Acciaro, M.; Vanelslander, T.; Sys, C.; Ferrari, C.; Roumboutsos, A.; Giuliano, G.; Lam, J.S.L.; Kapros, S. Environmental sustainability in seaports: A framework for successful innovation. Marit. Policy Manag. 2014, 41, 480–500. [Google Scholar] [CrossRef]
  5. Van Duin, J.H.R. Logistics Concept Development in Multi-Actor Environments: Aligning Stakeholders For. Successful Development of Public/Private Logistics Systems by Increased Awareness of Multi-Actor Objectives and Perceptions; Delft University of Technology: Delft, The Netherlands, 2012. [Google Scholar]
  6. Denktas-Sakar, G.; Karatas-Cetin, C. Port sustainability and stakeholder management in supply chains: A framework on resource dependence theory. Asian J. Shipp. Logist. 2012, 28, 301–320. [Google Scholar] [CrossRef]
  7. Van Duin, J.H.R.; Geerlings, H.; Verbraeck, A.; Nafde, T. Cooling down: A simulation approach to reduce energy peaks of reefers at terminals. J. Clean. Prod. 2018, 193, 72–86. [Google Scholar] [CrossRef]
  8. CBS. Landbouwexport Ruim 90 Miljard Euro in 2018. Available online: https://www.cbs.nl/nl-nl/nieuws/2019/03/landbouwexport-ruim-90-miljard-euro-in-2018 (accessed on 27 April 2019).
  9. Watts, S.; Stenner, P. Doing Q Methodological Research. Theory Method and Interpretation; Sage Publications Ltd.: London, UK, 2012. [Google Scholar]
  10. Kim, J.Y. Port user typology and representations of port choice behavior: A Q-methodological study. Marit. Econ. Logist. 2014, 16, 165–187. [Google Scholar] [CrossRef]
  11. Van Duin, R.; Slabbekoorn, M.; Tavasszy, L.; Quak, H. Identifying dominant stakeholder perspectives on urban freight policies: A Q-analysis on urban consolidation centres in the Netherlands. Transport 2017, 33, 867–880. [Google Scholar] [CrossRef]
  12. McKinnon, A.C.; Browne, M.; Piecyk, M.; Whiteing, A. Green Logistics Improving the Environmental Performance of Logistics, 3rd ed.; Kogan Page: London, UK, 2015. [Google Scholar]
  13. Tao, X.; Wu, Q.; Zhu, L. Mitigation potential of CO2 emissions from modal shift induced by subsidy in hinterland container transport. Energy Policy 2017, 101, 265–273. [Google Scholar] [CrossRef]
  14. Veenstra, A.; Zuidwijk, R.; van Asperen, E. The extended gate concept for container terminals: Expanding the notion of dry ports. Marit. Econ. Logist. 2012, 14, 14–32. [Google Scholar] [CrossRef]
  15. Carlo, H.J.; Vis, I.F.A.; Roodbergen, K.J. Transport operations in container terminals: Literature Overview, Trends, research directions and classification scheme. Eur. J. Oper. Res. 2014, 236, 1–13. [Google Scholar] [CrossRef]
  16. Lam, J.S.L.; Gu, Y. Port hinterland intermodal container flow optimisation with green concerns: A literature review and research agenda. Int. J. Shipp. Transp. Logist. 2013, 5, 257–281. [Google Scholar] [CrossRef]
  17. Van der Horst, M.; De Langen, P. Coordination in hinterland transport chains: A major challenge for the seaport community. Marit. Econ. Logist. 2008, 10, 108–129. [Google Scholar] [CrossRef]
  18. Hjortnaes, T.; Wiegmans, B.; Negenborn, R.R.; Zuidwijk, R.A.; Klijnhout, R. Minimizing cost of empty container repositioning in port hinterlands, while taking repair operations into account. J. Transp. Geogr. 2017, 58, 209–219. [Google Scholar] [CrossRef]
  19. Geerlings, H. Towards Sustainability of Technological Innovations in Transport: The Role of Government in Generating a Window of Technological Opportunity; Vrije Universiteit Amsterdam: Amsterdam, The Netherlands, 1999. [Google Scholar]
  20. Montanari, R. Cold chain tracking: A managerial perspective. Trends Food Sci. Technol. 2008, 19, 425–431. [Google Scholar] [CrossRef]
  21. Fitzgerald, W.B.; Howitt, O.J.A.; Smith, I.J.; Hume, A. Energy use of integral refrigerated containers in maritime transportation. Energy Policy 2011, 39, 1885–1896. [Google Scholar] [CrossRef]
  22. Lukasse, L.J.S.; Baerentz, M.B.; Kramer-Cuppen, J.E.D. Quest II: Reduction of CO2 emissions of reefer containers. In Proceedings of the 23rd IIR International Congress of Refrigeration, Prague, Czech Republic, 21–26 August 2011; pp. 3203–3210. [Google Scholar]
  23. Geerlings, H.; Van Duin, R. A new method for assessing CO2-emissions from container terminals: A promising approach applied in rotterdam. J. Clean. Prod. 2011, 19, 657–666. [Google Scholar] [CrossRef]
  24. FAO. Global Food Losses and Food Waste—Extent, Causes and Prevention; FAO: Rome, Italy, 2011. [Google Scholar]
  25. Dittmer, P.; Veigt, M.; Heidmann, N.; Paul, S. The intelligent container as a part of the internet of things. A framework for quality-driven distribution for perishables. In Proceedings of the 2012 IEEE International Conference on Cyber Technology in Automation, Control, and Intelligent Systems (CYBER), Bangkok, Thailand, 27–31 May 2012. [Google Scholar]
  26. Gehrke, J.D.; Behrens, C.; Jedermann, R.; Morales Kluge, E. The Intelligent Container–Toward Autonomous Logistic Processes; University of Bremen: Bremen, Germany, 2006. [Google Scholar]
  27. Lutjen, M.; Dittmer, P.; Veigt, M. Quality driven distribution of intelligent containers in cold chain logistics networks. Prod. Eng. Res. Dev. 2013, 7, 291–297. [Google Scholar] [CrossRef]
  28. De Langen, P.; Van den Berg, R.; Willeumier, A. A new approach to granting terminal concessions: The case of the rotterdam world gateway terminal. Marit. Policy Manag. 2012, 29, 79–90. [Google Scholar] [CrossRef]
  29. Port of Rotterdam. Rotterdam Cool Port Van Start op Locatie City Terminal. Available online: https://www.portofrotterdam.com/nl/nieuws-en-persberichten/rotterdam-cool-port-van-start-op-locatie-city-terminal (accessed on 27 April 2019).
  30. Castelein, R.B.; Geerlings, H.; Van Duin, J.H.R. Divergent effects of container port choice incentives on users’ behavior. Transp. Policy 2019, in press. [Google Scholar] [CrossRef]
  31. Barry, J.; Proops, J. Seeking sustainability discourses with Q methodology. Ecol. Econ. 1999, 28, 337–345. [Google Scholar] [CrossRef]
  32. Matthew, C.; Muellerleile, C.; Akers, J. Stakeholder Perspectives on shale gas fracking: A Q-method study of environmental discourses. Environ. Plan. A 2015, 47, 1944–1962. [Google Scholar]
  33. Byrne, R.; Byrne, S.; Ryan, R.; O’Regan, B. Applying the Q-method to identify primary motivation factors and barriers to communities in achieving decarbonisation goals. Energy Policy 2017, 110, 40–50. [Google Scholar] [CrossRef]
  34. Rajé, F. Using Q methodology to develop more perceptive insights on transport and social inclusion. Transp. Policy 2007, 14, 467–477. [Google Scholar] [CrossRef]
  35. Cuppen, E.; Breukers, S.; Hisschemöller, M.; Bergsma, E. Q Methodology to select participants for a stakeholder dialogue on energy options from biomass in the Netherlands. Ecol. Econ. 2010, 69, 579–591. [Google Scholar] [CrossRef]
  36. Molenveld, A. Using Q methodology for (comparative) policy analysis. In Handbook of Methods for Comparative Policy Analysis; Peters, B.G., Fontaine, G., Eds.; Edward Elgar Publishing Ltd.: Cheltenham, UK, 2019. [Google Scholar]
  37. Van Exel, J.; De Graaf, G. Q methodology: A sneak preview. Soc. Sci. 2005, 2, 1–30. [Google Scholar]
  38. Banasick, S. Ken-Q analysis version 1.0.5. 2018. Available online: https://shawnbanasick.github.io/ken-q-analysis/ (accessed on 21 June 2019).
  39. Kroesen, M.; Bröer, C. Policy discourse, people’s internal frames, and declared aircraft noise annoyance: An application of Q-methodology. J. Acoust. Soc. Am. 2009, 126, 195–207. [Google Scholar] [CrossRef] [PubMed]
  40. Brown, S.R. Political Subjectivity: Applications of Q Methodology in Political Scienc; Yale University Press: New Haven, CA, USA, 1980. [Google Scholar]
  41. Kaiser, H.F. The varimax criterion for analytic rotation in factor analysis. Psychometrika 1958, 23, 187–200. [Google Scholar] [CrossRef]
  42. Webler, T.; Danielson, S.; Tuler, S. Using Q Method to Reveal Social Perspectives In Environmental Research; Social and Environmental Research Institute: Greenfield, MA, USA, 2009. [Google Scholar]
  43. Van Riessen, B.; Negenborn, R.R.; Dekker, R. Synchromodal container transportation. An. overview of current topics and research opportunities. In Proceedings of the International Conference on Computational Logistics, Delft, The Netherlands, 23–25 September 2015; pp. 398–421. [Google Scholar]
Figure 1. Q-sort template (based on Watts and Stenner [9]).
Sustainability 11 03425 g001
Table 1. Statements in the Q-set.
1For our company/organization, sustainability is important
2In the near future, we want to be able to offer CO2-neutral services to our clients
3Making reefer chains more sustainable is an impossible task for our company
4It is easy for our company/organization to make reefer transportation more sustainable
5When facing a choice between cost reduction and sustainability improvements, we opt for cost reduction
6Cost reduction and sustainability improvements go hand in hand
7We are actively improving the sustainability of our services
8Sustainability is an important strategic value of our company/organization
9The port authority can play an important facilitating role when it comes to improving sustainability
10Most sustainability gains can be made by using renewable energy sources
11Energy saving is possible without compromising product quality
12We can expect an exponential growth in the use of reefer containers in the future
13We address the sustainability of our operations because other companies in our sector do this as well
14The port authority is doing everything possible to help us to operate more sustainably
15Initiatives such as CoolPort have great added value for our company/organization
16The port authority can play a major facilitating role in improving hinterland transportation
17We are willing to share parts of our data with other companies to further optimize the reefer chain
18We are willing to share parts of our data with other companies involved in the reefer chain to improve the overall sustainability of the chain
19In the future, data sharing will play a larger role in improving punctuality, quality, and sustainability
20The current business model of the port authority (renting out land and collecting port dues) is no longer suitable for the current economy
21We expect the port authority to push for sustainability
22We are very dependent on the port authority
23We prioritize reefers over dry container
24Reefers are an important component of our business model
25There are better ways to transport conditioned cargoes than outmoded reefer containers
26The development of technology for new (smart) reefers goes too slow
27Smart reefers will contribute to our company operating more sustainably
28In the future, we only want to work with newer, more sustainably operating reefer containers, instead of poorly isolated, inefficient, old reefers
29Hinterland transport of reefer containers by barge is a good option
30Hinterland transport of reefers by rail is a good option
31A lot of sustainability gains can be made in hinterland transport
32The infrastructure for hinterland transport of reefer containers by rail meets our expectations
33The performance of hinterland transport by rail meets our expectations
34For us, good hinterland transportation performs well on cost, quality, and reliability criteria
35We find the costs of hinterland transportation by rail too high
36We find the costs of hinterland transportation by truck too high
37We find the costs of hinterland transportation by barge too high
Table 2. Respondents in the P-set.
Participant nr.Type StakeholderPosition Respondent
1Shipper (flowers)Supply Chain Consultant
2Shipper association (fruit and vegetables)Director
3LSPManagement trainee
4Shipper (fruit)Logistics manager
5LSPManager
6LSPGeneral manager
7Terminal (rail)Manager
8Carrier (deepsea)Manager reefer depot
9LSPLogistics manager
10Terminal (deepsea)Consultant Business Development
11Carrier (deepsea)Managing director
12Carrier (deepsea)Director operations
13Terminal (deepsea)Manager
14Carrier (shortsea)Country manager
15Port authorityProduct lead
16LSPCFO
17Carrier (shortsea)Business development reefers
18Port authorityBusiness manager agrifood
19Carrier (deepsea)Reefer sales
20Inland barging and terminals associationJunior policy advisor
21Carrier/LSPGeneral manager logistics services
22Inland trucking associationSecretary
23Terminal (shortsea/barge)Commercial manager
24Inland barging associationPolicy advisor
25LSPManager import/export and container department
26Shipper/LSP associationPolicy advisor
27LSP/TSP (multimodal)Manager
28TSP (barge)Managing director
Table 3. Four dominant perspectives and factor loadings generated with the Varimax method, significant loadings (p < 0.05) shaded and indicated with *.
Respondent No.Factor 1Factor 2Factor 3Factor 4
10.2339−0.01120.32720.4756
20.0381−0.0280.6724 *0.2001
30.19450.0244−0.07150.616 *
40.6764 *−0.13160.3680.3621
50.39720.2240.30880.088
60.16860.5274 *0.22080.3312
70.03560.8418 *−0.1556−0.2221
80.6879 *0.05310.06730.1678
90.556 *0.3530.22050.2093
100.410.17980.40.3801
110.41690.04050.5153 *0.1243
120.5261 *0.14240.10060.0078
130.16390.16440.6011 *0.1342
140.21940.4121−0.23240.275
150.51180.24370.03970.4747
160.04220.4426 *0.2262−0.0111
170.29550.3717 *0.11040.0215
180.8218 *0.1668−0.08520.198
190.45320.21240.16770.3504
200.35350.5889 *0.19370.3047
210.13090.13320.6537 *−0.0436
220.48670.29470.39570.056
230.3674 *0.17610.10570.0715
240.0440.07950.23520.7201 *
250.08240.27730.4246−0.3363
260.44770.46850.28660.2905
270.0059−0.00320.0424−0.0039
280.5129 *0.01880.3672−0.0161
%Explained Variance1610119
No. of Defining variables7542
Average reliability coefficient0.80.80.80.8
Composite Reliability0.9660.9520.9410.889
S.E. of Factor Z-scores0.1840.2190.2430.333
Table 4. Perspective 1: Distinguishing statements and illustrative quotes.
StatementZ-scoreFactor 1Factor 2Factor 3Factor 4
7We are actively improving the sustainability of our services 2.1355001
1For our company/organization, sustainability is important1.634−133
8Sustainability is an important strategic value of our company/organization1.5724−223
5When facing a choice between cost reduction and sustainability improvements, we opt for cost reduction−1.619−4021
25There are better ways to transport conditioned cargoes than outmoded reefer containers−1.656−4−3−5−4
3Making reefer chains more sustainable is an impossible task for our company−1.824−50−1−1
Other distinguishing statements
13We address the sustainability of our operations because other companies in our sector do this as well−1.482−3−10−1
37We find the costs of hinterland transportation by barge too high−0.24504−2−3
Quotes:
-
We have been preoccupied with sustainability for years already, in order to preserve a healthy environment, and in 2004 we already received an ISO 14001 certification (Respondent 8, Carrier (deepsea))
-
Within our organization, sustainability is always on the agenda, regardless of the type of work we do […] We report on a monthly basis on aspects ranging from the use of coffee cups to our various container movements (Respondent 9, LSP)
-
There are always ways to improve the sustainability in the reefer chain; our customers also expect us to do so (Respondent 9, LSP)
-
A modal shift first requires a mindshift, companies setting the right priorities […] we just started small with regular barge transport, now it’s an attractive option […]. Parties are too hesitant, wait for others to make the first move (Respondent 23, Terminal operator)
-
Companies should invest in sustainability on their own […] subsidies and the like would only distort the market, but laws and regulations could be used to punish polluting companies (Respondent 23, Terminal operator)
-
Logistics concepts should change to address congestion and emissions, but the way of thinking, the culture in the sector is hard to change […] the port authority should have a role in bringing parties together, but should not get involved in the market […] they operate too bureaucratically and slow (Respondent 28, TSP)
Table 5. Perspective 2: Distinguishing statements and illustrative quotes.
StatementZ-scoreFactor 1Factor 2Factor 3Factor 4
17We are willing to share parts of our data with other companies to further optimize the reefer chain1.512051−2
37We find the costs of hinterland transportation by barge too high1.3804−2−3
21We expect the port authority to push for sustainability1.301−14−21
32The infrastructure for hinterland transport of reefer containers by rail meets our expectations−1.579−2−4−30
33The performance of hinterland transport by rail meets our expectations−1.748−1−4−40
6Cost reduction and sustainability improvements go hand in hand−2.144−2−5−11
Other distinguishing statements
18We are willing to share parts of our data with other companies involved in the reefer chain to improve the overall sustainability of the chain1.231131−1
20The current business model of the port authority (renting out land and collecting port dues) is no longer suitable for the current economy1.165−321−3
1For our company/organization, sustainability is important−0.5824−133
8Sustainability is an important strategic value of our company/organization−0.6944−223
28In the future, we only want to work with newer, more sustainably operating reefer containers, instead of poorly isolated, inefficient, old reefers−0.7232−210
29Hinterland transport of reefer containers by barge is a good option−0.7561−234
Quotes:
-
The handling of barges in the port is far below standards, price/quality balance is not there (Respondent 7, Terminal operator)
-
Making operations more sustainable (still) costs a lot of money (Respondent 7, Terminal operator)
-
Strive for value added activities that contribute to sustainable business, and accordingly jobs, cargo flows, and the right position in the world […] The port authority made a big mistake by [focusing on] renting out square meters (Respondent 6, LSP)
-
The rail product for reefer containers is stuck in the 1980s, it should be possible to plug in a reefer on a train, instead of using diesel guzzling and leaking gensets (Respondent 6, LSP)
-
Service providers are facing a strong pressure on costs and lead time, and work on short-term contracts, while investments require income security (Respondent 20, Inland barging and terminals association)
-
Data sharing is a ‘hot’ topic, but in the sector still contentious: the willingness is there, but the right conditions are missing […] Data sharing platforms should be considered part of port infrastructure, including a role for government […] the port authority can take up a more facilitating role [and] ensure that solution platform is neutral (Respondent 20, Inland barging and terminals association)
Table 6. Perspective 3: Distinguishing statements and illustrative quotes.
StatementZ-scoreFactor 1Factor 2Factor 3Factor 4
23We prioritize reefers over dry containers2.187−205−1
11Energy saving is possible without compromising product quality1.6491−140
19In the future, data sharing will play a larger role in improving punctuality, quality, and sustainability1.3853145
33The performance of hinterland transport by rail meets our expectations−1.475−1−4−40
14The port authority is doing everything possible to help us operate more sustainably−1.608−2−1−40
25There are better ways to transport conditioned cargoes than outmoded reefer containers−1.816−4−3−5−4
Other distinguishing statements
20The current business model of the port authority (renting out land and collecting port dues) is no longer suitable for the current economy0.52−321−3
12We can expect an exponential growth in the use of reefer containers in the future0.294330−5
31A lot of sustainability gains can be made in hinterland transport0.1672203
2In the near future, we want to be able to offer CO2-neutral services to our clients−0.18923−1−3
30Hinterland transport of reefers by rail is a good option−1.04301−20
21We expect the port authority to push for sustainability−1.058−14−21
15Initiatives such as CoolPort have great added value for our company/organization−1.15402−11
16The port authority can play a major facilitating role in improving hinterland transportation−1.42911−32
Quotes:
-
We can constantly monitor the reefers’ temperature and alerts […] we know what the priorities are and the risks to technology and product quality if they malfunction (Respondent 13, Terminal operator)
-
The port authority should first focus on the basics of excellent port processes and information management, as of now this is lacking. Lots of work to be done on that. In the hinterland there are plenty of specialists that can work on that part of the chain (Respondent 2, Shipper association)
-
In this environment of price competition, cost control is necessary to survive. Therefore: operate more sustainably. (Respondent 2, Shipper association)
-
Remote Container Management (Maersk line’s real-time track and trace technology on reefer containers, red.) is a first step to make reefer transport more efficient and sustainable, software can help to improve the efficiency of the container itself (Respondent 21, Carrier/LSP)
Table 7. Perspective 4: Distinguishing statements and illustrative quotes.
StatementZ-scoreFactor 1Factor 2Factor 3Factor 4
19In the future, data sharing will play a larger role in improving punctuality, quality, and sustainability2.4113145
29Hinterland transport of reefer containers by barge is a good option1.6391−234
9The port authority can play an important facilitating role when it comes to improving sustainability1.3491204
25There are better ways to transport conditioned cargoes than outmoded reefer containers−1.544−4−3−5−4
24Reefers are an important component of our business model−1.6392−32−4
12We can expect an exponential growth in the use of reefer containers in the future−1.834330−5
Other distinguishing statements
32The infrastructure for hinterland transport of reefer containers by rail meets our expectations0.287−2−4−30
18We are willing to share parts of our data with other companies involved in the reefer chain to improve the overall sustainability of the chain−0.482131−1
17We are willing to share parts of our data with other companies to further optimize the reefer chain−0.964051−2
2In the near future, we want to be able to offer CO2-neutral services to our clients−1.159231−3
Quotes:
-
Information provision about our activities is becoming increasingly important, because we can use it for analysis. Data is an important tool to pinpoint where we can improve punctuality, quality, and sustainability (Respondent 3, LSP)
-
There is a focus on reducing emissions, but the question remains how. Which investments will work? […] It also depends on the timeframe whether we can make substantial sustainability improvements. 5 years, no. 20 years, yes (Respondent 24, inland barging association)
-
Data sharing will play a more important role, but now the willingness to do so is low. Information can be commercially sensitive [so] if parties share, it will more likely be vertical rather than horizontal […] other parties in the market have to follow (Respondent 24, inland barging association)
-
Barge transport is a good option technologically and on price, but only if there is enough slack in the logistics chain to make it possible […] the same goes for rail (Respondent 24, inland barging association)
Table 8. Factor correlations.
Factor 1Factor 2Factor 3Factor 4
Factor 110.25650.37560.3776
Factor 20.256510.1599−0.0398
Factor 30.37560.159910.2771
Factor 40.3776−0.03980.27711
Table 9. Consensus statements (* indicates significance (p < 0.05)).
StatementFactor 1Factor 2Factor 3Factor 4
9The port authority can play an important facilitating role when it comes to improving sustainability1204
22We are very dependent on the port authority−1−2−3−1
25 *There are better ways to transport conditioned cargoes than outmoded reefer containers−4−3−5−4
26The development of technology for new (smart) reefers goes too slow0020
27 *Smart reefers will contribute to our company operating more sustainably0012
31A lot of sustainability gains can be made in hinterland transport2203
34 *For us, good hinterland transportation performs well on cost, quality, and reliability criteria3132
36We find the costs of hinterland transportation by truck too high−100−2

