Effect of Macro- and Nano-Biosolid Fractions on Sorption Affinity and Transport of Pb in a Loamy Sand Soil


1
Department of Soil Science, College of Food and Agricultural Sciences, King Saud University, P.O. Box 2460, Riyadh 11451, Saudi Arabia
2
Department of Soils and Water, Faculty of Agriculture, Suez Canal University, Ismailia 41522, Egypt
*
Author to whom correspondence should be addressed.
Sustainability 2019, 11(12), 3460; https://doi.org/10.3390/su11123460
Submission received: 7 June 2019
/
Revised: 20 June 2019
/
Accepted: 21 June 2019
/
Published: 24 June 2019
Abstract
:Applications of large amounts of biosolid to agricultural lands have raised the concern over its potential impact on co-transport of metal contaminants. In this study, bulk biosolid was fractioned into six macro- and nano-biosolid fraction sizes. We investigated variations in the physicochemical properties of the different biosolid fraction sizes, and assessed sorption affinity and transport of Pb in a loamy sand soil. Decreasing biosolid fraction size from macro to nano resulted in consistent increases in surface area, surface charge, and a decrease in pore size. Biosolid particles >1000 µm showed similar surface properties that differ from biosolid particles < 1000 µm. Sorption affinity for Pb was larger on nano-biosolid as compared to all macro-biosolid fraction sizes. This is mainly attributed to the larger surface area and zeta potential of nano-biosolid, leading to increased surface reactivity and greater stability. Total amount eluted of Pb was increased in the presence of macro- and nano-biosolid by 21.3% and 45.6%, respectively. Our findings suggest that the application of the >1000 µm biosolid fractions can help to minimize adverse effects of biosolid applied in areas susceptible to potential environmental risk of contamination by heavy metals. Further assessment of potential mobility of nano-biosolid at the field scale is needed before the recommendation of including such approach during land application of biosolid.
1. Introduction
In the past decades, there has been an increasing environmental concern over the contamination associated with the accumulation of heavy metals in soils and its impact on human health. Many sources contribute to the increased accumulation of heavy metals in subsurface layers and groundwater, including emissions from industrial areas, mine tailings, sewage sludge, spillage of petrochemicals, and agricultural fertilizers and waste products [1]. The contamination of soils and groundwater with heavy metals may pose risks and hazards to humans and the ecosystem. Therefore, assessing mechanisms and control factors of sorption and transport of heavy metals in subsurface layers is crucial for effective and successful remediation of contaminated sites [2].
Land application of municipal solid waste (i.e., biosolid) has become a common recycling practice in many places to improve the physical and chemical properties of soil [3,4]. However, application of large amounts of biosolid to soil may pose a significant risk of increasing heavy metals contamination in soil and groundwater [5]. Several studies have shown that heavy metals may associate with the different fraction sizes of biosolid, hereby affecting many environmental processes including dispersion, nutrient cycling, contaminant transport, and remediation processes [6,7]. Biosolid contains particles in different size fractions ranging from macro- to nano-size [8]. Nano-biosolid possess a larger surface area, high organic matter content, and higher reactivity and, therefore, is most likely to increase the potential to sorb and transport heavy metal contaminants to larger distances [9].
The physico-chemical properties of biosolid will vary among the different size fractions of the produced biosolid. For example, biosolid particles larger than 0.8 mm are characterized by low nutrient content and higher concentrations of heavy metals [10]. On the other hand, nano-biosolid usually exhibit enhanced stability due to its larger surface charge, and therefore have the ability to travel to deeper distances in the subsurface layers. After 48 h of interaction with 2 mg L−1 contaminants solution, nano-biosolid showed greater stability as compared to its corresponding macro-biosolid fractions [8]. Therefore, size fractionation can help to increase the efficiency of biosolid as a soil amendment and minimize any detrimental impacts on soil and groundwater resources [11].
The sorption behavior of heavy metal contaminants is also controlled by travel time and pore water velocity. A leaching experiment of undistributed soil monoliths with contaminant colloid suspension of 220–1050 nm in diameter produced eluted nano-colloids with a mean diameter range of 50–120 nm, and increased load of metal contaminants [12]. Despite the large sorption affinity of Pb in soil, the transport of Pb in undisturbed soil columns was dramatically increased in the presence of mineral and organic colloidal particles. This facilitated transport was largest with particles that showed a high surface area and electrophoretic mobility [13].
The impact of natural nanoparticles (e.g., nano-biosolid) on the transport of heavy metal contaminants is also controlled by the physiochemical properties present in the subsurface environment. Electrostatic repulsion between the usually negatively charged nanoparticles and subsurface media may prevent particle deposition. Furthermore, the surface charge (zeta potential) of the nanoparticle will vary with different chemical conditions, and hence will affect the degree of stability of nanoparticles in the subsurface media. This will greatly impact the stability of nanoparticle and its ability to facilitate the co-transport of heavy metal contaminants in soil [14].
The physical and chemical characteristics of nano-biosolid are drastically different from those of macro-biosolid. Therefore, it is anticipated that their impact on the facilitated co-transport of metal contaminants will vary, with more sorption expected with the nano-biosolid due to its larger surface area and higher reactivity. The objectives of this study were to determine variations in the chemical, physical, and surface properties of macro- and nano-biosolid fractions, and to assess the effect of macro- and nano-biosolid fractions on sorption affinity and transport of Pb in a loamy sand soil under unsaturated flow conditions.
2. Materials and Methods
2.1. Soil Sampling and Preparation
A bulk sample was collected from the surface (0–30 cm) soil of the industrial city region in Riyadh, Saudi Arabia (24°32′58.1” N and 46°55′30.0” E). The soil sample was air dried and passed through a 2-mm sieve. The physical and chemical characteristics of the soil sample were determined according to standard procedures [15]. The saturated hydraulic conductivity was determined by the constant-head method [16]. The mineral composition of the soil sample was determined by X-ray diffraction (Shimadzu XRD 7000). The soil was characterized as a loamy sand (Typic Torriorthents) with good drainage. Selected physical and chemical properties of the soil sample are presented in Table 1.
2.2. Biosolid Fractionation and Characterization
The biosolid sample was collected from the wastewater treatment plant south of Riyadh. The biosolid sample was collected from the final resulted sludge subject to aerobic digestion and full treatment. The dry mass of the collected biosolid was determined by oven drying (forced aeration) at 70 °C for 72 h. The chemical composition and elemental content of the biosolid were determined according to standard methods [15]. Selected chemical properties of the bulk biosolid sample are presented in Table 1. The fractionation of the macro-biosolid size fractions was carried out by dry sieving using a set of 2, 1, 0.5, and 0.1 mm sieves. The resulted macro-biosolid had the following size fractions: >2000, 2000–1000, 1000–500, 500–100, and <100 µm, referred to hereafter as F0, F1, F2, F3, and F4, respectively. Nano-biosolid were prepared by suspending 1 g of the smallest macro-biosolid size fraction (i.e., 0.1 mm) in 1 L of nano-pure water, sonicated for 30 min (Ultrasonic sonicator Q700, Qsonica, Newtown, CT, USA), and left for gravity sedimentation for 48 h. Nano-biosolid suspended in the upper 3 cm of the beaker were collected and transferred into a new container. The volume of the original suspension was completed again to 1 L with nano-pure water, sonicated for 5 min, and left for another cycle of gravity sedimentation. After three cycles of nano-biosolid collection, the suspension was discarded, and the process was repeated with a fresh 1 g of the 0.1 mm macro-biosolid. The surface and crystallographic structure of the biosolid particles were investigated using scanning electron microscope (SEM) (EFI, S50, Inspect, Eindhoven, The Netherlands) (Figure 1). Size fractionation of the macro- and nano-biosolid was confirmed by the measurement of the average hydrodynamic size by dynamic light scattering (Zetasizer Nano ZS, Malvern Instruments, Malvern, UK). The average hydrodynamic size of the nano-biosolid was 350 ± 10.2 nm, referred to hereafter as F5. Zeta potential of macro- and nano-biosolid was determined by measuring the electrophoretic mobility (Zetasizer Nano ZS, Malvern Instruments, Malvern, UK) of 100 mg L−1 macro- and nano-biosolid suspensions in nano-pure water. Measurements of electrophoretic mobility were converted to zeta potential using the Smoluchowski approximation. The specific surface area, pore volume, and pore size of the macro- and nano-biosolid fractions were determined by the BET method with nitrogen (N2) at 77 K using surface area and microporosity analyzer (ASAP 2020, Micromeritics, Norcross, GA, USA). For both macro- and nano-biosolid size fractions, stock suspensions of 50 mg L−1 were prepared and used in all experiments.
2.3. Pb Sorption
Sorption affinity of the macro- and nano-biosolid suspensions for Pb was evaluated by determining adsorption isotherms in triplicate macro- and nano-biosolid suspensions of 50 mg L−1 prepared in nano-pure water, and spiked with 0, 2, 4, 6, 8, and 10 mg L−1 of Pb. Analytical grade PbCl2 was used to prepare the required equilibrium aqueous solutions of Pb. Isotherm samples were prepared in 50 mL polyethylene tubes and equilibrated by shaking for 24 h at room temperature (25 °C). The pH of the suspended macro- and nano-biosolid was determined at time zero and at the end of the shaking time. No significant differences were observed between the two pH measurements. After shaking, the samples were filtered through 0.2 µm PTFE syringe filter to obtain the supernatant, which was analyzed within 24 h by the inductively coupled plasma-optical emission spectrometry (ICP-OES). The amount sorbed per mass of biosolid was calculated as [17]:
where is the amount sorbed (mg g−1), is the initial concentration of Pb contaminant (mg L−1), is the equilibrium concentration of Pb (mg L−1), and is the mass of sorbent (g). The removal efficiency of Pb was calculated as:
The linear form of Freundlich and Langmuir isotherm models were used to quantify the equilibrium data. The Freundlich isotherm model was calculated as:
where is the Freundlich isotherm constant (L g−1) and is adsorption intensity (-). The Langmuir isotherm model was calculated as:
where is the maximum monolayer coverage capacity (mg g−1) and is the Langmuir isotherm constant (L mg−1). The nature of the Langmuir isotherm was also assessed by the calculation of the dimensionless separation factor, as:
between zero and 1 indicates favorable sorption, whereas greater than 1 indicate unfavorable sorption, and equals 1 is an indication of linear sorption.
2.4. Pb Column Leaching
Pb leaching was carried out using acrylic soil columns (4 cm ID and 30 cm length). The columns were sealed at the bottom using a nylon membrane (45 μm pore opening). The soil was wet-packed (2% W/W) to a bulk density of 1.5 g cm−3 in 5-cm increments to eliminate particle segregation. Prior to Pb leaching, the columns were pre-conditioned by flushing the soil with nano-pure water from the bottom using a peristaltic pump. Ten pore volumes (PV) were passed through the columns to ensure appropriate pre-conditioning of the soil matrix for the transport experiment. This was evident by monitoring column outflow and observing steady-state conditions. After pre-conditioning the soil column, 5 PV of 50 mg L−1 macro- and nano-biosolid suspensions (spiked with 10 mg L−1 Pb) were pumped through the columns. This was followed by flushing the columns with 3 PV of nano-pure water to ensure complete leaching. Flow of biosolid suspensions and nano-pure water was conducted under unsaturated, steady-state, downward movement. Two macro-biosolid (F1 and F4) and one nano-biosolid (F5) size fractions were used in the Pb column leaching. Control columns (i.e., biosolid-free) were subject to the same procedures of Pb concentration and flow conditions. The outflow from the columns were collected with a fraction collector. The concentration of Pb in the effluent was determined by ICP-OES. Breakthrough curves of Pb were plotted as a function of pore volume; that is, cumulative water outflow normalized by the column pore volume. Triplicate columns were used for each treatment, and all experiments were carried out at ambient laboratory conditions (23 ± 2 °C).
2.5. Statistical Analysis
All experiments were conducted in three replicates. Statistical analysis was performed using the software SPSS for Windows (version 21, SPSS Inc, Chicago, IL, USA). Data values were presented as averages, and the standard accepted error level among the triplicate measurements was ≤10%. The least significant difference (LSD at p < 0.05) test was applied to assess the difference among treatments [18].
3. Results
3.1. Macro- and Nano-Biosolid Properties
Analysis of macro- and nano-biosolid fractions revealed that nano-biosolid represented only 1.2% of the bulk biosolid (Table 2). Despite this small percentage, nano-biosolid showed unique surface properties and much larger surface area as compared to macro-biosolid. BET surface area of the F5 fraction was increased by 918%, 873%, 28%, and 18% as compared to the surface area of the F1, F2, F3, and F4 fractions, respectively (Table 2). Statistical analysis showed no significant difference in total surface area between the largest two macro-biosolid fractions (F1 and F2). SEM images showed more uniform structure and smaller particle sizes as biosolid fractions get smaller (Figure 1). Cumulative volume of pores increased by decreasing fraction size of biosolid. No significant differences were observed between F1 and F2, and between F3 and F4 macro-biosolid fractions. On the other hand, nano-biosolid showed significant increase in total pore volume as compared to all macro-biosolid fractions. Measurement of average pore diameter showed that all macro- and nano-biosolid fractions were in the mesopores range. However, nano-biosolid (F5) had the smallest pore size, and the increase in pore size of the F1, F2, F3, and F4 macro-biosolid fractions reached 72.6%, 71.9%, 25.4%, and 15.8%, respectively (Table 2). Larger negative zeta potential was observed with the nano-biosolid fraction (F5). Average zeta potential of macro- and nano-biosolid fractions reached −14.4 and −15.6 mV, respectively. Even with the macro-biosolid fractions, increasingly negative zeta potentials were observed as the biosolid fraction was decreased from F0 to F4 (Table 2).
Chemical properties of the macro- and nano-biosolid fractions showed much less variation as compared to their physical and surface properties. In general, no significant differences (limited significance in a few cases) were observed in the values of EC, pH, cations, and anions among the different macro- and nano-biosolid fractions (Table 3). Conversely, the metal content of Cu, Ni, As, and Cr was much larger in the nano-biosolid (F5) and the smallest macro-biosolid (F4) fractions as compared to all other macro-biosolid (F0, F1, F2, and F3) fractions (Table 3). Our results are consistent with Sharifi and Renella [11] who found no significant differences in the values of pH and macro nutrients among seven size fractions (from 2 to 0.1 mm) of municipal solid waste, and only slight increase in EC and metal content with decreasing of particle size.
3.2. Sorption Affinity of Pb
Adsorption data showed that nano-biosolid always had larger amounts of sorbed () of Pb as compared to all macro-biosolid fractions. The increase in the amount sorbed between nano- and macro-biosolid fractions ranged between 1.7% and 15.1% and was greatest at larger Pb concentrations (Table 4). Removal efficiency of macro- and nano-biosolid fractions ranged between 85.2% and 91.5%, respectively, and was in the order F1 < F2 < F3 < F4 < F5.
Adsorption data fitted well to the Freundlich isotherm with an average R2 of 0.83 and 0.88 for the macro- and nano-biosolid fractions, respectively. Freundlich isotherms indicated a greater Pb sorption affinity with the nano-biosolid (F5) fraction as compared to the macro-biosolid (F1:F4) fractions. The amount retained on the F5 nano-biosolid fraction increased by 50.1%, 40.3%, 7.7% and 12.1% of the amount retained on the F1, F2, F3, and F4 macro-biosolid fractions, respectively (Table 5).
The larger of nano-biosolid with cationic contaminants (e.g., Pb) is mainly attributed to the larger surface area and greater negative zeta potential (Table 2) [8]. Adsorption intensity showed favorable sorption of Pb on both macro- and nano-biosolid fractions as indicated by 1/n values < 1.0. Values of 1/n ranged between 0.505 and 0.696, with no significant differences between macro- and nano-biosolid fractions except with F4, which showed the lowest 1/n. These results suggest that the energy of sorption is decreasing with the increase of the surface coverage [5]. The Langmuir isotherm also fitted well to adsorption data with slightly larger R2 that reached 0.9 and 0.94 for the macro- and nano-biosolid fractions, respectively. However, the Langmuir isotherms indicated a mixed sorption affinity between macro- and nano-biosolid fractions. The Langmuir isotherm constant ( was larger in F4 and F5 followed by F1, F2, and F3 biosolid fractions (Table 5). The separation factor ( was between zero and 1 indicating favorable sorption of Pb on all macro- and nano-biosolid fractions.
3.3. Breakthrough Curves of Pb
Breakthrough curves (BTC) of Pb leaching showed that relative concentration (RC) of the eluted Pb was always larger in the presence of macro- and nano-biosolid fractions. The increase in maximum RC in comparison to the control (biosolid-free) reached 28%, 27%, and 38% in the F1, F4, and F5 biosolid fractions, respectively (Figure 2). The large increase in the RC of Pb associated with the nano-biosolid fraction (F5) is attributed to its larger surface area and increased zeta potential (Table 2). In addition, larger zeta potential indicates increased resistance to coagulation [19], and enhanced nano-biosolid stability in aqueous suspensions. Therefore, nano-biosolid particles are expected to remain suspended for a long time, which facilitates the co-transport of Pb into deeper depths and increase amount eluted over time. Because of the strong sorption affinity of Pb with soil and particle surfaces, most of the mobility of Pb is carried out through facilitated co-transport with the associated particulate material [20]. Our results showed that sorption affinity of Pb was the largest with nano-biosolid (Table 5), hence, the increased mobility of Pb through facilitated co-transport with the F5 biosolid fraction.
In general, BTC of eluted Pb were characterized by an irregular shape during the first four PV. This pattern indicates that the transport of macro- and nano-biosolid particles is interrupted by the formation of clusters that can block the flow pathway, followed by another cycle of convective flux as these clusters are flushed with the buildup of water pressure [21]. Early BTC and long tailing were also observed with both macro- and nano-biosolid, this is an indication of the occurrence of preferential flow through soil macropores, and the existence of chemical and physical nonequilibrium conditions. Maximum RC of the eluted Pb was reached earlier (after 0.4 PV) with the macro-biosolid fractions (F1 and F4) as compared to the nano-biosolid (F5) that needed 0.8 PV to reach maximum RC (Figure 2). This delay in the maximum RC of eluted Pb with the nano-biosolid indicates that a certain threshold of Pb sorption on soil matrix and nano-biosolid particles has to be reached before large amounts of Pb are eluted [22]. BTC of eluted Pb with the nano-biosolid also showed a second maximum at 3.6 PV. Multiple maxima is another evidence of the irregular nature of Pb transport in the presence of nano-biosolid that was not visible with the macro-biosolid fraction.
3.4. Amount Eluted of Pb
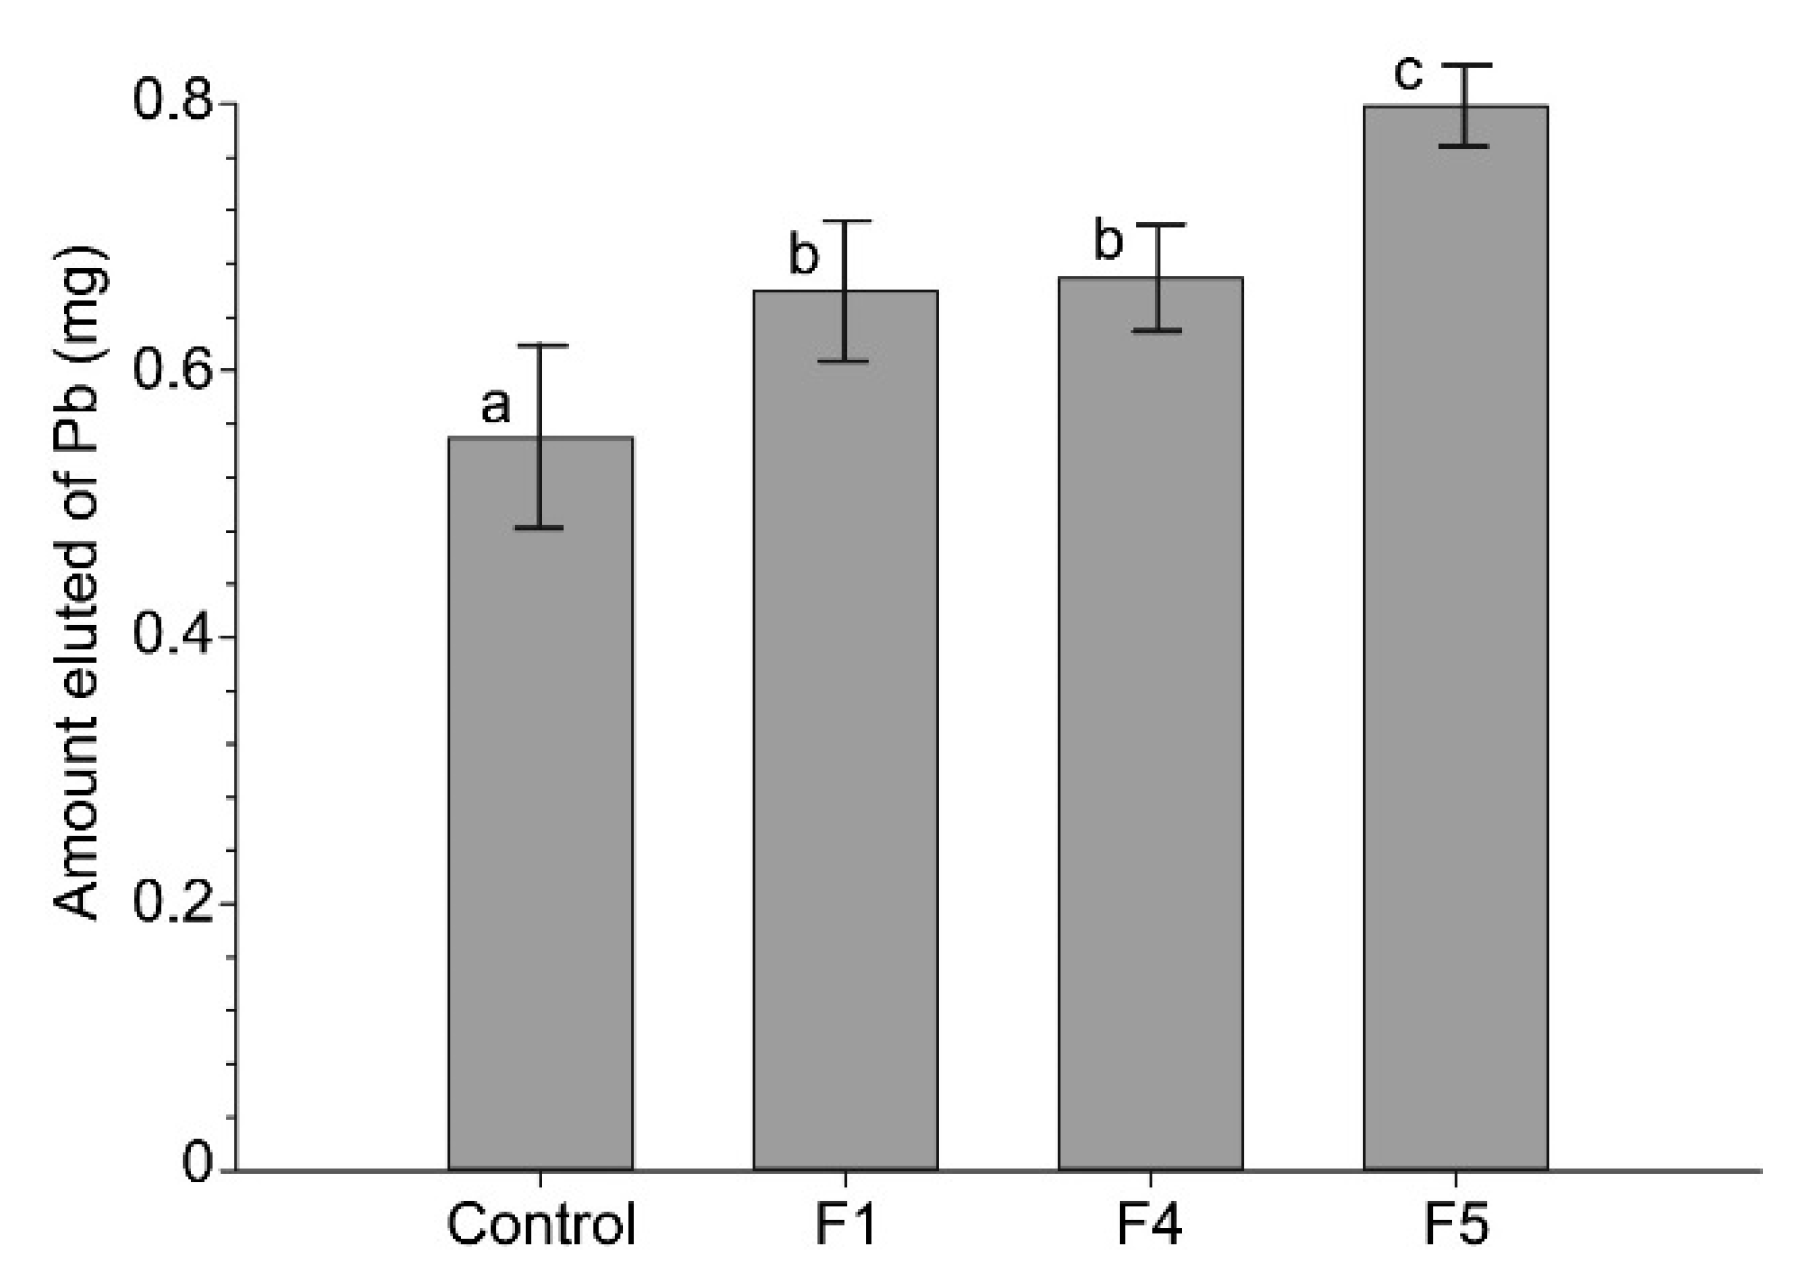
The total amount eluted of Pb was increased by 21.3% and 45.6% in the presence of macro- and nano-biosolid fractions, respectively (Figure 3). Despite the large increase in the total amount eluted of Pb in the presence of biosolid particles, the recovery rate of Pb reached only 5.5%, 6.6%, 6.7%, and 8.1% for the control, F1, F4, and F5 biosolid fractions, respectively. In general, recovery rates of Pb in leaching experiments are not high because of the strong affinity of the soil matrix and other organic particulate for Pb [23]. Variable results for the recovery rates of Pb were reported, for example, by Karathanasis et al. [5] using lime-stabilized biosolid with an average particle diameter of 0.41 µm, found that the Pb recovery rate was in the range of 5–19%. Much lower recovery rates of 0.8% and 1.1% were reported by Karathanasis et al. [20] for Pb bound with macro- and nano-biosolid, respectively. No significant difference was observed between the two macro-biosolid fractions (F1 and F4). These results indicate that the behavior of macro-biosolid in the range of 100–2000 µm size fraction, under our experimental conditions, was very similar and did not show any significant effect on the increase of the total amount eluted of Pb among the macro-biosolid fraction sizes. In contrast, the amount of Pb eluted was increased by more than 2-fold with the nano-biosolid as compared to the amount eluted with the macro-biosolid fractions.
4. Conclusions
The results of this study demonstrated that nano-biosolid had larger metal content of Cu, Ni, As, and Cr, whereas values of EC, pH, and major ions did not vary significantly between macro- and nano-biosolid fraction sizes. Based on the physical and surface properties, the six studied biosolid fraction sizes can be categorized into two groups at the size fraction of 1000 µm. Biosolid fractions F0:F2 (>1000 µm) had low surface area, larger pore size, and low surface charge, whereas biosolid fractions F3:F5 (<1000 µm) had larger surface area, smaller pore size, and larger surface charge. Nano-biosolid fraction size (F5) exhibited the largest surface area and zeta potential, leading to increased surface reactivity and greater stability. Sorption affinity for Pb was larger on nano-biosolid as compared to all macro-biosolid fraction sizes. In contrast, sorption affinity for Pb on macro-biosolid fraction sizes showed varying degrees, and was in the order F3 > F4 < F2 < F1. The presence of macro- and nano-biosolid increased the total amount eluted of Pb by 21.3% and 45.6%, respectively, as compared to the control (biosolid-free). With its larger surface area and increased surface charge, nano-biosolid particles are expected to remain stable for a long time, which facilitates the co-transport of Pb into deeper depths and increase amount eluted over time.
Our results indicate that nano-biosolid have large potential to co-facilitate the transport of metal contaminants to subsurface soil, posing a higher environmental risk of soil and groundwater contamination. This risk is even larger with cationic metals (e.g., Pb) because of its strong affinity with nano-biosolid, which eliminate competitive interaction with the soil matrix, and allow the associated metal to travel longer distances in the soil. Our findings suggest that the fractionation of the studied biosolid into two groups of fraction sizes of larger and smaller than 1000 µm can be used as an approach to increase the quality of the produced biosolid, and limit potential risks for its use. The two proposed fractions will have similar chemical and fertilizing value, however, the application of the < 1000 µm biosolid fractions can be limited to areas less susceptible to potential environmental risk of contamination by heavy metals. Further investigation on potential mobility of nano-biosolid and facilitated co-transport of metal contaminants at the field scale are needed before the recommendation of including such approach during land application of biosolid.
Author Contributions
Conceptualization, H.M.I. and A.G.A.; methodology, H.M.I.; software, H.M.I.; validation, H.M.I. and A.G.A.; formal analysis, H.M.I. and A.G.A.; investigation, H.M.I. and A.G.A.; resources, H.M.I. and A.G.A.; data curation, H.M.I. and A.G.A.; writing—original draft preparation, H.M.I. and A.G.A.; writing—review and editing, H.M.I.; visualization, H.M.I.; supervision, H.M.I.; project administration, H.M.I.; funding acquisition, A.G.A.
Funding
The authors extend their appreciation to the Deanship of Scientific Research at King Saud University for funding this work through the Research Project No R6-17-03-61.
Conflicts of Interest
The authors declare no conflict of interest.
References
- Khan, S.; Cao, Q.; Zheng, Y.M.; Huang, Y.Z.; Zhu, Y.G. Health risks of heavy metals in contaminated soils and food crops irrigated with wastewater in Beijing, China. Environ. Pollut. 2008, 152, 686–692. [Google Scholar] [CrossRef] [PubMed]
- Adriano, D.C. Trace Elements in Terrestrial Environments: Bi-Geochemistry, Bioavailability and Risks of Metals, 2nd ed.; Springer: New York, NY, USA, 2003. [Google Scholar]
- Wuana, R.A.; Okieimen, F.E. Heavy metals in contaminated soils: A review of sources, chemistry, risks and best available strategies for remediation. ISRN Ecol. 2011, 2011, 402647. [Google Scholar] [CrossRef]
- Alghamdi, A.; Kirkham, M.B.; Presley, D.R.; Hettiarachchi, G.; Murray, L. Rehabilitation of an abandoned mine site with biosolid. In Spoil to Soil: Mine Site Rehabilitation and Revegetation; Bolan, N., Kirkham, M.B., Ok, Y.S., Eds.; Chapter 14; CRC Press, Taylor and Francis Group: Boca Raton, FL, USA, 2018; pp. 241–258. [Google Scholar]
- Karathanasis, A.D.; Johnson, D.M.C.; Matocha, C.J. Biosolid Colloid-Mediated Transport of Copper, Zinc, and Lead in Waste-Amended Soils. J. Environ. Qual. 2005, 34, 1153–1164. [Google Scholar] [CrossRef] [PubMed]
- Karathanasis, A.D.; Ming, D.A. Colloid-mediated transport of metals associated with lime-stabilized biosolid. Dev. Soil Sci. 2002, 28, 49–62. [Google Scholar]
- Karathanasis, A.D.; Johnson, D.M.C. Stability and Transportability of Biosolid Colloids through Undisturbed Soil Monoliths. Geoderma 2006, 130, 334–345. [Google Scholar] [CrossRef]
- Ghezzi, J.; Karathanasis, A.; Matocha, C.; Unrine, J.; Thompson, Y. Stability of Soil and Biosolid Nanocolloid and Macrocolloid Particles in the Absence and Presence of Arsenic, Selenium, Copper and Lead. Open J. Soil Sci. 2014, 4, 293–304. [Google Scholar] [CrossRef]
- Maurice, P.A.; Hochella, M.F., Jr. Nanoscale Particles and Processes: A New Dimension in Soil Science. Adv. Agron. 2008, 100, 123–153. [Google Scholar]
- Zhao, S.; Liu, X.; Dou, L. Physical and chemical characterization of municipal solid waste compost in different particle size fractions. Pol. J. Environ. Stud. 2012, 21, 509–515. [Google Scholar]
- Sharifi, Z.; Renella, G. Assessment of a particle size fractionation as a technology for reducing heavy metal, salinity and impurities from compost produced by municipal solid waste. Waste Manag. 2015, 38, 95–101. [Google Scholar] [CrossRef] [PubMed]
- Seta, A.K.; Karathanasis, A.D. Stability and transportability of water- dispersible soil colloids. Soil Sci. 1997, 61, 604–611. [Google Scholar] [CrossRef]
- Karathanasis, A.D. Composition and transport behavior of soil nanocolloids in natural porous media. In Nanoparticles in the Water Cycle; Chapter 4; Frimmel, F.H., NieBner, R., Eds.; Springer: Berlin, Germany, 2010. [Google Scholar]
- McCarthy, J.F.; McKay, L.D. Colloid transport in the subsurface: Past, present and future challenges. Vadose Zone J. 2004, 3, 326–337. [Google Scholar] [CrossRef]
- Sparks, D.L.; Page, A.L.; Helmke, P.A.; Leoppert, R.H.; Soltanpour, P.N.; Tabatabai, M.A.; Johnston, G.T.; Sumner, M.E. Methods of Soil Analysis; Soil Science Society of America: Madison, WI, USA, 1996. [Google Scholar]
- Reynolds, W.D.; Elrick, D.E.; Youngs, E.G.; Amoozegar, A.; Booltink, H.W.G.; Bouma, J. Saturated and field-saturated water flow parameters. In Methods of Soil Analysis: Part 4. Physical Methods; Dane, J.H., Topp, G.C., Eds.; Soil Science Society of America: Madison, WI, USA, 2002. [Google Scholar]
- Vanderborght, M.; Van Griekenm, E. Enrichment of trace metals in water by adsorption on activated carbon. Anal. Chem. 1977, 49, 311–316. [Google Scholar] [CrossRef] [PubMed]
- SPSS, Inc. IBM SPSS Statistics Version 21; International Business Machines Corp: Boston, MA, USA, 2012. [Google Scholar]
- Kjaergaard, C.; Hansen, H.C.B.; Koch, C.B.; Villholth, K.G. Properties of water-dispersible colloids from macropore deposits and bulk horizons of an Agrudalf. Soil Sci. Soc. Am. J. 2004, 68, 1844–1852. [Google Scholar] [CrossRef]
- Karathanasis, A.D.; Ghezzi, J.L.; Wendroth, O.; Matocha, C.J.; Unrine, J.; Thompson, Y.L. Subsurface transport of As, Se, Cu, and Pb contaminants in association with soil and biosolid nano- and macro-colloid fractions. Austin J. Hydrol. 2014, 1, 1–13. [Google Scholar]
- Jacobsen, O.H.; Moldrup, P.; Larsen, C.; Konnerup, L.; Petersen, L.W. Particle transport in macropores of undisturbed soil columns. J. Hydrol. 1997, 196, 185–203. [Google Scholar] [CrossRef]
- Karathanasis, A.D.; Johnson, D.M.C. Subsurface transport of Cd, Cr, and Mo mediated by biosolid colloids. Sci. Total Environ. 2006, 354, 157–169. [Google Scholar] [CrossRef] [PubMed]
- Logan, E.M.; Pulford, I.D.; Cook, G.T.; Mackenzie, A.B. Complexation of Cu2+ and Pb2+ by peat and humic acid. Eur. J. Soil Sci. 1997, 48, 685–697. [Google Scholar] [CrossRef]
Figure 1.
SEM images of F1, 2000–1000 µm (A,B); and F4, <100 µm (C,D) biosolid fraction sizes.

Figure 2.
Effect of macro- and nano-biosolid fractions on breakthrough curves of Pb. Biosolid fractions: Control, biosolid-free; F1, 2000–1000 µm; F4, <100 µm; F5, 0.35 µm.
Figure 2.
Effect of macro- and nano-biosolid fractions on breakthrough curves of Pb. Biosolid fractions: Control, biosolid-free; F1, 2000–1000 µm; F4, <100 µm; F5, 0.35 µm.
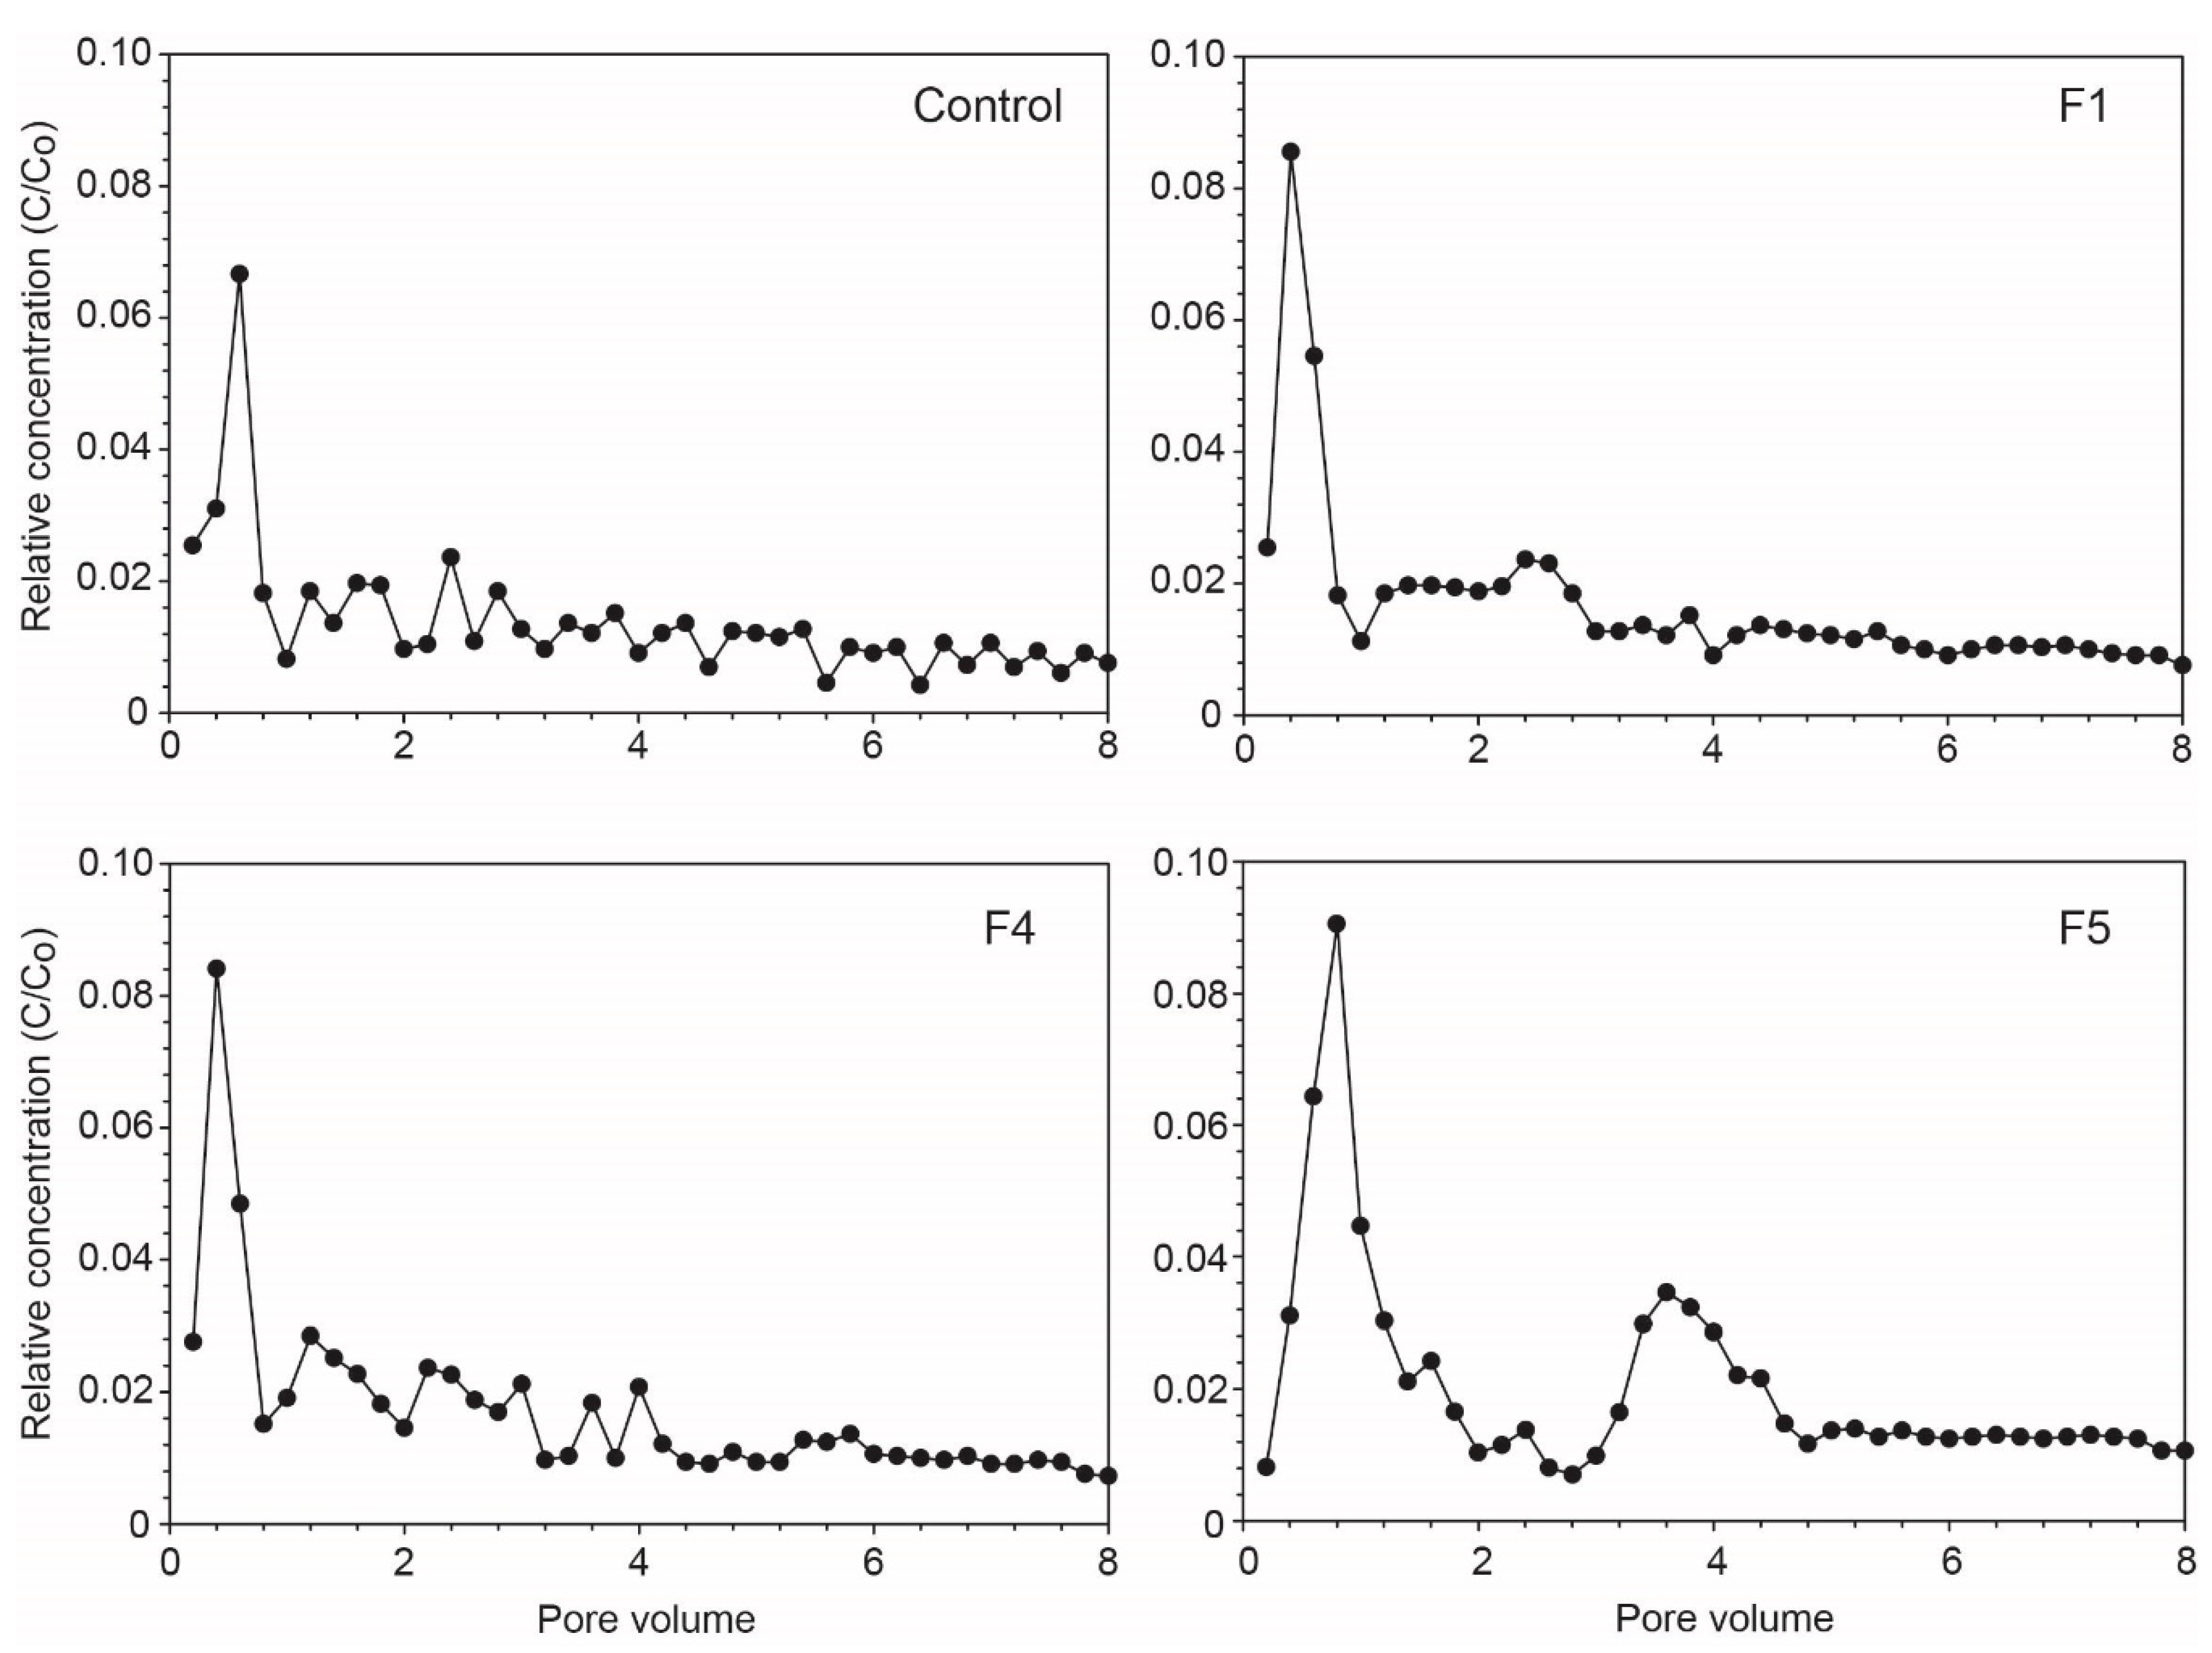
Figure 3.
Effect of macro- and nano-biosolid fractions on the total amount eluted of Pb (mg). Biosolid fractions: Control, biosolid-free; F1, 2000–1000 µm; F4, <100 µm; F5, 0.35 µm. Alphabetical letters indicate significant differences (p < 0.05) among means of the different treatments. Error bars represent ± 1 SD.

Table 1.
Basic chemical and physical properties of the loamy sandy soil and bulk biosolid.
| Properties | Units | Soil | Biosolid |
|---|---|---|---|
| EC | (ds m−1) | 2.96 | 6.1 |
| pH (in water) | - | 7.48 | 7.7 |
| OM | (%) | 0.18 | 71.2 |
| Sand | (%) | 87.5 | - |
| Silt | (%) | 5.4 | - |
| Clay | (%) | 7.1 | - |
| CaCO3 | (%) | 21.05 | - |
| Ks | (cm s−1) | 8.01 × 10⁻⁴ | - |
| Cations: | (meq L−1) | ||
| Ca+2 | 5.17 | 13.0 | |
| Mg+2 | 3.33 | 17.0 | |
| Na+1 | 20.61 | 25.1 | |
| K+1 | 1.26 | 5.2 | |
| Anions: | (meq L−1) | ||
| Cl− | 11.33 | 14.0 | |
| HCO3− | 1.17 | 29.3 | |
| SO4−2 | 16.33 | 6.0 | |
| Metals: | (mg g−1) | ||
| Zn | 6.1 | 652.6 | |
| Cu | 12.6 | 280.2 | |
| Ni | 11.1 | 23.7 | |
| As | ND | 1.1 | |
| Cr | 10.9 | 39.2 | |
| Pb | ND | 0.2 |
EC, electrical conductivity; OM, organic matter; Ks, saturated hydraulic conductivity. ND, non-detectable.
Table 2.
Size and surface properties of the macro- and nano-biosolid fractions.
| Biosolid Fraction | Size | Percent to Whole 1 | Surface Area 2 | Pore Volume 3 | Pore Size 4 | Zeta Potential 5 |
|---|---|---|---|---|---|---|
| (µm) | (%) | (m2 g−1) | (cm3 g−1) | (Å) | (mV) | |
| F0 | >2000 | 18.2 | - | - | - | −13.6 a |
| F1 | 2000–1000 | 17.6 | 0.22 a | 0.00194 a | 354.2 a | −14.4 b |
| F2 | 1000–500 | 22.6 | 0.23 a | 0.00202 a | 352.6 a | −14.7 c |
| F3 | 500–100 | 31.5 | 1.75 b | 0.01125 b | 257.3 b | −14.8 cd |
| F4 | <100 | 8.9 | 1.89 c | 0.01122 b | 237.6 c | −14.9 d |
| F5 | 0.35 | 1.2 | 2.24 d | 0.01148 c | 205.1 d | −15.6 e |
Biosolid fraction: F0, >2000; F1, 2000–1000; F2, 1000–500; F3, 500–100; F4, <100; F5, 0.35 µm. Different superscript letters indicate significant differences (p < 0.05) among mean values in each column. 1 Percent to whole calculated on dry weight basis. 2 BET total surface area. 3 BJH adsorption/desorption cumulative volume of pores. 4 BJH adsorption/desorption average pore diameter (4×pore volume/surface area). 5 Calculated by measurement of electrophoretic mobility and the application of Smoluchowski approximation.
Table 3.
Chemical properties of the macro- and nano-biosolid fractions.
| Properties | Units | Biosolid Fraction | |||||
|---|---|---|---|---|---|---|---|
| F0 | F1 | F2 | F3 | F4 | F5 | ||
| EC | (dS m−1) | 5.9 a | 6.5 b | 6.1 a | 5.9 a | 6.2 a | 6.1 a |
| pH | - | 7.7 a | 7.9 a | 7.5 b | 7.6 b | 7.6 b | 7.9 a |
| Cations: | (meq L−1) | ||||||
| Ca+2 | 14.0 a | 13.6 a | 12.0 c | 17.6 d | 17.2 d | 15.6 e | |
| Mg+2 | 17.0 a | 17.6 b | 20.0 c | 18.4 d | 17.2 ab | 21.6 e | |
| Na+1 | 25.1 a | 26.8 b | 26.1 c | 26.9 b | 26.9 b | 25.7 d | |
| K+1 | 5.2 a | 5.8 b | 6.1 c | 6.5 d | 6.2 c | 6.0 bc | |
| Anions: | (meq L−1) | ||||||
| Cl− | 12.0 a | 11.6 b | 12.0 a | 14.0 c | 13.0 d | 12.8 d | |
| HCO3− | 29.4 a | 29.0 a | 27.0 b | 28.0 c | 30.0 d | 29.0 a | |
| SO4−2 | 6.0 a | 5.9 a | 6.0 a | 6.1 a | 6.1 a | 6.1 a | |
| Metals: | (mg kg−1) | ||||||
| Zn | 700.8 a | 719.7 a | 663.8 b | 667.5 b | 623.5 c | 607.4 c | |
| Cu | 271.2 a | 214.3 b | 309.2 c | 264.6 a | 338.6 d | 336.9 d | |
| Ni | 20.7 a | 21.8 a | 19.7 a | 21.4 a | 32.8 b | 30.8 b | |
| As | ND | ND | ND | ND | ND | 1.1 a | |
| Cr | 34.5 a | 37.6 a | 34.8 a | 36.3 a | 58.6 b | 58.2 b | |
Biosolid fraction: F0, >2000; F1, 2000–1000; F2, 1000–500; F3, 500–100; F4, <100; F5, 0.35 µm. Different superscript letters indicate significant differences (p < 0.05) among mean values in each row. ND, non-detectable.
Table 4.
Adsorption data of macro- and nano-biosolid fractions in Pb solutions with different concentration.
Table 4.
Adsorption data of macro- and nano-biosolid fractions in Pb solutions with different concentration.
| Biosolid Fraction | Concentration (mg L−1) | |||||
|---|---|---|---|---|---|---|
| 0 | 2 | 4 | 6 | 8 | 10 | |
| (mg L−1) | ||||||
| F1 | 0.140 a | 0.229 a | 0.471 a | 0.804 a | 1.213 a | 2.245 a |
| F2 | 0.139 a | 0.220 b | 0.417 b | 0.667 b | 1.005 b | 2.068 b |
| F3 | 0.148 b | 0.195 b | 0.289 c | 0.380 c | 0.911 c | 1.380 c |
| F4 | 0.137 c | 0.151 c | 0.220 d | 0.253 d | 1.393 d | 0.974 d |
| F5 | 0.136 c | 0.142 d | 0.244 d | 0.355 e | 1.009 b | 1.075 e |
| (mg g−1) | ||||||
| F1 | −0.028 a | 0.354 a | 0.706 a | 1.039 a | 1.358 a | 1.551 a |
| F2 | −0.028 a | 0.356 a | 0.717 a | 1.067 b | 1.399 b | 1.586 b |
| F3 | −0.030 b | 0.361 b | 0.742 b | 1.124 c | 1.418 b | 1.724 c |
| F4 | −0.027 a | 0.370 c | 0.756 b | 1.149 d | 1.321 c | 1.805 d |
| F5 | −0.027 a | 0.372 c | 0.751 b | 1.129 d | 1.398 b | 1.785 e |
| Removal efficiency (%) | ||||||
| F1 | - | 88.6 a | 88.2 a | 86.6 a | 84.8 a | 77.6 a |
| F2 | - | 89.0 a | 89.6 b | 88.9 b | 87.4 b | 79.3 b |
| F3 | - | 90.2 b | 92.8 c | 93.7 c | 88.6 c | 86.2 c |
| F4 | - | 92.5 c | 94.5 d | 95.8 d | 82.6 d | 90.3 d |
| F5 | - | 92.9 c | 93.9 e | 94.1 e | 84.4 e | 89.3 e |
Biosolid fraction: F1, 2000–1000; F2, 1000–500; F3, 500–100; F4, <100; F5, 0.35 µm.
equilibrium concentration of adsorbate;
amount adsorbed at equilibrium. Different superscript letters indicate significant differences (p < 0.05) among mean values in each column.
Table 5.
Parameters of the Freundlich and Langmuir adsorption isotherms of Pb on the different macro- and nano-biosolid fractions.
Table 5.
Parameters of the Freundlich and Langmuir adsorption isotherms of Pb on the different macro- and nano-biosolid fractions.
| Biosolid Fraction | Freundlich Parameters | Langmuir Parameters | |||||
|---|---|---|---|---|---|---|---|
| 1/n | R2 | R2 | |||||
| (L g−1) | (-) | - | (mg g−1) | (L mg−1) | (-) | - | |
| F1 | 1.07 a | 0.661 a | 0.95 | 4.35 a | 0.392 a | 0.338 a | 0.99 |
| F2 | 1.19 b | 0.676 a | 0.91 | 5.16 b | 0.348 b | 0.363 b | 0.98 |
| F3 | 1.55 c | 0.696 a | 0.83 | 21.1 c | 0.102 c | 0.641 c | 0.87 |
| F4 | 1.49 c | 0.505 b | 0.66 | 4.58 a | 0.721 d | 0.225 d | 0.76 |
| F5 | 1.67 d | 0.651 a | 0.88 | 5.33 d | 0.567 e | 0.266 e | 0.94 |
Biosolid fraction: F1, 2000–1000; F2, 1000–500; F3, 500–100; F4, <100; F5, 0.35 µm;
the Freundlich isotherm constant; n, adsorption intensity; , maximum monolayer coverage capacity; , the Langmuir isotherm constant; ,
separation factor; different superscript letters indicate significant differences (p < 0.05) among mean values in each column.
© 2019 by the authors. Licensee MDPI, Basel, Switzerland. This article is an open access article distributed under the terms and conditions of the Creative Commons Attribution (CC BY) license (http://creativecommons.org/licenses/by/4.0/).
Share and Cite
MDPI and ACS Style
Alghamdi, A.G.; Ibrahim, H.M. Effect of Macro- and Nano-Biosolid Fractions on Sorption Affinity and Transport of Pb in a Loamy Sand Soil. Sustainability 2019, 11, 3460. https://doi.org/10.3390/su11123460
AMA Style
Alghamdi AG, Ibrahim HM. Effect of Macro- and Nano-Biosolid Fractions on Sorption Affinity and Transport of Pb in a Loamy Sand Soil. Sustainability. 2019; 11(12):3460. https://doi.org/10.3390/su11123460
Chicago/Turabian StyleAlghamdi, Abdulaziz G., and Hesham M. Ibrahim. 2019. "Effect of Macro- and Nano-Biosolid Fractions on Sorption Affinity and Transport of Pb in a Loamy Sand Soil" Sustainability 11, no. 12: 3460. https://doi.org/10.3390/su11123460
Note that from the first issue of 2016, this journal uses article numbers instead of page numbers. See further details here.