Sustainable Local Currency Debt: An Analysis of Foreigners’ Korea Treasury Bonds Investments Using a LA-VARX Model


1
Seoul Business School, aSSIST, 46 Ewhayeodae 2-gil, Seodaemun-gu, Seoul 03767, Korea
2
BSL Business School Lausanne, Rte. de la Maladière 21, P.O. Box, CH—1022 Chavannes (VD), Switzerland
*
Authors to whom correspondence should be addressed.
Sustainability 2019, 11(13), 3603; https://doi.org/10.3390/su11133603
Submission received: 6 June 2019
/
Revised: 26 June 2019
/
Accepted: 27 June 2019
/
Published: 30 June 2019
(This article belongs to the Special Issue Application of Time Series Analyses in Business)
Abstract
:Foreign investors’ interest in Korean local currency bonds, and especially in Korea Treasury Bonds (KTBs) has increased significantly since the mid-2000s. This paper examines the determinants of foreign investors’ KTB investments by means of a lag-augmented vector autoregressive model with exogenous variables (LA-VARX). The model specification includes variables capturing the domestic, international, and risk factors. The risk factors are especially important in the context of South Korea since geopolitical tensions and economic policy uncertainty might adversely affect all investment decisions by foreigners. We find that expected return rates, country default risks, and global economic conditions have a significant impact on foreign investors’ KTB investment, but geopolitical risks have only a short-term negative impact. Our findings not for only provide a better understanding of the determinants of financial investments in South Korean financial markets, but they have broader implications in terms of the economic and social aspects of sustainability in South Korea. This is because KTBs provide a source of funding for the South Korean government for social projects and that KTBs are also held largely by long-term investors such as pension funds and insurers which require stable and sustainable investments.
1. Introduction
This study aims to identify the key decision-making factors of foreign investors in investing in Korea Treasury Bonds (KTBs). This is important since foreign investment in the South Korean financial markets have increased substantially since the mid-2000s. In particular, we examine to what degree geopolitical risk plays a role in foreign investors’ decisions with regards to the KTB markets, given the geopolitical specificity of the Korean Peninsula. We also include the recently developed economic policy uncertainty index as a risk variable in the model to investigate the impact of economic policy uncertainties on KTB investments by foreign investors. The inclusion of geopolitical risk factors and economic policy uncertainty amongst the determinants of foreign investors’ decision to invest in South Korean financial markets is one of the contributions of this paper. The risk factors are especially important in the context of South Korea since geopolitical tensions and policy uncertainty could adversely affect all investment decisions by foreigners.
This research has important implications for both investors and issuers not only in terms of financial market investments but also in terms of the social aspects of sustainability in Korea.
(1) For domestic investors, following the expansion of the retirement pension scheme and the introduction of risk-based capital (RBC) requirements, non-bank financial institutions including pension funds and insurance companies are increasingly investing in KTBs. In fact, nearly 50% of total KTB issuance is held by Korea’s insurance company and pension fund as of the end of 2018. If foreign investors are very sensitive to risk factors, their actions could destabilize the KTB market and negatively affect the economic sustainability of Korea’s pension fund and insurance sector with social sustainability consequences.
(2) In the case of the South Korean government, which is required to issue KTBs continuously, it is important to secure quality foreign investors to cover national revenue shortfalls and national budget financing. As shown in Figure 1, the issuance of KTBs has increased significantly, and the increase is expected to continue in the future.
McKenzie [2] states social sustainability occurs when formal and informal processes, systems, structures, and relationships actively support the ability of current and future generations to form a healthy and livable communities. Also, he argues that a socially sustainable community is equitable, diverse, connected, and democratic, and provide a good quality of life. The need for social sustainability began in developed countries and gradually expanded to emerging economies and developing countries [3,4].
In South Korea, the stability of the KTB market is an important pillar supporting the current government’s goal of a ‘people-centered economy’ to overcome structural problems in the economy, such as economic inequality (negative polarization) and low growth. In fact, the South Korean government’s budget for fiscal 2019 reached a record high of KRW 469.6 trillion (US$ 421.2 billion). This is an increase of 9.6 percent from 2018 and 32.1 percent from 2014 [5]. Specifically, there have been a major increase in various areas, including health, welfare, employment, education, and the environment. Revenue raised by the government via KTBs are used to finance these projects. Indeed, foreign investors’ holdings of government bonds continue to increase, and their market influence grows, it is difficult to raise government funds through the successful issuance of KTBs without stable foreign investment. It is therefore important that government decision-makers have a deep understanding of the investment patterns and decisions of foreign investors. It is also important to actively understand and manage the government bond market in order to avoid foreigners’ deviation from the government bond market due to investment impediments in the context of a sustainable society. With these points in mind, this study examines the determinants of foreigners’ KTB holdings in a model of portfolio choice involving domestic and international factors and augmented by risk factors and economic policy uncertainty.
On the methodological side, we employ modern time series analysis techniques in this study. In particular, we use the lag-augmented vector autoregressive model with exogenous variables (LA-VARX). The LA-VAR allows us to use variables with possibly different orders of integration in a vector autoregressive (VAR) model and prevents the loss of information due to potential over-differencing. The geopolitical risk variable is included as an exogenous variable in the model since the geopolitical risk in the Korean Peninsula is assumed not to be affected by the models’ variables, while geopolitical risk might affect the variables included in the model.
Since the late 1990s, global financial market integration has rapidly increased [6], and recently, low interest rates and quantitative easing policies in developed countries have provided the international financial markets with ample liquidity, allowing investors to act more aggressively and diversely [7]. In fact, global portfolio funds have become more interested in emerging markets and have started investing not only in emerging market equities but also in emerging market bonds. After the financial crisis of the late 1990s, emerging economies, which previously lacked financial infrastructure, have recognized the importance of the local currency bond market to secure a stable inflow of funds, and made great efforts to secure quality investors [8]. Raising more local currency funds from international investors also reduces the currency mismatch between assets and liabilities in emerging countries, which helps stabilize their financial markets by improving the maturity structure of their debt and increasing the efficiency of capital allocation by creating appropriate long-term interest rate markets [9]. In 2008, local bond markets in emerging countries experienced a massive capital outflow as the global financial crisis heightened. However, investors quickly regained confidence in emerging economies due to their relatively strong growth performance, worldwide monetary easing, and fiscal stimulus.
As shown in Table 1, South Korea’s bond market holds a significant edge over other major emerging economies in terms of market structural factors such as market size, liquidity, and stability of international credit ratings, and is more competitive than some advanced economies. South Korea is the world’s fourth-largest local currency bond market after Japan, China, and Canada with an outstanding balance of US$ 2014 billion as of the end of 2018. Its liquidity is the highest in the world with an average of 0.5 basis points (bps) of the bid–ask spread for on-the-run [10,11], and its derivatives markets for risk-hedging are also well-developed compared to other emerging countries. The average time to maturity of Korean government bonds is 10.03 years, which is much longer than that of major countries—such as Japan, France, Canada and Germany—and South Korea’s sovereign credit rating is Aa2 (stable) by Moody’s and AA by S&P, which is higher than that of other emerging economies as of the end of 2018. In addition, South Korea ranked fifth in the world with the World Bank’s Doing Business 2019 score of 84.14, which is higher than the OECD high-income countries’ average of 77.81 [12].
According to the Ministry of Economy and Finance (MoEF) and Financial Supervisory Service (FSS) in South Korea, the share of foreign investors’ holding of Korean domestic bonds have increased significantly from 0.6% (US$ 4.9 billion) in 2006, to 6.6% (US$ 101.8 billion) in 2018—see Figure S1. As of the end of 2018, the ratio of foreign investment in the Korea Treasury Bonds including Monetary Stabilization Bonds was 15.2 % (US$ 100.8 billion) of the total amount issued. Also, global investors’ investment in Korea’s bond market has improved greatly in terms of diversify. While foreign central banks and foreign public wealth management companies have increased their investment in long-term bonds, the proportion of global commercial banks and foreign assets management firms seeking short-term gains has decreased, and the number of investment countries increased and diversified from 19 countries in 2006 to 47 countries in 2018 [13].
However, increased volatility in the financial markets and the growing impact of global investors in emerging financial markets have led to the need for more active risk management for both policymakers and investors. According to the IMF’s World Economic Outlook for 2019, global expansion has weakened. The global growth forecast for 2019 and 2020 was revised downward at 3.3 percent in 2019 and 3.6 percent in 2020, which is 0.4 and 0.1 percentage below last October’s projections, partly because of the negative effects of tariff increases enacted in the U.S. and China. Also, uncertainty over Brexit is a downside risk to the outlook for the European Union [18,19].
For emerging markets that are more sensitive to market volatility [19], it is important to understand the trends and decision-making factors of global investors in order to proactively respond to these potential risks. Recent indicators regarding South Korea show that the economy grew at a slower pace in the first quarter of 2019 [20]. Industrial output fell in January and February 2019, with growth in manufacturing and construction falling in contrast to the growth posted in the fourth quarter of 2018. Exports in the first quarter of 2019 also marked the first annual decline in more than two years, and trade surplus also shrank. In addition, volatility in the financial markets has increased significantly in recent months.
Most previous studies on foreign investors’ investment in the Korean financial market have attempted to identify patterns of foreign investment in South Korea by arbitrarily setting some financial and economic variables and associating investment returns with specific variables. This study aims to contribute to the literature by augmenting the conventional international portfolio investment decision models by utilizing the recently developed economic policy uncertainty index and geopolitical risk index, considering that foreign investment can be affected by risk factors. In particular, although Korea’s geopolitical instability is relatively large, the study contributes to providing new implications because it has never considered geopolitical risk factors in previous studies on Korean bond investment.
This analysis provides further insight and implications for government decision-makers who want to manage the financial market reliably and to investors seeking stable returns and links our research with social dimensions of sustainability.
2. Literature Review
The continued development of information and communication technology and financial markets have created an environment that allows investors to invest not only in their home countries but also in various regions, including emerging markets. In terms of global portfolio investment behavior, research on portfolios that mix stocks and bonds is common, and more recently, studies on the diversification of investment portfolios are being actively conducted. Hansson et al. [21] reported that diversified investment effects are more pronounced when emerging market bonds are incorporated into portfolios composed of developed government bonds and that this could help increase profitability. There are also papers that have studied global investors’ investment diversification from a risk perspective. Solnik and McLeavey [22] classified the risks of foreign bond investments as credit risk, market risk, and foreign exchange risk. After this classification, many studies analyzing determinants of bond investment by global investors have found that arbitrage opportunities based on interest rate parity theory [23,24], as well as credit default swap (CDS) spreads [25], global liquidity [26], and foreign exchange rates [27] are important variables.
In this section, we provide a detailed review of the existing literature in two parts. First, we examine previous studies on the determinant of Korean bond investments by foreign investors. Next, we focus our review particularly on the variables that will be employed in our empirical analyses.
With the expansion of the bond market and the changing patterns of foreign investors’ investment in KTBs, related research topics have also changed. Since global investors rarely invested in Korean bonds before 2007, most studies focused on finding reasons as to why global investors’ investments in Korean local bonds were sluggish. However, since 2007, foreign investors’ investments in Korean bonds have started to increase significantly, and the direction of the research has focused on identifying the main causes of global investors’ investment in Korean bonds. Specifically, Won and Cho [28] argued that the foreign investors’ investment in Korean domestic bonds is highly dependent on the expected return on risk-free arbitrage transactions and to the country’s credit risk. Kim and Lee [29] reported that swap spreads, credit risk, and global liquidity risks play an important role in foreign investors’ investment in Korean local bonds. Yoon and Kim [30] found that market volatility and global liquidity have a significant impact on the inflow of investments into the Korean bond markets, but also that economic growth and interest rate does not have a significant effect. Park et al. [31] analyzed that foreign investors’ decision to invest in bonds was strongly influenced by arbitrage trading opportunities before the global financial crisis but was more affected by the stock market movements after the global financial crisis. On the other hand, Kim et al. [32] argued that the determinants of Korean bond investment were the effective interest rates in South Korea, in addition to industrial production, interest rates, and volatility in developed countries.
Various studies were conducted to analyze the impact of each element of the financial markets on cross-border investment. With regards to the exchange rate, most studies showed that an increase in exchange rate volatility has a negative effect on cross-border stocks and bond investment, and that the stock market, bond market, and foreign exchange markets have a close correlation with each other [33,34]. On the other hand, Kim [35] argued that unstable exchange rates reduce investment in the stock market but does not affect the bond market significantly.
Credit default swap (CDS) is widely used as the index of credit risk [36,37]. Many researchers have developed CDS pricing models, including Duffie [38]; Hull and White [39]; Houweling and Vorst [40]. Duffie argued that the CDS premium and corporate bond spread should be the same due to arbitrage trading called Duffie’s parity. Collin-Dufresne and Goldstein [41] reported that the interdependence between the CDS and the stock market is relatively higher than the correlation between the bond market and the stock market.
With regards to studies that analyzed stocks and bonds, most studies on diversification of risks in government bond investments showed that there was a reverse correlation between the bond markets and the stock markets, suggesting that bonds could be a hedging instrument for capital risk [42,43,44,45].
The central bank’s interest rate adjustment, especially the Federal Reserve’s decision on policy interest rates, is a major variable that affects the global bond and stock markets. Several studies have shown that interest rate policy has a large impact on liquidity [46,47], and others have analyzed the transmission path and effect of interest rate policy [48,49]. Park and Kim [50] argued that the policy rate adjustment of the Fed after the financial crisis had a significant impact on the price of Korean government bonds, and Lee [51] reported a negative relationship between changes in the Fed policy rate and the return of Korean stocks.
Many previous studies have shown that oil prices have a significant impact on macroeconomic and financial markets. Most studies have shown that rising oil prices have a negative impact on the economy, but Hooker [52] concluded that oil prices have not had a statistically significant impact on the U.S. economy since 1973, and that previous literature on oil prices is exaggerated. Shigeki [53] used the vector autoregression (VAR) model in Brazil, China, India, and Russia to investigate the relationship between oil prices and stock returns and found a positive relationship between oil prices and real stock returns in all but Brazil. In addition, Çevik et al. [54] employed time-varying Granger-causality tests and detected Granger-causal relationships between oil prices and emerging market stock returns and volatility around the global financial crisis period.
The TED spread is the difference between the three-month U.S. Treasury bill and the three-month US$ London Interbank Offer Rate (LIBOR). TED spread is used as an indicator of credit risk. This is because the U.S. Treasury bill is a risk-free asset and the US$ LIBOR includes bank credit risk when borrowing money from international banks. Widening of the TED spreads is considered to be an increase in the default risk of interbank lending. For example, after the collapse of Lehman Brothers in 2008, the TED spread was the highest at 450 basis points. Coffey et al. [55] defined the TED spread as the shadow price of capital and concluded that the TED spread is an important variable explaining the arbitrage margin. Kawaller [56] argued that if the TED spread narrows, stocks and bond prices will rise and provide information that predicts future interest rates.
Changes in basis swap spread have a large impact on cross-border investment. This is the main reason that global investors have significantly increased investment in KTBs in the mid and late 2000s. Existing research has traditionally focused on deviations of cross-currency basis swaps from covered interest rate parity [57,58]. Miron and Swannell [59] argued that basis can be temporarily out of range due to capital market uncertainties but will thereafter recover to some extent due to risk-free arbitrage trading in the market, and that basis is the phenomenon caused by an imbalance in supply and demand due to lack of liquidity in the market. Additionally, they explained that the reason that the theory of interest rate parity theory is not well-applied in the forward market is due to government regulations on international capital movements, foreign exchange control, taxes, and transaction costs
Many studies have found that sovereign bond spreads are determined by country specific factors and global risk factors [60,61]. In the case of emerging economies, there has been previous research showing that bond spreads increased excessively when the global economy becomes unstable [62]. It was confirmed that the short-term and long-term interest rates reversed when the US recession occurred. At present, the slope of the yield curve has become one of the most important indicators of economic outlook [63]. Estrella and Mishkin [64] calculated the likelihood that the U.S. economy would enter a recession due to short- and long-term interest rate differentials. Mehl [65] obtained positive results using short-term and long-term U.S. interest rate differentials to test economic forecasts for emerging economies.
An increase in volatility lowers the stability and efficiency of the financial markets and financial institutions, weakens the effectiveness of monetary policy, and shrinks real economic activity such as consumption, investment, and exports. Lee and Lee [66] estimated that the volatility spillover effect from the CDS market to the asset market is evident and has a stronger spillover effect during and after the financial crisis. Antonakakis and Badinger [67] found an important correlation between economic growth and volatility.
In addition, macroeconomic and fiscal soundness of the country also have an impact on cross-border investment, and several studies have been conducted. Early financial research was led by the arbitrage pricing theory [68], and there have been many studies examining the impact of macroeconomic indicators on the bond and stock markets. Bjornland and Leitemo [69] found that interdependence between interest rates and stock returns was high based on research using the CPI, the Industrial Production index, the US policy rate and the commodity price index. Mahmood and Dinniah [70] looked at the relationship between the CPI, industrial production indexes, FX rates, and stock prices and found that there is a long-term relationship between macroeconomic factors and stock prices. Ang and Piazzesi [71] and Diebold et al. [72] argued that economic growth and inflation have a positive impact on bond risk premiums. Kim and Lee [73] concluded that the monetary policy decision process is mainly affected by the CPI, short-term and long-term interest rates, the industrial production index, and the stock price index.
A country’s credit rating is an important determinant of cross border investment. A country’s credit rating has been shown to affect the cost that rated countries face when borrowing [74], the amount of foreign direct investments and bank inflows [75], and the amount of development in their financial sector and the domestic stock market [76]. Reisen and Maltzan [77] concluded that the ratings of international rating agencies had a significant impact on emerging bond markets.
A country’s fiscal soundness is an important metric for cross border investment, and there have been many debates between fiscal deficits, government debt, and economic growth. According to the traditional view, high deficit financing and public debt can increase long-term interest rates [78], increase taxation and inflation [79], and increase uncertainty in the economic outlook, eventually leading to a negative impact on economic growth [80,81]. In addition, these adverse effects can cause financial crises in extreme cases [82]. On the other hand, it is widely accepted that higher capitalization can be achieved if capital constraints are placed on resource constraints, such as underdeveloped countries, if capital is used for productive investment. However, many theories point out that debt can have a negative impact on growth above a certain level [83,84]. Capital inflows from foreign countries may be positive for economic growth, but this can lead to macroeconomic imbalances such as excessive expansion of aggregate demand, overheating of the economy, inflation, real exchange rate overvaluation, and current account deterioration. Also, the rapid outflow of capital may lead to an economic crisis [85]. Therefore, from the viewpoint of foreign investors, foreign exchange reserves can be an indicator of safety in the country that they are investing in. Foreign exchange reserves of emerging economies have been reported to significantly increase after the Asian financial crisis to prevent another crisis [86]. Aizenman and Marion [87] found that countries with a high level of foreign exchange reserves and stable exchange rates could reduce production losses in times of crisis.
Political, geopolitical, and regulatory issues are also factor that influence investment. However, not many studies have been done in the past because these factors are difficult to quantify and analyze their effects. However, there have been attempts to measure the effect of political events through various phenomena observed in financial markets. The relationship between economic performance and the political business cycle was first analyzed by Nordhaus [88]. Since then, Huang [89] found a correlation between presidential elections and economic cycles. Le Vu and Zak [90] argued that economic risk, political instability, and policy volatility are positively correlated with capital outflows, and that the most important variable is political instability. Bilson et al. [91] found that the average returns in countries with reduced political risks in emerging markets are about 11% higher than those in risky countries. Geopolitical uncertainty in the Korean peninsula is higher than in any other region due to division and confrontation between the two Koreas. However, there are relatively few studies on the effects of inter-Korean relations on the financial markets. Some studies analyzed the effect of inter-Korean relations news on the stock index, focusing on the correlation between inter-Korean relations and stock market and concluded that foreign investors generally did not respond sensitively to inter-Korean news [92,93,94].
Another important factor influencing economic and investment decisions is the uncertainty of the government’s economic policies [95]. Pastor and Veronesi [96,97] argued that there is a strong correlation between US economic policy uncertainty and stock volatility. Bloom [98] and Basu [99] found that uncertainties in economic policies and regulations are considered major risk factors and can significantly affect future corporate profits. Barth et al. [100] argued that the government should intervene in the market in order to improve the asymmetry among trading participants and to pursue financial market stability. However, they also stated that, if the regulation is too excessive, economic efficiency will be lowered due to the restriction of capital mobility. Jomini [101] argued that the government should consider the benefits and costs of regulation in advance.
Cheng et al [102] found that if investors question the fairness and frequent changes in tax laws, it could adversely affect investors’ investment decisions. In the past, investors have been confused by the Korean government’s repeated reform of the withholding tax system for foreign investors.
Inefficiency in the financial market are mainly caused by problems in the structure of the market, and market transparency and liquidity are considered to be representative measures in measuring the efficiency of market structure [103]. The level of market transparency affects not only proper price discovery but also market reliability and investor protection. Market transparency is also known to be related to market liquidity. Market liquidity can be measured not only by transaction size, but also by transaction cost, price continuity, and market impact [104]. Bloomfield and O’Hara [105] argued that improving bond market transparency positively contributes to market liquidity.
Several studies have analyzed the protection of property rights as an important factor when foreign investors make investment decisions. Investing in a country with a lower level of protection of property rights would require an additional risk premium on the possibility of default, and foreign investors would avoid investing in the country’s bonds. La Porta et al. [106] found a positive correlation between the degree of protection of property rights and the stock market. He used three indicators to measure this: the corruption index, the private property forfeiture index, and the contract denial index. Bae et al. [107] used IMF’s Coordinated Portfolio Investment Survey (CPIS) results to analyze foreign bond investment determinants, and they found that the degree of protection of property rights was the most important factor in determining the retention of domestic bonds by foreigners, while macroeconomic variables such as inflation, interest rates, and gross domestic product did not have a significant impact on foreign bond investment.
3. Model and Methodology
3.1. Model
Foreign investors’ KTB holdings is the focus of this study (please see Figure S1 in the Supplementary Materials). The empirical model includes six additional variables that are selected from a list of candidate variables identified as being potentially important from the previous studies in the literature. Table S1 in the Supplementary Materials provides the full list of the candidate variables that were used in previous analyses. We used the backward elimination method in an OLS regression to reduce the potential list variables with KTB holdings as the dependent variables and the list of the candidate variables as explanatory variables. Section 4.1.1 provides further details. At the end of the analyses, six variables were identified as capturing the domestic, international, and risk factors explaining the KTB holdings by foreign investors. These variables are: KTB yield, KTB TED CCIRS, ROK CDS, U.S. Treasury Bond yield curve slope, Korean economic policy uncertainty, and Korean geopolitical risk. The theoretical rationale and the expected signs for these variables is as follows. The variable short names used in the analysis are shown in parentheses.
(1) The 10-year KTB yield (KTBY)—The 10-year KTB is the most liquid bond and benchmark yield of Korean bond investment. KTB yields are an important determinant of investment decisions, especially for investors who prefer long-term bond investments rather than short-term capital gains, such as foreign central banks and foreign public wealth management funds, and those who do not hedge currency and bankruptcy risks. As higher KTB yields are expected to boost KTB investments by foreign investors, we hypothesize that the expected sign of KTBY on KTB holdings (KTBH) to be positive. However, for aggressive investors seeking short-term capital gains, such as hedge funds, a rise in KTB yields can negatively affect the holding of KTB.
(2) The KTB TED CCIRS spread (KTED)—This variable serves as a proxy for measuring risk-free arbitrage transactions, excluding the risk of bankruptcy. KTB TED CCIRS is calculated as the spread between the five-year KTB yield and the five-year KRW (Korean Won) against the US$ Cross Currency Interest Rate Swap (CCIRS) rate, the most actively traded spread in the market, which is mainly an important determinant of investment by global commercial banks and mutual funds. We expect a negative effect from KTED to KTBH since a narrower KTB TED CCIRS spread will likely lead some of foreign investors to reduce their KTB holdings.
(3) South Korea’s (ROK) sovereign credit default swap (CDS) price (KCDS)—The KCDS variable is used as a hedge or insurance policy against default on bonds or loan receivables, and investors pay the CDS premium through CDS transactions and transfer some of these credit risks. CDS premium is used by investors investing in KTBs to measure South Korea’s sovereign default risk. In this study, the five-year ROK CDS, the most actively traded CDS, was used. As the default risk of South Korea increases, foreign investors are likely to reduce their holdings of KTBs. Hence, the expected sign of KCDS on KTBH is negative.
(4) The yield curve slope of the U.S. Treasury bonds (UCUV)—The UCUV variable stands as an indicator for the global financial market conditions. Among various global leading or lagging indices, we used the U.S. Treasury yield curve between the ten-year U.S. Treasury yield and five-year Treasury yield that could affect KTB investors. The yield curve slope allows us to predict the future direction of the economy, and the fluctuation of the curve has a direct and rapid ripple effect on other financial markets. In other words, the U.S. Treasury’s yield curve could be used to measure the direction of the global economy, and an inverted or down-sloped yield curve suggests yields on longer-term bonds may continue to fall, corresponding to periods of economic recession. The yield curve slope can be a measure of risk for bond investors and can have a significant impact on the return on investment. A widening yield curve slope in U.S. Treasury is expected to give a positive signal as investors are more likely to invest in risky assets, making them more likely to hold KTBs classified as risky assets. Hence, a positive sign is expected over the long term.
(5) The Korean Economic Policy Uncertainty (KEPU) Index—As we have already identified in the literature review, various political, policy, and environmental factors with uncertainty and geopolitical risks influence investors’ investment decisions. In the past, such risks could be difficult to analyze in time series studies due to the lack of a continuous and systematic indicator. Recently, there has been an effort to develop an index for economic and policy uncertainty, and in this study, we use the EPU index developed by Baker et al. [108]. Each national EPU index reflects the relative frequency of newspaper article on specific topics, which is determined by focusing on articles about three terms: economy, policy, and uncertainty. In other words, the value of the monthly EPU index in each country is proportional to the share of newspaper articles discussing economic policy uncertainty in that month. For Korea, six newspapers—Donga Ilbo, Kyunghyang, Maeil Economic, Hankyoreh, Hankook Ilbo, and Korea Economic Daily (from 1995)—were used. The number of newspaper articles containing the terms: uncertain or uncertainty; economic, economy or commerce; and one or more of the following policy-relevant terms: government, “Blue House”, congress, authorities, legislation, tax, regulation, “Bank of Korea”, “central bank”, deficit, WTO, law/bill or “ministry of finance”, were counted to calculate the EPU index. The EPU index has been used to study the economy in recent years [109,110,111]. Figure 2 shows that many domestic and international events have affected the Korean EPU index. We expect the analysis results to be a negative sign because the increase in uncertainty is likely to negatively affect investor sentiment.
(6) The Korean Geopolitical Risk (KGEO) Index—For geopolitical risk factors, we used the KGEO index developed by Caldara and Lacobielo of the Federal Reserve Board. The GEO index [112] aggregates the number of articles related to geopolitical risk in eleven-domestic and foreign newspapers and calculates the index and publishes the global benchmark and indices on 18 emerging countries each month. The index contains articles that make explicit references to geopolitical risks, such as references to military tensions around the world involving U.S. intervention, statements directly related to nuclear tension, war threats and terrorist threats, and so on. Figure 2 displays the developments in South Korean geopolitical risk (KGEO) index with an event timeline. Since Korea’s geopolitical risks could sharply dampen investor sentiment, the expected sign is likely to be negative in the short term. Whether the potentially negative initial effect in a longer time horizon is not clear and it is key point of investigation in this paper.
The six variables discussed above are further classified as domestic, international, and risk factors. Table 2 shows the variables and their classification in our empirical model.
The sample period extends from October 2000, which is when the Korean government introduced the bond mark to the market evaluation system, to the end of 2018.
3.2. Methodology
We employ the vector autoregression model (VAR) to analyze the interrelationships among the variables included in our empirical model with a focus on the KTB holdings by foreign investors. In international financial markets, many factors are interlinked and involve feedback mechanisms. Hence, the VAR model is suitable for the purpose of our paper since it treats all variables as endogeneous without the need to make a distinction between endogenous and exogeneous variables. The VAR model, however, also allows for the use of exogeneous variables in the model specification if there is a priori information that some variables can be treated as exogenenous. This led to the VAR model with exogenous variables, or VARX. VAR models were popularized by Sims [118] and widely used in economic analysis and forecasting. The VAR methodology and its extensions have been a workhorse of time series econometrics since the 1980s.
It is widely accepted that the variables in a VAR model should be stationary, or I(0) variables. If the variables included in a VAR model have higher orders of integration, such as I(1), there are several options available. The first is to use the standard VAR model with all the variables in levels. In this case, the parameter estimates are not consistent, but some proponents of VARs argue that the VAR model can still be used to calculate the dynamic multipliers, that is impulse response functions (IRFs). The argument is that inducing stationarity on non-stationary variables (e.g., by taking the differences until they are stationary) leads to loss of information [119]. Secondly, it is possible to use the first (or higher) differences of non-stationary variables and set up a standard VAR structure with all the variables being I(0). This might lead to loss of information due to differencing. Third, whether there is cointegrating relationship among the non-stationary variables can be tested if those variables are cointegrated, a vector error correction model (VECM) can be used. In this case, there is no loss of information and any long-run relationships among the variables are also included in the model structure. Fourth, if there is no cointegrating relationship among/between the non-stationary variables, a VAR model in levels of all the variables in the model can still be used if the model is augmented or expanded by additional lags that are equal to the highest degree of integration among the non-stationary variables. The parameter estimates are consistent, and the theory is derived by [120], known in the literature as the Toda–Yamamoto procedure. In the VAR context, this approach leads to the lag-augmented VAR model, or LA-VAR.
Technically speaking, the LA-VAR model can be expressed as follows. The model can include both stationary and non-stationary variables in levels
where t = 1,…, is the error term and it follows a mean zero stationary process. The lag length in the LA-VAR model is set as p = k + d(max), where k is the true (or optimal) lag length of the series, and d is the highest order of integration among the non-stationary variables. For instance, if the maximum order of integration is 2, then the lag length in LA-VAR should be k + 2. Hence, in matrix notation, Equation (2) can be rewritten as
where Γ = [, …, ], Λ = [,… ,] with = (1, t, …, ) ′, = [, …, ], Xt = [, …, ] with = (, …, k) ′, = ( …, θp], Z = [, …, ] with = (, …, ) ′ and E = (, …, ).
In this paper, we employ the LA-VAR approach to examine which the effects of the model variables, as discussed in Section 3.1 above, on KTB investments by foreign investors. The LA-VAR method is simple but powerful in sense that it avoids the pre-test bias and potential errors involved in deciding whether a variable is stationary or not; especially when different unit root tests yield conflicting results. The LA-VAR approach enables the testing of economic hypotheses that can be expressed as a limit of the coefficient for the VAR model, in a setting where series with or without unit roots can enter the specification together [121]. As a further refinement in our empirical analysis, we employ heteroskedasticity- and autocorrelation-consistent (HAC) estimators of the variance-covariance matrix. This is because if the error term in Equation (1) or in Equation (2) is serially correlated, statistical inference that rests on only the heteroskedasticity-robust standard errors can be misleading [122]. The HAC estimators also correct for possible autocorrelation and avoid this problem.
4. Empirical Results
In this section, we present the empirical results from our investigation of the dynamic relationships that domestic, international, and risk factors have on foreign investors’ investment in the KTBs. The sample period is from October 2000 to December 2018.
4.1. The Data and Their Statistical Properties
4.1.1. Model Selection and Contemporaneous Model Estimates
In order to identify the main factors that affect foreign investors’ KTB holdings prior to VAR estimation, we considered a potential list of variables that might be included in the model. The variables were chosen in line with the earlier findings in the literature and theoretical considerations of investors’ behaviors in international portfolio analysis and selection. Table S1 in the Supplementary files lists the full set of candidate variables considered. Due to degrees of freedom limitations in estimation, we reduced the list of candidate variables by mean of a backward elimination method using Eviews software (version 11). This procedure is also useful as the resulting model includes variables that are robust to the inclusion and exclusion of other variables into the model. The estimated model with the six variables discussed earlier is shown in Table 3. It should be noted that the geopolitical risk variable (KGEO) did not enter the final specification as it is statistically insignificant at conventional levels. Nevertheless, we include it in the model as one of the key objectives of the study is to examine the effects of geopolitical risk on KTB investments by foreigners. It is also possible that geopolitical risks have effects on investments beyond the current month, and therefore, it is important to include in the model with lagged values.
The model estimated in the current period yields expected signs that are in line with discussion in Section 3. The risk variable is of particular interest. It is seen that economic policy uncertainty has a negative effect on KTB holdings by foreigners. Nevertheless, geopolitical risks in the Korean Peninsula are not found to have a significant contemporaneous effect on KTB investments by foreigner investors once other factors are taken into account. This is a new finding with important implications for foreign investors taking positions in the Korean bond markets.
4.1.2. Descriptive Statistics and Unit Root Test
In Table 4, we present the descriptive statistics on the variables included in the model.
In Table 5, we present the Pearson correlation coefficient between each of the domestic, international, and risk variables and the KTB holdings by foreign investors. The results, among others, show that KTBY and KTED have a negative correlation while KCDS, UCUV, KEPU, and KGEO have a positive correlation with KTHB.
Next, we examine the time series properties of the variables using the Augmented Dickey–Fuller (ADF), Phillips–Perron (PP), and Kwiatkowski–Phillips–Schmidt–Shin (KPSS) unit roots tests. The unit roots tests allow us to determine whether the series in question are stationary in levels or in (first) differences. In the ADF and the PP tests, the null hypothesis is that of non-stationarity of the series in question while the maintained hypothesis in the KPSS test is the stationarity of the series in question in levels. In testing for unit roots, whether a constant term and/or a time trend included in the model and the number of lags included are important factors that might be critical to the outcome of the test. To address this issue, we use the Schwarz’s Bayesian information criterion (BIC) to select the best model and the optimal number of lags in the model. Table 6 presents the results of the unit root tests.
The ADF and PP unit root tests results indicate that KTBY, KTED, KCDS, KEPU, and KGEO are stationary in levels at the conventional statistical significance levels. With respect to UCUV, the ADF and PP tests show it is non-stationary in levels but the KPSS test does not reject null hypothesis and is stationary at 1% significance level. The results of ADF, PP, and KPSS unit root tests indicate that KTBH is non-stationary in levels, but its first differences (DKTBH) is stationary.
Investigation of the time series properties of the model’s variables in levels indicate that the variables have different orders of integration. The conventional VAR model is not recommended in this case. In order to check whether the VECM model could be used, we test for the cointegration between two non-stationary variables: KTBH and UCUV. The Johansen test with constant and trend and four lags in the specification indicates that the two variables are not cointegrated. Both the trace and the maximum eigenvalue tests do not reject the null hypothesis, showing no cointegration at the five percent significance level. The p-values for the trace test and the maximum eigenvalue test are 0.1755 and 0.0820, respectively. Hence, in order to not lose information through differencing, we employ the LA-VAR approach as discussed earlier. Furthermore, we treat geopolitical risk as an exogenous factor, to the model, turning the LA-VAR model into LA-VARX.
4.1.3. Optimal Lag Determination
As Equations (1) and (2) in Section 3.2 show each model endogenous variable in a VAR family of models is a regressed on the lagged (t-i) values of all other model variables in the form of a simultaneous equation system [123]. An important question in estimating the VAR family of models is to determine the optimal lag structure, or the number of lags on each variable. The chosen lag order should also allow for sufficient degrees of freedom in estimation. In practice, the optimal lag order is determined by using a statistical cost function, such as, the likelihood ratio (LR), final prediction error (FPE), Akaike information criterion (AIC), Schwarz information criterion (SIC), or Hannan–Quinn (HQ) information criteria. Table 7 presents the results from various model selection criteria for our LA-VARX model.
It is seen that the smallest AIC and FPE values are reached at the third lag order. The SC and HQ criteria indicate the optimal number of lags to be one. Nevertheless, the SC and the HQ criteria are known to choose small model dimensions. In view of possible interactions among the models’ variables at further lags, we chose the optimal lag order to be three, which is in line with the AIC and FPE criteria.
4.2. LA-VARX Model Results
In line with theory, we estimate the LA-VARX model with four lags, that is the three lags as the optimal model dimension chosen by the AIC and FPE criteria plus one more lag since the highest order of integration among the non-stationary variables is one. Figure S2 in the Supplementary Materials shows that all of the estimated roots are within the unit circle. This demonstrates that there are no explosive roots in the LA-VARX system and hence the model is stable. The estimation results from the LA-VARX model is presented in Table 8 (LA-VAR model estimates for the dependent variables, KTBY, KTED, KCDS, UCUV, KEPU, and KGEO, are given in Tables S2–S6. (Please see the Supplementary files.)
All variables except KEPU have some statistical lags entering the equation of KTBH. The signs of the sums of the estimated coefficients are consistent with a priori expectations at statistically significant levels. The model also provides insights on the temporal dynamics of the effects of each variable on KTB holdings by foreign investors.
The KTBY variable might have an ambiguous relationship with KTBH depending on the time framework as discussed earlier. In the short-run the effect might be negative as seen in the contemporaneous regression results. In the LA-VARX model, KTBY has an overall negative effect in the first two periods (months), but then, the effects on KTBH turns out to be positive on the third lag. The sum of the coefficients on the first three lags is positive. In other words, rising KTBY (i.e., falling KTB prices) can have a negative impact on investor sentiment in the short term, but in the long run, it has a positive impact on long-term investors by providing a higher return opportunity for bond investments.
For the KTED variable, we find a net negative effect in the first three lags (months), confirming our theoretical expectations. The same is true for the KCDS variable. This means that investors are negatively sensitive to investments in the short term as the market shrinks arbitrage trading opportunities or increases the risk of sovereign default. Regarding the UCUV variable, first we find a negative and then a large positive effect on KTBH. This is in line with the longer horizon expectations on the UCUV.
Among the risk variables, KEPU is not found to have an impact on KTB holdings by foreign investors. We had found a negative contemporaneous effect from KEPU on KTBH before, but this effect does not persist as the time horizon expands beyond the current month. Hence, it can be said that the domestic economic policy uncertainty only has a short-lived effect on the foreign investors’ KTB holding decisions. The geopolitical risk variable (KGEO) is found to have a negative impact first. Foreign investors might first be selling their KTB holdings as geopolitical tensions in the Korean Peninsula increases. Nevertheless, it is also found that the foreign investors return to the KTB market. The sign on the second lag is positive and thereafter there is no significant effect of geopolitical risk on the KTB holdings of foreign investors. It can be deduced that the geopolitical risk factor has a negative but small effect on the KTB decisions of foreign investors, and it is rather a short-lived effect. The strength of the South Korean economy and her financial markets bring the foreign investors back.
4.3. Impulse Response Analysis
In VAR models, impulse response functions (IRFs) can be used to analyze the response of a variable in the model to a one-standard-deviation shock to another model variable (including itself). In Figure 3a–e below, the impulse responses of KTBH to a one-standard-deviation shock in KTBY KTED, KCDS, UCUV, and KEPU are presented.
Figure 3a (upper left) shows that the impulse response function of foreign investors’ KTB holding to a shock in KTB yield (KTBY) rise is not significant when the confidence intervals for the effects are taken into account. It was discussed earlier that there might be negative reactions first and a positive reaction in the longer run. The IRF indicates that a shock in KTB yields has no significant effect on foreigners KTB holding decisions when taken in the context of a dynamic system with other determinants of KTB investments. In other words, the main purpose of KTB investment by investors with more long-term investment tendencies, such as foreign central banks and pension funds, is seen as part of their overall portfolio investment taking into account South Korea’s stable economic situation rather than seeking short-term returns on investment.
Figure 3b (upper middle) shows that that the impulse response of foreign investors’ KTB holding to the KTB TED CCIRS spread (KTED) reduction decreases significantly through the third period and recovers thereafter in part. In other words, narrowing the negative KTB TED CCIRS spread (arbitrage trading opportunities) negatively affects foreign investors’ KTB holdings, and short-term effects are more prominent than long-term effects. As indicated in Figure 3c (upper right), the impulse response of KTBH to a rise in the Korean sovereign CDS spread displays a sharp decline until the fifth period and thereafter shows a gradual recovery, albeit not statistically significant when the confidence intervals are considered. In other words, a rise in South Korea’s sovereign credit CDS negatively affects foreign investors’ KTB holdings, especially in the short term. This explains that investors with short-term investment propensity, such as global investment banks and global hedge funds, are sensitive to expected returns in arbitrage transactions and the hedge costs of sovereign debt risks when investing in KTBs.
In Figure 3d (lower left), the impulse response of KTBH to short-term and long-term interest rate spreads on U.S. Treasury bonds represents a statistically significant decline in the first period but a statistically significant increase from the 5th period to the 13th period. This means that foreigner investors are more likely to increase their KTB holdings in the long term if the U.S. economy is less likely to suffer a recession.
Figure 3e (lower right) shows that the impulse response of foreign investors’ KTB holding to the Korean economic policy uncertainty is negative but not statistically significant.
5. Conclusions
Using the lag-augmented vector autoregressive model with exogenous variables (LA-VARX), this study analyzes the determinants of foreign investors’ investment in Korea Treasury bonds (KTBs). The LA-VARX model consists of the KTB yields (return of KTB investment), KTB TED CCIRS (benchmark spread of risk-free arbitrage), and Korea’s sovereign CDS (benchmark spread for country risk). These three variables stand as proxies for the domestic factors affecting the KTB investment decisions of foreign investors. The slope of the U.S. Treasury bond short-term and long-term yield curves is taken as a proxy for international factor the portfolio allocation decisions for foreign investors. These domestic and international variables were chosen through literature review and are in line with international finance theory and practice. As a novelty in this paper, we included the Korean economic policy uncertainty index and the geopolitical risk index as risk factors into the model and examined the effects of these risk variables on the KTB market actions of foreign investors.
The main implications of this study are that foreign investors’ investments in KTBs are affected by government bond yields, as well as opportunities for arbitrage transactions, country’s default risk, and global economic conditions. Specifically, we found that foreigners’ decision to invest in government bonds are influenced more heavily by domestic factors than international or risk factors, and among domestic factors, foreign investors responded negatively in the short term to a reduction in arbitrage transaction opportunities and increased sovereign default risks.
With regards to geopolitical risks and economic uncertainties noted in this study, foreign investors’ KTB investments are affected by domestic geopolitical risks, but not by economic policy uncertainties. While foreign investors are generally expected to be more sensitive and responsive to geopolitical risks, this actually appears to have only a limited short-term effect on government bond investments. This study provides some evidence that the KTB market has its own dynamics and is somewhat resistant to economic policy uncertainty or geopolitical risks over the long term.
As discussed in the introduction, the KTB provides a sustainable source of funds by allowing the government to borrow local currency that can be used for social and infrastructure projects from the international market, rather than being subject to foreign exchange risks. In this study, we found that having more foreign investors with long-term investment tendencies is important in a sustainable social context. Because foreign investors with short-term investment tendencies are much more sensitive to short-term expected yields and hedge costs, which can destabilize the market, and this market instability can prevent the government from securing sustainable resources. The Korean government needs to keep the fundamentals of the economy stable and promote the advantages of the Korean bond market more actively to foreign investors who make long-term investments.
The limitations of this study are that data at the investor-level are needed since the actions of investors may vary depending on their investment goals and risk appetite and tolerance, but lack of data prevented an investor-specific analysis. Future research is expected to expand the scope of research to various types of bonds in developed and emerging economies and to provide a comparative analysis of investors’ investment decision factors that considers each financial market situation. In addition, a variety of methodological approaches to this topic are expected to yield more substantial research results and contribute to the literature more broadly. Based on this view, we plan to conduct further research using various methodologies with bond market experts who decide, oversee, and manage bond portfolio investments.
Supplementary Materials
The following are available online at https://www.mdpi.com/2071-1050/11/13/3603/s1, Figure S1: Developments in Korean local Bond holdings by Foreigner Investors’ Overtime, Amount in billions of US$, Figure S2: VAR Inverse Roots in relation to Unit Circle, Table S1: Factors that have been found to affect Investment in Literature Review, Table S2: LA-VARX Estimation Results for KTBY, Table S3: LA-VARX Estimation Results for KTED, Table S4: LA-VARX Estimation Results for KCDS, Table S6: LA-VARX Estimation Results for UCUV, Table S5: LA-VARX Estimation Results for KEPU.
Author Contributions
Conceptualization, J.Y.J.; Data curation, J.Y.J.; Formal analysis, J.Y.J.; Investigation, J.Y.J.; Methodology, J.Y.J.; Supervision, E.A.; Writing – original draft, J.Y.J.; Writing – review & editing, E.A..
Funding
This research received no external funding.
Acknowledgments
This paper is based on a part of the PhD/DBA thesis of Jae Young Jang (first author) written under the supervision of Erdal Atukeren (second author) in partial fulfillment of the requirements in the joint PhD/DBA program between the Seoul Business School, aSSIST, and BSL Business School Lausanne. We would like to thank Hyun-Jung Kim and Jeong-Ha Lee for giving technical advice, and Brian Jang for providing proofreading. We would also like to thank the professors and coordinators at Seoul Business School, aSSIST and BSL Business School Lausanne for their valuable insights and support. We are thankful to two anonymous referees whose comments and suggestions on earlier versions of the paper led to many improvements.
Conflicts of Interest
The authors declare no conflict of interest.
References
- Asian Development Bank. Republic of Korea, Data on Asian Bonds Online. Available online: https://asianbondsonline.adb.org/economy/?economy=KR (accessed on 25 May 2019).
- McKenzie, S. Social Sustainability: Towards some definitions. In Hawke Research Institute Working Paper; Hawke Research Institute, University of South Australia: Magill, Australia, 2004; p. 27. [Google Scholar]
- Adams, W.M. The Future of Sustainability: Re-thinking Environment and Development in the Twenty-first Century. World Conserv. Union Gland Switz. 2006, 1–18. [Google Scholar]
- Fiksel, J. A framework for Sustainable Materials Management. J. Miner. Met. Mater. Soc. 2006, 58, 15–22. [Google Scholar] [CrossRef]
- National Assembly Budget Office. Public Finance of Korea 2019. Available online: http://korea.nabo.go.kr/ (accessed on 3 June 2019).
- Tana, H.B.; Cheahb, E.T.; Johnsonb, J.; Sungb, M.C.; Chuahc, C.H. Stock market capitalization and financial integration in the Asia Pacific region. Appl. Econ. 2012, 44, 1951–1961. [Google Scholar] [CrossRef]
- Huston, J.; Spencer, R. The Wealth Effects of Quantitative Easing. Atl. Econ. J. 2016, 44, 471–486. [Google Scholar] [CrossRef]
- Akgiray, V.; Baronyan, S.; Sener, E.; Yılmaz, O. Predictability of Emerging Market Local Currency Bond Risk Premia. Emerg. Mark. Financ. Trade 2016, 52, 1627–1646. [Google Scholar] [CrossRef]
- Kim, D.S.; Jung, Y.J. The Effect of the Global Financial and Eurozone Debt Crises on European and Emerging Market Countries’ Sovereign Bond Markets and Foreign Investment in the Korean Government Bonds. Korean Acad. Int. Bus. 2015, 26, 1–27. [Google Scholar]
- Asian Development Bank. Asian Bond Monitor, November 2018. Available online: https://www.adb.org/sites/default/files/publication/467066/abm-nov-2018.pdf (accessed on 15 April 2019).
- Asian Development Bank. Asian Bond Monitor, March 2019. Available online: https://www.adb.org/sites/default/files/publication/491531/abm-mar-2019.pdf (accessed on 17 June 2019).
- The World Bank. Doing Business 2019, Measuring Business Regulations. Available online: http://www.doingbusiness.org/en/data/exploreeconomies/korea (accessed on 17 May 2019).
- Ministry of Economy and Finance. 2018 Korea Treasury Bonds. February 2019. Available online: http://ktb.moef.go.kr/eng/main.do (accessed on 15 March 2019).
- Bank of Japan, Financial Markets Department. Liquidity Indicators in the JGB Markets 2019. Available online: https://www.boj.or.jp/en/paym/bond/ryudo.pdf (accessed on 18 June 2019).
- S&P Global, Credit Trends: Demystifying China’s Domestic Debt Market. 2019. Available online: https://www.spglobal.com/en/research-insights/articles/credit-trends-demystifying-china-s-domestic-debt-market (accessed on 18 June 2019).
- Bank of Canada. Government of Canada Treasury Bills and Bonds Outstanding. 2018. Available online: https://www.bankofcanada.ca/markets/government-securities-auctions/goc-t-bills-and-bonds-outstanding/ (accessed on 18 June 2019).
- Tesouro Nacional. Monthly Report Federal Public Debt, December 2018. Available online: https://www.tesouro.fazenda.gov.br/documents/10180/710823/Texto_RMD_Dez_18_Ingl%EF%BF%BDs.pdf/a6b2f659-f539-43a4-ae2d-03bf2c1d2776 (accessed on 19 June 2019).
- International Monetary Fund. World Economic Outlook Update, April 2019: Growth Slowdown, Precarious Recovery. Available online: https://www.imf.org/en/Publications/WEO/Issues/2019/03/28/world-economic-outlook-april-2019 (accessed on 29 April 2019).
- Asian Development Bank. Asian development Outlook Supplement, December 2018. Available online: https://www.adb.org/sites/default/files/publication/470891/ado-supplement-december-2018.pdf (accessed on 12 March 2019).
- Bank of Korea. Economic Outlook for 2019. April 2019. Available online: https://www.bok.or.kr/eng/bbs/E0000634/view.do?nttId=10051251&menuNo=400069 (accessed on 10 May 2019).
- Hansson, M.; Liljeblom, E.; Loflund, A. International Bond Diversification Strategies: The Impact of Currency, Country, and Credit Risk. Eur. J. Financ. 2009, 15, 555–583. [Google Scholar] [CrossRef]
- Solnik, B.; McLeavey, D. Global Investments, 6th ed.; Pearson Prentice: Upper Saddle River, NJ, USA, 2008. [Google Scholar]
- Du, W.; Tepper, A.; Verdelhan, A. Deviations from Covered Interest Rate Parity. J. Financ. 2017, 93, 915–957. Available online: https://onlinelibrary.wiley.com/doi/full/10.1111/jofi.12620 (accessed on 18 June 2019).
- Bunda, I.; Hamann, A.J.; Lall, S. Correlations in Emerging Market Bonds: The Role of Local and Global Factors. Emerg. Mark. Rev. 2009, 10, 67–96. [Google Scholar] [CrossRef]
- Palladini, G.; Portes, R. Sovereign CDS and Bond Pricing Dynamics in the EURO-area. Nber Work. Pap. 2011, 17586, 1–35. [Google Scholar]
- Fratzscher, M. Capital Flows, Push versus Pull Factors and the Global Financial Crisis’. J. Int. Econ. 2012, 88, 341–356. [Google Scholar] [CrossRef]
- Mehl, A.; Cappiello, L. Uncovered Interest Parity at Long Horizons: Evidence on Emerging Economies. Rev. Int. Econ. 2009, 17, 1019–1037. [Google Scholar] [CrossRef]
- Won, S.Y.; Jo, S.Y. A Study on the Determinants of Foreigners’ Domestic Bond Investment and Their Impacts on the Korean Bond Market. Kyung Je Hak Yon Gu 2008, 47, 31–65. [Google Scholar]
- Kim, J.H.; Lee, D.K. Determinants of Foreigners’ Korean Bond Investment. Korea Inst. Financ. 2010, 3, 1–66. [Google Scholar]
- Yoon, K.; Kim, J. The Effect of Global Liquidity on Capital Inflows to Emerging Economies and the Policy Implication. Int. Econ. J. 2014, 20, 83–109. [Google Scholar]
- Park, J.Y.; Kim, D.S.; Eum, S.S. Changes in Determinants of Foreign Investment in Korean Government. Korean Corp. Manag. Rev. 2015, 22, 45–69. [Google Scholar] [CrossRef]
- Kim, S.Y.; Min, K.H.; Lee, Y.S. Financial Globalization and Financial Effective Exchange Rate in Korea. J. Econ. Theory Econom. 2017, 28, 84–111. [Google Scholar]
- Park, I.K.; Shin, D.H. Estimating Foreign Stock Investment Function, Using Stock Price and Exchange Rate Volatilities in Korea. J. Soc. Sci. 2001, 27, 123–141. [Google Scholar]
- Burger, J.; Warnock, F. Foreign participation in local currency bond markets. Rev. Financ. Econ. 2007, 16, 291–304. [Google Scholar] [CrossRef] [Green Version]
- Kim, D.Y. Effects of Foreign Exchange Risk on International Portfolio Investment in Northeast Asian Countries and Korea. J. Northeast Asian Econ. Stud. 2012, 24, 1–31. [Google Scholar]
- Amato, J.D.; Gyntelberg, J. CDS index Tranches and the Pricing of Credit Risk Correlations. BIS Q. Rev. 2005, 73–87. [Google Scholar]
- Angelini, E. Credit Default Swaps (CDS) and their Role in the Credit Risk Market. Int. J. Acad. Res. Bus. Soc. Sci. 2012, 2, 584–593. [Google Scholar]
- Duffie, D. Defaultable Term Structure Models with Fractional Recovery of Par; Working Paper; Graduate School of Business, Stanford University: Stanford, CA, USA, 1998; pp. 1–25. [Google Scholar]
- Hull, J.; White, A. Valuation of a CDO and an nth to Default CDS without Monte Carlo Simulation. J. Deriv. 2004, 12, 1–40. [Google Scholar] [CrossRef]
- Houweling, P.; Vorst, T. Pricing Default Swaps: Empirical Evidence. J. Int. Money Financ. 2005, 24, 1220–1225. [Google Scholar] [CrossRef]
- Collin-Dufresne, P.; Goldstein, R.S. Do Credit Spreads Reflect Stationary Leverage Ratios? J. Financ. 2001, LVI, 1929–1957. [Google Scholar] [CrossRef]
- Baele, L.; Bekaert, G.; Inghelbrecht, K. The Determinants of Stock and Bond Return Co-movements. Natl. Bur. Econ. Res. 2010, 15260. [Google Scholar] [CrossRef]
- Connolly, R.; Stivers, C.; Sun, L. Stock Market Uncertainty and the Stock-Bond. J. Financ. Quant. Anal. 2005, 40, 161–194. [Google Scholar] [CrossRef]
- Bekaert, G.R.; Hodrick, J.; Zhang, X. International Stock Return Co-movements. J. Financ. 2009, 64, 2591–2626. [Google Scholar] [CrossRef]
- Campbell, J.; Sunderam, A.; Viceira, L. Inflation Betas or Deflation Hedges? The Changing Risks of Nominal Bonds; Working Paper; Harvard University: Cambridge, MA, USA, 2013. [Google Scholar]
- Christiano, L.; Eichenbaum, M. Liquidity Effect and Monetary Transmission Mechanism. Am. Econ. Rev. 1992, 82, 346–353. [Google Scholar]
- Leeper, E.M.; Gordon, D.B. In Search of the Liquidity effect. J. Monet. Econ. 1992, 29, 341–369. [Google Scholar] [CrossRef]
- Bernanke, B.; Blinder, A.S. The Federal Funds Rate and the Channels of Monetary Transmission. Am. Econ. Rev. 1992, 82, 901–921. [Google Scholar]
- Christiano, L.; Eichenbaum, M.; Evans, C. Nominal Rigidities and the Dynamic Effects of a Shock to Monetary Policy. J. Political Econ. 2005, 113, 1–45. [Google Scholar] [CrossRef] [Green Version]
- Park, J.H.; Kim, C.K. The Effect of Policy Rate Adjustments in US and the Korean Bond. Int. J. Contents 2013, 13, 344–354. [Google Scholar]
- Lee, H.C. The Effect of US base Interest Rate Adjustment on the Korean Stock Market. J. Int. Trade Ind. Stud. 2012, 17, 101–128. [Google Scholar]
- Hooker, M.A. What Happened to the Oil Price Macroeconomy Relationship? J. Monet. Econ. 1996, 38, 195–213. [Google Scholar] [CrossRef]
- Shigeki, O. Oil Price Shocks and Stock Markets in BRICs. Eur. J. Comp. Econ. 2011, 8, 29–45. [Google Scholar]
- Çevik, E.; Atukeren, E.; Korkmaz, T. Oil Prices and Global Stock Markets: A Time-Varying Causality-In-Mean and Causality-in-Variance Analysis. Energies 2018, 11, 2848. [Google Scholar] [CrossRef]
- Coffey, N.; Hrung, W.; Sarkar, A. Capital Constraints, Counterparty Risk, and Deviations from Covered Interest Rate Parity. Fed. Reserve Bank N. Y. 2009, 393, 1–44. [Google Scholar] [CrossRef]
- Kawaller, I.G. The TED Spread. Deriv. Q. 1997, 3, 46–59. [Google Scholar]
- Takezawa, N. Currency swaps and long-term covered interest parity. Econ. Lett. 1995, 49, 181–185. [Google Scholar] [CrossRef]
- Baba, N.; Packer, F.; Nagano, T. The Spillover of Money Market Turbulence to FX Swap and Cross-Currency Swap Markets. Bis Q. Rev. 2008, March, 73–86. [Google Scholar]
- Mirron, P.; Swannell, P. Pricing and Hedging Swaps; Euromoney Inst Investors PLC: London, UK, 2011. [Google Scholar]
- Baek, I.M.; Bandopadhyaya, A.; Du, C. Determinants of market-assessed sovereign risk: Economic fundamentals or market risk appetite? J. Int. Money Financ. 2005, 24, 533–548. [Google Scholar] [CrossRef]
- Mcquire, P.; Schrijvers, M. Common Factors in Emerging Market Spreads. Bis Q. Rev. 2003, 65–78. [Google Scholar]
- Weigel, D.; Gemmill, G. What drives credit risk in emerging markets? The roles of country fundamentals and market co-movements. J. Int. Money Financ. 2006, 25, 476–502. [Google Scholar] [CrossRef]
- Kim, J.S. Predicting Real Growth of Korea With the Yield Spread of Korea and the U.S.A. Int. Area Stud. Rev. 2012, 16, 69–86. [Google Scholar]
- Estrella, A.; Mishkin, F.S. The Yield Curve as a Predictor of U.S. Recessions. Curr. Issues Econ. Financ. 1996, 2, 1–6. [Google Scholar] [CrossRef]
- Mehl, A. The Yield Curve as a Predictor and Emerging Economies. Open Econ. Rev. 2009, 20, 683–716. [Google Scholar] [CrossRef]
- Lee, W.S.; Lee, H.S. Measuring Volatility Spillover Effects in Korean Financial Markets: Focus on the Korean CDS Premium. J. Mark. Econ. 2015, 44, 101–142. [Google Scholar]
- Antonakakis, N.; Badinger, H. Economic Growth, Volatility, and Cross-country Spillovers: New Evidence for the G7 Countries. Econ. Model. 2016, 52, 352–365. [Google Scholar] [CrossRef]
- Ross, S.A. The arbitrage theory of capital asset pricing. J. Econ. 1976, 13, 341–360. [Google Scholar] [CrossRef]
- Bjornland, H.; Leitemo, C.K. Identifying the Interdependence between US Monetary Policy and the Stock Market. J. Monet. Econ. 2009, 56, 275–282. [Google Scholar] [CrossRef]
- Mahmood, W.M.; Dinniah, N.M. Stock Returns and Macroeconomics Variables: Evidence from the Six Asian-Pacific Countries. Int. Res. J. Financ. Econ. 2009, 30, 1–11. [Google Scholar]
- Ang, A.; Piazzesi, M. A no-arbitrage vector autoregression of term structure dynamics with macroeconomic and latent variables. J. Monet. Econ. 2003, 50, 745–787. [Google Scholar] [CrossRef]
- Diebolda, F.X.; Rudebuschb, G.D.; Aruobac, S. The macroeconomy and the yield curve: A dynamic latent factor approach. J. Econom. 2006, 131, 309–338. [Google Scholar] [CrossRef]
- Kim, J.H.; Lee, M.H. Determinants of Interest-Rate Policies by the Monetary Policy Committee and the FOMC. J. Ind. Econ. Bus. 2014, 27, 35–54. [Google Scholar]
- Cantor, R.; Packer, F. Determinants and impacts of sovereign credit rating. Fed. Reserve Bank N. Y. Econ. Policy Rev. 1996, 2, 37–54. [Google Scholar]
- Kim, S.J.; Wu, E. International bank flows to emerging markets: Influence of sovereign credit ratings and their regional spillover effects. J. Financ. Res. 2011, 34, 331–364. [Google Scholar] [CrossRef]
- Brooks, R.; Faff, R.; Hillier, D.; Hillier, J. The national market impact of sovereign rating changes. J. Bank. Financ. 2004, 28, 233–250. [Google Scholar] [CrossRef]
- Reisen, H.; Maltzan, J. Boom and Bust and Sovereign Ratings. Int. Financ. 1999, 2, 273–293, Working Paper No. 148. [Google Scholar] [CrossRef]
- Baldacci, E.; Kumar, M.S. Fiscal Deficits, Debt, and Interest Rates; IMF Working Paper 10/184; International Monetary Fund: Washington, DC, USA, 2010. [Google Scholar]
- Cochrane, J. Understanding Policy in the Great Recession: Some Unpleasant Fiscal Arithmetic; Working Paper; University of Chicago Press: Chicago, IL, USA, 2010. [Google Scholar]
- Aghion, P.; Kharroubi, E. Cyclical Macro Policy and Industry Growth: The Effect of Countercyclical Fiscal Policy; Working Paper; Harvard University: Cambridge, MA, USA, 2007. [Google Scholar]
- Woo, J. Why Do More Polarized Countries Run More Procyclical Fiscal Policy? Rev. Econ. Stat. 2009, 91, 850–870. [Google Scholar] [CrossRef]
- Burnside, C.; Dollar, D. Aid, Policies, and Growth. Am. Econ. Rev. 2000, 90, 847–868. [Google Scholar] [CrossRef]
- Cordella, T.; Ricci, L.A.; Ruiz-Arranz, M. Debt Overhang or Debt Irrelevance? Revisiting the Debt Growth Link; IMF Working Papers 05/223; International Monetary Fund: Washington, DC, USA, 2005. [Google Scholar]
- Caner, M.; Grennes, T.; Koehler-Geib, F. Finding the Tipping Point-When Sovereign Debt Turns Bad. World Bank Policy Res. 2010, 5391, 64–75. [Google Scholar]
- Park, Y.Y.; Lee, S.H. An Empirical Study on the Effect of Economic Variables on the Amount of Foreign Exchange Holding. Jun Moon Kyong Young Yon Gu (J. Prof. Manag.) 2002, 5, 89–102. [Google Scholar]
- Mendoza, R.U. Was the Asian Crisis a Wake-up Call? Foreign Reserves as Self-Protection. J. Asian Econ. 2010, 21, 1–19. [Google Scholar] [CrossRef]
- Aizenman, J.; Marion, N. The High Demand for International Reserves in the Far East: What is going on? J. Jpn. Int. Econ. 2003, 17, 370–400. [Google Scholar] [CrossRef]
- Nordhaus, W.D. The political economic cycle. Rev. Econ. Stud. 1975, 42, 169–190. [Google Scholar] [CrossRef]
- Huang, R.D. Common stock returns and presidential elections. Financ. Anal. J. 1985, 41, 58–62. [Google Scholar] [CrossRef]
- Le, Q.V.; Zak, P.J. Political risk and capital flight. J. Int. Money Financ. 2006, 25, 308–329. [Google Scholar] [CrossRef]
- Bilson, C.M.; Brailsford, T.J.; Hooperb, V.C. The explanatory power of political risk in emerging markets. Int. Rev. Financ. Anal. 2002, 11, 1–27. [Google Scholar] [CrossRef] [Green Version]
- Ahn, H.J.; Jeon, S.P.; Chay, J. The Effect of News related to the North-South Relationship on the Stock Markets. J. Korean Econ. Anal. 2010, 16, 199–231. [Google Scholar]
- Kim, C.W. Inter-Korean Relations and “Korea Discount” an Analysis of Foreign Investors’ Stock Trading. J. Peace Unification Stud. 2011, 3, 219–252. [Google Scholar]
- Lee, S.H.; So, I.H.; Ha, J.R. Identify Uncertainty Shocks due to Geopolitical Swings in Korea; BOK Working Paper; Bank of Korea: Seoul, Korea, 2018. [Google Scholar]
- Park, K.S. Policy Uncertainty and Investors’ Demand for US Treasuries: Who Most Concerned? Int. Bus. J. 2016, 17, 87–110. [Google Scholar] [CrossRef]
- Pastor, L.; Veronesi, P. Uncertainty about Government Policy and Stock Prices. J. Financ. 2012, 64, 1219–1264. [Google Scholar] [CrossRef]
- Pastor, L.; Veronesi, P. Political Uncertainty and Risk Premia. J. Financ. Econ. 2013, 110, 520–545. [Google Scholar] [CrossRef]
- Bloom, N. Fluctuations in Uncertainty. J. Econ. Perspect. 2014, 28, 153–176. [Google Scholar] [CrossRef] [Green Version]
- Basu, S.L.; Bundick, B. Uncertainty Shocks in a Model of Effective Demand. Natl. Bur. Econ. Res. 2017, 85, 937–958, Working Paper 18420. [Google Scholar] [CrossRef]
- Barth, J.R.; Levine, R.G. Bank Regulation and Supervision: What Works best? J. Financ. Intermediation 2004, 13, 205–248. [Google Scholar] [CrossRef]
- Jomini, P. Effects of Inappropriate Financial Regulation; European Centre for International Political Economy: Brussels, Belgium, 2011; pp. 1–17. [Google Scholar]
- Cheung, J.K.; Heaney, J. A Contingent-Claim Integration of Cost-Volume-Profit Analysis with Capital Budgeting. Contemp. Account. Res. 1990, 6, 738–760. [Google Scholar] [CrossRef]
- Jeong, H.J.; Zheng, Y.C. On the Issuance Efficiency and Liquidity Premiums of Chinese Government Bond Market: Compared to Korean Government Bond Market. Korean J. Financ. Manag. 2017, 34, 135–158. [Google Scholar] [CrossRef]
- Sarr, A.; Lybek, T. Measuring Liquidity in Financial Markets; IMF Working Paper No 02/232; International Monetary Fund: Washington, DC, USA, 2002. [Google Scholar]
- Bloomfield, R.; O’Hara, M. Market Transparency: Who Win? Who Loses? Rev. Financ. Stud. 1999, 12, 5–35. [Google Scholar] [CrossRef]
- La Porta, R.; Lopez-De-Silanes, F.; Shleifer, A.; Vishny, R.W. Law and Finance. J. Political Econ. 1998, 106, 1113–1155. [Google Scholar] [CrossRef]
- Bae, K.H.; Warren, B.; Yun, Y.S. Determinants of Bond Holdings by Foreign Investments. In Proceedings of the BIS/KU conference on Asian Bond Market, Seoul, Korea, 21–23 March 2004. [Google Scholar]
- Baker, S.R.; Bloom, N.; Davis, S.J. Measuring Economic Policy Uncertainty, National Bureau of Economic Research. Q. J. Econ. 2016, 131, 1593–1636. [Google Scholar] [CrossRef]
- Andre, C.; Bonga-Bonga, L.; Gupta, R.; Muteba, M.; John, W. Economic policy uncertainty, U.S. Real Housing Returns and Their Volatility: A Nonparametric Approach. J. Real Estate Res. 2017, 39, 493–513. [Google Scholar]
- Li, X.M.; Peng, L. US Economic Policy Uncertainty and Co-movements between Chinese and US Stock Markets. Econ. Model. 2017, 61, 27–39. [Google Scholar] [CrossRef]
- Jeon, J. The Impact of Asian Economic Policy Uncertainty: Evidence from Korean Housing Market. J. Asian Financ. Econ. Bus. 2018, 5, 43–51. [Google Scholar] [CrossRef]
- Caldara, D.; Iacoviello, M. Measuring Geopolitical Risk. Board Gov. Fed. Reserve Board 2017, 1222, 1–38, Working paper. [Google Scholar] [CrossRef]
- Financial Supervisory Service. Financial Statistics. Available online: http://english.fss.or.kr/fss/eng/main.jsp (accessed on 15 April 2019).
- Ministry of Economy and Finance. Public Information. Available online: http://english.moef.go.kr/ (accessed on 15 April 2019).
- The Bank of Korea. Economic Statistics System. Available online: http://ecos.bok.or.kr/ (accessed on 15 April 2019).
- Federal Reserve Bank of St. Louis. Economic Data. Available online: https://fred.stlouisfed.org/ (accessed on 15 April 2019).
- Economic Policy Uncertainty. South Korea Monthly Index. Available online: http://www.policyuncertainty.com/korea_monthly.html (accessed on 30 April 2019).
- Sims, C.A. Macroeconomic and Reality. Econometrica 1980, 48, 1–48. [Google Scholar] [CrossRef]
- Brooks, C. Introductory Econometrics for Finance, 2nd ed.; Cambridge University Press: Cambridge, UK, 2008. [Google Scholar]
- Hiemstra, C.; Jones, J.D. Testing for Linear and Nonlinear Granger Causality in the Stock Price-Volume Relation. J. Financ. 1994, 5, 1639–1664. [Google Scholar]
- Toda, H.; Yamamoto, T. Statistical inference in vector autoregressions with possible integrated processes. J. Econom. 1995, 66, 225–250. [Google Scholar] [CrossRef]
- Liu, X.; Shu, C. Consumption and Stock Markets in Asian Economies. Int. Rev. Appl. Econ. 2004, 18, 483–496. [Google Scholar] [CrossRef]
- Den Haan, W.J.; Levin, A.T. A Practitioner’s Guild to Robust Covariance Matrix Estimation. Natl. Bur. Econ. Res. 1996, 15, 291–341. [Google Scholar]
Figure 1.
South Korean local bond issuance trends by types of issuers (in billion USD). Note: 1. Some state-owned agencies form part of the government bond market. 2. Corporate bonds include equity-linked securities and derivatives-linked securities. 3. End-of-period exchange rates are from Bloomberg. Source: Asian Development Bank (ADB) [1].

Figure 2.
South Korean Economic Policy Uncertainty Index, January 1990 to January 2019. Source: “Measuring Economic Policy Uncertainty” by Backer et al.
Figure 2.
South Korean Economic Policy Uncertainty Index, January 1990 to January 2019. Source: “Measuring Economic Policy Uncertainty” by Backer et al.

Figure 3.
(a-e). Impulse response of KTBH to one standard deviation shocks in KTBY, KTED, KCDS, UCUV, and KEPU.
Figure 3.
(a-e). Impulse response of KTBH to one standard deviation shocks in KTBY, KTED, KCDS, UCUV, and KEPU.


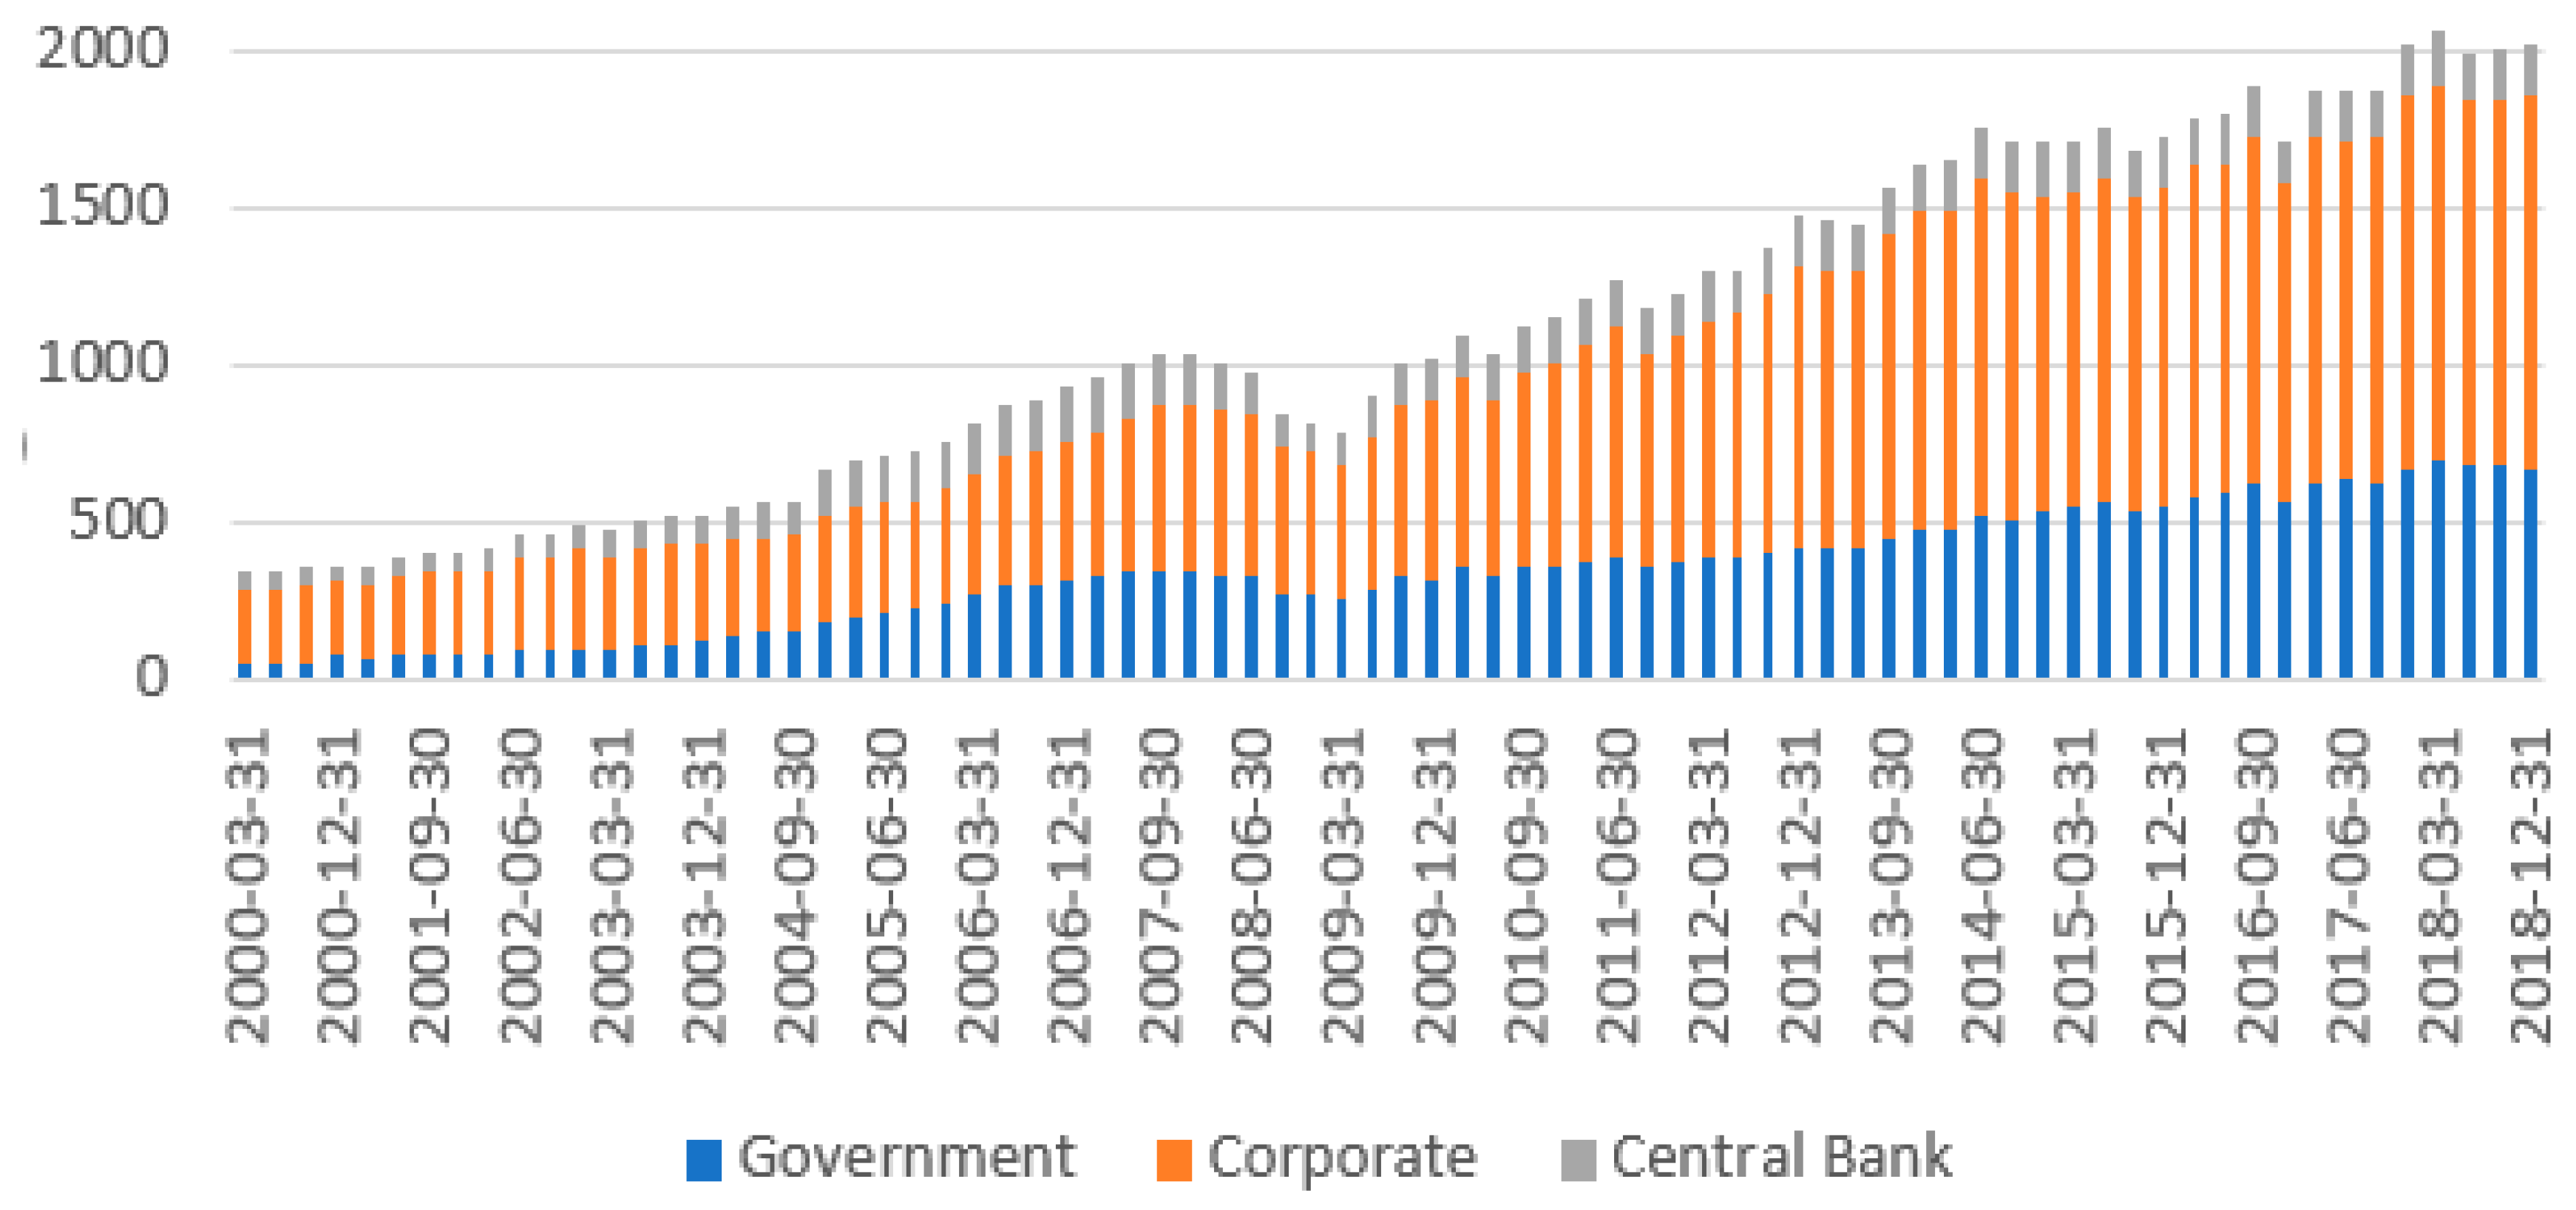
Table 1.
Main features of local bond markets by major county as of the end of 2018.
| South Korea | Japan | China | Canada | Brazil | |
|---|---|---|---|---|---|
| Local Bonds Outstanding (US$ in billion) | 2014 | 10,668 | 9453 | 2244 | 1903 |
| Sovereign Credit Rating by Moody’s | Aa2 | A1 | A1 | Aaa | Ba3 |
| Bid–Ask Spread (bps) | 0.5 | 1.0 | 1.9 | 3.2 | N/A |
| Average Time to Maturity (year) | 10.03 | 8.03 | 4.50 | 6.32 | 4.11 |
Table 2.
List of variables in the empirical model.
| Variable | Classification | Short Name |
|---|---|---|
| KTB Holdings by Foreign Investors (Billion in US$) | KTBH | |
| KTB Yield (Percent) | Domestic | KTBY |
| KTB TED CCIRS (Percent) | KTED | |
| ROK Credit Default Swap (Percent) | KCDS | |
| U.S. Treasury Yield Curve Scope (Percent) | International | UCUV |
| Korean Economic Policy Uncertainty Index (100 in 1990–2014) | Risk | KEPU |
| Korean Geopolitical Risk Index (100 in 2000–2009) | KGEO |
Table 3.
Contemporaneous model estimates.
| Variable | Coefficient | Std. Error | T-Statistics |
|---|---|---|---|
| C | 140.398 | 9.714 | 14.45 *** |
| KTBY | −24.731 | 1.624 | −15.23 *** |
| KTED | −25.665 | 6.617 | −3.879 *** |
| KCDS | −0.139 | 0.042 | −3.272 *** |
| UCUV | 17.887 | 6.527 | 2.740 *** |
| KEPU | −0.078 | 0.029 | −2.701 *** |
| KGEO | −0.034 | 0.032 | −1.050 |
| Ad. R-Squared | 0.813 | S.D. | 38.078 |
| F-Statistic | 51.064 | AIC | 1726.66 |
| SC | 1749.853 | HQ | 1736.043 |
Note: ***, ** and * indicate statistical significance at the 1%, 5% and 10% levels, respectively.
Table 4.
Descriptive statistics.
| Variable | KTBH | KTBY | KTED | KCDS | UCUV | KEPU | KGEO |
|---|---|---|---|---|---|---|---|
| Mean | 50.877 | 4.119 | −0.950 | 77.918 | 0.725 | 132.397 | 113.116 |
| Median | 61.193 | 4.420 | −0.755 | 60.995 | 0.741 | 122.007 | 100.474 |
| Maximum | 103.068 | 7.300 | 0.120 | 432.475 | 1.440 | 391.798 | 274.741 |
| Minimum | 0.222 | 1.401 | −3.865 | 14.300 | −0.048 | 37.307 | 38.704 |
| Std. Dev. | 38.079 | 1.387 | 0.661 | 63.165 | 0.409 | 60.769 | 46.341 |
| Skewness | −0.209 | −0.144 | −1.342 | 3.016 | −0.245 | 1.588 | 1.396 |
| Kurtosis | 1.351 | 1.995 | 1.995 | 14.177 | 1.827 | 5.213 | 5.213 |
| Jarque-Bera | 24.481 | 9.249 | 9.249 | 1364.524 | 13.664 | 197.708 | 107.404 |
Table 5.
Correlation coefficients on the variables included in the VAR model.
| Correlation | KTBH | KTBY | KTED | KCDS | UCUV | KEPU | KGEO |
|---|---|---|---|---|---|---|---|
| KTBH | 1.000 | −0.812 | −0.218 | 0.030 | 0.135 | 0.206 | 0.206 |
| KTBY | −0.812 | 1.000 | −0.117 | 0.163 | 0.161 | −0.250 | −0.298 |
| KTED | −0.218 | −0.117 | 1.000 | −0.797 | −0.531 | −0.323 | −0.010 |
| KCDS | 0.030 | 0.163 | −0.797 | 1.000 | 0.497 | 0.331 | 0.030 |
| UCUV | 0.135 | 0.161 | −0.531 | 0.497 | 1.000 | 0.251 | 0.072 |
| KEPU | 0.206 | −0.250 | −0.323 | 0.331 | 0.251 | 1.000 | 0.258 |
| KGEO | 0.206 | −0.298 | −0.010 | 0.030 | 0.072 | 0.258 | 1.000 |
Table 6.
Unit root test results.
| Variable | KTBH | DKTBH | KTBY | KTED | KCDS | UCUV | KEPU | KGEO | |
|---|---|---|---|---|---|---|---|---|---|
| ADF | T-Statistic | −2.099 | −11.493 *** | −3.501 ** | −2.867 * | −3.901 *** | −2.013 | −6.169 *** | −7.602 *** |
| Equation | I+T | I | I+T | I | I | I | I | I | |
| Lag | 1 | 0 | 1 | 1 | 4 | 0 | 0 | 0 | |
| PP | T-Statistic | −2.240 | −11.734 *** | −3.303 * | −3.250 ** | −3.144 ** | −1.938 | −6.282 *** | −7.996 *** |
| Equation | C+T | C | C+T | C | C | C | C+T | C | |
| Lag | 7 | 5 | 5 | 1 | 8 | 2 | 4 | 8 | |
| KPSS | LM-Statistic | 0.203 * | 0.089 *** | 0.146 * | 0.370 ** | 0.187 *** | 0.209 *** | −0.068 *** | 0.503 * |
| Equation | C+T | C | C+T | C | C | C | C+T | C | |
| Bandwidth | 11 | 7 | 11 | 11 | 10 | 11 | 9 | 9 |
Note: C stands for the for intercept and C+T for trend & intercept in the test equation. ***, ** and * indicate statistical significance at the 1%, 5% and 10% levels, respectively.
Table 7.
Optimal lag length selection criteria.
| Lag | LogL | LR | FPE | AIC | SC | HQ |
|---|---|---|---|---|---|---|
| 0 | −4359.9 | NA | 1.70 × 10¹¹ | 45.727 | 45.846 | 45.775 |
| 1 | −2994.9 | 2615.7 | 176642.6 | 31.947 | 32.800 * | 32.333 * |
| 2 | −2945.7 | 90.627 | 176658.5 | 31.945 | 33.733 | 32.669 |
| 3 | −2877.2 | 121.279 | 144691.3 * | 31.740 * | 34.363 | 32.802 |
| 4 | −2834.4 | 72.602 * | 155851.9 | 31.805 | 35.262 | 33.205 |
| 5 | −2794.3 | 65.030 | 173783.9 | 31.899 | 36.190 | 33.637 |
| 6 | −2759.4 | 54.194 | 205968.2 | 32.046 | 37.171 | 34.122 |
| 7 | −2683.9 | 57.342 | 236639.0 | 32.152 | 38.112 | 34.566 |
| 8 | −2533.8 | 51.335 | 281547.6 | 32.282 | 39.076 | 35.033 |
| 9 | −2643.2 | 54.182 | 325085.3 | 32.369 | 39.997 | 35.458 |
| 10 | −2617.1 | 32.795 | 444624.8 | 32.608 | 41.071 | 36.036 |
| 11 | −2579.2 | 44.793 | 547917.1 | 32.725 | 420.22 | 36.491 |
| 12 | −2533.8 | 50.442 | 637603.8 | 32.762 | 42.894 | 36.866 |
Note: (*) indicates the optimal number of lag selected by the respective criteria. The criteria short-names are defined in the text above.
Table 8.
LA-VARX estimation results for KTBH.
| Variable | Lag | Coefficient | Standard Error | T-Ratio |
|---|---|---|---|---|
| C | N/A | −7.459 | 2.445 | −3.050 *** |
| KTBH | 1 | 1.088 | 0.072 | 14.940 *** |
| 2 | −0.218 | 0.102 | −2.122 ** | |
| 3 | 0.099 | 0.131 | 0.757 | |
| 4 | −0.095 | 0.083 | −1.145 | |
| KTBY | 1 | −0.148 | 0.739 | −0.200 |
| 2 | −1.753 | 1.024 | −1.712 * | |
| 3 | 3.370 | 0.889 | 3.789 *** | |
| 4 | −1.016 | 0.687 | 1.478 | |
| KTED | 1 | −2.820 | 0.976 | −2.889 *** |
| 2 | 0.824 | 0.772 | 1.067 | |
| 3 | 1.217 | 0.729 | 1.670 * | |
| 4 | −0.906 | 0.663 | −1.366 | |
| KCDS | 1 | −0.023 | 0.007 | −3.171 *** |
| 2 | 0.005 | 0.011 | 0.486 | |
| 3 | −0.003 | 0.009 | −0.394 | |
| 4 | −0.000 | 0.007 | −0.087 | |
| UCUV | 1 | −4.189 | 1.961 | −2.136 ** |
| 2 | 7.235 | 2.663 | 2.717 *** | |
| 3 | 1.192 | 1.842 | 0.647 | |
| 4 | −1.127 | 1.512 | −0.845 | |
| KEPU | 1 | −0.004 | 0.003 | −1.245 |
| 2 | 0.004 | 0.005 | 0.772 | |
| 3 | 0.006 | 0.003 | 1.609 | |
| 4 | −0.006 | 0.004 | −1.523 | |
| KGEO | 1 | −0.012 | 0.004 | −2.615 *** |
| 2 | 0.009 | 0.004 | 2.046 ** | |
| 3 | 0.002 | 0.004 | 0.563 | |
| 4 | 0.001 | 0.004 | 0.290 | |
| Ad. R squared | 0.996 | p-value (F) | 8.5 × 10−240 |
Note: ***, ** and * indicate statistical significance at the 1%, 5% and 10% levels, respectively.
© 2019 by the authors. Licensee MDPI, Basel, Switzerland. This article is an open access article distributed under the terms and conditions of the Creative Commons Attribution (CC BY) license (http://creativecommons.org/licenses/by/4.0/).
Share and Cite
MDPI and ACS Style
Jang, J.Y.; Atukeren, E. Sustainable Local Currency Debt: An Analysis of Foreigners’ Korea Treasury Bonds Investments Using a LA-VARX Model. Sustainability 2019, 11, 3603. https://doi.org/10.3390/su11133603
AMA Style
Jang JY, Atukeren E. Sustainable Local Currency Debt: An Analysis of Foreigners’ Korea Treasury Bonds Investments Using a LA-VARX Model. Sustainability. 2019; 11(13):3603. https://doi.org/10.3390/su11133603
Chicago/Turabian StyleJang, Jae Young, and Erdal Atukeren. 2019. "Sustainable Local Currency Debt: An Analysis of Foreigners’ Korea Treasury Bonds Investments Using a LA-VARX Model" Sustainability 11, no. 13: 3603. https://doi.org/10.3390/su11133603
Note that from the first issue of 2016, this journal uses article numbers instead of page numbers. See further details here.