Article

Sustainable Assets and Strategies Affecting the Forestry Household Income: Empirical Evidence from South Korea

1
Forest Management Support Division, Korea Forestry Promotion Institute, 58 Hwagok-ro, 66-gil, Gangseo-gu, Seoul 07569, South Korea
2
Department of International Trade and Commerce, Soonchunhyang University, Unitopia 901, Soonchunhyang-ro 22, Sinchang-myeon, Asan-si, Chungchungnam-do 31538, South Korea
3
Department of Recreation, Sport and Tourism, University of Illinois at Urbana-Champaign, 1206 South Fourth Street, Champaign, IL 61820, USA
4
Department of Forest Sciences & Research Institute for Agriculture and Life Science, Seoul National University, 1 Gwanak-ro, Gwanak-gu, Seoul 08826, South Korea
*
Author to whom correspondence should be addressed.
Sustainability 2019, 11(13), 3680; https://doi.org/10.3390/su11133680
Submission received: 19 May 2019 / Revised: 28 June 2019 / Accepted: 2 July 2019 / Published: 4 July 2019
(This article belongs to the Section Sustainable Urban and Rural Development)

Abstract

:
This study aims to identify the factors determining the forestry household income in South Korea. An empirical analysis was conducted on the Korea Forest Service’s 3-year-panel data. Korea Forest Service is an institution responsible for the sustainable management of South Korea’s forest lands. In the study, the hypothesized factors determining the forestry household income are classified into four types of assets and three types of livelihood strategies. The forestry household income (FHI) is divided into three elements: forestry income (FI), non-forestry income (NFI), and transfer income (TI). The influence of household assets and livelihood strategies on each income were also assessed. A random effect model was used as a statistical analysis of the three-year data of 979 forestry households. Based on the analysis, we found that household head’s age, household head’s labor capacity, savings, business type, cultivated land size, and region are significantly associated with FHI. While FI was influenced by labor capacity, cultivated land size, business type, forestry business portfolio, and region, NFI was determined by household head’s age, household head’s gender, forestry business portfolio, and savings. TI was affected by household head’s age, household head’s education level, forestry business portfolio, savings, and region. The effect sizes and directions varied across different types of income (FHI, FI, NFI, and TI). The findings showed that South Korea forestry was highly dependent on sustainable assets and livelihood strategies. Based on our findings, we expect the effectiveness of forest policies in increasing the forestry household income would differ depending on the source of each income. The results of this study draw attention to the need for an income support policy which considers the characteristics of household assets and livelihood strategies in order to enhance FHI in South Korea.

1. Introduction

Forestry in South Korea is an industry based on the forest which covers 65% of the country’s land, playing significant roles in conserving biodiversity, maintaining the ecosystem, mitigating climate change, managing the land, and supporting local livelihoods in South Korea. However, covering only 0.14% of the gross national income, the forestry industry does not significantly contribute to the nation’s economy [1]. There are three possible explanations for the insignificant profile of South Korea’s forestry industry. First, the forest resources in South Korea have been unavailable for timber supply due to the average young age of the trees. Second, the infrastructure needed for forestry, such as forest roads, has been underdeveloped due to the adverse topographic characteristics, such as stiff slopes of forestlands. Third, protection-oriented forest policies have accumulated strict regulations on forestry production and development for the last century [2]. Thanks to the forest conservation efforts for the last half-century, the country experienced forest transition [3]. However, the income level of forestry household is at the lowest among the sectors in South Korea. It is at the level of 63.6% of the average urban household.
In order to improve the poor environment of the forestry industry, the South Korean government has been investing in the infrastructure needed for forest management and production [4]. Also, the forest conditions have improved to such a stage that harvesting for low-grade timber is an option for forest management. For example, tree growing stock increased from 65 million m 3 in 1968 to 925 million m 3 in 2015 [5]. Besides, most of the forests of South Korea are approaching their harvesting ages, and people’s interests in healthy forest-based food products have been steadily growing recently. The government has been supporting the private forestry operation by providing financial subsidies for the modernization and commercialization of forest production [6].
Along with these efforts, measures to improve the income level of forestry household have been taken by the Government of South Korea, the budget for the forestry household income (hereafter FHI) support within the forestry budget of South Korea has increased from 4.87% in 2014 to 9.09% in 2018 [7,8].
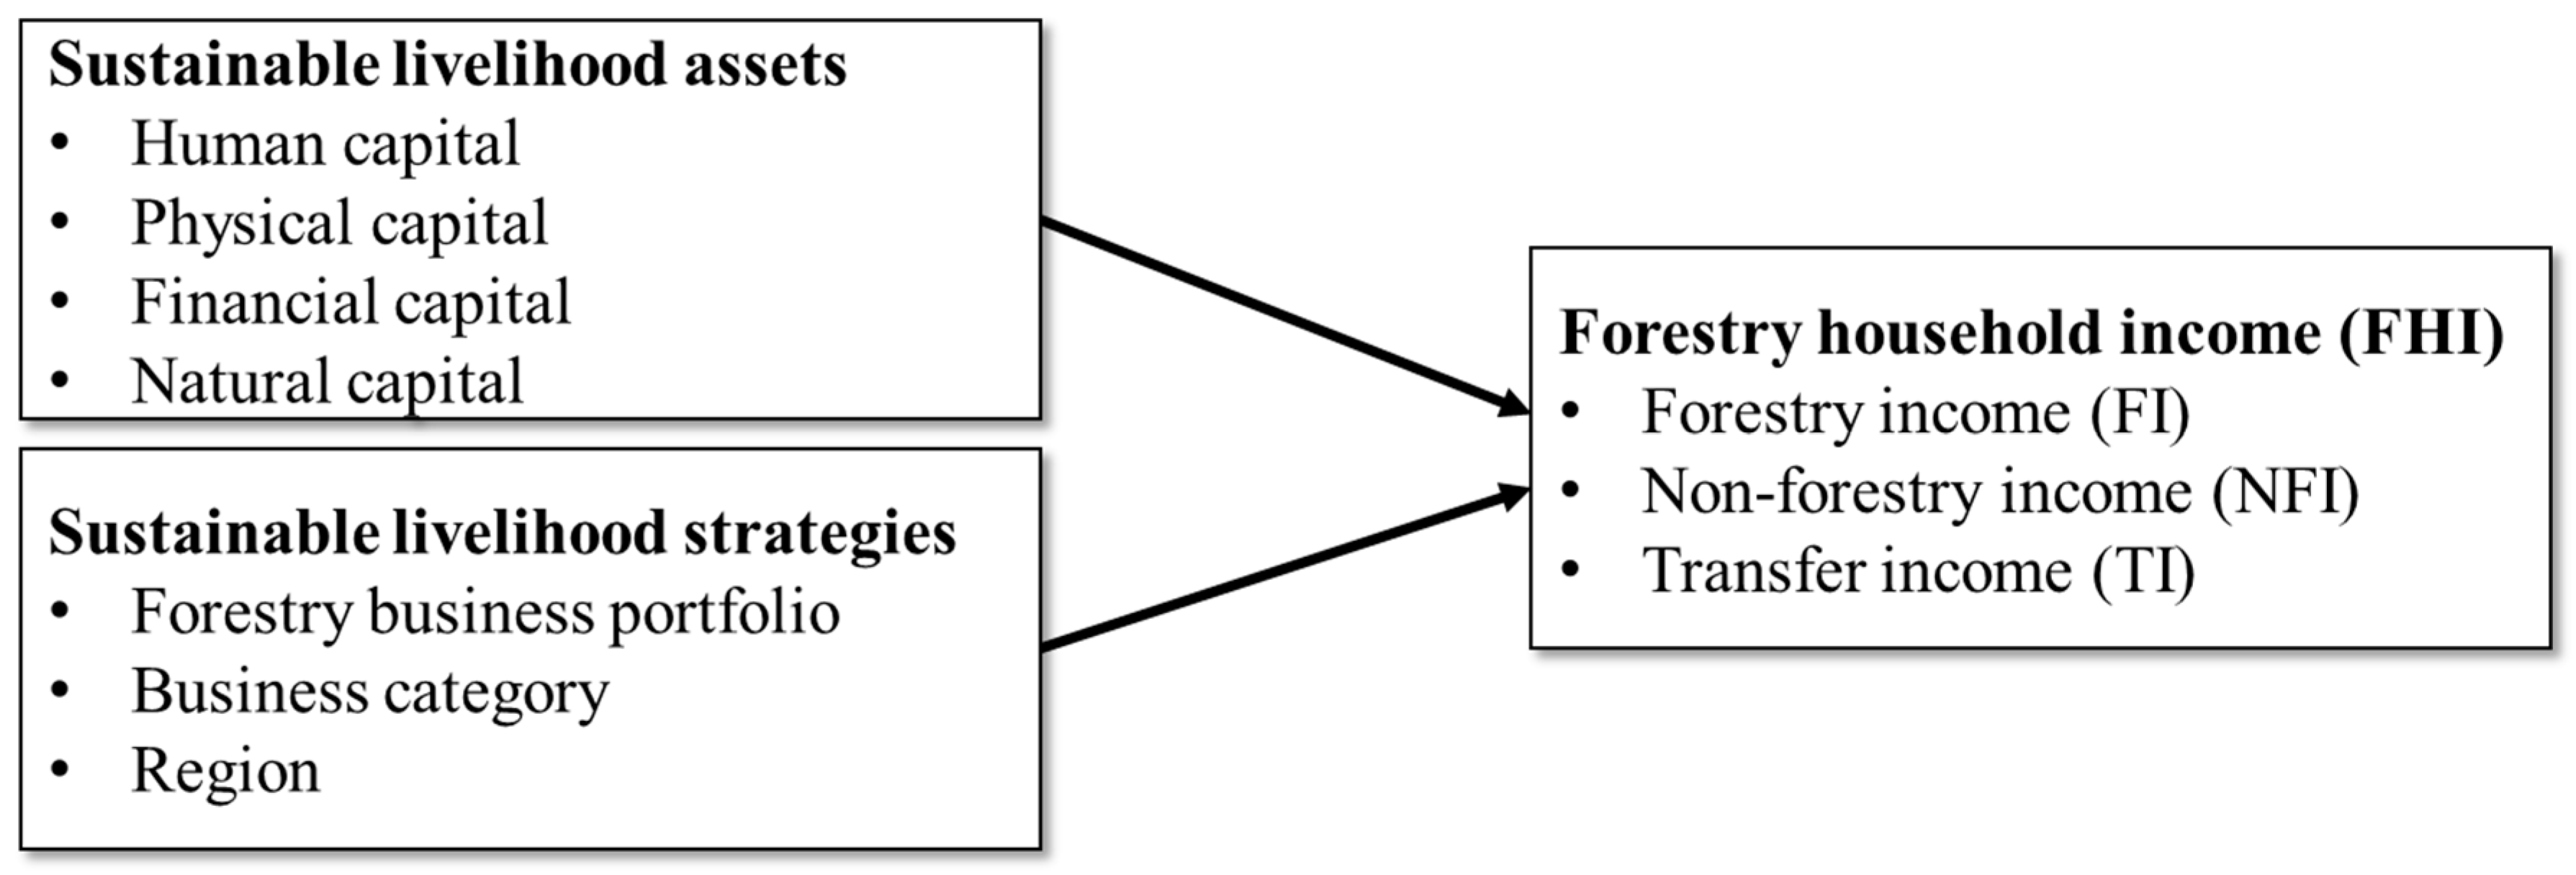
This study analyzed the components of forestry household income and the difference among the groups of households in order to understand the issues related to the structure of underdeveloped forestry industry, and to contribute in enhancing the income of forestry households. We adopted the sustainable livelihood approach (SLA) as the theoretical background and investigated the income structure of forestry household in South Korea. According to the most frequently used definition of sustainable livelihood, a livelihood is sustainable when it copes with and recovers from stress and shocks, maintains or enhances its capabilities and assets, while not undermining the natural resource base [9,10]. SLA mainstreams the livelihood sustainability of the target group as a crucial development goal. SLA has been employed by many development agencies of which most of the official development aids geared to elevate poverty in developing countries by delivering their projects. SLA helps understand the poverty structure, life of the poor, and the relevant social and institutional issues [11].
In this study, SLA is used as a lens to identify determinants of forestry household income (FHI). The following are the distinctions of this study from previous studies applying SLA in the field of forestry and agriculture. First, while some previous studies [12,13,14] considered household capitals as determinants of livelihood strategies, we view the capitals and strategies together as inputs that generate the household income as an output. Second, the studies on the determinants of sustainable livelihood strategy or the determinants of livelihood income using SLA are mostly based on cross-sectional data analysis of specific regions. To our knowledge, few studies have conducted time series data analyses of national range. We also attempt to expand the application of SLA from a regional level to a national level of forestry research.
Therefore, we aim to answer the research questions, “What are the determinants of FHI in South Korea?” and “How different are the determinants of different elements of household income?” Answering these questions should help us understand the forestry household’ livelihood structure and suggest a potential pathway to policy addressing the low contribution of forestry to FHI, ultimately providing policy directions for sustainable livelihood of forestry in South Korea.

2. Background

2.1. Sustainable Livelihood Approach

SLA models the influences of internal and external factors that constitute livelihood in understanding the livelihood of people. The internal factors are household capitals, livelihood strategies, and livelihood outcome, while exogenous factors include social structures and processes [11]. A household’s capitals are subcategorized as natural, human, physical, social, and financial capitals. In a general procedure of SLA, firstly, the accessibility and availability of each household capitals are evaluated. Based on the capitals at hand of the household, a livelihood strategy is determined considering the quantity, quality, and composition of the capitals. The outcome of this livelihood strategy can be food production, cash income, and sustainable resource use, which enable re-investment in the household capitals. On the other hand, the exogenous components deal with environmental changes and institutional measures that directly affect the household’s asset availability and livelihood strategy [12].
As SLA helps in understanding the poverty structure. It often aims at poverty alleviation and is mainly used for research in developing countries to support the life of the poor and the relevant social and institutional issues [11]. Some studies have been conducted on the poor rural areas of mid-income countries such as China [15,16,17,18,19] and Georgia [13]. SLA is an approach applicable to understanding the livelihood of local communities across different developmental stages. Since SLA targets to explore as many livelihood components as possible, it is useful in understanding the livelihoods of a specific rural area. SLA was not designed for reflecting the macroscopic trend but was devised to understand local livelihood in detail [20]. SLA seeks to analyze the sustainability of livelihoods by evaluating the characteristics of households, resource utilization and depletion, institutional change, environmental change, and market accessibility in a specific area. Due to its flexible nature, SLA has been used in diverse sectors including natural resource management [21], mining [20], fisheries [22,23], tourism [24,25,26], cropping [15,27], and multi-sectoral circumstances [16,28,29,30].

2.2. Application of SLA to Forestry Research

Forest-dependent communities are one of the representative subjects of SLA studies. Most of these studies have investigated the relationship between household capitals, livelihood strategies, and household income. For example, Babulo et al. [12] estimated the impact of the natural, human, physical, social, and financial assets of local forestry on household income and resource dependency. Tesfaye et al. [29] defined activities such as forestry, crops and livestock breeding as livelihood strategies, and found that livelihood strategies are significantly associated with outputs including income and food security for forest-dependent households.
Similarly, Soltani et al. [14] analyzed the factors affecting the livelihood strategy and its outcome in rural areas of Iran and found that each household generally takes a strategy to combine forestry, the livestock industry, and agriculture. They also found that livelihood outcomes, such as poverty alleviation and sustainable forest management, are influenced by the endowments of household assets and choice of household strategies. Zenteno et al. [31] examined a rural community’s livelihood strategies that affected household income in tropical rain-forests and found that differentiated livelihood strategies of individual households lead to different income levels. Kemkes [13] analyzed the impact of common pool forest resources on household income and livelihood strategies in rural mountain villages under development pressure in Georgia.

2.3. Household Capitals Affecting Household Income

In the previous studies employing SLA, the household size, household head’s gender, household head’s age, household head’s education level, and labor capacity were used as variables explaining human capital [12,13,14,15,16,19,27,29,31,32,33]. Other variables for human capital include migration index and the female adult ratio [32], conservation and agricultural training [14], marriage [13], children staying away and dead children [31]. In the present study, five variables of human capital are used: household size represented by the number of family members, household head’s gender, household head’s age, labor capacity, and household head’s education level.
Physical capitals have been referred to as tangible assets required for production activities. Generally, equipment [14,18,32] and livestock value [14,15,32,33] were used as physical capital. Infrastructure, number, and quality of housing, livestock, tools, housing value, productive material, and public service were used as constituting elements of physical capital [33]. Hua et al. (2017) [15] used the summed value of different physical assets such as machinery, equipment, fixtures, facilities, small and medium-sized animals, livestock, and large plants. The summed value of fixed capital available from the Forestry Household Economy Survey is treated as physical capital in this study.
As explanatory variables for financial capital, some studies used savings and loans at the same time [13,14,27,33], and others used only loans [12,19]. Cash income, borrowing, access to loans [15,18], net income [14], livestock value, non-farm business, and money lenders [27] were used. In this study, we define financial capital as the immediate assets and liabilities corresponding respectively to savings and loans.
Natural capitals have been represented by land [17,18,19,27,32], plot size [12], agricultural land size [14], area of cropland [29], and land claimed [13]. It is widely believed that the inputs required for profit-maximization in the traditional forest production theory are land-based capitals. In studies the production area of a specific product (brazil nut), the number of perennial plants and expected felling area [31], water resources [16], formal forestry household-ship [14], distance to road [12], distance from town [29], soil fertility [32], rainfall [32], and altitude [29,32] were also used. In this study, forest land size and cultivated land size are used as variables for natural capital.

2.4. Livelihood Strategies Affecting Household Income

Livelihood strategy is a way of making a living that is chosen based on a household’s capacity and needs. Business types or product items have been often used as livelihood strategies in SLA studies. Jansen et al. [32] classified the farming strategies as simple grains producer, livestock producer, and coffee producer. Zenteno et al. [31] used eight business categories, including silviculture/logging, gathering, chestnut tree, astringent persimmon tree, nut tree, mushroom cultivation, landscape material, and others. In many studies, forestry or agricultural product items or business types are explicitly or implicitly defined as ways of sustaining a livelihood.
The type of forestry in South Korea reflects the situation of forestry as many households practicing forestry are often engaged in other businesses other than forestry. It is common that forestry households are engaged in agriculture simultaneously. Previous studies on the determinants of domestic agriculture household’s income often include both or either of the full-time or part-time engagement in agriculture [34,35,36]. Thus, we considered the amount of time invested in the livelihood activity as the forest business portfolio and operationally defined it as the voluntarily chosen household’s livelihood strategies. For example, in case a household is engaged in forestry together with agriculture or other business, a livelihood strategy for this household is considered as a part-time forestry household. We further subdivided the part-time forestry business portfolio into major part-time and minor part-time status based on the proportion of forestry income relative to income from other sources.
Geographical location can be considered either as a natural asset or a livelihood strategy, depending on the household’s motivation to reside in a particular region. We view the region as a livelihood strategy because of a household’s decision on the location of residence impacts on their production and marketing strategy. For example, forestry income can be affected by varying local conditions such as climatic factors, available resources, market characteristics, regional government policies, and infrastructure. Zhu et al. [37] mentioned that regional factors significantly influence household investment behavior in non-timber forest products (NTFPs) business. Also, Kim and Lee [38] reported that there is a difference in the structure of agricultural income in each province. Therefore, accounting the differences in specific regions and differentiating the structure of forestry by geographical and administrative region can be considered as effective strategies.
To sum up, the outcome of forestry household livelihood is generated and influenced by both the household capitals and livelihood strategies. Therefore, we viewed household characteristics and livelihood strategies together as determinants of household income (Figure 1).

3. Materials and Methods

3.1. Status of Forestry Household Income in South Korea

Average household income varies across different industrial domains (Table 1). Forestry household income has been lower than other types of household income. In 2016, the percentage of average forestry household income was 33,585,000 KRW, which was 90.3% of agriculture household income, 71.3% of fishery household income, and 63.6% of national income. This trend indicates that the conditions for production activities in forestry are inferior to those of agriculture and fishery.
FHI can be divided into regular income (93.9% in 2016) and irregular income (6.1% in 2016). While regular income is earned from the main business, irregular income is gained on a temporary basis (e.g., insurance and severance pay). Therefore, in this study, only regular income is considered as the dependent variable. The regular income consists of forestry income (FI), non-forestry income (NFI), and transfer income (TI) accounting for 33.7%, 39.7%, and 20.6% of the total FHI, respectively, in 2016 (Table 2).

3.2. Forestry Household Survey Data

South Korea defines forestry, agricultural, and fishing households in its law as the primary industrial group, which is aimed to clarify the targets of its policy support. The data used in this study has been collected annually since 2005, after 20 years of government attempts to build the data for understanding the economy of forestry since 1985. The forestry household economy survey aims to provide general knowledge about forestry economy indicators and trends that are used to design forestry support policies. The analytic indicators and data about household income and expenditure, and household assets and liabilities are provided for empirical studies on forestry policies [5].
The population of the survey from 2014 to 2016 was 122,973 forestry household identified in the 2010 forestry census conducted by the government. The definition of forestry household is a household that manages forestry business to make a living, meeting one or more of the following three criteria. (1) More than 3 ha of forestland owned and at least five consecutive years of forest business experience, (2) more than 1.2 million KRW for annual earnings from forest product sales, or (3) more than 90 days of labor on forestry work per year [5]. Therefore, forestry household and forestry workers, even if their main job is not related to forestry, may also be included in the population if they fall in one of the above.
Three-year panel dataset consisting of 1,105 forestry households in each year of 2014–2016 was retrieved from the forestry household economy survey. Then, a stratified two-step extraction method was used to select samples as follows [5]. First, proportional probability extraction based on the forestry business types was carried out for each eup, myeon or dong (unit of city district) of major cities and provinces. Then, random sampling was conducted in each of the extracted groups based on business types. These samples were stratified by size of industry represented by cultivation area and production amount for each of the nine regions in the country.
Reflecting the heterogeneity of the panel entity based on the selected variables, the random effect model for hypothesis testing estimated coefficient values. The choice of the model is confirmed through a Hausman test. By eliminating missing values in the panel data, a balanced panel was formed minimizing errors. As a result, 979 forestry household data for each year of 2014–2016, aggregating to a total of 2937-panel data were finally extracted and standardized.

3.3. Analytical Models

All independent variables are treated as either categorical or continuous variables when their effects on the dependent variable (FHI, FI, NFI, or TI) are estimated. In this research, a random effect model was applied to test the hypotheses for the following three reasons. First, the forestry household economy survey has a balanced dataset. That is, the data of forestry households remain unchanged every year without missing values. Estimation errors tend to increase as panel data become unbalanced. Second, in the balanced panel data, the number of forestry household is large while the number of years is small, which may lead to loss of degrees of freedom if a fixed effects model is used. A Hausman test is used to check if this problem is salient. Third, a random effects model estimates the effects time-invariant dummy variables (e.g., gender of household head and forestry business portfolio) in the given time, while a fixed effect model leaves out variables that are fixed over time.
To prevent any autocorrelation problem, we use generalized least squares (GLS) estimation to make sure no correlation between explanatory variables and object property error terms. A Breusch-Pagan Lagrange multiplier (LM) test and a Hausman test was used to confirming the use of the stochastic effect.
y i t = α y i t 1 + β x i t + η i + ε i t
Based on equation (1), it is a static analysis if α = 0 while it is dynamic if α 0 . If x i t is correlated with η i , uncontrolled heteroskedasticity may be in error and need to be controlled.
In the processing of η i , it can be classified into fixed effect and random effect using panel data. While the fixed effect is preferred when it needs to control completely η i , the random effect is reasonable when it partly allows η i . Generally, if there are time-invariant variables with no time dependence, a random effect model is preferable. If η i Is treated as N-1 individual piles, and the ordinary least square (OLS) is applied to the mean-deviated model, the model is analyzed as a fixed effect model. If η i is regarded as a random variable independent of x i t moreover, GLS is applied; it should be analyzed as a random effect model.

4. Results

4.1. Sample Description

Descriptive statistics, including the means, standard deviations, minimum values, and maximum values of the dependent variables–FHI, FI, NFI, and TI–are presented in Table 3. There are slight changes in the dependent variables but no significant difference over the three years. FHI was 33.4 million KRW in 2014, 32.4 million KRW in 2015, and 34.2 million KRW in 2016. The mean FI and NFI slightly decreased while the mean TI increased over 2014-2015, but all of them moderately increased over 2015–2016. Over the three years, the mean FI and TI have slightly increased, whereas the mean NFI has marginally decreased. The negative minimum values of FHI, FI, and NFI mean decreases in household income in the categories. These values most likely account for logging or mushroom businesses which do not harvest or sell products in the same year, counting only operational costs.
The mean of household head’s age was 63.94 years old. Forestry households were working for 595.28 hours per year on average (labor capacity). Also, they were working on their cultivated land in an average size of 5.09 ha. The means of the forestry households’ fixed capital, savings, and loan values were 348 million KRW, 40 million KRW, and 31 million KRW, respectively. The fixed capital of the panel data used in this study reflects the depreciation cost of each year. The households had 2.41 family members (household size) on average. The average years of formal education of the household heads were 8.4 years. The average forest land size possessed by the households was 2.01 ha. The means, standard deviations, minimum, and maximum values of the variables are presented in Table 4.
The descriptive statistics of categorical variables are summarized in Table 5. Forestry household heads were dominantly males (2652 people, 90.30%). Among the business types, others were of the largest number (624, 21.25%), followed by astringent persimmon tree (497, 16.92%), chestnut tree (371, 12.63%), landscape material (353, 12.02%), nut tree (344, 11.71%), gathering (296, 10.08%), mushroom cultivation (241, 8.21%) and silviculture/logging (211, 7.18%).
In terms of the forestry business portfolios, full-time forestry means at least one member of the family should be engaged in paid non-forestry work for more than 30 days in the year. Major part-time means forest revenues exceed non-forestry revenues, minor part-time means non-forestry revenues exceed forestry revenues. The number of forestry households engaged in full-time forestry was 120 (4.09%). Among the part-time forestry households, 1151 of them (39.19%) were engaged in forestry as a major business while 1,666 forestry households (56.72%) were engaged in forestry as a minor business. By region, there were 654 forestry households (22.27%) in Gyeongsangbuk-do, 633 forestry households (21.55%) in Jeollanam-do, 522 forestry households (17.77%) in Gyeongsangnam-do, 315 forestry households (10.73%) in Chungcheongnam-do, 306 forestry households (10.42%) in Jeollabuk-do, 246 forestry households (8.38%) in Gangwon-do, 162 forestry households (5.52%) in Chungcheongbuk-do, and 99 forestry households (3.37%) in Gyeonggi-do.

4.2. ANOVA/MANOVA and Correlations

Analysis of variance (ANOVA) was conducted to analyze the differences among FHI, FI, NFI, and TI depending on the categorical independent variables. Most of the independent variables used in this study were significant at the significance level of 0.05 for dependent variables. However, in the case of transfer income, there is no significant difference in the gender of household head (F = 0.01, p > 0.05). The results show that our categorical variables are statistically appropriate to predict dependent variables. Also, we examine the multivariate analysis of variance (MANOVA) to understand the linkages between the set of categorical independent variables and the set of dependent variables as endogenous. As displayed in Table 6, Wilks’   λ for each is larger than 0.90, and all independent variables are significant for dependent variables. Results of ANOVA/MANOVA lead us to assume that our estimation between categorical and dependent variables is valid.
We also conducted a Pearson-correlation analysis to examine the degrees of association between variables (Table 7). The dependent variables were standardized, and some variables such as fixed assets, savings, and loan were divided by million. The results show that except for coefficients between dependent variables, most coefficients are less than 0.5 and significant at 0.05, meaning that they are not significantly correlated. The main reason for the high correlation between dependent variables is that FI and NFI are structurally included in FHI (r = 0.85, r = 0.48, respectively). Since the area of cultivation occupies some parts of the total forest land area, the correlation of them is high (r = 0.54). To examine multicollinearity between variables, tolerance test using variance inflation factor (VIF) and Eigenvalue were checked. There are little doubts about multicollinearity if VIF is less than 10 [39]. The VIFs of our correlation ranged from a minimum of 1.06 to a maximum of 7.99. Even if we included FHI, FI, and NFI where collinearity was suspected, VIF showed an average of 5.83, which was less than 10. Therefore, it is reasonable to suppose there is no multicollinearity between the variables.

4.3. The Random Effects Model

The results of the random effects model estimation are summarized in Table 8. Since the results of Breusch-Pagan LM are statistically significant, we assure that the use of the random effect model is appropriate. The p-value of the Hausman test was larger than 0.05, which also supports the appropriateness of the random effect model.
Factors associated with FHI consist of business type, region, cultivated land size, household head’s age, labor capacity, and savings. In terms of the livelihood strategy, households engaging with growing landscape materials and nut trees were more likely to have higher FHI compared to those engaging with silviculture and logging. Also, households located in Gangwon-do, Chungcheongbuk-do, and Jeollanam-do tended to have higher FHI than those in Gyeonggi-do. Labor capacity as human capital and cultivated land size as a natural capital were positively related to FHI while forest land size did not show significant association. Younger household heads were more likely to have higher FHI. As a financial capital, savings were also positively associated with FHI.
The results suggest that FI is affected by forestry business portfolio, business type, region, cultivated land size, and labor capacity. As a livelihood strategy, part-time forestry engagement was likely to have lower FI than full-time forestry engagement. Also, growing landscape materials was a livelihood strategy positively affecting FI. The FI of households based in Gangwon-do and Chungcheongbuk-do was likely to be higher than that of households based in Gyeonggi-do. Similar to FHI, FI was positively related to cultivated land size and labor capacity.
NFI is associated with forestry business portfolio, household head’s gender, household head’s age, and savings. When it comes to the livelihood strategy, part-time forestry engagement was likely to have higher NFI than full-time forestry engagement. In terms of human capitals, household head’s gender as male was positively associated with NFI while household head’s age was negatively associated. Like the case of FHI, savings as a financial capital was positively associated with NFI.
Variables that influence TI include forestry business portfolio, region, household head’s education, household head’s age, and savings. Part-time forestry engagement and living in Chungcheongbuk-do, Jeollabuk-do, and Jeollanam-do were livelihood strategies that were more likely to increase TI compared to full-time forestry engagement and living in Gyeonggi-do, respectively. Regarding human capitals, more educated or older household heads tended to have higher TI. Also, savings was a financial capital positively associated with TI.

5. Discussion

In developed countries with strong forestry infrastructure, such as Germany, Austria, and Japan, timber production is considered as a significant source of FHI [40]. However, research shows that non-timber forest products (NTFP)s take a major portion of FHI in developing countries [41,42,43,44,45]. Our study indicates that the forestry households in South Korea have characteristics often seen in developing countries in that their FI relies heavily on NTFPs. This trend contradicts South Korea’s relatively high economic status, meaning that the forestry sector in South Korea bears issues that require poverty approaches such as SLA. To better understand the income structure of the forestry households in South Korea, in-depth exploration of different income types based on household capitals and livelihood strategies is needed.
As for FHI, business types such as growing landscape materials seem to contribute more to the total household income than traditional forestry (e.g., silviculture and logging). Incomes varying across different types of business have also been evidenced by some national studies on agricultural household heads [34,35]. Therefore, the livelihood strategy to run certain business is a significant factor that influences FHI. Also, an increase in labor capacity or cultivated land area is related to an increase in FHI, while forest land size showed no significant relationship with FHI. Kwon and Kang [35] also found that agricultural income increased with larger cultivated land in South Korea.
Regarding FI, the forestry households that have adopted full-time engagement in forestry have higher FI than those who have not worked full time in forestry, whereas NFI is explained reversely. To our knowledge, there are no studies abroad that include full-time and part-time as livelihood strategy variables. Studies using such variables in South Korea [34,35,36] advocate our results by reporting that full-time agricultural households earned a higher income than part-time households. Hogarth et al. [46] found the forest land size to be positively related to FI, which was not the case in this study. The discrepancy may be attributed to the high proportion (83.6%) of NTFPs cultivation business among forestry households in South Korea.
The analysis on NFI shows that younger forestry household heads tend to have higher NFI, which is aligned with Choi and Ko’s [34] findings that younger agricultural household heads had higher total forest household income and non-farm income. In South Korea, the sales of forestry or agricultural products processed are classified as NFI. It is possible that younger forestry households are keener on sales and marketing techniques or production technologies, which lead to an increase in NFI. Also, forestry households with more savings are expected to have higher NFI. Kim and Lee [38] have reported that more capitals lead to a decrease in the inequality of agricultural household income. Our finding that savings do not significantly affect FI but do affect NFI implies that the investment capacity of forestry households is often used for non-forestry activities.
TI of forestry households tends to be higher in part-time forestry households than in full-time forestry households. Most of the part-time forestry households are engaged in agriculture at the same time, by which they receive a lot of agricultural subsidies that contribute to their TI. Also, household head’s education level is positively related to TI. Since TI is in big part accounted for by government subsidies, people with lower education level may face more difficulties utilizing such information. It has been reported in previous research that forestry or agriculture household heads with higher education tend to be keener on utilizing government subsidies or conforming to policies [47,48]. Also, the part-time forestry households’ TI is higher than the full-time household, mainly due to the subsidies in the agricultural sector.
Interestingly, forest land size is not significantly associated with FHI. It is perhaps because the lands forestry households own in South Korea are often passively inherited rather than acquired with forestry business motivation. On the other hand, the amount of savings is positively associated with FHI. However, the significance is not present regarding FI while it has a significant effect on the NFI, as discussed next. It is likely that the savings of forestry household are not invested in forestry businesses but non-forestry activities. Therefore, policy measures or incentives are needed to direct the forestry household savings to pursue earnings from forestry businesses.
To enhance our understanding of the determinants and relevant factors of forestry household income in Korea, adding various aspects to the survey for forestry household economy to further explore household income variables is necessary. This study can play a guiding role for the government to make policymaking more effective and to bring about greater policy effects.

6. Conclusions

FHI is a significant indicator of the sustainable livelihood of households practicing forestry. Thus, it is necessary to find out under what conditions the FHI can be improved. In order to identify the factors affecting the FHI, individual forestry households who owned capitals and selected livelihood strategies must be systematically understood and analyzed in various perspectives. In this study, FHI is divided into FI, NFI, and TI. We tried to investigate in detail how household capitals and livelihood strategies influence their income sources.
The main results are presented as follows. First, factors affecting FHI are household head’s age, labor capacity, savings deposits, cultivated land area, business type, forestry business portfolio, and regional characteristics. Second, the factors affecting FI include labor capacity, cultivated land area, business type, forestry business portfolio, and regional characteristics. Third, factors influencing the NFI were household head’s gender, household head’s age, savings deposits, and forestry business portfolio. Fourth, the factors affecting TI are household head’s age, household head’s education level, savings deposits, forestry business portfolio, and region. The effect sizes and directions of significant factors are found to be various depending on the dependent variables, namely FHI, FI, NFI, and TI.
The implications of the main results are derived as follows. First, labor capacity, a human capital, and the cultivated land area, a natural capital, were significant determinants of FI. This is in line with the theoretical principles of agricultural production that the bases of agricultural production are land, labor, and capital. In this view, it is necessary to provide policy instruments to promote employment in the forestry sector so that forestry can enhance the labor capacity utilization of households. Also, as cultivated land area is positively related to FI, policies that encourage using marginal mountainous or agricultural lands for forestry could be conducive to increasing FI. Second, household head’s age, a human capital, and savings deposits, a financial capital, are found to be significant determinants of the NFI. Younger household heads put more emphasis on the non-forestry activities such as labor-intensive primary production. Such finding suggests that the financial capitals held by households tend to be invested in non-forestry activities rather than forestry activities. Third, the determining factors of the level of forestry household’s transfer income were household head’s education level, a human capital, and the forestry business portfolio, a livelihood strategy. Therefore, policy measures and information system that provide high accessibility for people with all levels of education are required.
The contribution of our efforts is anticipated as follows. This study identifies the factors that have significant impacts on the various types of income of South Korean forestry households and provide policy implications by empirically validating them. Theoretically, our study expanded the application of SLA by using panel data and incorporating livelihood strategies into the independent variable set. This study is considered novel in that it explores the determinants of forestry household income in South Korea from an academic point of view. We have examined the determinants of the forestry household’s income by different sources.
Despite its potential benefits, this study also faces limitations. First, we could not include variables corresponding to the social capitals of SLA in the model. The social capital variables used in previous studies include years of residence [31] and union membership [27,33]. Due to the absence of the relevant variables in our data, we failed to include them in our analysis. Second, this study deals with the most recent three-year panel data from 2014 to 2016. The complete data was collected since 2005, but the sample of the data changed in 2014 based on the Agriculture, Forestry, and Fisheries Census conducted in 2010. It is expected that the sample will be reorganized again in 2018 based on the Agriculture, Forestry, and Fisheries Census conducted in 2015. We expect to grasp the dynamic change pattern of the determinants of the income by longitudinal change if we can compare the capital and strategic characteristics of household income by using the same data for each periodical sample.
This research results can be used as basic information to help device policy measures to increase forestry household income. In order to maintain a sustainable livelihood through full-time forestry, the scale of forestry should be large enough to maintain adequate production, and the labor input should become abundant accordingly. However, this is somewhat unrealistic because the labor cost in South Korea is rapidly going up. Moreover, due to the geographical characteristics of South Korea’s forest, mechanized forestry is highly limited.
This study attempts to investigate FHI in terms of sustainable livelihood in rural villages. We hope that the results of this study will provide necessary information about the structure of forestry household income in South Korea and will help them make decisions that lead their livelihood to be more economically sustainable.

Author Contributions

Conceptualization, J.-H.J., Y.-C.Y. and T.R.; methodology, T.R.; formal analysis, J.-H.J., T.R. and S.S.; data curation, J.-H.J. and T.R.; writing—original draft preparation, J.-H.J. and S.S.

Funding

This work was supported by Seoul National University and by the Soochunhyang University Research Fund.

Acknowledgments

This article is part of Jang-Hwan Jo’s Ph.D. dissertation. The authors would like to thank the anonymous reviewers for their very valuable comments on earlier versions of this article. A large thank you also goes to the forestry households who kindly gave up some of their precious time for this research.

Conflicts of Interest

The authors declare no conflict of interest.

References

  1. Jo, J. Determining Factors of Forestry Household Income. Ph.D. Dissertation, Seoul National University, Seoul, South Korea, 2018. [Google Scholar]
  2. Korea Forestry Promotion Institute (KOFPI). A Study on the Role of KOFPI in Increasing Forestry Household Income and Growing Forest-related Industry; KOPFI: Seoul, South Korea, 2014. [Google Scholar]
  3. Park, M.S.; Youn, Y.C. Reforestation policy integration by the multiple sectors toward forest transition in the Republic of Korea. For. Policy Econ. 2017, 76, 45–55. [Google Scholar] [CrossRef]
  4. Min, K. Urban residents’ perception on mountainous villages. Korean J. For. Econ. 2017, 24, 15–24. [Google Scholar]
  5. Korea Forest Service (KFS). Forestry Household Economy Survey; KFS: Daejeon, South Korea, 2017. [Google Scholar]
  6. Jo, J.; Roh, T. Analysis of stakeholder value chain for export activation of forest products: Focused on forest-product export specialized area. Reg. Ind. Rev. 2017, 40, 65–85. [Google Scholar]
  7. Korea Forest Service (KFS). Forestry Budget 2014; KFS: Daejeon, South Korea, 2014. [Google Scholar]
  8. Korea Forest Service (KFS). Forestry Budget 2018; KFS: Daejeon, South Korea, 2018. [Google Scholar]
  9. Chambers, R.; Conway, G. Sustainable Rural Livelihoods: Practical Concepts for the 21st Century; Institute of Development Studies (IDS) Discussion Paper 296; IDS: London, UK, 1992. [Google Scholar]
  10. Morse, S.; McNamara, N. Sustainable Livelihood Approach: A Critique of Theory and Practice; Springer: New York, NY, USA, 2013. [Google Scholar]
  11. Ashley, C.; Carney, D. Sustainable Livelihoods: Lessons from Early Experience; Department for International Development (DFID): London, UK, 1999. [Google Scholar]
  12. Babulo, B.; Muys, B.; Nega, F.; Tollens, E.; Nyssen, J.; Deckers, J.; Mathijs, E. Household livelihood strategies and forest dependence in the highlands of Tigray, Northern Ethiopia. Agric. Syst. 2008, 98, 147–155. [Google Scholar] [CrossRef]
  13. Kemkes, R.J. The role of natural capital in sustaining livelihoods in remote mountainous regions: The case of Upper Svaneti, Republic of Georgia. Ecol. Econ. 2015, 117, 22–31. [Google Scholar] [CrossRef]
  14. Soltani, A.; Angelsen, A.; Eid, T.; Naieni, M.S.N.; Shamekhi, T. Poverty, sustainability, and household livelihood strategies in Zagros, Iran. Ecol. Econ. 2012, 79, 60–70. [Google Scholar] [CrossRef]
  15. Hua, X.; Yan, J.; Zhang, Y. Evaluating the role of livelihood assets in suitable livelihood strategies: Protocol for anti-poverty policy in the Eastern Tibetan Plateau, China. Ecol. Indic. 2017, 78, 62–74. [Google Scholar] [CrossRef]
  16. Liu, Y.; Xu, Y. A geographic identification of multidimensional poverty in rural China under the framework of sustainable livelihoods analysis. Appl. Geogr. 2016, 73, 62–76. [Google Scholar] [CrossRef]
  17. Peng, W.; Zheng, H.; Robinson, B.E.; Li, C.; Wang, F. Household livelihood strategy choices, impact factors, and environmental consequences in Miyun reservoir watershed, China. Sustainability 2017, 9, 175. [Google Scholar] [CrossRef]
  18. Wang, F.; Yang, D.; Wang, C.; Zhang, X. The effect of payments for ecosystem services programs on the relationship of livelihood capital and livelihood strategy among rural communities in Northwestern China. Sustainability 2015, 7, 9628–9648. [Google Scholar] [CrossRef]
  19. Xu, D.; Zhang, J.; Rasul, G.; Liu, S.; Xie, F.; Cao, M.; Liu, E. Household livelihood strategies and dependence on agriculture in the mountainous settlements in the Three Gorges Reservoir Area, China. Sustainability 2015, 7, 4850–4869. [Google Scholar] [CrossRef]
  20. Horsley, J.; Prout, S.; Tonts, M.; Ali, S.H. Sustainable livelihoods and indicators for regional development in mining economies. Extr. Ind. Soc. 2015, 2, 368–380. [Google Scholar] [CrossRef]
  21. Tang, Q.; Bennett, S.J.; Xu, Y.; Li, Y. Agricultural practices and sustainable livelihoods: Rural transformation within the Loess Plateau, China. Appl. Geogr. 2013, 41, 15–23. [Google Scholar] [CrossRef]
  22. Ahmed, N.; Troell, M.; Allison, E.H.; Muir, J.F. Prawn postlarvae fishing in coastal Bangladesh: Challenges for sustainable livelihoods. Mar. Policy 2010, 34, 218–227. [Google Scholar] [CrossRef]
  23. Ferrol-Schulte, D.; Wolff, M.; Ferse, S.; Glaser, M. Sustainable livelihoods approach in tropical coastal and marine social–ecological systems: A review. Mar. Policy 2013, 42, 253–258. [Google Scholar] [CrossRef]
  24. Iorio, M.; Corsale, A. Rural tourism and livelihood strategies in Romania. J. Rural Stud. 2010, 26, 152–162. [Google Scholar] [CrossRef]
  25. Shen, F.; Hughey, K.F.D.; Simmons, D.G. Connecting the sustainable livelihoods approach and tourism: A review of the literature. J. Hosp. Tour. Manag. 2008, 15, 19–31. [Google Scholar] [CrossRef]
  26. Wall, G.; Mathieson, A. Tourism: Change, Impacts, and Opportunities; Pearson Education: Cranbury, NJ, USA, 2006. [Google Scholar]
  27. Peprah, K. Sustainability of cocoa farmers’ livelihoods: A case study of Asunafo District, Ghana. Sustain. Prod. Consum. 2015, 4, 2–15. [Google Scholar] [CrossRef]
  28. Pandey, R.; Jha, S.K.; Alatalo, J.M.; Archie, K.M.; Gupta, A.K. Sustainable livelihood framework-based indicators for assessing climate change vulnerability and adaptation for Himalayan communities. Ecol. Indic. 2017, 79, 338–346. [Google Scholar] [CrossRef]
  29. Tesfaye, Y.; Roos, A.; Campbell, B.M.; Bohlin, F. Livelihood strategies and the role of forest income in participatory-managed forests of Dodola area in the bale highlands, southern Ethiopia. For. Policy Econ. 2011, 13, 258–265. [Google Scholar] [CrossRef]
  30. Torres, B.; Günter, S.; Acevedo-Cabra, R.; Knoke, T. Livelihood strategies, ethnicity and rural income: The case of migrant settlers and indigenous populations in the Ecuadorian Amazon. For. Policy Econ. 2018, 86, 22–34. [Google Scholar] [CrossRef]
  31. Zenteno, M.; Zuidema, P.A.; de Jong, W.; Boot, R.G.A. Livelihood strategies and forest dependence: New insights from Bolivian forest communities. For. Policy Econ. 2013, 26, 12–21. [Google Scholar] [CrossRef]
  32. Jansen, H.G.P.; Pender, J.; Damon, A.; Wielemaker, W.; Schipper, R. Policies for sustainable development in the hillside areas of Honduras: A quantitative livelihoods approach. Agric. Econ. 2006, 34, 141–153. [Google Scholar] [CrossRef]
  33. Fang, Y.; Fan, J.; Shen, M.; Song, M. Sensitivity of livelihood strategy to livelihood capital in mountain areas: Empirical analysis based on different settlements in the upper reaches of the Minjiang River, China. Ecol. Indic. 2014, 38, 225–235. [Google Scholar] [CrossRef]
  34. Choi, J.-H.; Ko, S.-N. Determinants of farm household income in Korea. J. Ind. Econ. Bus. 2005, 18, 1139–1159. [Google Scholar]
  35. Kwon, O.-S.; Kang, H.-J. An analysis of the determinants of farm income, Incorporating Regional Characteristics. Korean J. Agric. Econ. 2013, 54, 75–93. [Google Scholar]
  36. Jung, J.H.; Cho, H.-J. The effect of schooling of farm household members on household income. J. Agric. Educ. Hum. Resour. Dev. 2013, 45, 1–23. [Google Scholar]
  37. Zhu, H.; Hu, S.; Ren, Y.; Ma, X.; Cao, Y. Determinants of engagement in non-timber forest products (NTFPs) business activities: A study on worker households in the forest areas of Daxinganling and Xiaoxinganling Mountains, northeastern China. For. Policy Econ. 2017, 80, 125–132. [Google Scholar] [CrossRef]
  38. Kim, G.S.; Lee, S.K. A study on influence factors of inequality of farm household income. Journal Korean Reg. Sci. Assoc. 2014, 30, 87–102. [Google Scholar]
  39. Hair, J.F.; Black, W.C.; Babin, B.J.; Anderson, R.E.; Tatham, R.L. Multivariate Data Analysis; Prentice Hall: Upper Saddle River, NJ, USA, 1998. [Google Scholar]
  40. Min, K.-T.; Seok, H.; Choi, J. Policy Tasks to Improve the Profitability of Forest Management in Korea; Korea Rural Economic Institute (KREI) Report No.817; KREI: Naju, South Korea, 2017. [Google Scholar]
  41. Adhikari, B.; Di Falco, S.; Lovett, J.C. Household characteristics and forest dependency: Evidence from common property forest management in Nepal. Ecol. Econ. 2004, 48, 245–257. [Google Scholar] [CrossRef]
  42. Mcelwee, P.D. Forest environmental income in Vietnam: Household socioeconomic factors influencing forest use. Environ. Conserv. 2008, 35, 147–159. [Google Scholar] [CrossRef]
  43. Kar, S.P.; Jacobson, M.G. NTFP income contribution to household economy and related socio-economic factors: Lessons from Bangladesh. For. Policy Econ. 2012, 14, 136–142. [Google Scholar] [CrossRef]
  44. Fikir, D.; Tadesse, W.; Gure, A. Economic contribution to local livelihoods and households dependency on dry land forest products in Hammer District, Southeastern Ethiopia. Int. J. For. Res. 2016, 2016. [Google Scholar] [CrossRef]
  45. Hegde, R.; Enters, T. Forest products and household economy: A case study from Mudumalai Wildlife Sanctuary, Southern India. Environ. Conserv. 2000, 27, 250–259. [Google Scholar] [CrossRef]
  46. Hogarth, N.J.; Belcher, B.; Campbell, B.; Stacey, N. The role of forest-related income in household economies and rural livelihoods in the border-region of Southern China. World Dev. 2013, 43, 111–123. [Google Scholar] [CrossRef]
  47. Teklu, T.; Lemi, A. Factors affecting entry and intensity in informal rental land markets in Southern Ethiopian highlands. Agric. Econ. 2004, 30, 117–128. [Google Scholar] [CrossRef]
  48. Du, W.; Huang, X. Regional difference and influencing factors of farm households’ willingness of rural land transmission: A case study of Shanghai, Nanjing, Taizhou and Yangzhou Cities in Yangtze-Delta Region. Resour. Sci. 2005, 27, 90–94. [Google Scholar]
Figure 1. Research model.
Sustainability 11 03680 g001
Table 1. Forestry household income and incomes of primary industries in South Korea.
Division201420152016
Forestry household income a31,05832,22333,585
Agriculture household income a34,95037,21537,197
Fishery household income a41,01543,89547,077
National household income a51,62852,47752,790
Forestry/ Agriculture income b 88.986.590.3
Forestry/ Fishery income b75.773.471.3
Forestry/ National income b60.261.463.6
Note: a: 1000 KRW, b: %. Source: Korea Forest Service (2015a, 2016a, 2017a) revised.
Table 2. The forestry household income in South Korea from 2014 to 2016.
Division201420152016
Income aRatio bIncome aRatio bIncome aRatio b
Forestry household income31,05810032,22310033,586100
Regular Income28,84392.930,08693.431,55193.9
Forestry income976131.410,58632.911,31433.7
Non-forestry income13,38243.113,09840.613,31839.7
Transfer income570118.4640119.96,91820.6
Irregular Income22147.121386.62,0346.1
Note: a: 1000 KRW, b: %. Source: Korea Forest Service (2015a, 2016a, 2017a) revised.
Table 3. Descriptive statistics—dependent variables (unit: million KRW).
VariableObsMeanS.D.MinMax
2014FHI97933.4057.70−121.00932.00
FI97911.4052.00−141.00935.00
NFI97913.9022.70−95.60220.00
TI9795.626.530.0071.20
2015FHI97932.4047.80−122.00713.00
FI97910.8038.70−65.60709.00
NFI97913.0021.70−158.00237.00
TI9796.277.300.00118.00
2016FHI97934.2041.20−73.70528.00
FI97911.7031.50−73.70531.00
NFI97913.8021.50−115.00158.00
TI9796.576.930.0064.60
Table 4. Descriptive statistics—continuous variables (Unit: million KRW).
VariableObsMeanS.D.MinMax
Household head’s age a293763.949.0632.0084.00
Labor capacity b2937595.28901.500.0012,096.00
Cultivated land size c29375.098.230.00109.50
Fixed capital d2937348.00579.0021.8017,100.00
Savings d293740.0059.800.00810.00
Loan d293731.0064.400.00939.00
Household size e29372.411.031.008.00
Household head’s education a29378.407.290.0018.00
Forest land size c29372.015.220.0060.50
Notes: a: year, b: hour, c: ha, d: mil. KRW, e: number of people.
Table 5. Descriptive statistics—categorical variables.
VariablesFreq.PercentageCum.
Household head’s gender
Female2859.709.70
Male265290.30100
Business Category
Silviculture / Logging2117.187.18
Gathering29610.0817.26
Chestnut tree37112.6329.89
Astringent persimmon tree49716.9246.82
Nut tree34411.7158.53
Mushroom cultivation2418.2166.73
Landscape material35312.0278.75
Others62421.25100
Forestry business portfolio
Full-time1204.094.09
Major part-time115139.1943.28
Minor part-time 166656.72100
Region
Gyeonggi-do993.373.37
Gangwon-do2468.3811.75
Chungcheongbuk-do1625.5217.26
Chungcheongnam-do31510.7327.99
Jeollabuk-do30610.4238.41
Jeollanam-do63321.5559.96
Gyeongsangbuk-do65422.2782.23
Gyeongsangnam-do52217.77100
Total2937100
Table 6. Results of the analysis of variance (ANOVA) and multivariate analysis of variance (MANOVA) for categorical variables.
DependentIndependent (Categorical)dfFP
FHIHousehold head’s gender115.970.00
Business Type713.090.00
Forestry business portfolio23.840.02
Region79.750.00
FIHousehold head’s gender14.970.03
Business Type713.700.00
Forestry business portfolio240.490.00
Region76.950.00
NFIHousehold head’s gender127.060.00
Business Type77.030.00
Forestry business portfolio297.880.00
Region74.760.00
TIHousehold head’s gender10.010.93
Business Type711.610.00
Forestry business portfolio25.490.00
Region713.610.00
Independent (categorical)Wilks’ λ dfFP
Gender of household head0.9918.450.00
Business type0.9278.490.00
Forestry business portfolio0.90236.460.00
Region0.9476.800.00
Table 7. Pearson-correlations for continuous variables (N = 2937).
Variables123456
1FHI1
2FI0.85 *1
3NFI0.48 *0.011
4TI0.13 *−0.01−0.021
5Forest land size a0.04 *0.04 *−0.010.021
6Cultivated land size a0.01 *0.11 *0.01−0.030.54 *1
7Household size b0.12 *0.07 *0.17 *−0.12 *0.020.06 *
8Household head’s education c0.04 *−0.020.12 *−0.000.08 *0.09 *
9Household head’s age c−0.12 *−0.04 *−0.27 *0.29 *0.00−0.09 *
10Labor capacity d0.22 *0.27 *−0.02−0.000.07 *0.20 *
11Fixed capital e0.04 *0.030.03−0.010.10 *0.11 *
12Savings e0.14 *0.05 *0.18 *0.06 *0.030.04 *
13Loan e0.05 *0.030.07 *−0.030.05 *0.13 *
Variables789101112
7Household size b1
8Household head’s education c0.11 *1
9Household head’s age c−0.45 *−0.23 *1
10Labor capacity d0.07 *0.02−0.10 *1
11Fixed capital e0.04 *0.08 *−0.07 *0.01 *1
12Savings e0.06 *0.04 *−0.06 *0.01 *0.05 *1
13Loan e0.18 *0.01 *−0.27 *0.19 *0.15 *0.01
Notes: * p < 0.05; a; ha, b: # of people, c: year, d: hour, e: mil. KRW.
Table 8. Results for the random-effect model.
VariablesFHIFINFITI
Forestry business portfolio—Reference group: Full-time
Major part-time−0.09−0.20 ***0.11 *0.12 **
(−1.86)(−4.30)(2.39)(2.61)
Minor part-time−0.07−0.25 ***0.22 ***0.15 **
(−1.42)(−5.10)(4.71)(3.15)
Business type—Reference group: Silviculture/Logging
Gathering0.02−0.010.08−0.02
(0.59)(−0.19)(2.44)(−0.72)
Chestnut tree0.000.000.020.06
(0.04)(0.04)(0.53)(1.48)
Astringent persimmon tree0.01−0.010.050.06
(0.32)(−0.37)(1.30)(1.47)
Nut tree0.07 *0.060.060.03
(1.97)(1.53)(1.72)(0.96)
Mushroom cultivation−0.03−0.030.01−0.01
(−0.99)(−0.97)(0.21)(−0.34)
Landscape material0.14 ***0.15 ***0.030.01
(3.75)(3.90)(0.82)(0.39)
Others−0.05−0.04−0.010.02
(−1.22)(−0.97)(−0.15)(0.43)
Region—Reference group: Gyeonggi-do
Gangwon-do0.12 *0.11 *0.040.01
(2.53)(2.24)(0.77)(0.30)
Chungcheongbuk-do0.16 ***0.12 **0.070.13 **
(3.77)(2.77)(1.65)(3.15)
Chungcheongnam-do0.100.09−0.020.05
(1.84)(1.65)(−0.31)(1.04)
Jeollabuk-do0.070.030.020.13 *
(1.40)(0.65)(0.38)(2.49)
Jeollanam-do0.15 *0.080.050.17 **
(2.29)(1.33)(0.78)(2.66)
Gyeongsangbuk-do0.090.06−0.010.08
(1.31)(0.98)(−0.08)(1.16)
Gyeongsangnam-do0.110.070.060.03
(1.78)(1.14)(1.05)(0.51)
Household head’s gender—Reference group: female
Male0.050.030.07 **−0.01
(1.79)(1.01)(2.60)(−0.51)
Forest land Size (ha)0.010.01−0.030.03
(0.27)(0.56)(−1.38)(1.01)
Cultivated land size (ha)0.05 *0.04 *0.02−0.01
(2.28)(2.08)(0.96)(−0.42)
Household size (# of people)0.030.030.020.02
(1.08)(1.14)(0.58)(0.69)
Household head’s education (year)−0.00−0.040.040.07 **
(−0.11)(−1.43)(1.43)(2.73)
Household head’s age (year)−0.08 **−0.02−0.22 ***0.31 ***
(−2.73)(−0.67)(−7.49)(10.30)
Labor capacity (hour)0.09 ***0.11 ***−0.020.04
(4.25)(5.26)(−0.97)(1.87)
Fixed capitals (mil. KRW)−0.01−0.01−0.000.03
(−0.21)(−0.59)(−0.19)(1.10)
Savings (mil. KRW)0.11 ***0.040.13 ***0.04 *
(5.43)(1.87)(6.61)(2.04)
Loan (mil. KRW)−0.01−0.020.010.02
(−0.60)(−1.03)(0.26)(0.93)
Breusch and Pagan LM862.15870.75984.22982.47
(Prob > chi2)0.000.000.000.00
Observations29372,3729372937
Degree of Freedom26262626
R20.130.120.160.14
ρ (rho)0.570.570.60.59
σ u 0.70.70.70.72
σ e 0.610.610.580.6
Notes: Standardized beta coefficients; t statistics in parentheses; * p < 0.05, ** p < 0.01, *** p < 0.001.

