Energy Evaluation of Deep-Lane Autonomous Vehicle Storage and Retrieval System
by
 , ,
, ,
Emanuele Guerrazzi
1,* ,
,
Valeria Mininno
2,
Davide Aloini
2,
Riccardo Dulmin
2,
Claudio Scarpelli
2 and
Marco Sabatini
3 1
Department of Information Engineering, University of Pisa, Via Girolamo Caruso 16, 56122 Pisa, Italy
2
Department of Energy, Systems, Territory, and Construction Engineering, University of Pisa, Largo Lucio Lazzarino 1, 56122 Pisa, Italy
3
Cassioli Group srl, Località Guardavalle 63, 53049 Torrita di Siena, Italy
*
Author to whom correspondence should be addressed.
Sustainability 2019, 11(14), 3817; https://doi.org/10.3390/su11143817
Submission received: 10 June 2019
/
Revised: 3 July 2019
/
Accepted: 10 July 2019
/
Published: 12 July 2019
(This article belongs to the Special Issue Product Innovation and Sustainability)
Abstract
:With the rise of a consciousness in warehousing sustainability, an increasing number of autonomous vehicle storage and retrieval systems (AVS/RS) is diffusing among automated warehouses. Moreover, manufacturers are offering the option of equipping machines with energy recovery systems. This study analyzed a deep-lane AVS/RS provided with an energy recovery system in order to make an energy evaluation for such a system. A simulator able to emulate the operation of the warehouse has been developed, including a travel-time and an energy model to consider the real operating characteristics of lifts, shuttles and satellites. Referring to a single command cycle with a basic storing and picking algorithm for multiple-depth channels, energy balance and recovery measurements have been presented and compared to those of a traditional crane-based system. Results show significant savings in energy consumption with the use of a deep-lane AVS/RS.
1. Introduction
In recent years, an increasing consciousness in sustainable warehousing and energy efficient operations in warehousing has come about, due to both the growing of green awareness and energy resource scarcity [1]. The interest shown by companies on issues related to sustainability in logistics is highlighted by the increasing number of works on lean and green logistics [2].
This trend has been especially verified with regards to Automated Storage and Retrieval Systems (AS/RS) [3,4], where energy saving, both in terms of energy efficiency and reduction of carbon dioxide emissions, has become one of the most significant performances to be achieved within a sustainable perspective [5].
Indeed, recent studies show that the traditional time-based perspective has been overcome by the importance of sustainable and energy efficient operations in material handling processes [6].
This trend is confirmed by results of the 2019 Material Handling Institute (MHI) survey on sustainability in warehousing, distribution and manufacturing [7], which have highlighted the importance given by management to implement sustainablility programs in the supply chain.
In order to meet the need for energy efficiency, many contributions have been developed offering approaches towards more sustainable warehousing, for instance, related to energy efficient material-handling equipment and energy recovery systems [8].
Regarding material-handling equipment, autonomous warehousing is increasingly moving beyond traditional crane-based AS/RS technologies (CBAS/RS) to Autonomous Vehicle Storage and Retrieval Systems AVS/RS technologies. This is because AVS/RS has a substantial flexibility with respect to throughput capacity in the transfer of Unit Loads (ULs) with high density storage. Moreover, AVS/RS are based on the use of light vehicles that provide less energy consumption than stacker cranes [9]. In this technology, throughput capacity can be modified by changing the number of Automatic Vehicles (AVs) in the system, and lifts are used to provide the vertical movement for transactions between AVs and the Storage Rack (SR). Other subsets of AVS/RS have been developed, such as the Shuttle-Based Storage and Retrieval System (SBS/RS), with the aim of providing more flexibility and less energy consumption, but they are often limited in weight load and they do not have high-density storage.
Each vehicle used in an AVS/RS typically moves repetitively along a fixed path, with a motion that is characterized by repetitive acceleration, constant and deceleration steps. For example, the lift that moves along the vertical rails initially accelerates to its steady-state speed (or minor speed if the distance is short enough) and then decelerates before reaching the final position. During descending or deceleration phases, energy is typically converted into waste heat, but now some manufacturers are offering the option of equipping AS/RS machines with energy-recovery modules so that energy otherwise dissipated can be regenerated into the power supply system. This is achieved through an electro-mechanical regenerative braking system (RBS) that converts kinetics energy into electricity by using the driving motor in reverse and operating it as a generator during deceleration [10].
Regarding energy recovery systems, in the last decade, the developments in this field have encouraged researchers and practicioners to deepen studies in driving applications [11]. As an example, in AVS/RS and SBS/RS energy can be recovered both from braking the lifting table and from that of the shuttle carrier [12]. Therefore, there is a need for further research that can provide a practical study.
Accordingly, our aim is to provide an energy evaluation based on real-case data for the deep-lane variant of AVS/RS, where racks have multiple-depth channels travelled by a satellite and energy can be recovered from the braking phase of the lift. In order to do that, a simulator has been devoloped to emulate a real-case application, showing energy consumption and recovery and comparing the same metrics with a traditional crane-based AS/RS.
This work represents the output of an applied research project named “MAG-IA” (Intelligent and flexible warehouse management systems for Industry 4.0), which aims to produce innovation in the field of automation that leads to greater sustainability in terms of energy impact in processes involving internal warehouse logistics. This project has been co-funded under Tuscany to foster the collaboration between universities and industries, according to an open innovation philosophy [13] in order to improve the quality of innovation output [14], the financial and R&D business performances [15] and moreover, to improve the firm attitude towards Industry 4.0.
The paper is structured as follows: the next section presents the literature review, focusing on energy evaluation and energy recovery of AVS/RS. In Section 3 there is the problem setting and the methodology used for of this work, while Section 4 presents the modeling of the whole system, including the energy consumption and recovery models. Then in Section 5 our case-study is presented and results are shown. In Section 6 there is the discussion while conclusions and future research are presented in Section 7.
2. Literature Review
The study on sustainability in warehouse logistics involves different research fields, such as transportation planning, warehouse management and material handling.
Our literature review focuses on a particular automatic material handling system used inside a warehouse, that is the AVS/RS. This system was first introduced into European facilities in the late 1990s. Despite its increasing diffusion in companies, there are no standards available to provide performance evaluation criteria.
The first studies on performance evaluation of AVS/RS have been conducted by Malmborg [16,17]. With reference to a “tier to tier” configuration, in which shuttles can access any aisle in any tier, models were proposed to estimate vehicle utilization and cycle time, and also predicting the proportion of dual command (DC) cycles compared to the single command (SC) cycles. Since those works, many studies have been conducted to estimate time evaluation of AVS/RS, mainly based on analytical models and/or queue theory. Relevant examples are given by Kuo et al., Fukunari and Malmborg [18,19,20] for “tier to tier” configurations and by Marchet et al. and Heragu et al. [21,22] for the “tier captive”, which includes a dedicated shuttle for each tier. Recently, simulation-based approaches have been taken into account for the same purpose, such as in the works of Ekren et al. [23,24] and in the work of Ekren and Heragu [25], where the simulation has been used to conduct a regression analysis to explore the relationship between performance and input factors, such as the number of aisles and of tiers. Simulation is also used by Xia et al. [26] to study how order density and shelf structure (i.e., the number of rows and columns of storage shelves) affect time performances of an AVS/RS.
The deep-lane AVS/RS has been studied by D’Antonio et al. and Manzini et al. [9,27], where travel-times and travel-distances of lift, shuttle and satellite have been proposed and tested through analytical models and simulation for different layouts and storage criteria.
Analogous techniques have been exploited to evaluate energy consumption and recovery in AS/RS, for example in the works of Meneghetti and Monti [28,29], but much fewer articles can be found in the current literature with regards to AVS/RS.
This evidence is confirmed by a recent review about green warehousing provided by Bartolini et al. [30], whose topics include energy consumption studies of AS/RS but with just one paper referring to AVS/RS (Tappia et al. [8]).
The first proposal of a methodology that allows the evaluation of energy consumption of AVS/RS is given by Bruno et al. [31], that designed a discrete event simulation of a AVS/RS.
In the study of Borovinšek et al. [32], a genetic algorithm has been used to provide the Pareto front to choose a tradeoff between minimization of time and energy in a SBS/RS.
Ekren et al. [33] propose an analytical model-based tool that can estimate the mean and the variance of travel time of lifts and shuttles, as well the mean amount of energy consumption and energy regeneration per transaction. This is achieved through probabilistic assumptions. Results are presented for different configurations of the system.
Akpunar et al. conducted [34] a study on energy efficient design, studying several design inputs such as number of tiers, aisles, AVs as decision variables. After calculating travel times and energy consumptions for AVs and lifts, the decision variables are combined in 81 different ways and results are obtained through simulation.
In summary, as highlighted in Table 1, since the early 2000s, several studies have been performed on AVS/RS, but none of the examined works studied energy evaluation for the deep-lane AVS/RS. This work proposes to provide an energy evaluation for this variant of AVS/RS by modeling and simulating such a warehouse, giving insights about energy consumption and recovery.
3. Problem Setting and Methodology
3.1. Problem Setting
AS/RSs are used to store, move and retrieve ULs automatically in a fixed zone of the warehouse that is the SR. The basic components of AS/RSs are racks, machines, aisles, input/output points.
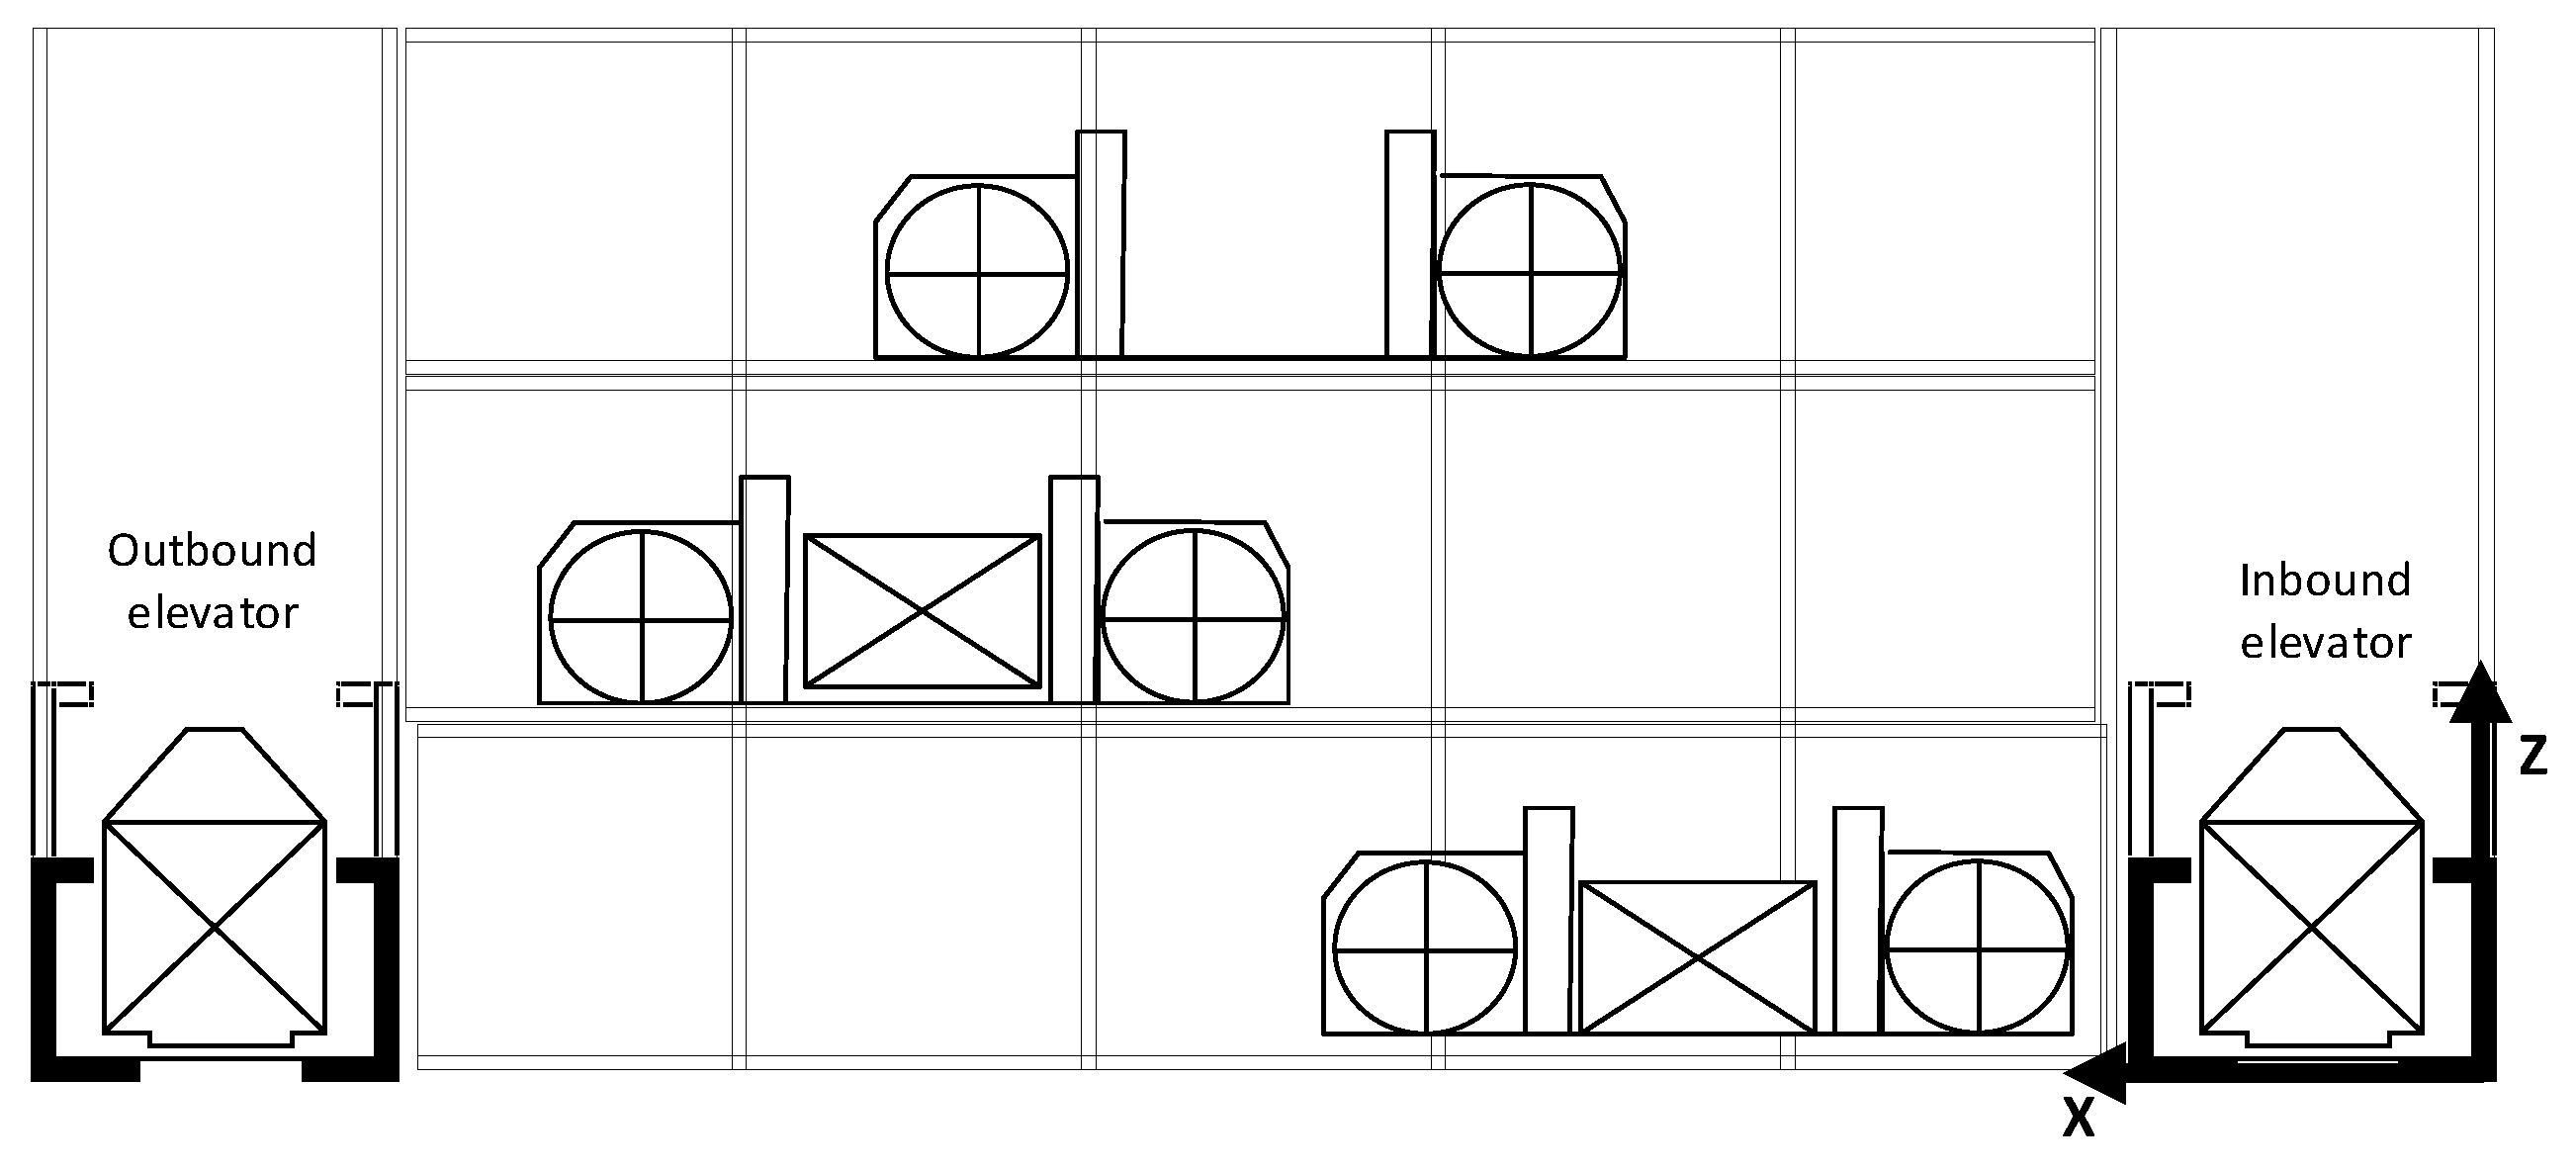
In the deep-lane AVS/RS the rack system is given by a certain number of tiers, each of which has a fixed number of channels. Each channel is deep enough to make it possible to store more than one UL inside it. The handling of ULs is provided by three kinds of autonomous vehicles: lift, shuttle and satellite. Thanks to an RBS, it is possible to recover energy from each lift. A more detailed description of the SR and the vehicles used is given in Section 4.1.
3.2. Methodology
The purpose of this work is to quantify the energy consumption and the energy recovery of such a system in order to evaluate the sustainability of this kind of warehouse. For such a purpose, analytical models are not considered reliable to fully describe the complexity dealt by an AVS/RS. Hence, an approach based on simulation techniques is preferable.
We followed methodology similar to that described by Bruno et al. [31]. Such a methodology consists of the AVS/RS system analysis, which provides a conceptual modeling as described in Section 4, followed by the implementation and the execution of the simulation, using a case study to get the simulation parameters. In this way, we modeled the system (warehouse, activities, time, energy consumption and recovery) in an appropriate simulation environment, such as MATLAB®, in order to get realistic values for energy evaluation.
4. Modeling
4.1. Warehouse Modeling
The deep-lane AVS/RS consists of a SR and of the three different kinds of autonomous vehicles that separate the movements along the vertical, longitudinal and transverse directions.
The SR is organized as follows:
- tiers;
- channels for each tier ( channels for each side, 2 sides for each tier);
- cells for each channel.
Each channel is accessible from only one side, according to Last-In-First-Out (LIFO) logic, so that it must contain only Unit Load (UL) of the same type. Hence, the number of different ULs is given by the product ; the overall capacity of the rack is equal to .
The kinds of autonomous vehicles used are:
- The lift, which is in charge of the vertical movement;
- The shuttle, that moves along the central aisle;
- The satellite, which is the storage/retrieval machine able to move through the channel.
There are 2 lifts placed on the opposite sides of the rack (inbound and outbound zones), 1 shuttle for each tier and 1 satellite for each shuttle. One lift is used for the storage of ULs, while the other one is used for the retrieval of Uls. Each lift is equipped with an RBS to recover energy during its braking phase. The configuration of the shuttle is ‘tier-captive’ while the satellite’s one is ‘channel-captive’, in the meaning that the shuttle can only move across the central aisle (i.e., at the same tier), while the satellite can only move inside the channel. In this configuration, the satellite is always attached to the shuttle and detaches from it only when it goes through the channel.
4.2. Activity Modeling
The sequence of operations adopted to store a UL has been modeled as follows:
- 1.s
- Inbound lift goes up to the selected tier;
- 2.s
- Shuttle reaches the lift at the inbound zone;
- 3.s
- Shuttle accommodates the UL;
- 4.s
- Inbound lift goes down to the floor;
- 5.s
- Shuttle reaches the correct channel;
- 6.s
- Satellite detaches from shuttle;
- 7.s
- Satellite reaches the correct cell in the channel;
- 8.s
- Satellite releases the UL;
- 9.s
- Satellite comes back to the shuttle;
- 10.s
- Shuttle accommodates the satellite;
The sequence of operations adopted to retrieve a UL has been modeled as follows:
- 1.p
- Shuttle reaches the correct channel;
- 2.p
- Satellite detaches from shuttle;
- 3.p
- Satellite reaches the correct cell in the channel;
- 4.p
- Satellite lifts the UL;
- 5.p
- Satellite comes back to the shuttle;
- 6.p
- Shuttle accommodates the satellite;
- 7.p
- Shuttle reaches the lift at the outbound zone;
- 8.p
- Outbound lift goes up to the correct tier;
- 9.p
- Outbound lift accommodates the UL;
- 10.p
- Outbound lift goes down to the floor;
Each of these activities has been modeled considering its time and energy consumption, taking into account the single-command and no concurrent usage of the shuttles.
4.3. Time Modeling
Let us denote by and the set of activities considered for computing cycle times respectively for storing and picking:
- as regards storing;
- as regards picking.
This assumption has been done in order to make a fair evaluation. Indeed, a lift is often a bottleneck and is not always sold together with the other components of the deep-lane AVS/RS.
Certain activities have a fixed time for their execution. We call this fixed time, that is the same for all these activities, as , and we group the activities respectively in and sets:
- as regards storing;
- as regards picking.
All the remaining activities have a variable time that depends on the distance covered by the mobile component, accordingly to the description provided in Section 3.1. A mobile component, that we call machine, can be the lift, the shuttle or the satellite.
The cinematic profile of each machine of the warehouse has been modeled considering a uniformly accelerated motion with a maximumalue for the velocity that can be reached, resulting in a trapezium velocity profile when this value is reached or in a triangle velocity one if the maximum value is not reached, as shown in Figure 3. This profile is very common and known in literature for AVS/RS vehicles.
The travel time required by any machine carrying a weight for covering a distance along the i-axis with is:
where is the distance covered by the machine before reaching its maximum speed. In our case can be if no UL is carried or 1 if a UL is carried.
In this way the cycle time for storing can be computed as:
and analogously for cycle time for picking.
4.4. Energy Consumption Modeling
The time modeling of the previous subsection can be used to model energy consumed by using also the machine power.
We use the travel time required by any machine carrying a weight for covering a distance along the i-axis modeling in order to compute the energy consumed by the machine to accomplish the same mission. The computation of energy consumed is well-known in literature and its formula is:
where:
- is the set of motion stages of machine for covering . If then contains acceleration and decelerations stages, else if then contains also the constant stage;
- is the power needed in stage k by machine i carrying weight j;
- is the duration of stage k by machine i carrying weight j, so that .
These formulas are implemented in the simulator for all activities in and in . It is important to denote that for activity 4.s and 10.p the energy consumed is equal to zero.
Each activity of and requires a fixed amount of energy equals to as these activities are not variable.
Hence, the energy needed for storing a UL can be computed as:
and analogously for energy needed for picking.
4.5. Energy Recovery Modeling
Regarding the energy recovery, this is basically a fraction of the gravitational potential energy, that is possible to be exploited during activities 4.s and 10.p thanks to the energy recovery system.
The analytical expression for energy recovery in the storage phase , also applicable in other AS/RS application where there is a energy regeneration of the potential energy [35], is:
and the one for the picking phase is:
where:
- is the overall efficiency of the electrical system;
- is the weight of the lift;
- is the weight of the UL;
- is the gravity acceleration;
- is the distance covered by the lift;
Finally, the analytical expression for energy balance for a storage activity is:
and analogously for energy balance for a picking activity:
All the components of the systems and all the activities presented in this section have been modeled through the computational software MATLAB®.
We also denote that for this work two basic algorithms for storing and retrieving ULs have been used. The working principle for storing is simply to prefer to store a non-full channel containing ULs of the same type or to store in a completely empty channel, while the one for retrieving is to prefer to pick from the fullest channel containing the same UL.
5. Case Study and Results
5.1. Case Study
In the previous section the expressions for time, energy consumption and energy recovery evaluation have been presented. Those expressions are necessary for setting up a realistic simulator and to evaluate its energy sustainability. In this case-study we present a real-case application of a deep-lane AVS/RS developed by Cassioli Group (www.cassioli.it). Its characteristics are the same as presented in Section 3. Basically, the warehouse occupies a volume of about 8000 m3 with a height of 10 m divided in 5 tiers. Each tier has 21 channels on the left and the same on the right, with 13 cells for each channel. In such a system, it is possible to stock 2730 ULs in total, of a maximum of 210 different types. In this scenario the warehouse starts saturated at its 40% on average with 600 ULs to be stored and 600 ULs to be retrieved. Both initial saturation and ULs orders (quantity and variety) change their value at each run of the simulation following a normal distribution with the above-mentioned mean values and standard deviation equal to 10% of the mean value. The installed power of this system is 44.6 kW, computed considering the sum of the 2 lifts and of the 6 shuttles, as such vehicles can move simultaneously. Each satellite is charged when attached to its shuttle, so it is not involved in the calculation of the installed power.
A run of the simulation consists of storing all the ULs that are required to be stored and then to pick all the ULs that are required to be moved to the outbound lift. Each run covers every activity presented in Section 4.2. and takes into account the related energy consumption and recovery. Typically, each run covers 15/16 h in which the AVS/RS is active.
All the simulation data have been discussed and set up with the company. Data are presented in Appendix A.
5.2. Results
The case-study described in Section 5.1 has been coded in MATLAB® and run 100 times in a standard scenario. These tests have been done on a PC with 4 Intel Core i5 CPUs at 2.30 GHz, 4 GB of RAM and Windows 10 OS. Computational time for such a configuration takes about 7/8 min.
For each run of the simulation, energy consumption and energy recovery performances have been computed in order to evaluate energy sustainability of the system.
5.2.1. Energy Consumption Performance
Table 2 resumes energy consumption performance, providing basic statistical values for each of the following metrics:
Total energy consumed (kJ): the overall energy consumed to store and pick all the required ULs;
- -
- Energy consumed for storing (kJ): the energy consumed to store all the required ULs;
- -
- Energy consumed for picking (kJ): the energy consumed to pick all the required ULs;
- -
- Energy consumed by lifts (kJ): the total energy consumed by the lifts;
- -
- Energy consumed by shuttles (kJ): the total energy consumed by the shuttles;
- -
- Energy consumed by satellites (kJ): the total energy consumed by the satellites;
- -
- Hourly energy consumed (kJ/h): the overall energy consumed per hour;
- -
- Energy consumed per UL (kJ/UL): the average energy consumed to move (store or pick) a UL;
- -
- Energy consumed for storing a UL (kJ/UL): the average energy consumed to store a UL;
- -
- Energy consumed for picking a UL (kJ/UL): the average energy consumed to pick a UL;
5.2.2. Energy Recovery Performance
The energy recovery is achieved through an RBS installed in each of the two lifts.
Table 3 resumes the energy recovery performance, providing basic statistical values for each of the following metrics:
- -
- Total energy recovered (kJ): the overall energy recovered from storing and picking all the required ULs;
- -
- Energy recovered from storing (kJ): the energy recovered from storing all the required ULs;
- -
- Energy recovered from picking (kJ): the energy consumed from picking all the required ULs;
- -
- Hourly energy recovered (kJ/h): the overall energy recovered per hour;
- -
- Energy recovered per UL (kJ/UL): the average energy recovered from a lift moving a UL;
- -
- Energy recovered from storing a UL (kJ/UL): the average energy recovered from storing a UL;
- -
- Energy recovered from picking a UL (kJ/UL): the average energy recovered from picking a UL;
6. Discussion
Following the assumptions done in Section 5.1, an energy evaluation of a deep-lane AVS/RS has been conducted. Results show a high stability of the metrics values, with a standard deviation that is less than the 5% of the mean value for all the metrics with the exception of “Energy recovered from storing”, for which the standard deviation represents the 7.6 % of the average value.
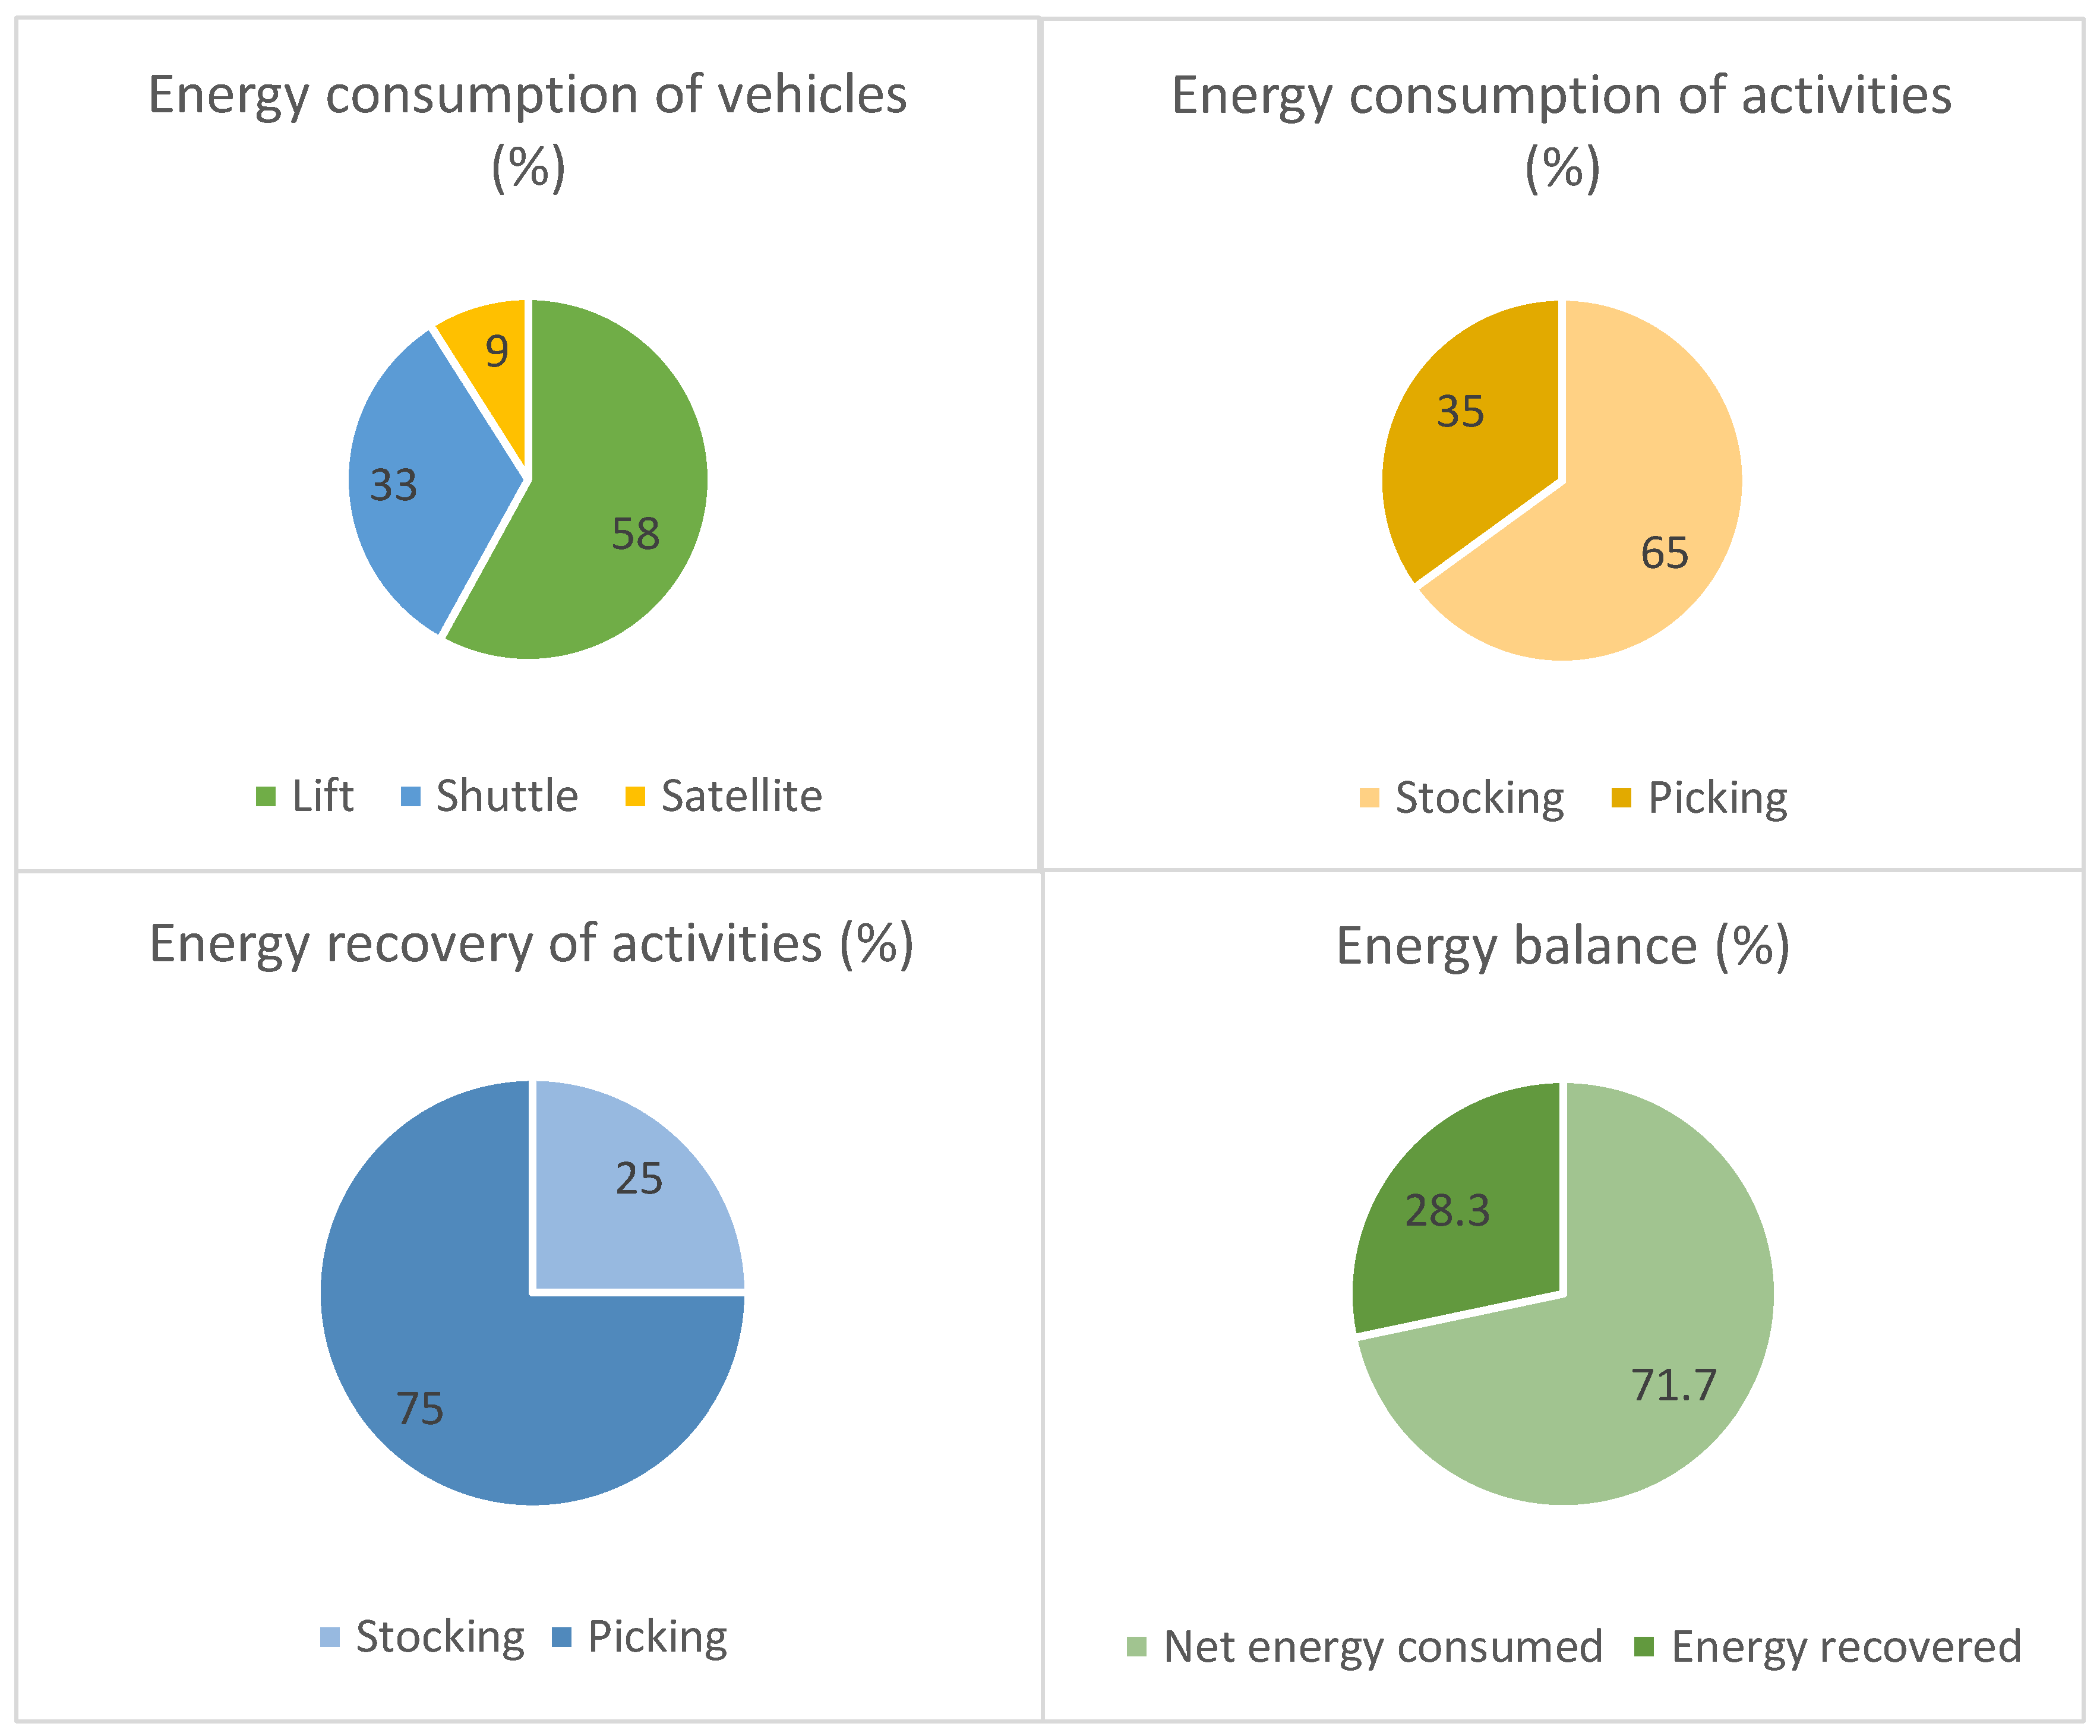
With regards to energy consumption, the lifts cover the 58% of the total energy expense, the shuttles cover the 33% and the satellites the remaining 9%. This is reasonable considering the differences among the powers of the machines, as reported in Appendix A. The stocking phase covers the 65% of the total energy consumption, while the picking process is the residual 35%. This may be due to the different absorbed power of the inbound lift compared to the outbound lift: the first does the ascending phase with a UL and the descending phase without any load, the latter does the vice-versa.
On the other hand, the energy recovery is due to the picking for 75%, while the stocking allows for recovering the 25% of all energy regeneration. This fact can also be explained by the different load state of the two lifts.
Moreover, it is possible to see that in such a configuration, an average of 28.3% of energy expense can be recovered, that can be seen as a measure of energy sustainability of the system. This has been evaluated through the ratio of total energy recovered to total energy consumed.
A summary of all these quantitative considerations is provided by Figure 4.
Finally, it is possible to make an approximate comparison between the total energy consumed of the deep-lane AVS/RS and the one of a CBAS/RS, whose average electrical power has been provided by the Cassioli Group. For this system, the installed power is 55.5 kW, that is the sum of the power required for the lifting phase and the one required for the translation phase. Considering the same horizontal time that has been used for the simulation and an average power of a CBAS/RS of 10 kW, the total energy consumed using the traditional AS/RS is about 155 kJ. This energy can be compared to the 63 kJ of deep-lane AVS/RS, obtained as the difference between the total energy consumed and the total energy recovered. In this way it is possible to see that the use of a deep-lane AVS/RS instead of a traditional CBAS/RS can provide a saving of about 60% of energy consumption.
7. Conclusions and Future Works
The findings of this work contribute to the field of warehouse sustainability by providing an energy evaluation of a deep-lane AVS/RS equipped with an energy recovery system that exploits the breaking phase of both the lifts. In order to achieve the objective of evaluating the energy consumption and recovery of such a system, an appropriate simulator has been constructed and validated on a real-case study. In particular, this research shows that about 28% of the energy consumption can be recovered with a deep-lane AVS/RS, and that such a system roughly represents 40% of the energy consumption of a traditional CBAS/RS.
The results of this work also have some managerial and practical implications. First, the simulator can be used as a framework to evaluate the impact of different storage and retrieval algorithms on energy consumption and recovery, so it can be useful for both designers and marketing operators to provide a potential customer with quantitative measures for energy consumption and recovery of the deep-lane AVS/RS. Moreover, it can be used as an easy and flexible tool to briefly estimate energy consumption and energy recovery of other deep-lane AVS/RSs or of an already existing system in different scenarios.
Future works can exploit this study to make an energy evaluation that considers the concurrent usage of shuttles with an additional RBS for the shuttle. Moreover, this study can be extended by also considering dual-command cycles. Finally, we suggest the use of a sensibility analyses to provide a more detailed insight on performance evaluation of AVS/RS.
Author Contributions
Conceptualization, e.g., V.M., D.A. and R.D.; methodology, E.G., V.M., D.A. and R.D. software, E.G. validation, E.G., V.M., D.A., R.D., C.S. and M.S.; data curation, E.G., C.S., M.S. Writing—Original draft preparation, E.G.; writing—review and editing, V.M., D.A. and R.D.; supervision, V.M., D.A. and R.D.; project administration, V.M., M.S.; funding acquisition, V.M., M.S.
Funding
This work is part of the “MAG-IA” (Intelligent and flexible warehouse management systems for Industry 4.0) project co-financed under Tuscany POR FESR 2014-2020 (CUP 7165.24052017.112000040).
Acknowledgments
The authors would like to thank sincerely the anonymous reviewers for their valuable and detailed comments that significantly contribute to improve the value of the paper.
Conflicts of Interest
The authors declare no conflict of interest.
Appendix A. Input Data of Simulation

Table A1.
Geometrical Data.
| Symbol | Description | Value | Unit of Measure |
|---|---|---|---|
| Z | Number of zones | 2 | - |
| Number of tiers | 5 | - | |
| Number of channels | 21 | - | |
| Number of cells for each channel | 13 | - | |
| Capacity of the warehouse | 2730 | cells | |
| Capacity of different SKUs | 210 | - | |
| Height of each tier | 1.65 | m | |
| Length of warehouse among x-axis | 30 | m | |
| Length of warehouse among y-axis | 27 | m | |
| W | Width of each channel | 30/21 = 1.42 | m |
| D | Depth of each cell | (27/2)/13 = 1.03 | m |
Table A2.
Cinematic data.
| Symbol | Description | Value | Unit of Measure |
|---|---|---|---|
| Steady-state speed of shuttle with load | 2 | m/s | |
| Steady-state speed of shuttle without load | 3 | m/s | |
| Acceleration of shuttle with load | 0.4 | m/s2 | |
| Acceleration of shuttle without load | 0.8 | m/s2 | |
| Steady-state speed of satellite with load | 0.67 | m/s | |
| Steady-state speed of satellite without load | 1.33 | m/s | |
| Acceleration of satellite with load | 0.4 | m/s2 | |
| Acceleration of satellite without load | 0.8 | m/s2 | |
| Steady-state speed of lift with load | 1.33 | m/s | |
| Steady-state speed of lift without load | 1.33 | m/s | |
| Acceleration of lift with load | 1 | m/s2 | |
| Acceleration of lift without load | 1 | m/s2 |
Table A3.
Other movement data.
| Symbol | Description | Value | Unit of Measure |
|---|---|---|---|
| Accommodation time for satellite | 2 | s | |
| Detachment time for satellite | 2 | s | |
| Accommodation time for UL | 2 | s | |
| Detachment time for UL | 2 | s |
Table A4.
Energy consumption data.
| Symbol | Description | Value | Unit of Measure |
|---|---|---|---|
| Power of lift during acceleration phase with load | 20 | kW | |
| Power of lift during acceleration phase without load | 5 | kW | |
| Power of lift at steady-state with load | 32 | kW | |
| Power of lift at steady-state without load | 10 | kW | |
| Power of lift during deceleration phase with load | 20 | kW | |
| Power of lift during deceleration phase without load | 5 | kW | |
| Power of shuttle during acceleration phase with load | 2.5 | kW | |
| Power of shuttle during acceleration phase without load | 0.8 | kW | |
| Power of shuttle at steady-state phase with load | 0.9 | kW | |
| Power of shuttle at steady-state phase without load | 0.3 | kW | |
| Power of satellite during acceleration phase with load | 0.3 | kW | |
| Power of satellite during acceleration phase without load | 0.2 | kW | |
| Power of satellite at steady-state with load | 0.6 | kW | |
| Power of satellite at steady-state without load | 0.2 | kW |
Table A5.
Energy recovery data.
| Symbol | Description | Value | Unit of Measure |
|---|---|---|---|
| Lift mass | 750 | kg | |
| Massa del pallet | 1200 | kg | |
| Energy recovery yield | 60 | % |
Table A6.
Pallet and scenario data.
| Symbol | Description | Value | Unit of Measure |
|---|---|---|---|
| Initial saturation percentage of warehouse | 40 | % | |
| Average inbound order | 600 | UL | |
| Average outbound order | 600 | UL | |
| Different number of ULs type | 20 | - | |
| Standard deviation of order (defined on the average) | 10 | % | |
| Length of each UL | 1.2 | [m] |
References
- Meneghetti, A.; Monti, L. How energy recovery can reshape storage assignment in automated warehouses. IFIP Adv. Inf. Commun. Technol. 2013, 397, 33–40. [Google Scholar]
- Pejić, V.; Lerher, T.; Jereb, B.; Lisec, A. Lean and Green Paradigms in Logistics: Review of Published Research. PROMET Traffic Transp. 2016, 28, 593–603. [Google Scholar] [Green Version]
- Hua, G.; Cheng, T.C.E.; Wang, S. Managing carbon footprints in inventory management. Int. J. Prod. Econ. 2011, 132, 178–185. [Google Scholar] [CrossRef]
- Meneghetti, A.; Borgo, E.D.; Monti, L. Decision support optimisation models for design of sustainable automated warehouses. Int. J. Shipp. Transp. Logist. 2015, 7, 266–294. [Google Scholar] [CrossRef]
- Schirone, L.; Pellitteri, F. Energy Policies and Sustainable Management of Energy Sources. Sustainability 2017, 9, 2321. [Google Scholar] [CrossRef]
- Garetti, M.; Taisch, M. Sustainable manufacturing: Trends and research challenges. Prod. Plan. Control 2012, 23, 83–104. [Google Scholar] [CrossRef]
- MHI. 2019 MHI Annual Industry Report. Available online: https://www.mhi.org/publications/report (accessed on 15 May 2019).
- Tappia, E.; Marchet, G.; Melacini, M.; Perotti, S. Incorporating the environmental dimension in the assessment of automated warehouses. Prod. Plan. Control 2015, 26, 824–838. [Google Scholar] [CrossRef]
- D’Antonio, G.; De Maddis, M.; Bedolla, J.S.; Chiabert, P.; Lombardi, F. Analytical models for the evaluation of deep-lane autonomous vehicle storage and retrieval system performance. Int. J. Adv. Manuf. Technol. 2018, 94, 1811–1824. [Google Scholar] [CrossRef]
- Wager, G.; Whale, J.; Braunl, T. Performance evaluation of regenerative braking systems. Proc. Inst. Mech. Eng. Part D J. Automob. Eng. 2017, 232, 1414–1427. [Google Scholar] [CrossRef]
- Attaianese, C.; Nardi, V.; Tomasso, G. High performances supercapacitor recovery system for industrial drive applications. In Proceedings of the Conference Proceedings—IEEE Applied Power Electronics Conference and Exposition—APEC, Anaheim, CA, USA, 22–26 February 2004; Volume 3, pp. 1635–1641. [Google Scholar]
- Lerher, T. Modern automation in warehousing by using the shuttle based technology. In Automation Systems of the 21st Century: New Technologies, Applications and Impacts on the Environment & Industrial Processes; Nova Publishers: New York, NY, USA, 2013; pp. 51–86. [Google Scholar]
- Chesbrough, H. Open Innovation: The New Imperative for Creating and Profiting From Technology; Harvard Business School Press: Boston, MA, USA, 2003. [Google Scholar]
- Cammarano, A.; Michelino, F.; Lamberti, E.; Caputo, M. Accumulated stock of knowledge and current search practices: The impact on patent quality. Technol. Forecast. Soc. Change 2017, 120, 204–222. [Google Scholar] [CrossRef]
- Michelino, F.; Lamberti, E.; Cammarano, A.; Caputo, M. Open Innovation in the Pharmaceutical Industry: An Empirical Analysis on Context Features, Internal R&D, and Financial Performances. IEEE Trans. Eng. Manag. 2015, 62, 421–435. [Google Scholar]
- Malmborg, C.J. Conceptualizing tools for autonomous vehicle storage and retrieval systems. Int. J. Prod. Res. 2002, 40, 1807–1822. [Google Scholar] [CrossRef]
- Malmborg, C.J. Interleaving dynamics in autonomous vehicle storage and retrieval systems. Int. J. Prod. Res. 2003, 41, 1057–1069. [Google Scholar] [CrossRef]
- Kuo, P.H.; Krishnamurthy, A.; Malmborg, C.J. Design models for unit load storage and retrieval systems using autonomous vehicle technology and resource conserving storage and dwell point policies. Appl. Math. Model. 2007, 31, 2332–2346. [Google Scholar] [CrossRef]
- Kuo, P.H.; Krishnamurthy, A.; Malmborg, C.J. Performance modelling of autonomous vehicle storage and retrieval systems using class-based storage policies. Int. J. Comput. Appl. Technol. 2008, 31, 238–248. [Google Scholar] [CrossRef]
- Fukunari, M.; Malmborg, C.J. An efficient cycle time model for autonomous vehicle storage and retrieval systems. Int. J. Prod. Res. 2008, 46, 3167–3184. [Google Scholar] [CrossRef]
- Marchet, G.; Melacini, M.; Perotti, S.; Tappia, E. Analytical model to estimate performances of autonomous vehicle storage and retrieval systems for product totes. Int. J. Prod. Res. 2012, 50, 7134–7148. [Google Scholar] [CrossRef]
- Heragu, S.S.; Cai, X.; Krishnamurthy, A.; Malmborg, C.J. Analytical models for analysis of automated warehouse material handling systems. Int. J. Prod. Res. 2011, 49, 6833–6861. [Google Scholar] [CrossRef]
- Ekren, B.Y. Performance evaluation of AVS/RS under various design scenarios: A case study. Int. J. Adv. Manuf. Technol. 2011, 55, 1253–1261. [Google Scholar] [CrossRef]
- Ekren, B.Y.; Heragu, S.S.; Krishnamurthy, A.; Malmborg, C.J. Simulation based experimental design to identify factors affecting performance of AVS/RS. Comput. Ind. Eng. 2010, 58, 175–185. [Google Scholar] [CrossRef]
- Ekren, B.Y.; Heragu, S.S. Simulation-based regression analysis for the rack configuration of an autonomous vehicle storage and retrieval system. Int. J. Prod. Res. 2010, 48, 6257–6274. [Google Scholar] [CrossRef]
- Xia, Z.; Yaohua, W.; Delong, X.; Yunxia, C. Dynamic Modelling of an Automated Vehicle Storage and Retrieval System and a Simulation Analysis of its Efficiency. Int. J. Eng. Model. 2019, 31, 29–42. [Google Scholar]
- Manzini, R.; Accorsi, R.; Baruffaldi, G.; Cennerazzo, T.; Gamberi, M. Travel time models for deep-lane unit-load autonomous vehicle storage and retrieval system (AVS/RS). Int. J. Prod. Res. 2016, 54, 4286–4304. [Google Scholar] [CrossRef]
- Meneghetti, A.; Monti, L. Energy Efficient Dual Command Cycles in Automated Storage and Retrieval Systems. In Proceedings of the World Renewable Energy Congress, Linköping, Sweden, 8–13 May 2011; Volume 57, pp. 1668–1675. [Google Scholar]
- Meneghetti, A.; Monti, L. Sustainable storage assignment and dwell-point policies for automated storage and retrieval systems. Prod. Plan. Control 2013, 24, 511–520. [Google Scholar] [CrossRef]
- Bartolini, M.; Bottani, E.; Grosse, E.H. Green warehousing: Systematic literature review and bibliometric analysis. J. Clean. Prod. 2019, 226, 242–258. [Google Scholar] [CrossRef]
- Bruno, G.; Antonio, G.D.; Maddis, M.D.E. Sustainability Analysis of Autonomous Vehicle Storage and Retrieval Systems 2 Related Works; WSEAS Transactions on Environment and Development: Torino, Italy, 2016; Volume 12, pp. 299–306. [Google Scholar]
- Borovinšek, M.; Ekren, B.Y.; Burinskienė, A.; Lerher, T. Multi-Objective Optimisation Model of Shuttle-Based Storage and Retrieval System. Transport 2016, 32, 120–137. [Google Scholar] [CrossRef]
- Ekren, B.Y.; Akpunar, A.; Sari, Z.; Lerher, T. A tool for time, variance and energy related performance estimations in a shuttle-based storage and retrieval system. Appl. Math. Model. 2018, 63, 109–127. [Google Scholar] [CrossRef]
- Akpunar, A.; Yetkin Ekren, B.; Lerher, T. Energy efficient design of autonomous vehicle based storage and retrieval system. J. Appl. Eng. Sci. 2017, 15, 25–34. [Google Scholar] [CrossRef] [Green Version]
- Jerman, B.; Zrnić, N.; Jenko, M.; Lerher, T. Energy regeneration in automated high bay warehouse with stacker cranes. Teh. Vjesn. Tech. Gaz. 2017, 24, 1411–1416. [Google Scholar]
Figure 1.
Front view of deep-lane AVS/RS.

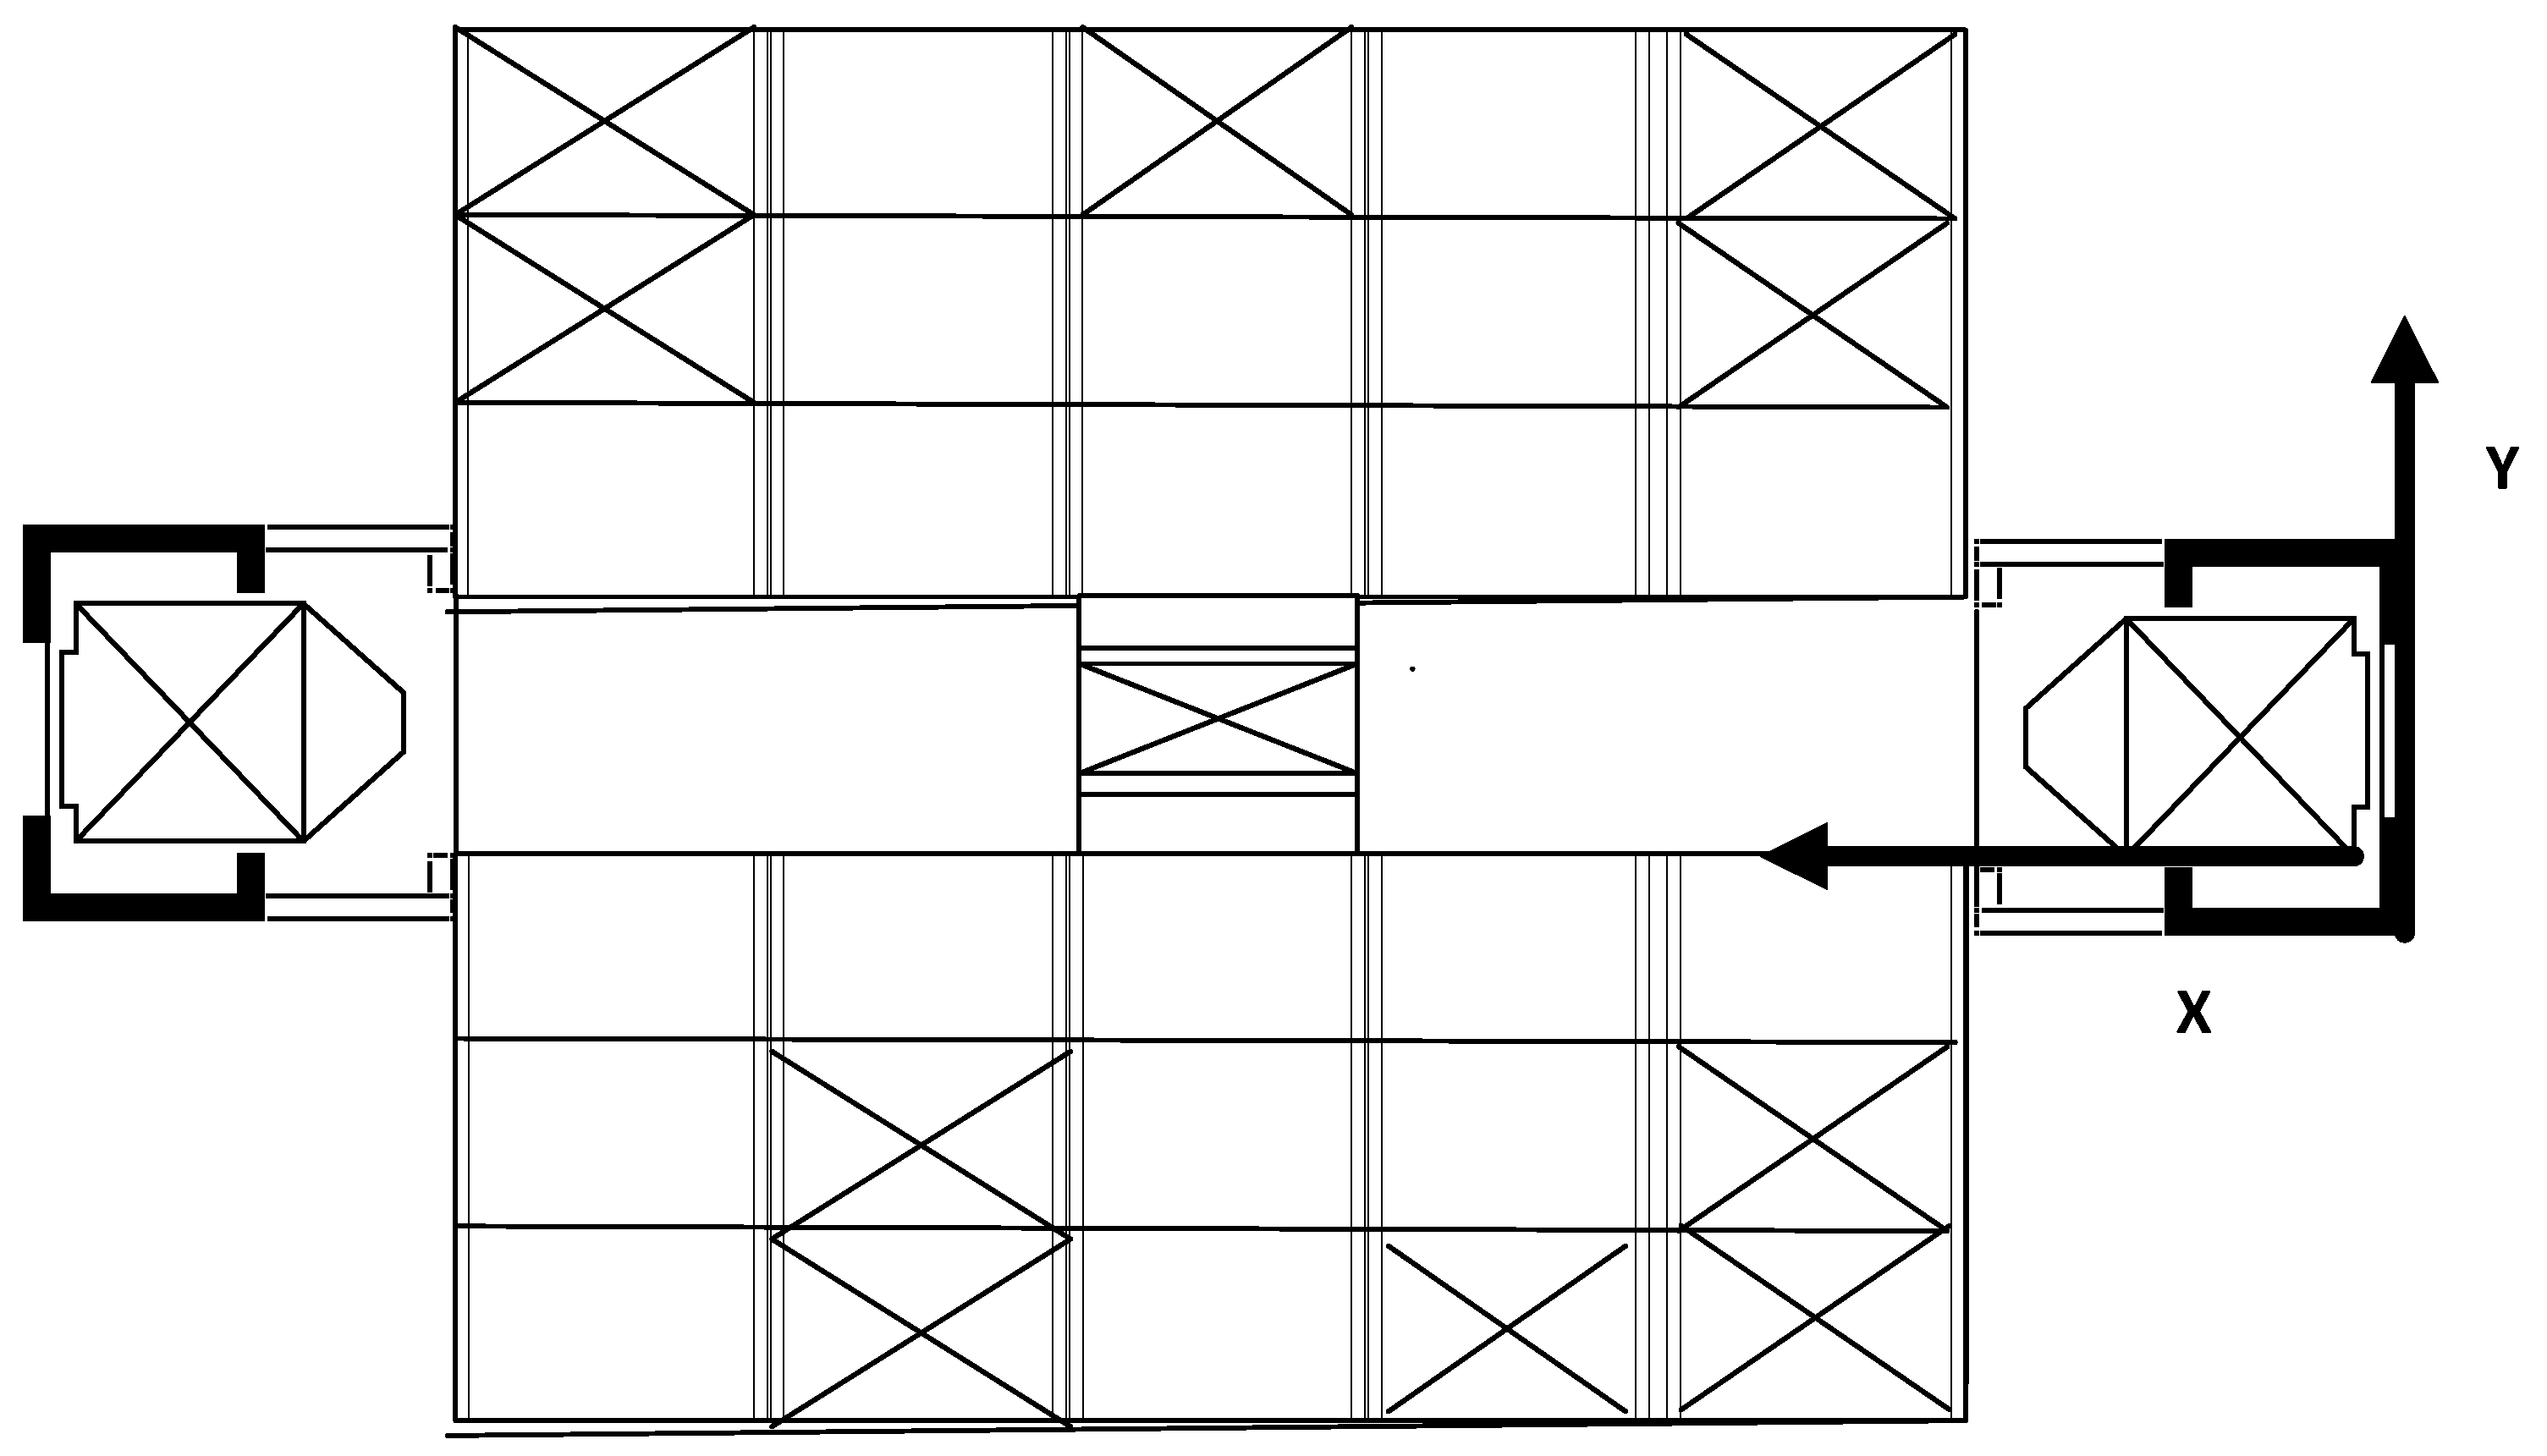
Figure 2.
Top view of deep-lane AVS/RS.

Figure 3.
Speed profile for a machine of deep-lane AVS/RS. (a) Trapezium velocity curve, when maximum velocity is reached, when ; (b) Triangle velocity curve, when maximum velocity is not reached, when .
Figure 3.
Speed profile for a machine of deep-lane AVS/RS. (a) Trapezium velocity curve, when maximum velocity is reached, when ; (b) Triangle velocity curve, when maximum velocity is not reached, when .

Figure 4.
Summary of energy performance.

Table 1.
Overview of the main studies on autonomous vehicle storage and retrieval systems (AVS/RS).
| Paper | Modeling | Configuration | Type of Cycle | Performance Measurement |
|---|---|---|---|---|
| Malmborg [16] (2002) | Analytical model | “tier to tier” | SC/DC | Cycle time |
| Malmborg [17] (2003) | Analytical model | “tier to tier” | SC/DC | Cycle time |
| Kuo et al. [18] (2007) | Queuing system | “tier to tier” | SC | Cycle time |
| Kuo et al. [19] (2008) | Queuing system | “tier to tier” | SC | Cycle time |
| Fukunari and Malmborg [20] (2008) | Analytical model and simulation | “tier to tier” | SC/DC | Cycle time, waiting time |
| Marchet et al. [21] (2012) | Queuing system and simulation | “tier captive” | SC | Waiting time |
| Heragu et al. [22] (2011) | Queuing system and simulation | “tier captive” | SC/DC | Cycle time |
| Ekren [23] (2011) | Simulation | “tier to tier” | n.a. | Cycle time, waiting time |
| Xia et al. [26] (2019) | Simulation | n.a. | n.a. | Cycle time, waiting time |
| Manzini et al. [27] (2016) | Analytical model | n.a. | SC/DC | Cycle time |
| D’Antonio et al. [9] (2018) | Analytical model | “tier to tier” | DC | Cycle time |
| Meneghetti and Monti. [28] (2011) | Energy-based algorithm | “Stacker-crane AS/RS” | SC/DC | Energy consumption |
| Meneghetti and Monti. [29] (2013) | Energy-based algorithm | “Stacker-crane AS/RS” | SC | Energy consumption |
| Tappia et al. [8] (2015) | Analytical model | “tier captive” | SC | Environmental impact |
| Bruno et al. [31] (2016) | Simulation | “tier to tier” | SC/DC | Energy consumption |
| Borovinšek et al. [32] (2016) | Analytical model and genetic algorithm | “tier captive” | SC/DC | Cycle time, total cost and energy consumption |
| Ekren et al. [33] (2018) | Analytical model | “tier to tier” | SC | Cycle time, energy consumption |
| Akpunar, Ekren, Lerher [34] (2017) | Simulation | n.a. | DC | Energy consumption |
Table 2.
Energy consumption evaluation of deep-lane AVS/RS.
| Metrics | Mean Value | Max | Min | Standard Deviation |
|---|---|---|---|---|
| Total energy consumed (kJ) | 88,268 | 95,087 | 80,655 | 2753 |
| Energy consumed for storing (kJ) | 57,568 | 65,149 | 49,731 | 2857 |
| Energy consumed for picking (kJ) | 30,700 | 32,869 | 28,689 | 940 |
| Energy consumed by lifts (kJ) | 51,049 | 57,828 | 44,371 | 2500 |
| Energy consumed by shuttles (kJ) | 29,003 | 30,339 | 27,455 | 568 |
| Energy consumed by satellites (kJ) | 8215 | 8572 | 7880 | 120 |
| Hourly energy consumed (kJ/h) | 5772 | 6190 | 5358 | 155 |
| Energy consumed per UL (kJ/UL) | 75 | 80 | 70 | 2 |
| Energy consumed for storing a UL (kJ/UL) | 98 | 109 | 86 | 4 |
| Energy consumed for picking a UL (kJ/UL) | 52 | 56 | 50 | 1 |
Table 3.
Energy recovery of deep-lane AVS/RS.
| Metrics | Mean Value | Max | Min | Standard Deviation |
|---|---|---|---|---|
| Total energy recovered (kJ) | 24,995 | 27,036 | 23,271 | 728 |
| Energy recovered from storing (kJ) | 6227 | 7466 | 4888 | 473 |
| Energy recovered from picking (kJ) | 18,768 | 16,533 | 20,775 | 840 |
| Hourly energy recovered (kJ/h) | 1634 | 1742 | 1540 | 40 |
| Energy recovered per UL (kJ/pallet) | 21 | 23 | 20 | <1 |
| Energy recovered from storing per pallet (kJ/pallet) | 11 | 12 | 8 | <1 |
| Energy recovered from picking per UL (kJ/pallet) | 32 | 36 | 29 | 1 |
© 2019 by the authors. Licensee MDPI, Basel, Switzerland. This article is an open access article distributed under the terms and conditions of the Creative Commons Attribution (CC BY) license (http://creativecommons.org/licenses/by/4.0/).
Share and Cite
MDPI and ACS Style
Guerrazzi, E.; Mininno, V.; Aloini, D.; Dulmin, R.; Scarpelli, C.; Sabatini, M. Energy Evaluation of Deep-Lane Autonomous Vehicle Storage and Retrieval System. Sustainability 2019, 11, 3817. https://doi.org/10.3390/su11143817
AMA Style
Guerrazzi E, Mininno V, Aloini D, Dulmin R, Scarpelli C, Sabatini M. Energy Evaluation of Deep-Lane Autonomous Vehicle Storage and Retrieval System. Sustainability. 2019; 11(14):3817. https://doi.org/10.3390/su11143817
Chicago/Turabian StyleGuerrazzi, Emanuele, Valeria Mininno, Davide Aloini, Riccardo Dulmin, Claudio Scarpelli, and Marco Sabatini. 2019. "Energy Evaluation of Deep-Lane Autonomous Vehicle Storage and Retrieval System" Sustainability 11, no. 14: 3817. https://doi.org/10.3390/su11143817
Note that from the first issue of 2016, this journal uses article numbers instead of page numbers. See further details here.