Empirical Evaluation of Vocation to Solidarity Economy Using Composite Indicators

1
Department of Agricultural, Food, Environmental and Animal Sciences, University of Udine, 33100 Udine, Italy
2
Department of Economics and Statistics, University of Udine, 33100 Udine, Italy
3
Regional Department of Agri-food, Forest and Fish Resources, Friuli Venezia Giulia Region, 33100 Udine, Italy
4
Department of Statistical Science, Catholic University of Milan, 20123 Milano, Italy
*
Author to whom correspondence should be addressed.
Sustainability 2019, 11(14), 3910; https://doi.org/10.3390/su11143910
Submission received: 31 May 2019
/
Revised: 15 July 2019
/
Accepted: 16 July 2019
/
Published: 18 July 2019
(This article belongs to the Special Issue Motivations, Drivers, and Barriers to the Development of Sustainable Agri-Food Systems and Consumption Patterns)
Abstract
:Many scholars today are deepening economic issues by looking at new paradigms based on the relationship between communities and the resources of the territory. The proposals are different, mainly focusing on economic theories such as solidarity economy, a mix of theories and practices based on equity, sustainability, democracy, and reciprocity. The growing legislation on solidarity economy implies to develop tools to support Administrations and Communities throughout the process of effective realization. The aim of this study is to propose a methodology for evaluating the Vocation to Solidarity Economy (VSE) by means of a composite indicator (VSE index) and apply it to the territory of Friuli Venezia Giulia Region in the northeast of Italy. A series of basic factors concerning social, economic, and environmental aspects was defined by multidisciplinary experts and used for VSE index calculations. The spatialization of VSE index allows the assessment of the vocation of territories in supporting the paths to become Communities of Solidarity Economy as defined by a recent regional law. As results of subsequent VSE spatialization we obtain the maps which highlight different characteristics within the Region (i.e. urban/rural relations) helping local administrations to improve current policies towards sustainability.
1. Introduction
Many scholars today are approaching issues of the economy critically, seeking new meanings in a discipline that originally dealt with the management [1] of relations between people in the home, a place that more than any other summarizes the essence of people being together with others.
In the last century economists in different parts of the world, taking inspiration from other disciplines [2,3,4,5] focused their attention on the inability to separate the economy from the environment, on the finiteness of the environmental system, and the impossibility of infinite growth in a system of finite resources [6].
One of the keywords that arose from these debates was “transition” as a process of transformation towards sustainability. The transition to an economy that respects the environment and acknowledges responsibility for the crisis of global capitalism implies the regions’ ability to assume sovereignty in different sectors. For this reason, transition refers to an interdisciplinary research field focused on structural change in societal systems [7]. Looking at the western world, it is evident that this is not merely facing a financial and economic crisis, but the crisis of a system that involves environmental sustainability, climate emergency [8], and a system of values and culture [5]. What are the reasons for this crisis? What are the scenarios that lie ahead? What are the strategies needed to create a new model of equitable, sustainable, and long-lasting coexistence? Moreover, how can such a transition be made?
Many alternatives but significantly different economic models based on the rediscovery of the founding nucleus of the territorial community have been proposed, amongst which are Civil Economy [9], Economy of Communion [10], Degrowth [11], Health Economics [1], Solidarity Economy [12], Economy for Common Good [13], Fundamental Economy [14], Sufficiency Economy [15] and Bioregionalism [6,16].
In this study, we focus on solidarity economy, briefly defined as an economy that is governed by the principle of reciprocity and initiated by civil actors [12] composed by a mix of theories and practices based on equity, sustainability, and democracy [17]. Solidarity economy reconsiders the importance of the local community, not only as a space for human relations but also as a space to rediscover the territorial dimension of “being” in a defined physical environment and culture, inspired by the theory of bioregionalism [16,18].
There are many experiences in the world [17] that fall within the wide spectrum of good practices of solidarity economy and present some common characteristics [19]: the spatial dimension that, from a globalized system, brings back economic spaces within the communities, placing them in relation with their own territory and subordinating the economy to society and the community; environmental sustainability in terms of production systems attentive to environmental impacts; the community dimension in which decision-making methods are reproposed, which refers to democratic participatory systems where the actors involved in production and consumption find significant moments of sharing.
Many of these practices are developed with a bottom-up approach. In Italy, the Network of Economic Solidarity has promoted the development of Economic Solidarity Districts (ESDs) that are defined as laboratories for civic, economic, and social experimentation. In recent years, numerous ESDs have been set up in various regions of Italy and are composed of citizens who are local producers (firms) and consumers who share the principles of a solidarity economy [20]. They direct the economic flows preferentially within the local community as a model of a small-scale society that is socially and ecologically responsive. In this model, communities are organized primarily around naturally defined regions but are outward looking and globally engaged [18]. In practice, an ESD operates within a given territory, exchanging cultural, social, and economic values, focusing on local dimensions [21]
However, in many countries around Europe, these practices have been regulated through specific laws as in France [22], Greece [23], and in some Italian Regions such as Emilia Romagna [24] and Trentino [25].
This research concerns the possible implementation of a solidarity economy in the territory of Friuli Venezia Giulia Region (FVG) in the northeast of Italy. This region has recently approved a law on solidarity economy—FVG Regional Law no. 4/2017, [26]—which is based on the necessity to re-embed communities in the place where they live, maintaining the local economy in a proactive relationship with the territory, returning the product to its place of origin, giving centrality back to producers and value to their products, defending both the landscape and Commons as essential components for a better quality of life.
Article 1 of the law defines solidarity economy as a “socioeconomic and cultural model centered on local communities and based on principles of solidarity, reciprocity, environmental sustainability, social cohesion, care for Commons, and as a key instrument in dealing with situations of economic, employment and environmental crisis.” The law recognizes Communities of Solidarity Economy (CSE) as new institutions made up of residents of the Territorial Union of Municipalities (TUM) [27]. These new institutions are directed to propose a democratic model through forms of direct participation, where the community and territory are repositioned in relation to each other and the production system is directed towards a local development model in which local assets regain value according to the needs and well-being of the community [28]. The strength of these new institutions depends on the willingness of the community to be actors in their own development and will be more active in relation to the presence of good practices of solidarity economics in the territory.
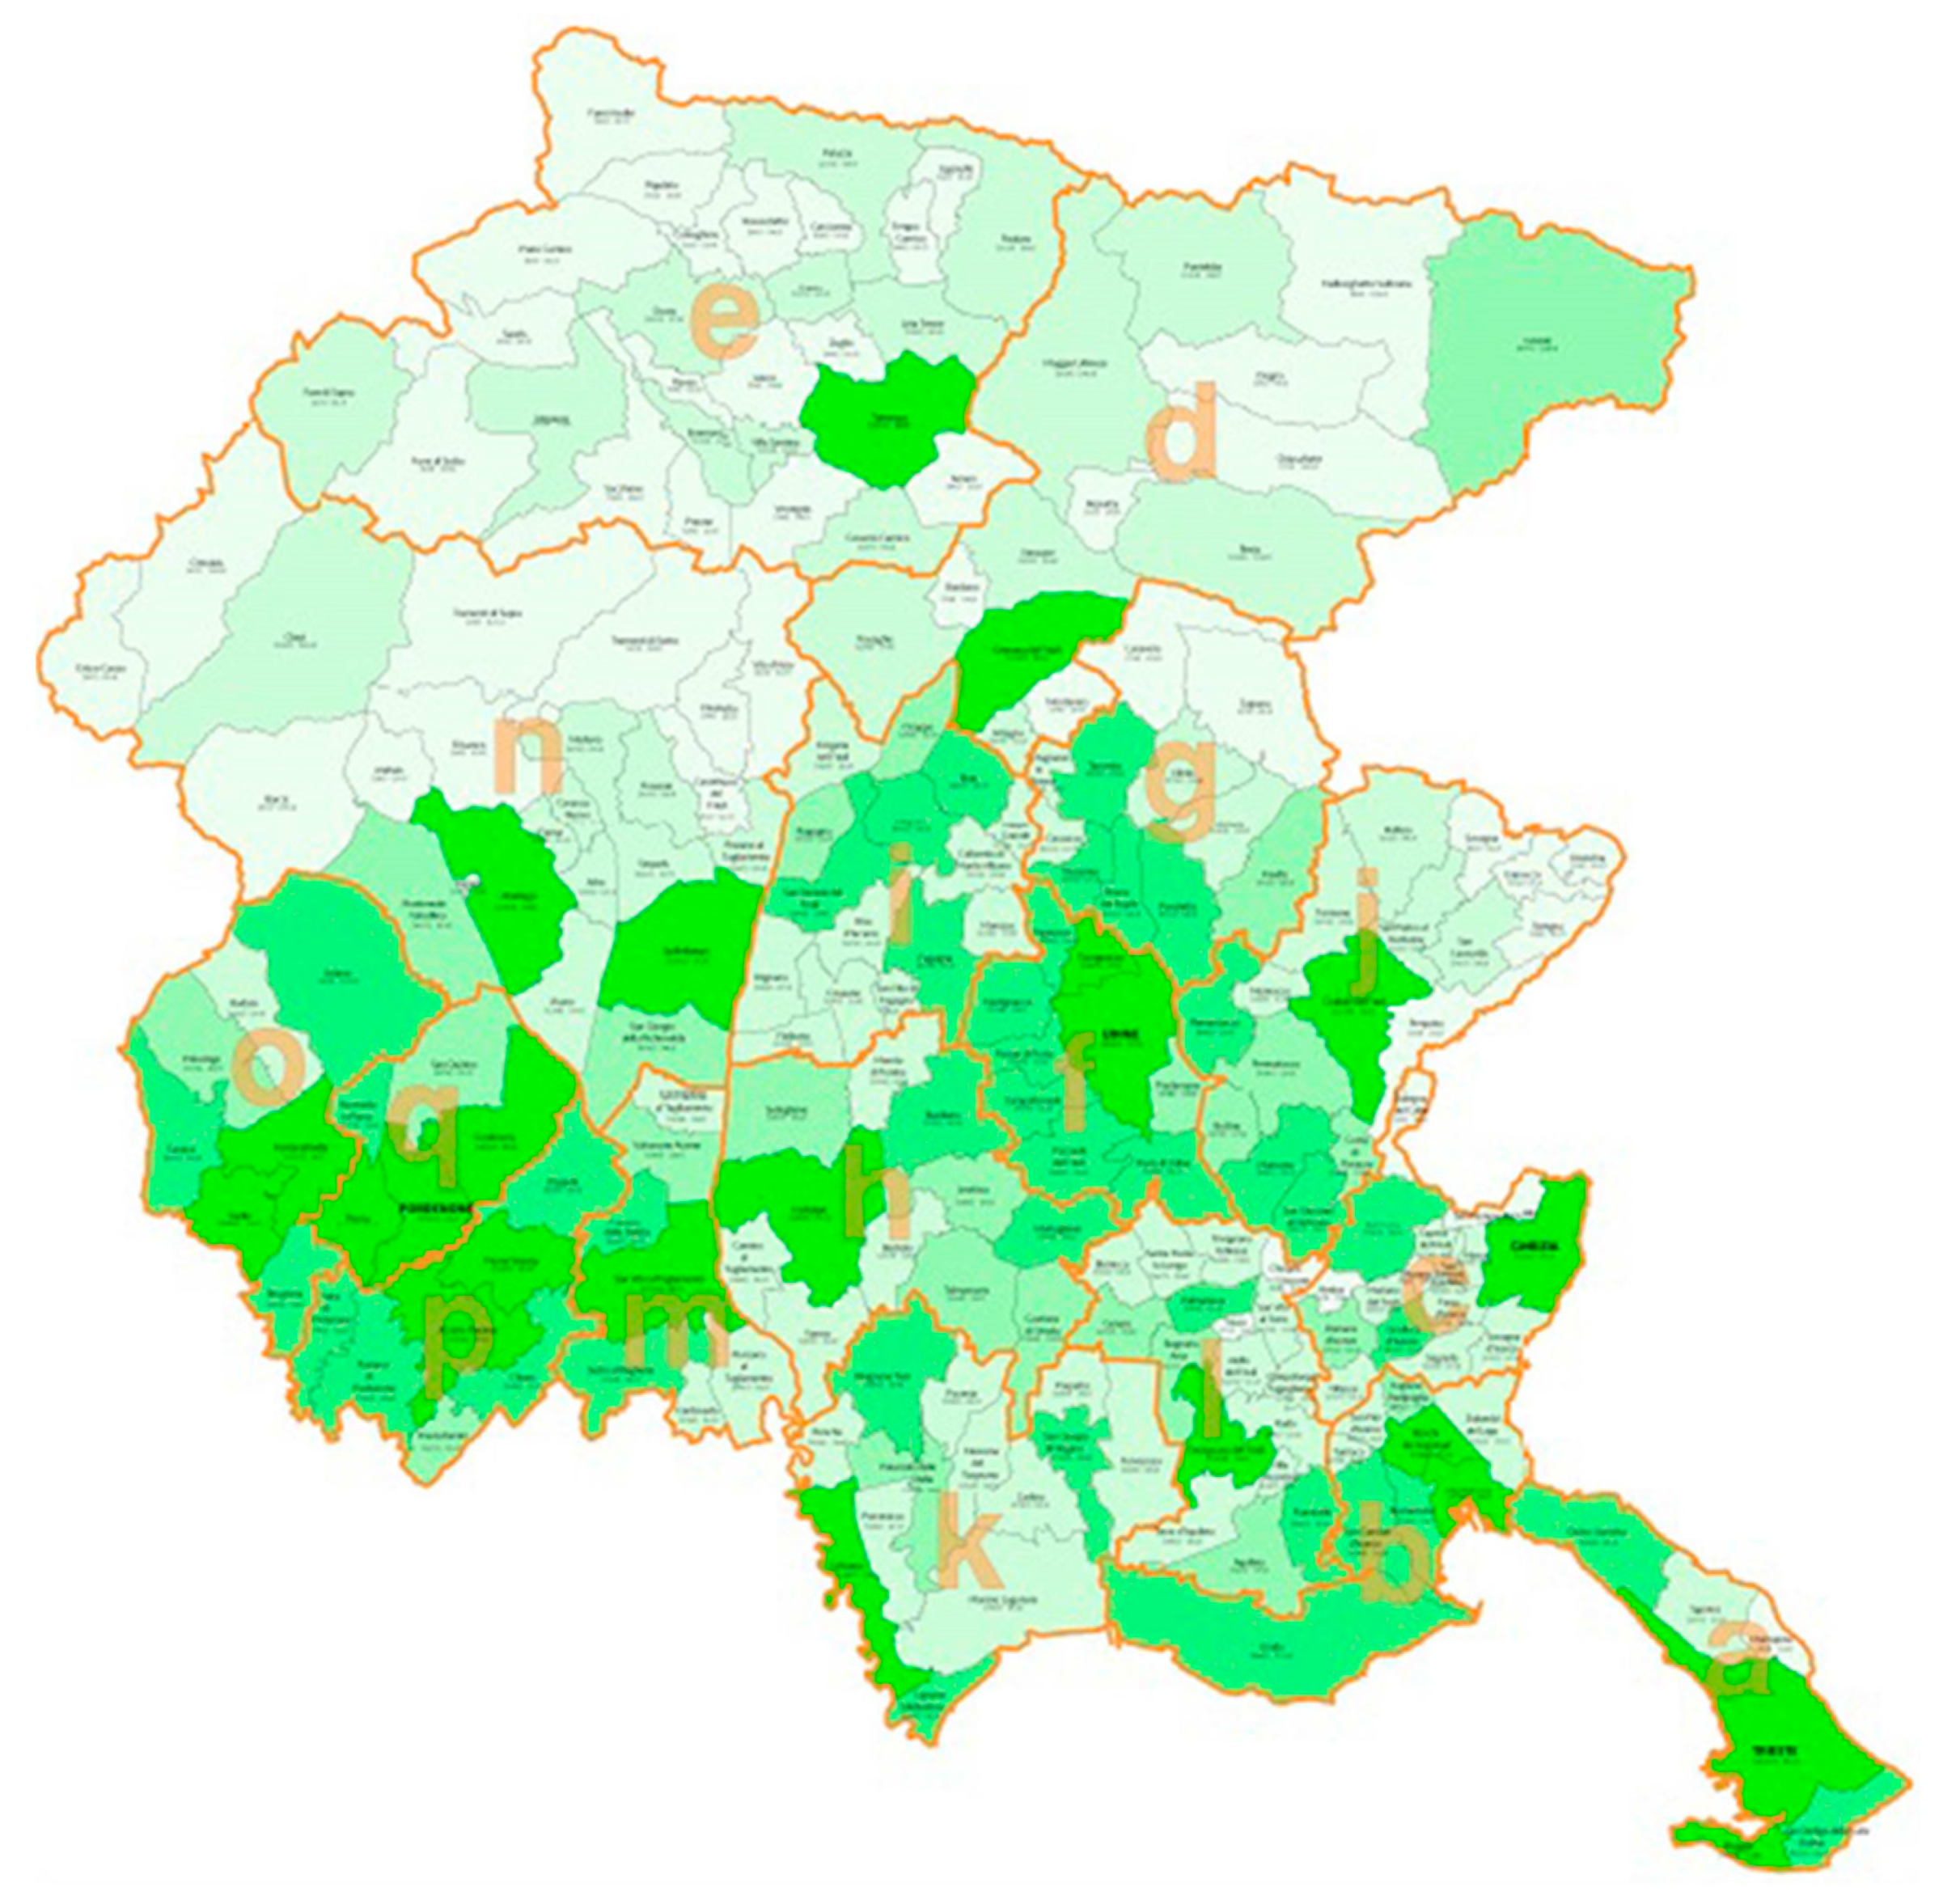
In this regard, a Composite Indicator (CI) has been developed, which allows the assessment of the vocation of territories in supporting the paths to become CSE, i.e. well-defined territories, where economic processes are based on relations that are socially, ecologically, and environmentally responsive. Vocation is understood to be the ability to initiate and consolidate a CSE. We call this concept “Vocation to Solidarity Economy”. The CI, based on several elementary indicators proposed and evaluated with the help of experts, is applied to an area that corresponds to the surface of TUMs in FVG (Figure 1). TUMs are institutions proposed by the Regional Law no. 26/2014 [27], which serve several municipalities in FVG and aim to develop a polycentric system that favors the integration of social, environmental, and economic policies.
The study also aims to provide regional and local administrators with information regarding the strong points and the weak points of each TUM in order to address the actions that need to be undertaken to make the region’s communities more resilient and sustainable.
The remainder of the paper is structured as follows. Section 2 describes the methodology of CI with identification of the elementary indicators that enable us to assess vocation to solidarity economy in the municipalities and/or the TUMs of FVG. Section 3 presents the most important results of the empirical applications. The final section, Section 4, draws attention to our most important conclusions.
2. Materials and Methods
Although globalization is seen by many people as a driving force for global economic growth, the effects of this model are evident and put the survival of the planet at risk: at the social level there is an evolution of inequality, environmental impacts are evident as climate change, and communities are less resilient because they depend on global markets and are not related to local resources. The underlying idea of Solidarity Economy is to rethink the territory on the basis of self-sustainability in both production and consumption, leading them both back to a local dimension, enhancing the resources and the people of each territory [28], taking into account the experience of those ESD active in Italy and the guidelines in terms of objectives and local chains as described in the Regional Laws of Friuli Venezia Giulia.
“Vocation to Solidarity Economy” (VSE) is a complex multidimensional phenomenon that cannot be captured by just one variable, so it is necessary to find a set of indicators that are capable of reflecting different aspects of it [29,30]. To assess and to compare the VSE in the municipalities or TUMs of Friuli Venezia Giulia we follow the composite indicator (CI) methodology as it takes into account the multidimensional nature of VSE. This approach is a tool that avoids multiple indicators comparison as it “summarizes” the information in a unidimensional index. Following Nardo et al. [31] (p.7), a CI is defined as “a mathematical combination of individual indicators that represent different dimensions of a concept whose description is the objective of the analysis.” This definition underlines the scope and usage of CI that play an important role in many fields such as economy, society, environment, innovation, etc. However, CI can provide misleading information if they are poorly constructed or misinterpreted; see, for example, Nardo et al. [31,32] for a critical assessment and for a summary of pros and cons of using CI. The steps employed in this study are shown in Figure 2.
Building a CI involves many steps with several alternatives that contribute significantly to the “quality” of the final result. These steps can be summarized as follows [32,33,34].
- (1)
- Define the phenomenon to be measured. VSE is the concept measured by the CI. It is defined as the ability of territories in supporting solidarity economy paths to becoming CSE: well-defined territories where economic processes are based on relations that are socially, ecologically, and environmentally responsive. We call this CI “VSE Index” (VSEI).
- (2)
- Individual indicators selection. The selection of the set of indicators was based on
- the analysis of the experience of ESD in Italy;
- the opinions of experts, identified in the academic world and in the area of associations who met in three focus groups; and
- data availability and data quality.
In the first instance, discussions with experts and available data identified 38 indicators nested in five pillars: (1) society, (2) economy–production, (3) economy–consumption, (4) environment, (5) local institutions. The three experts that we involved in the first selection of 38 indicators were identified in the academic world and in the area of associations and belonged to RES, that is, the Italian Network of Solidarity Economy, Health Agency that works in social agriculture, University in the field of community development.
The list of 38 indicators was then submitted to another team of 12 experts and scholars in various fields with some connection to the ESC. In particular, they were part of RES of Italy and Forum for the Commons and Solidarity economy of FVG Region, Udine Municipality, in the field of social agriculture; university researchers in the fields of environmental economy, agricultural economy, ecology, territorial planning, and agronomy; sociologist experts in community development; fair trade activists; and the Health Agency of FVG. These experts were asked to give a score from 1 to 4 to each indicator and to each pillar, reflecting the relevance of the indicator/pillar in analyzing solidarity economy. Moreover, the experts stated for each elementary indicator if it is correlated positively (positive polarity) or negatively (negative polarity) with VSE.
Data sources were from official institutions such as ISTAT (Istituto Centrale di Statistica) and FVG. Data were collected at municipality level (218) nested in 18 TUMs of the FVG Region.
After a check on data availability at municipality level, some summary statistics and the assessment of the relevance expressed by the experts through their scores, a final set of 31 elementary indicators was obtained (Table 1). Seven elementary indicators were excluded from the analysis due to low scores expressed by the experts, high correlations, or unavailability of data at municipality level.
For each elementary indicator we built a form with a set of information:
- The definition, the pillar, the unit of measurement, the formula, the polarity, the source of the data, and the reason why it was chosen
- Some summary statistics as minimum (Min), maximum (Max), mean, median, the lower (Q1) and the upper (Q3) quartiles, the standard deviation (SD), and the interquartile range (IQR)
- The map, at the municipality level, of its spatial distribution.
Figure 3 provides an example of a form for the elementary indicator “population density”.
- (3)
- Individual indicators normalization. Normalization “avoids adding up apples and pears” [31] (p.11) as it makes indicators comparable, given that, in general, they are collected with different measurement units. The normalized indicators are dimensionless numbers. There is a wide set of normalization methods [31], such as ranking, standardization, rescaling, distance to the maximum. The choice of the appropriate normalization method should take into account the data behavior and the objective of the CI [31,35]. In normalizing, it is important to identify the polarity (correlation), positive or negative, between an individual indicator and the CI. The polarity is positive when increasing values of the indicator correspond to increasing values of CI; instead, the polarity is negative when increasing values of the indicator correspond to decreasing values of CI. In accordance with this rule, three individual indicators show a negative polarity—population density, average farm size, and municipal waste—while the others show a positive polarity. In this paper, we deal with four normalization methods that produce different outcomes for the VSEI.
- (4)
- Choice of a suitable system of weights and aggregation function of the normalized indicators. This process combines, in a meaningful way, all the normalized indicators to obtain the CI. The problem of the choice of a system of weights that reflects the “importance” of each transformed indicator in building the CI, introduces an arbitrary component. There are different ways to choose a system of weights; the easiest (but not always the most suitable) is “equal weighting” that assigns equal weights to all the normalized indicators. An alternative is to assign weights that are set by a group of experts or based on some multivariate statistical methods, i.e., Principal Component Analysis, Factor Analysis, Data Envelopment Analysis, and the Benefit of the Doubt approach [36]. Here the elementary indicators were weighted to build a VSEI using two different weighing systems. The first method assigns the same weight to all elementary indicators. The second calculates the weight through analysis of the opinions of the 12 experts interviewed by a questionnaire. The matter of aggregation of information comes together with the weighting problem. Again, there are different aggregation rules and choices implying different assumptions and consequences. Linear aggregation, which is the simplest and most common method, implies full compensability: poor performance in some indicators can be compensated by sufficiently high values in others. This means that a deficit in one dimension can balance a surplus in another [32]. In this paper, we consider linear aggregation.
- (5)
- Sensitivity analysis. Sensitivity analysis assesses the robustness of CI. As the construction of a CI involves several subjective choices (i.e., normalization method, system of weights, and aggregation function) it is useful to compare different scenarios to evaluate changes in CI performance. For example for the VSE Index, we have eight scenarios: four normalization methods by two systems of weights.
- (6)
- Back to the details A CI can also be decomposed so that the contribution of subcomponents can be identified and the analysis of municipality/TUM performances extended. Here the VSEI has five subcomponents (one for each of the five pillars), which contribute differently to the aggregated composite indicator and municipality/TUM rankings. The decomposition of the composite indicator can thus improve the information related to the overall performance of a given municipality/TUM. Formally, the value of the VSEI, at municipality level, can be expressed aswhere is the normalized value of individual indicator j for municipality i, with normalization method h and is the associated weight, with r denoting the weighting method.
Table 2 summarizes the normalization methods used in the analysis; is the value of the individual indicator j for municipality i, is the mean, and is the standard deviation of indicator
The equal weighting method assigns equal weight to each normalized indicator:
while the system of weights that takes into account the opinions of the 12 experts is based on the median, for each individual indicator and each pillar, of the level of importance. Denoting with , the median importance for indicator j, and with the median importance for pillar k, k=1, 2,…,5; this system of weights is defined as
Appling these methods to the dataset of 31 individual indicators observed in 218 municipalities we rank municipalities with respect to their degree of vocation for solidarity economy. As we have eight scenarios, due to four normalization methods and two systems of weights, we obtain eight different ranks.
The VSEI, at TUM level, can be expressed as a weighted mean:
The weight is the ratio between the population of municipality i and the population of TUM t.
To assess the robustness of the analysis we use the Spearman correlation to measure the degree of association between pairs of ranks and the average shift in municipalities’ ranks as a measure of uncertainty [37]. The average shift for each scenario is the average of the absolute differences in municipalities’ ranks with respect to a median rank (reference ranking) over the 218 municipalities:
3. Results and Discussion
Applying formula (1) to the eight scenarios we obtain eight municipalities’ ranks. It is important to detect the degree of accordance between ranks of pairs of scenarios, e.g., with the Spearman rank correlation index, as it is a measure of sensitivity of the VSE Index, which, in turn, is related to robustness. If the correlations between ranks of couples VSEIs, in different scenarios are high, this means that the index is not sensitive to different alternatives (normalization, system of weights, aggregation function). Table 3 shows the degree of correlation between ranks of couples of VSEIs.
The results in Table 3 show some discrepancy between the ranking method and other standardization methods, whereas there is a high correlation between the standardization methods, rescaling, and comparison with the maximum.
The correlations do not vary much when comparing the two weights systems; this means that by using the weights assigned by experts the rankings do not change significantly.
Table 4 shows the values of the average shift in rankings for the eight scenarios. Values closer to zero mean more similarity to the median rank.
The weighting approach has a weak influence on the municipalities’ ranks, whereas the normalization method affects them. In particular, the ranking method shows the biggest difference. This is probably caused by the loss of information on levels of the individual indicators. Rescaling is the method that shows the smallest difference. There is no big difference in the order of the values of based on the other normalization methods excluding the ranking method.
Based on the analysis of sensitivity and uncertainty, the VSEI index, achieved by the rescaling method and equal weights, was chosen.
Table 5 summarizes the final ranking of the top 5 (very high vocation to solidarity economy) and bottom 5 municipalities (very low vocation to solidarity economy).
According to formula (2), the VSEI was also calculated at TUM level, and then decomposed into the five subcomponents to highlight how they contribute differently to the aggregated VSEI and TUM ranking. Figure 4 shows the aggregated VSE index (Overall) and the five subcomponents (society, economy–production, economy–consumption, environment, and local institutions). For example, TUM 1 “Giuliana” has a low level of overall VSE index, but it is strong in local institutions.
Decomposition of the VSEI can thus shed light on the overall performance of a given TUM.
4. Conclusions
The aim of this study is to assess, through a composite indicator, the vocation of territories and communities in the Friuli Venezia Giulia Region in supporting a solidarity economy path. In particular the analysis is directed to evaluate the VSEI of the 18 TUM [27] (Figure 1), which are institutions (serving several municipalities) in the region aimed at the development of a polycentric system that favors the integration of social, environmental, and economic policies. In fact even the Regional Law on “Rules for Valorization and Promotion of the Solidarity Economy” [26] identifies the TUM as territories where develop solidarity economy processes.
This paper represents the beginning of a work in progress. It is a first exploratory analysis of the possibility of constructing a composite indicator that supports political choices in view of the transition towards a solidarity economy. The proposal need further research to be validated and improved through a more accurate selection and weighting of indicators. The indicators, as in other research, are open to debate in respect to their capacity to facilitate the paradigm shift, in our socioeconomic model, towards solidarity economy [30].
However, two different conclusions can be proposed from this study: methodological and practical
From a methodological perspective the use of CI theory is of practical utility as summarizing in a useful way elementary indicators, allows to understand different aspect of a complex phenomenon as vocation to solidarity economy. Nevertheless, it is necessary to keep in mind the subjectivity of some choices that are made in the different phases of the construction of the CI and the assessment of the quality and reliability of the data.
From a practical perspective, the study shows that there are territories with different characteristics within the Region (Figure 3). Our results set out that the areas least suitable to become Economic Solidarity Communities are Giuliana, Friuli Centrale, Noncello, Alto Isontino, and Basso Isontino, which correspond to urban and suburban areas (see Figure 3).
One possible interpretation of this result is the fact that the basic needs of the population play an important role in our model, defining the vocation for being CSEs. These communities are in fact formed by the main towns of the region and neighboring municipalities, which have often lost their agricultural role and have become sites of commercial and industrial activities. In these territories, the particularly high population density and the characteristics relating to primary production make it difficult to build supply chains in the food industry at local level. They are, therefore, areas where it is difficult to initiate solidarity economy paths initiating from the resources of the territory. Consequently, they require relations with the surrounding territories, which are instead characterized by a strong rurality [28].
Finally, we wish to comment on the possibility that such information could help to develop current policies of local administrations aiming to improve the solidarity economy model working on different field in relation with the results of the analysis. In fact, through the composite indicator it is possible to highlight which are the aspects of strength and weakness of each territory in order to activate solidarity economic paths as indicated by the regional law.
Author Contributions
Conceptualization, L.P. (Lucia Piani) and L.P. (Laura Pagani); Formal analysis, L.P. (Lucia Piani) and L.P. (Laura Pagani), and G.E.; Investigation, L.P. (Lucia Piani) and L.P. (Laura Pagani), and G.E.; Methodology, L.P. (Lucia Piani) and L.P. (Laura Pagani); Supervision, L.P. (Lucia Piani) and L.P. (Laura Pagani), and M.C.Z.; Writing—review & editing, L.P. (Lucia Piani) and L.P. (Laura Pagani).
Funding
This research received no external funding.
Acknowledgments
We acknowledge the teams of experts that participated in the focus groups helping us to select the set of elementary indicators.
Conflicts of Interest
The authors declare no conflict of interest.
References
- Eisler, R. La Vera Ricchezza Delle Nazioni. Creare Un’Economia di Cura; Forum Editrice: Udine, Italy, 2015. [Google Scholar]
- Georgescu-Roegen, N. La Bioeconomia; Bollati Boringhieri: Torino, Italy, 2003. [Google Scholar]
- Boulding, K. Towards a New Economics: Critical Essays on Ecology, Distribution, and Other Themes; Edward Elgar Publishing: Aldershot, UK, 1992. [Google Scholar]
- Daly, H. Oltre la Crescita; Edizioni di comunità: Torino, Italy, 2001. [Google Scholar]
- Bonaiuti, M. La Teoria Bioeconomica: La “Nuova Economia” di Nicholas Georgescu-Roegen; Carrocci editrice: Roma, Italy, 2001. [Google Scholar]
- Hansson, C.; Wackernagel, M. Rediscovering place and accounting space: How to re-embed the human economy. Ecol. Econ. 1999, 29, 203–213. [Google Scholar] [CrossRef]
- Wittmayer, J.M.; Avelino, F.; van Steenbergen, F.; Loorbach, D. Actor roles in transition: Insights from sociological perspectives. Environ. Innov. Soc. Transit. 2017, 24, 45–56. [Google Scholar] [CrossRef] [Green Version]
- McMichael, P. Food system sustainability: Questions of environmental governance in the new world (dis)order. Glob. Environ. Chang. 2011, 21, 804–812. [Google Scholar] [CrossRef]
- Bruni, L.; Zamagni, S. Civil Economy, Efficiency, Equity, Public Happiness; Peter Lang: Oxford, UK, 2007. [Google Scholar]
- Lubich, C. L’Economia di Comunione. Storia e Profezia; Città Nuova: Roma, Italy, 2001. [Google Scholar]
- Latouche, S. La Scommessa Della Decrescita; Feltrinelli: Milano, Italy, 2007. [Google Scholar]
- Laville, J.L. Économie solidaire: Les enjeux européens. Hermès La Rev. 2003, 36, 27–35. [Google Scholar] [CrossRef]
- Felber, C. L’Economia del Bene Comune; Tecniche Nuove: Milano, Italy, 2012. [Google Scholar]
- Barbera, F.; Dagnes, J.; Salento, A.; Spina, F. (Eds.) Il Capitale Quotidiano. Un Manifesto per L’Economia Fondamentale; Donzelli: Roma, Italy, 2016. [Google Scholar]
- Mongsawad, P. The philosophy of the sufficiency economy: A contribution to the theory of development. Asia-Pac. Dev. J. APDJ 2010, 17, 123–143. [Google Scholar] [CrossRef]
- Berg, P. Reinhabiting a Separate Country: A Bioregional Anthology of Northern California; Planet Drum: San Francisco, CA, USA, 1978. [Google Scholar]
- Loh, P.; Shear, B. Solidarity economy and community development: Emerging cases in three Massachusetts cities. Community Dev. 2015, 46, 244–260. [Google Scholar] [CrossRef]
- Gray, R. Practical bioregionalism: A philosophy for a sustainable future and a hypothetical transition strategy for Armidale, New South Wales, Australia. Futures 2007, 39, 790–806. [Google Scholar] [CrossRef]
- Forrest, N.; Wiek, A. Learning from success—Toward evidence-informed sustainability transitions in communities. Environ. Innov. Soc. Transit. 2014, 12, 66–88. [Google Scholar] [CrossRef]
- Piani, L.; Minatelli, F. Distretti, filiere e patti nell’economia solidale italiana. In I Dialoghi Dell’Economia Solidale; Asterios: Trieste, Italy, 2016; pp. 122–138. [Google Scholar]
- Piani, L.; Santarossa, C. Common Visions between Farmers and Consumers as a Tool to Characterize “New” Agro-Food Markets. In Proceedings of the ESEE 2001—9th Conference of the European Society for Ecological Economics, Istanbul, Turkey, 14–17 June 2011. [Google Scholar]
- LOI n° 2014-856 du 31 Juillet 2014 Relative à L’économie Sociale et Solidaire. Available online: https://www.legifrance.gouv.fr/affichTexte.do?cidTexte=JORFTEXT000029313296&categorieLien=id (accessed on 21 May 2019).
- Law 4430/2016: Social and Solidarity Economy and Development of Its Agencies and Other Provisions. Available online: https://www.e-nomothesia.gr/kat-oikonomia/nomos-4430-2016.html?q=443020 (accessed on 21 May 2019).
- Legge Regionale 23 Luglio 2014, n. 19, Norme per la Promozione e il Sostegno Dell’Economia Solidale. Available online: https://demetra.regione.emilia-romagna.it/al/articolo?urn=er:assemblealegislativa:legge:2014;19 (accessed on 21 May 2019).
- Legge Provinciale 17 Giugno 2010, n. 13, Promozione e Sviluppo Dell’Economia Solidale e Della Responsabilità Sociale Delle Imprese. Available online: https://www.consiglio.provincia.tn.it/leggi-e-archivi/codice-provinciale/Pages/legge.aspx?uid=21678 (accessed on 22 May 2019).
- Regione Friuli Venezia Giulia, Legge 4/2017 Norme per la Valorizzazione e la Promozione Dell’Economia Solidale. Available online: http://lexview-int.regione.fvg.it/fontinormative/xml/xmllex.aspx?anno=2017&legge=4 (accessed on 21 May 2019).
- Regione Friuli Venezia Giulia, Legge Regionale 12 Dicembre 2014, n. 26 Riordino del Sistema Regione-Autonomie Locali nel Friuli Venezia Giulia. Ordinamento delle Unioni territoriali intercomunali e Riallocazione di Funzioni Amministrative. Available online: http://lexview-int.regione.fvg.it/fontinormative/xml/xmllex.aspx?anno=2014&legge=26 (accessed on 21 May 2019).
- Magnaghi, A.; Fanfani, D. Patto città Campagna: Un Progetto di Bioregione Urbana per la Toscana Centrale; Alinea: Firenze, Italy, 2010. [Google Scholar]
- Moldan, B.; Janouskova, S.; Hak, T. How to understand and measure environmental sustainability: Indicators and targets. Ecol. Indic. 2012, 17, 4–13. [Google Scholar] [CrossRef]
- Lievens, L. Agriculture in a degrowth society: Helpful indicator for the transition. Transitory indicator for paradigm shift. In Proceedings of the 2nd International Conference on Economic for Ecological Sustainability and Social Equity, Barcelona, Spain, 26–29 May 2010. [Google Scholar]
- Nardo, M.; Saisana, M.; Saltelli, A.; Tarantola, S. Tools for Composite Indicators Building; JRC Publications: Ispra, Italy, 2005. [Google Scholar]
- OECD. Handbook on Constructing Composite Indicators, Methodology and User Guide; OECD: Paris, France, 2008. [Google Scholar]
- Mazziotta, M.; Pareto, A. Methods for constructing composite indices: One for all or all for one? Riv. Ital. Econ. Demogr. Stat. 2013, 67, 67–80. [Google Scholar]
- Lauro, C.; Nappo, D. Model Based Composite Indicators. In Proceedings of the ISTAT Workshop on La misurazione di Fenomeni Multidimensionali: Indici Sintetici ed Esperienze a Confronto, Rome, Italy, 2 March 2001. [Google Scholar]
- Ebert, U.; Welsh, H. Meaningful environmental indices: A social choice approach. J. Environ. Econ. Manag. 2004, 47, 270–283. [Google Scholar] [CrossRef]
- Cherchye, L.; Moesen, W.; Rogge, N.; Van Puyenbroeck, T.; Saisana, M.; Saltelli, A.; Liska, R.; Tarantola, S. Creating Composite Indicators with DEA and Robustness Analysis: The case of the Technology Achievement Index. J. Oper. Res. Soc. 2008, 59, 239–251. [Google Scholar] [CrossRef]
- Saisana, M.; Saltelli, A.; Tarantola, S. Uncertainty and sensitivity analysis techniques as tools for the quality assessment of composite indicators. J. R. Statist. Soc. A 2005, 168, 307–323. [Google Scholar] [CrossRef]
Figure 1.
Territorial Union of Municipalities (TUM) of Friuli Venezia Giulia. Source: LR 26/2014, ART. 4, COMMA 6 - DGR 1282/2015.
Figure 1.
Territorial Union of Municipalities (TUM) of Friuli Venezia Giulia. Source: LR 26/2014, ART. 4, COMMA 6 - DGR 1282/2015.

Figure 2.
Steps employed in the study.

Figure 3.
Form for the elementary indicator “population density”.

Figure 4.
Maps of values for VSEI, overall and by different pillars, at TUI level. Legend: Territorial Union of Municipalities: 1 Giuliana; 2 Basso Isontino; 3 Alto Isontino; 4 Canal del Ferro—Val Canale; 5 Alto Friuli; 6 Carnia; 7 Friuli Centrale; 8 Torre; 9 Medio Friuli; 10 Collinare; 11 Natisone; 12 Bassa Friulana Occidentale; 13 Bassa Friulana Orientale; 14 Destra Tagliamento; 15 Dolomiti Friulane; 16 Livenza; 17 Sile; 18 Noncello.


Table 1.
Pillars, elementary indicators, aim, source of data and polarity.
| Pillar | Elementary Indicator | Description | Source of Data | Polarity |
|---|---|---|---|---|
| Society | Population density | lower density, greater aptitude for food sovereignty, and short supply chains | ISTAT 1 | - |
| Unemployment rate | higher percentage of unemployed means a territory in difficulty, where solidarity economy paths can contribute to solving, even partially, these problems | ISTAT | + | |
| Water referendum affluence rate | greater affluence, greater interest and social participation of that community | FVG data base 2 | + | |
| Ageing index | greater age of the population means less aptitude to change and interest in the future | ISTAT | - | |
| Birth rate | higher value, greater orientation towards the future and trust in a community | ISTAT | + | |
| Number of social and educational farms / 10000 inhabitants | higher number means more agricultural attention to social issues that could be involved in the creation of Districts | FVG data base | + | |
| Volunteers in non-profit institutions/10,000 inhabitants | higher number means more attention of the population of the territory towards the common good | FVG data base | + | |
| Number of social cooperatives/10,000 inhabitants | higher number means more attention to social problems in a territory; moreover, they are often among the promoters of the creation of DES | FVG data base | + | |
| Number of small shops/10,000 inhabitants | higher number means more presence on the territory of places for meeting and socializing, and therefore the presence indicates a more cohesive population | ISTAT | + | |
| Economic Production | Number of small enterprises/10,000 inhabitants | higher number means companies more easily convertible to more sustainable and ethical productions | ISTAT | + |
| Number of artisan companies/10,000 inhabitants | higher number means companies more easily convertible to more sustainable and ethical productions | Chamber of Commerce FVG Region | + | |
| Number of organic farms/10,000 inhabitants | higher number means more attention to agriculture on issues also present in DES; moreover, they are often among the promoters of the creation of DES | ISTAT | + | |
| Organic Utilized Agricultural Area (UAA) /Total UAA | higher percentage means more attention to agriculture on issues also present in DES | ISTAT | + | |
| Number of organic transformation firms/10,000 inhabitants | higher number means more attention of producers towards issues also present in DES | Forum Beni Comuni 3 | + | |
| Livestock units (LSU)/10,000 inhabitants | higher number means more aptitude of the territory for short supply chains and food sovereignty | ISTAT | + | |
| UAA / municipality inhabitants | more UAA per person means propensity to food sovereignty and short supply chains | ISTAT | + | |
| UAA /municipal area | more SAU per km² means propensity to food sovereignty and short supply chains | ISTAT | + | |
| Number of farms with UAA <10ha/10,000 inhabitants | The higher this number is, the greater is the aptitude of the territory for short supply chains and food sovereignty | ISTAT | + | |
| Average farm size | The lower this number is, the greater is the aptitude of the territory for short supply chains and food sovereignty | ISTAT | - | |
| Number of branches of local and ethical banks/10,000 inhabitants | The higher this number is, the greater is the presence on the territory of forms of finance more compatible with the principles of solidarity economy (Ethic Banks and Cooperative Credit Banks) | BBC FVG and Banca Etica 4 | + | |
| Economic Consumption | Number of solidarity purchasing groups/ 10,000 inhabitants | The higher this number is, the greater is the aptitude of the territory for short supply chains | Forum Beni Comuni | + |
| Number of farmers markets/10,000 inhabitants | The higher this number is, the greater is the aptitude of the territory for short supply chains | Coldiretti FVG 5 | + | |
| Number of farms with sales/10,000 inhabitants | The higher this number is the greater is the aptitude of the territory for short supply chains | ISTAT | + | |
| Environment | Protected natural areas/municipal area | The higher this number is, the greater is the attention to environmental issues by the population and the authorities that have created and promoted those areas | FVG Data Base | + |
| Municipal waste per capita/year | The higher this number is, the lower is sustainability and attention to consumption by the population of that territory | ARPA FVG 6 | - | |
| Separated waste/municipal waste | The higher this number is, the higher is sustainability and attention to the waste produced by the population of that territory | ARPA FVG | + | |
| Number of photovoltaics systems/10,000 inhabitants | The higher this number is the greater is attention of the population to renewable energy, an issue related to solidarity economy | GSE 7 | + | |
| Number of youth centers/10,000 inhabitants | The higher this number is, the greater is the interest by different institutions towards children and young people, and relationships among the younger population | FVG Data Base | + | |
| Number of information centers for youth/10,000 inhabitants | The higher this number is, the greater is the interest by different institutions towards children and young people | FVG Data Base | + | |
| Common properties area/municipal area | The higher this number is, the closer are the relations between the inhabitants and the territory where they live | FVG Data Base | + | |
| Number of virtuous festivals/10,000 inhabitants | The higher this number is the greater is the interest of the organizers on issues such as use of local products, waste reduction and energy savings | Lega Ambiente FVG 8 | + |
Note: 1 ISTAT, Italian National Statistics Institute; 2 This information is available at Friuli Venezia Giulia Region data base; 3 Forum beni comuni (FBC) del FVG is an informal network which promotes the development of ethical economy and environmental consciousness; 4 BBC are Cooperative Credit Banks; Banca Etica is an Italian ethical bank; 5 Coldiretti is a farmers’ trade association of Italy; 6 ARPA is the Environmental Protection Agency of the Friuli Venezia Giulia Region; 7 GSE, Energy Services Group; 8 Legambiente is an Italian environmental NGO.
Table 2.
Summary of normalization methods used in the analysis.
| Method | Equation |
|---|---|
| Ranking | |
| Standardization | |
| Rescaling | |
| Distance to the maximum |
Source: Own calculations.
Table 3.
Spearman correlation between normalization methods with two system of weights.
| Normalization Method | Equal Weights | Expert Weights |
|---|---|---|
| Ranking vs Standardization | 0.650 | 0.668 |
| Ranking vs Rescaling | 0.639 | 0.660 |
| Ranking vs distance to the max | 0.639 | 0.674 |
| Standardization vs Rescaling | 0.965 | 0.969 |
| Standardization vs distance to the max | 0.967 | 0.971 |
| Rescaling vs distance to the max | 0.990 | 0.994 |
Source: Own calculations.
Table 4.
Uncertainty measure: the average shift.
| Standardization Method | Equal Weights | Experts Weights |
|---|---|---|
| Ranking | 36.37 | 36.41 |
| Standardization | 8.03 | 10.05 |
| Rescaling | 6.57 | 7.38 |
| Distance to the maximum | 7.32 | 7.90 |
Source: Own calculations.
Table 5.
Final ranking of the top 5 and bottom 5 municipalities with the TUM to which they belong.
| Top 5 | ||
| Rank | Municipality | TUM |
| 1 | Dolegna del Collio | Alto Isontino |
| 2 | Cimolais | Dolomiti Friulane |
| 3 | Vivaro | Dolomiti Friulane |
| 4 | Camino al Tagliamento | Medio Friuli |
| 5 | Coseano | Collinare |
| Bottom 5 | ||
| Rank | Municipality | TUM |
| 214 | Monfalcone | Basso Isontino |
| 215 | Lignano Sabbiadoro | Bassa Friulana Occidentale |
| 216 | Muggia | Giuliana |
| 217 | Clauzetto | Dolomiti Friulane |
| 218 | Trieste | Giuliana |
Source: Own calculations.
© 2019 by the authors. Licensee MDPI, Basel, Switzerland. This article is an open access article distributed under the terms and conditions of the Creative Commons Attribution (CC BY) license (http://creativecommons.org/licenses/by/4.0/).
Share and Cite
MDPI and ACS Style
Piani, L.; Pagani, L.; Ellero, G.; Zanarotti, M.C. Empirical Evaluation of Vocation to Solidarity Economy Using Composite Indicators. Sustainability 2019, 11, 3910. https://doi.org/10.3390/su11143910
AMA Style
Piani L, Pagani L, Ellero G, Zanarotti MC. Empirical Evaluation of Vocation to Solidarity Economy Using Composite Indicators. Sustainability. 2019; 11(14):3910. https://doi.org/10.3390/su11143910
Chicago/Turabian StylePiani, Lucia, Laura Pagani, Giulio Ellero, and Maria Chiara Zanarotti. 2019. "Empirical Evaluation of Vocation to Solidarity Economy Using Composite Indicators" Sustainability 11, no. 14: 3910. https://doi.org/10.3390/su11143910
Note that from the first issue of 2016, this journal uses article numbers instead of page numbers. See further details here.