Article

Indoor Thermal Comfort Improvement through the Integrated BIM-Parametric Workflow-Based Sustainable Renovation of an Exemplary Apartment in Seoul, Korea

by
Fabrizio M. Amoruso
1,
Udo Dietrich
2 and
Thorsten Schuetze
1,*
1
Department of Architecture, College of Engineering, SungKyunKwan University, 2066 Seobu-ru Jangan-gu, Suwon-si 440-746, Korea
2
Department of Building Physics, HafenCity University, Ueberseeallee 16, 20457 Hamburg, Germany
*
Author to whom correspondence should be addressed.
Sustainability 2019, 11(14), 3950; https://doi.org/10.3390/su11143950
Submission received: 26 May 2019 / Revised: 8 July 2019 / Accepted: 13 July 2019 / Published: 20 July 2019
(This article belongs to the Special Issue Sustainable Habitat)

Abstract

:
Apartment buildings are the most common housing typology in South Korea. The mass construction of apartment neighborhoods during a period of rapid economic growth (1970–1997) involved the minimization of material use and quality, as well as industrialized construction processes. Accordingly, apartment buildings require essential renovation after only 20 years of operation. This study focuses on the improvement of thermal comfort for the renovation of an exemplary apartment building based on an integrated Building Information Modeling (BIM) and parametric software framework. The existing apartment was reconstructed with BIM software, and the virtual model was utilized for a parametric building energy simulation to calculate the thermal comfort condition of occupants during the entire year. The thermal comfort analysis results defined the criteria for the development of an enhanced building envelope system characterized by modular panels. The parametric energy simulation was executed for the renovated apartment condition with the enhanced envelope system, and the thermal comfort improvements were quantified by comparing the results for the apartment condition before and after renovation. This study aims to provide the tools and criteria for the comfort analysis of apartment occupants, as well as propose sustainable solutions for the improvement of thermal comfort in aged buildings with similar conditions, internal distribution, and construction components.

1. Introduction

The construction of apartment neighborhoods on a massive scale in South Korea began with the start of the “Han River miracle” (1968–1997) [1], the rapid economic growth initiated after the Korean War that elevated the country from a condition of poverty and external economic support to industrialization and a service-based economy [2]. During the period of rapid economic growth, a multitude of national policies were developed to address the shortage of housing for the population displaced after the end of the Korean War [3]. However, public reforms aimed at solving the housing shortage would in parallel aim to support the private construction business to foster economic growth, with the increasing liberalization of the real estate market [4]. As such, housing in South Korea would become both a necessity for society and the public authorities, and an opportunity for speculation by the private sector [5]. The typology of the apartment building was accordingly developed to minimize construction times, and maximize profits [6]. The common apartment layout, originally developed at the end of the 1960s, is based on the traditional Korean house, the Hanok [7], with multiple apartment units stacked on top of one another for more than 15 floors using reinforced concrete construction [8]. The layout and structural system in reinforced concrete were used to increase the amount and facilitate the mass construction of apartment buildings in a short time span. The use and quality of construction materials for the realization of apartment buildings was minimized to reduce building costs [9]. Strategies aimed at the maximum reduction of construction materials for apartments have also been supported by the lack of regulations in terms of building insulation, the regulations for which were only introduced in 1987 [10]. Accordingly, the quality of apartments in South Korea built since the 1960s is relatively poor, causing apartment buildings to require integral renovation of the building envelope and technical systems after only 20 years [11,12]. The constant deterioration of the housing stock in South Korea is further exacerbated by the high number of apartment buildings constructed during the period between 1968 and 2016, when 10 million apartment buildings were constructed. Approximately 50% of all South Korean households live in apartments, 40% of which have been in operation for more than 20 years [13]. In just the period between 2005 and 2012, the percentage of apartment buildings in operation for more than 20 years rose steadily from 15.2 to 32.4% [14]. Accordingly, by the end of 2020, the number of aged apartment buildings in South Korea will greatly increase, as a substantial share of apartment buildings has been realized between 1990 and 2000 (3.603 million apartment buildings, 44% of the housing stock as of 2010) (Figure 1) [15].
In the early 2000s, the historical purpose of the national policies and plans to provide housing coverage for all Korean households was fulfilled [17]. Accordingly, demand for residential buildings declined, and speculative initiatives, as well as redevelopment initiatives aimed at demolishing existing apartment neighborhoods and replacing them with new residential complexes with an increased number of unit floors and rent prices (the so-called Joint Redevelopment Initiatives [18]), were less effective in producing profits [19]. The decline of the real estate market, also due to the Asian financial crisis of 1997, aligned with a change of national policies towards a more sustainable economy [20]. In 2004, the South Korean Government started the “Low-Carbon Green Growth” [21] plan for the reduction of Greenhouse Gases (GHG) across all economic sectors. The plan foresees the reduction of 30% of GHG emissions from the South Korean productive industry by 2030 [22]. For the construction sector, the legal limits to the energy demand for the operation of new building projects have been consistently and progressively reduced by lowering the admitted U-values of construction components and the building envelope. Furthermore, all new public and 60% of private buildings will have to reach the zero energy standard by 2025 [23]. Additionally, the Green Growth plan foresees the construction of 1 million “green houses” by 2020 [24].
The directives contained in the Green Growth plan do not specifically address the concern of raising the wellbeing of building occupants. The main purpose of initiatives aimed toward the development of sustainable architecture in South Korea are tailored to reaching a gradual and substantial reduction of building energy consumption, without developing both design and assessment criteria for the improvement of thermal comfort in residential buildings. Furthermore, the analysis of the apartment building types being constructed from 1968 to the 2010s shows a conservative tendency with the construction of the same apartment layout types, which allow spatial features such as enclosed decks and internal buffer zones to be preserved as constant characteristics in projects of both new and aged apartment buildings [25]. Accordingly, the impact of the standard apartment configuration on users’ behavior and thermal comfort remains unchanged. Furthermore, the widespread use of the ondol [26] floor heating system, a traditional feature of Korean dwellings developed for traditional Hanoks and imported into modern apartment buildings, contributes to the perpetuation of the same dynamics in terms of user behavior in reducing thermal discomfort through the utilization of technical heating and cooling systems. Accordingly, the reduction of the building envelope’s U-value foreseen by successive amendments of the Housing Act in South Korea can only have limited effect on reducing energy consumption in apartment buildings, as well as on increasing the thermal comfort of apartment dwellers.
The analysis of international literature on the research subject of quantifying the effect of building renovation concentrated mainly on energy efficiency and the reduction of heating and cooling loads through building renovations and building envelope improvements [27,28]. Research results from the analysis of indoor comfort improvement by building envelope renovation with a modular system provide design parameters based exclusively on specific indicators, omitting an integrated design approach [29]. Integrated studies on the increase of buildings’ indoor comfort and energy-efficiency concentrate on case studies of new constructions. Such studies provide no solutions for renovations and the development of construction components on the basis of indoor comfort and energy efficiency-related parameters [30]. Recent research efforts in the field of the simulation analysis of thermal comfort in the Korean apartment separately address the impact of hybrid as well as natural ventilation systems [31,32] and technical cooling and heating on occupants’ wellbeing during different seasons of the year [33,34]. In particular, the research literature proposing solutions to alter the indoor temperature of apartment units and increase occupants’ thermal comfort concentrates on evaluating the use of active systems, such as blinds and interior shading systems [35]. Additionally, the implementation of improvement measures for the outdoors in apartment neighborhoods decreases the effect of the urban heat island on indoor comfort [36]. Accordingly, a more comprehensive approach, taking into account mandated legal requirements for a lower building envelope U-value in existing constructions and producing sustainable buildings in both social and technical terms, is yet missing. Furthermore, both simulation-based and statistical studies do not concentrate on individuating the causes of lower thermal comfort in apartment buildings but focus on providing an assessment of the status quo of apartment dwellers’ thermal comfort. Accordingly, the relation and causality between energy consumption for technical heating and cooling and thermal comfort is not investigated. The existing studies do not discuss solutions to reduce energy consumption for technical heating and cooling or increase thermal comfort through the use of passive strategies and the correction of user behavior through the alteration of the building envelope and apartment unit standard layout. Recent studies have investigated the relation between different apartment building typologies and the cumulative solar radiation received according to their orientation. Previous studies are focused on identifying specific features in residential constructions that could maximize passive solar gains [37]. However, no study has yet discussed the influence of passive solar gains on building comfort. In particular, solutions to take advantage of the higher solar exposure of apartment units in residential buildings to increase comfort are missing.
This study provides an assessment and design framework for the individuation of comfort issues and their causes in apartment buildings, and its application to an exemplary apartment building located in Seoul. The BIM-parametric renovation framework allows the definition of environmental and building construction-related variables that both directly and indirectly influence the indoor thermal comfort of apartment buildings’ occupants. The building energy parametric simulations allow the influence of environmental variables, such as solar gains from sun exposure and heat losses/gains due to ventilation through window openings on the indoor thermal comfort of apartment building occupants, to be quantified. Additionally, user behavior through the setting of operative schedules defines a further criterion to assess thermal comfort in realistic conditions. Accordingly, thermal comfort defines an important aspect that determines the development of the enhanced building envelope, influencing parameters such as the insulation thickness and the g-value of windows components in the modular panels of the enhanced envelope system. The simulation of the energy requirements and the analysis of the thermal comfort of occupants after the installation of the enhanced building envelope system on the existing construction allow calculation of the increase in comfort of apartment building dwellers. Comfort analyses executed on the renovated apartment establish a direct connection between the reduction of energy for technical heating and cooling and indoor thermal comfort. The iterative process of the BIM-parametric renovation framework provides the possibility of weighing the impact of multiple renovation solutions on thermal comfort. Therefore, the renovation framework establishes thermal comfort as a relevant and quantifiable element to be considered in the development of refurbishment projects for a wide range of buildings in South Korea and Asia. The BIM-parametric renovation framework reduces the time and cost involved in the development of renovation solutions, as it operates on changeable variables, and does not require the simulation models to be rebuilt for each renovation variant. Furthermore, the BIM-parametric renovation framework allows a realistic analysis on the existing comfort condition of apartment dwellers to be conducted. The renovation framework takes into account environmental variables based on the statistical climate data of the apartment location. Accordingly, the results of environmental and energy simulation are improved in accuracy and allow the development of more successful renovation projects by addressing specific issues with tailored cost-effective solutions. Therefore, this research presents an effective method for the renovation of aged buildings through an enhanced BIM-building parametric simulation integrated design framework. This framework facilitated a comprehensive and integrated analysis of the building performance regarding service energy demand, as well as visual and thermal comfort. The case study analyzed demonstrates the effectiveness of the framework and identifies potential improvements to the development of BIM-parametric software integrated renovation design development. The BIM-parametric integrated framework allows controlling and dimensioning the design of building components directly through accurate building simulations, improving the efficiency of the digital-to-realization chain of renovation projects.

2. Materials and Methods

2.1. Description of the BIM-Parametric Integrated Building Renovation Framework and Simulation Processes

The virtual reconstruction of the exemplar apartment analyzed in this study and the comfort simulations and analyses executed for both its existing and renovated states have been executed through the BIM-parametric renovation framework that has been described by the authors in previous studies [38,39]. Construction data and plans relative to the exemplary apartment building analyzed have been retrieved from the survey of the existing structure, and from literature on the history of housing in South Korea. The exemplary apartment has been reconstructed using the BIM software (s/w), Autodesk Revit [40]. The BIM software allows the existing apartment building detail to be reproduced in full detail in a 3D-environment through the use of building component families. Revit families are virtual entities that contain both the geometries and construction data of specific building components, such as the layer of composition of walls, windows, and roof elements. Families can be reutilized in other BIM projects for building with similar construction features accordingly, allowing a virtual library of building elements to be built. Figure 2 shows the overall workflow of the BIM-parametric renovation framework, together with the specific software utilized for each phase.
Construction geometries generated in the BIM software are exported to the Computer-Aided Design (CAD) s/w Rhinoceros SR5 [41] through the ACIS.sat format export capabilities of the BIM software. Construction data of the families exported to Rhino are saved in spreadsheet format using the export tools of Revit and are imported into the data elaboration s/w Microsoft Excel. The environmental simulation and analysis of the exemplary apartment building and the energy simulation and the comfort analysis of a reference apartment unit in the residential compound are executed in Rhinoceros using the parametric plug-in Grasshopper [42] and the compatible Ladybug tools [43]. The Ladybug tools include a series of components (called Ladybug and Honeybee) that execute a double function: environmental simulation and analysis of buildings using parametric coding and CAD geometry generation, and export of construction data to environmental and energy simulation free software from renown research institutions. Accordingly, a preliminary analysis of solar radiation and climate is executed on the existing building through the Ladybug components by exporting data to the program Radiance [44]. Therefore, construction data exported from Revit to Excel are imported into Grasshopper using the component Bumblebee [45], and the components of Honeybee are used to construct a virtual energy simulation model to be exported to the s/w Energyplus [46] and Openstudio [47] for the energy simulation of a reference apartment unit in the building. Energyplus allows the thermal transfer coefficient of building components to be calculated according to the thermal resistance of each assembly material layer and the interior and exterior surface film resistance. For the calculation of window components’ U-values (cumulative value for both window glazing and frame systems) and g-values, the software Window 7.4 [48] has been utilized. Subsequently, Energyplus calculates the required technical heating and cooling energy demand for an apartment according to operative schedules the calculated thermal properties of construction materials and the relative construction data defined in Revit. The results from the energy simulation include the indoor mean radiant, operative, and air temperatures of single zones in the apartment unit model, as well as humidity values, solar gains, and heat losses for a given period of time. The results from the Energyplus simulation are exported back into Grasshopper, and the Ladybug components are utilized to conduct a comfort analysis of the apartment unit simulated for the entire year, and to calculate the amount of comfort hours per year for apartment unit occupants according to specific comfort predictive models. The Ladybug tools allow the building of graphical comfort maps of the apartment units analyzed, showing the comfort rate of specific zones in the unit according to temperature, humidity, and energy values calculated in the Energyplus simulation. Together with data from the energy and daylight simulation part of the BIM-parametric renovation framework, the resulting observations from the comfort analysis are used to develop an enhanced building envelope system made of modular panels. The corresponding energy simulation for the renovated condition of the reference apartment unit is executed, and new temperature data produced, which accordingly is used to produce a new simulation of indoor comfort. The comfort analysis results from the existing and renovated apartment conditions are compared to quantify the improvements in terms of indoor comfort. Comfort improvement is calculated in terms of percentage increase of comfort hours for the apartment rooms.
For the execution of the reference apartment’s comfort analysis within the case study building, the following climatic and operational data for the heating and cooling systems have been utilized:
(1)
Energyplus Weather (EPW) data for the climate zone Seoul retrieved the Ladybug tools database of weather files for world cities. The climatic data includes, e.g., outside dry bulb temperature, mean radiant temperature, global radiation and wind speed.
(2)
Construction data for the building components of Korean apartments defining the materials utilized in common apartment buildings, their relative position in the envelope layers, and their quantities/thickness.
(3)
Operative schedules for technical heating and cooling systems (see Section 3.3) and relative preferential heating and cooling set-point temperatures for Korean apartment dwellers retrieved from the existing literature.
(4)
Ventilation schedules defined by the standard Energyplus library of schedules for mid-rise apartment buildings. The ventilation schedules have been altered for the case study of the reference apartment unit analyzed in this study to reflect changes in the opening of windows and natural ventilation due to local external and internal agents. External and internal agents include traffic particulate concentration, external temperatures, wind intensity and direction, as well as the spatial configuration of the apartment (enclosed decks on the south- and north-oriented façades, as well as window sizes).
The adaptive comfort model described in the standards ASHRAE 55 2007 [49] and EN 15251 2007 [50] has been adopted to execute the comfort analysis of the reference apartment unit in the exemplary building. EN 15251 2007 comfort Class II has been utilized for the comfort analysis of the indoor spaces in the reference apartment unit analyzed. Accordingly, the target comfort temperatures set by the adaptive comfort models in winter lie in the ranges 20–24 °C for winter, and 20–26 °C for summer. According to the standard EN 15251 2007 comfort Class II, indoor temperatures are considered comfortable if the maximum variation from the target temperature set is ≤ ±3 °C.
The adaptive model has been preferred for the indoor comfort analysis over the more commonly used Predicted Mean Value (PMV)/Percentage of People Dissatisfied (PPD) method [51], as ventilation in the apartment building analyzed is executed both through natural means (i.e., the opening of windows and the introduction of external air), and technical cooling units. However, the adaptive comfort model described in EN 15251 2007 and ASHRAE 55 2007 is based on the assumption that only passive means are employed by users to naturally heat and cool indoor spaces. Nevertheless, a number of recent studies [52,53,54,55] support the adoption of hybrid adaptive comfort models in building simulations, if specific adjustments are introduced into the model for comfort evaluation, and comfort target temperatures are altered according to the use of both passive and active methods for heating and cooling. Accordingly, a 0.7/0.3 ratio between natural ventilation and technical heating and cooling has been established, to adjust the adaptive comfort model in the Ladybug component. The hybrid comfort model ration between natural ventilation and technical heating and cooling has been calculated as the average amount of time per day, when technical heating and cooling is effectively activated to alter the indoor comfort condition in comparison with natural ventilation executed through windows, including a correction factor defined by increased user intervention to reach indoor comfort with passive strategies, as opposed to active technical solutions.
The visualization of the comfort analysis for the reference apartment unit in the exemplary building analyzed consists of three different graphs:
(1)
Adaptive comfort graph for four selected rooms in the apartment unit: a comfort graph is generated by plotting hourly indoor temperature values against outdoor temperature values in a graph showing the comfort area allowed by the adaptive comfort model EN 15251 Class II adjusted for mixed active and passive heating and cooling systems. Accordingly, hourly values for indoor temperatures falling inside the marked comfort area in the graph are considered comfortable, whereas values lying outside the marked comfort areas are considered uncomfortable. The graph allows the amount of comfort hours per year in specific zones of the apartment unit analyzed to be calculated and specifies which association between indoor and outdoor hourly temperatures results in uncomfortable conditions.
(2)
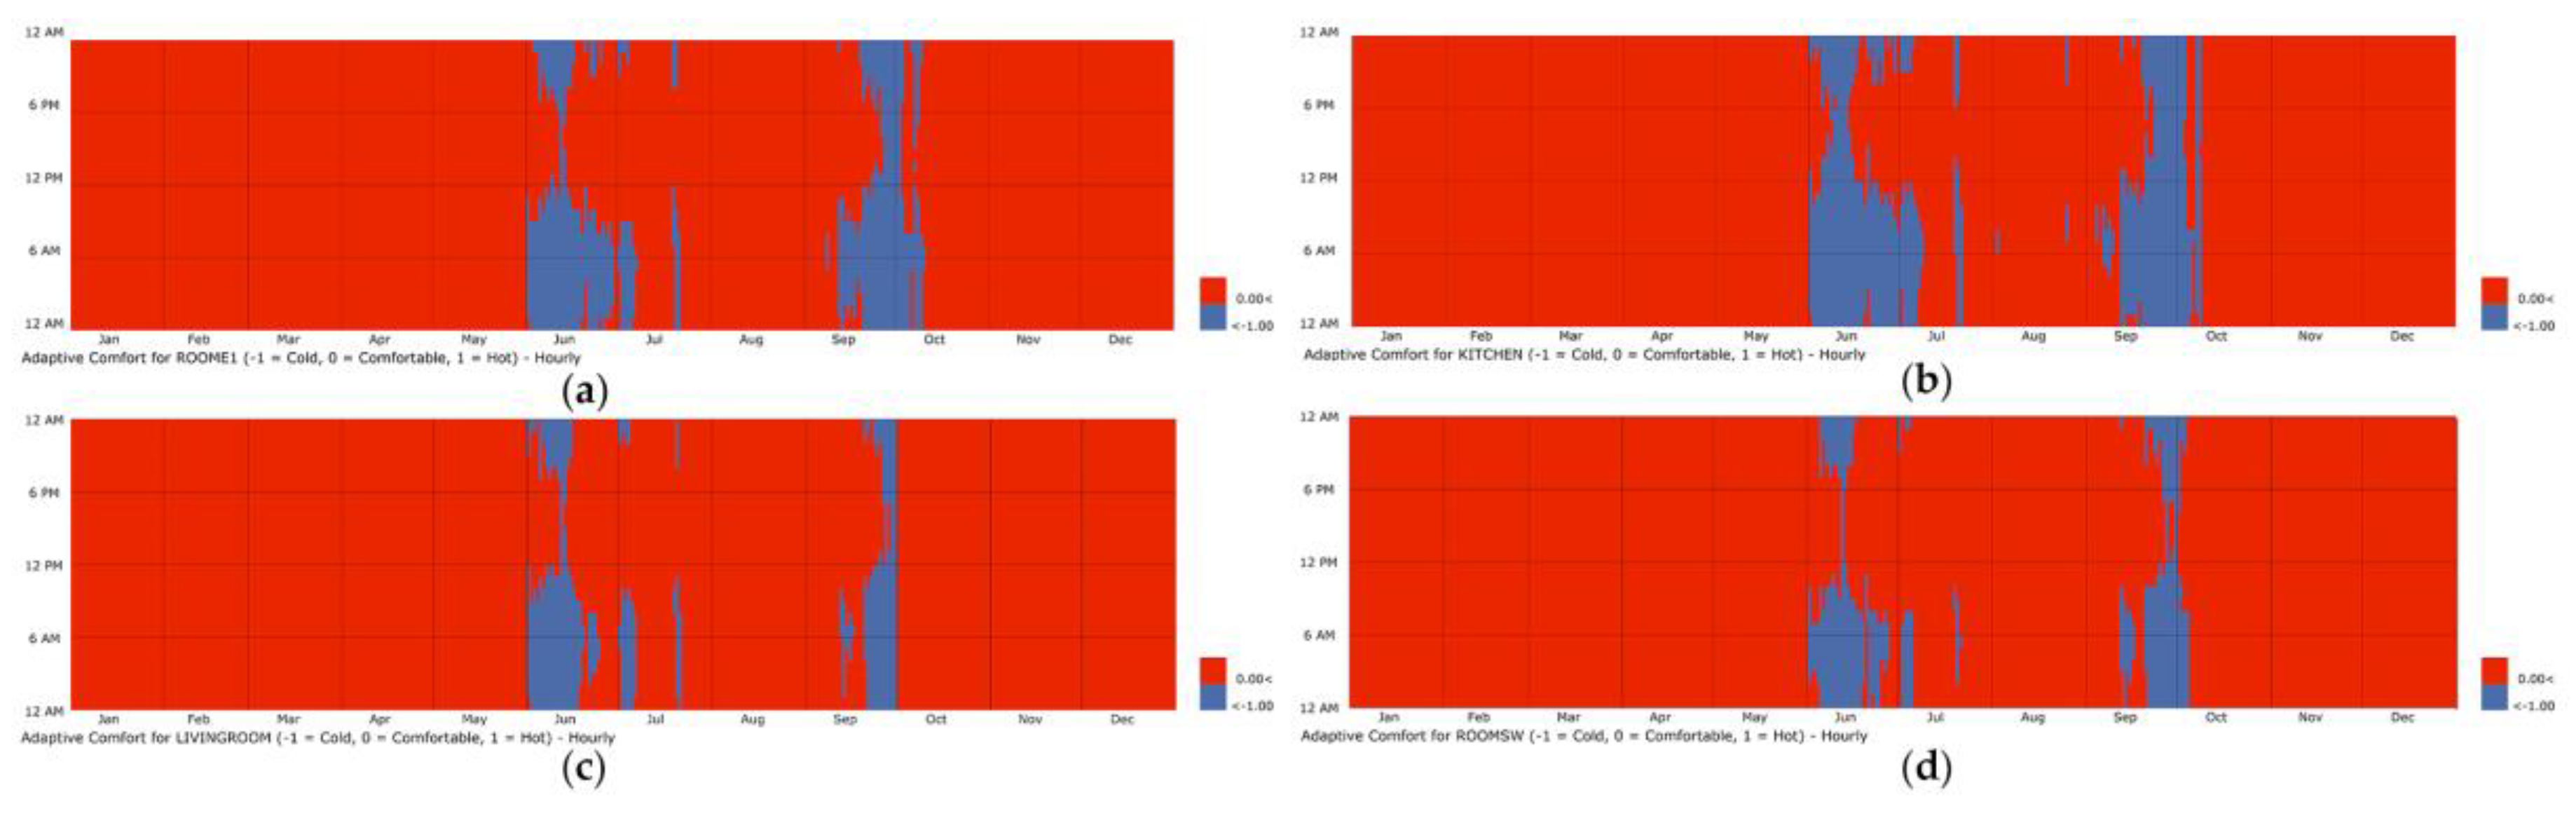
Comfort chart of single reference zones in the apartment: the comfort chart shows the comfort condition of apartment’s occupants for each hour of the year (chronologically sorted from 1 January to 31 December), with a color map ranging from (−1 to +1) (too cold to too hot). Values showing a comfort index of 0 are considered comfortable. The comfort chart allows which hours in the year are uncomfortable for the apartment occupants to be identified.
(3)
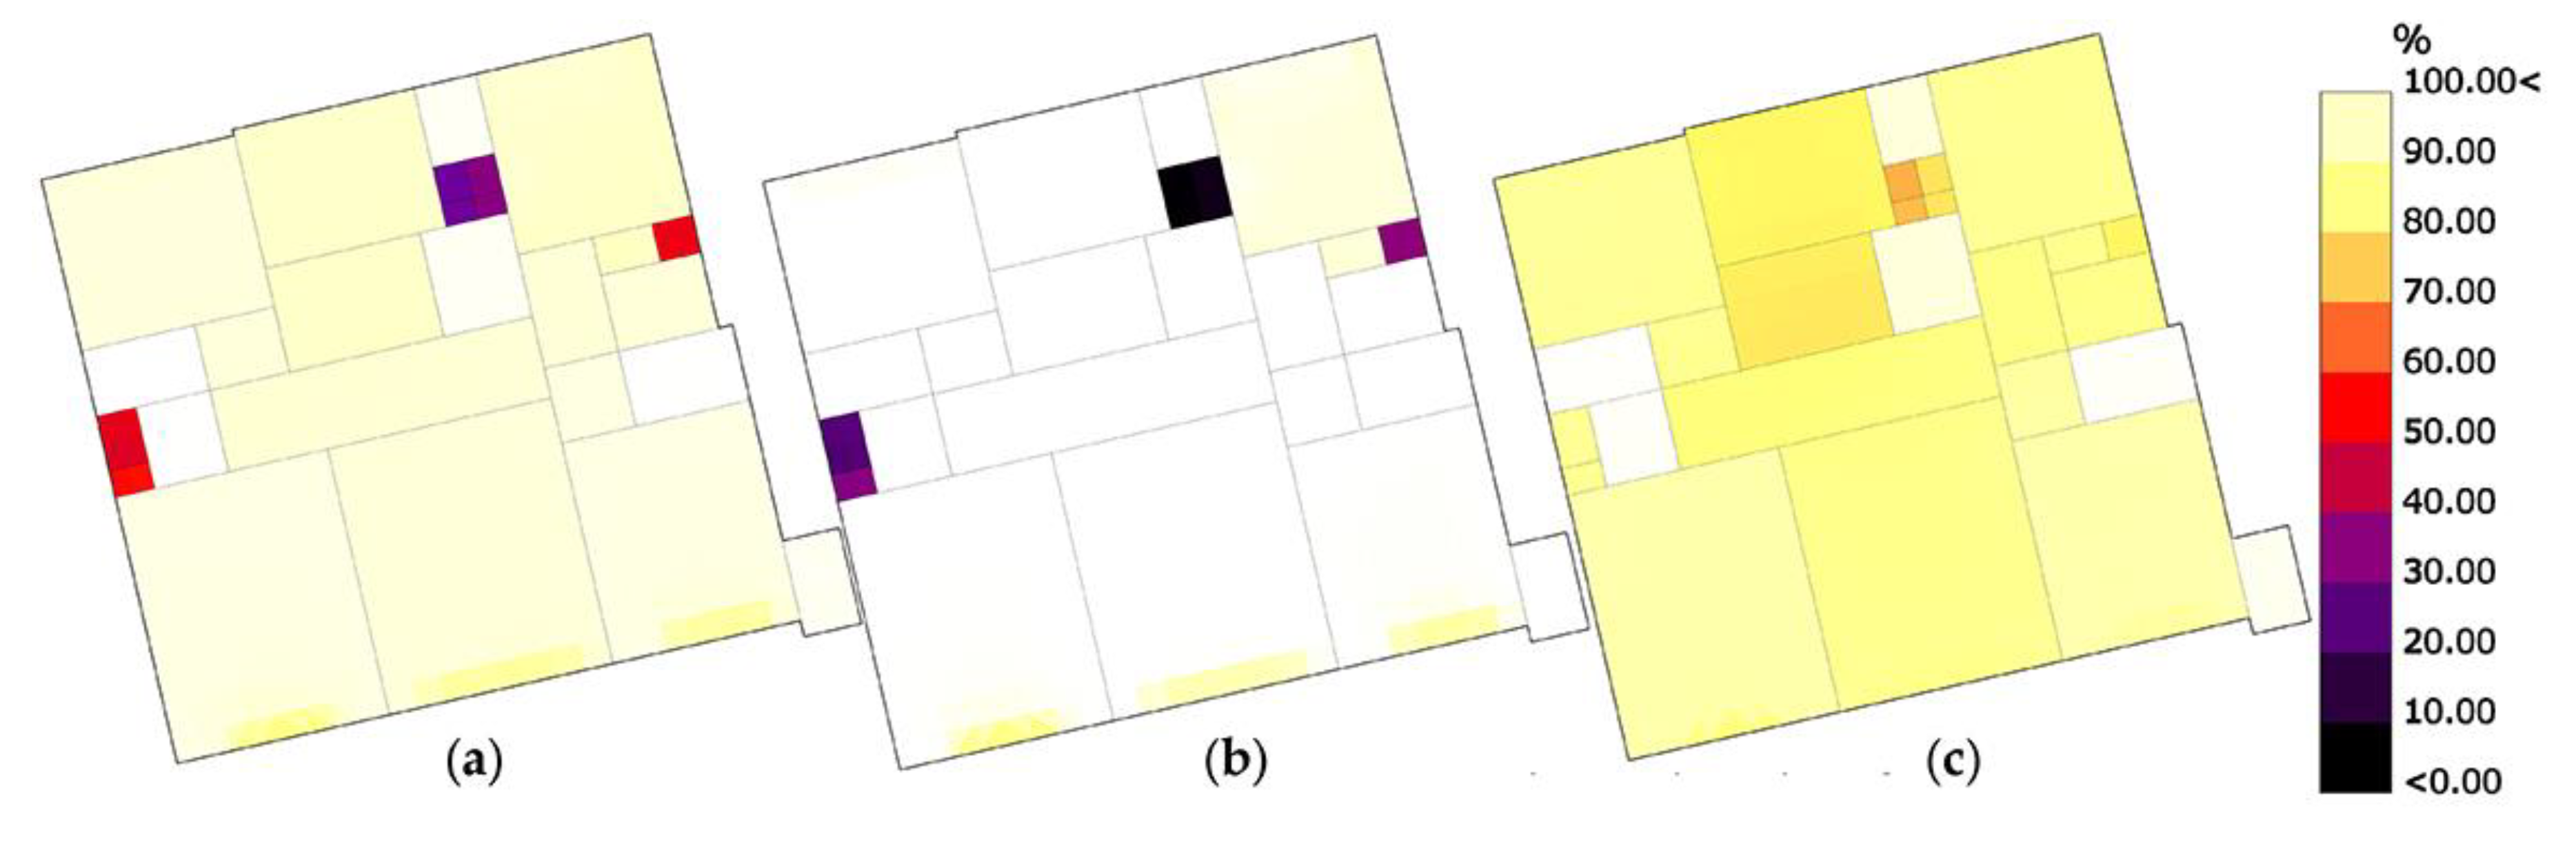
Comfort map of the entire apartment for selected periods of the year: a comfort map showing the comfort hours for single subdivision of all apartment zones during specific selected periods of the year provides further insights into which areas of the apartment are more comfortable during the different seasons or particular time ranges. The subdivision of the apartment floor space in single 1 m × 1 m areas allows dependencies between indoor comfort and factors related to orientation and building components in the apartment to be determined, such as window g-values and extension, and the connection of apartment zones.

2.2. Simulation Model and Parameter Data Sources and Calibration

The simulations for the improvement of the reference apartment unit are developed on the basis of parameters controlling the energy and comfort performance of buildings. Building parameters include the construction components’ thermal and optical properties, as well as user-defined operative and behavioral schedules for ventilation, heating, and cooling, including preferred set-point temperatures. The retrieved construction and operation data and the utilized simulation model development methods were used for the calibration of the virtual building model. A complete calibration of the simulation model and evaluation of its accuracy requires the comparison between results from the simulation of the building energy demand and available energy consumption data of the reference building [56]. As much as possible, original data of the existing building has been utilized in the composition of the virtual model and the simulation program. However, required data has also been generated by alternative methods because energy consumption data and building plans for the case study building and comparable South Korean construction projects were not available. The alternative methods include the definition of schedules according to required comfort standards and development of schedules based on the analysis of external and internal agents in the neighborhood. Furthermore, the apartments size has been defined based on the average size of South Korean households. Relevant parameters for the construction of the virtual building energy and comfort simulation model and the data sources are listed in Table 1. The references for data sources are included in Section 3, Results.
The correct calibration of building simulation models requires a comparative quantitative analysis of the Mean Bias Error between the effective building energy consumption, as well as comfort data, and the building energy simulation and comfort analysis results. However, since real energy consumption and indoor comfort analysis data for the existing building were not available, a comparison between simulation results and a statistical pool of same-age buildings has been executed. The comparison has been executed for building energy consumption data for heating; including comfortable temperature set points and building envelope composition. Results from a previous study on the reduction of energy demand show a comparably low discrepancy (+20%) between the reference apartment unit simulation results and the average heating energy consumption of a statistical pool of 189 apartment buildings constructed between 1976 and 2000. Furthermore, a low discrepancy for the historical average energy demand (approximately +2%) for buildings built in the same period (between 1987 and 1995) was identified [38,57]. However, due to the prevalence of the PMV/PPD indoor comfort analysis model in studies regarding South Korean apartment buildings, a direct comparison between comfort analysis data and simulation results employing the adaptive comfort model was not possible. Furthermore, the comfort analysis executed for this study takes into account multiple sources of discomfort and the intervention of users for the analysis of indoor comfort. Accordingly, the individuation of sources for discrepancies between potential existing comfort data and the analysis of simulation results would require data about user-defined and behavioral schedules for ventilation, occupation, as well as heating and cooling set-points. Such data was not available but it was possible to effectively quantify the increase in comfort hours for the renovated in comparison with the existing apartment unit. This quantification facilitated the definition of an average improvement ratio.

3. Results

3.1. Construction Components Characteristics and BIM Virtual Reconstuction of the Exemplary Apartment

The existing exemplary apartment building selected for the development of the enhanced building envelope system for the renovation of aged housing in South Korea is located in the Gireum neighborhood of Seoul, in the northeastern district of Seongbuk (Figure 3).
The apartment building analyzed is identified with plot number 103 (hence called “building 103”), being part of a complex of four other apartment buildings constituting the Sambu apartment complex realized in 1992 [58]. The apartment complex is positioned in the middle of a relevant infrastructural connection and commuting node between the center of Seoul and the northeastern residential districts of the city. It is positioned in the central depression between a northern and a southern hill, at 25 m horizontal distance from the 20 m vertically elevated platform of the Naebu (Korean for “central”) Expressway.
Data on the construction system of building 103 and the specific construction composition of its components has been retrieved through in situ surveys, and by analyzing common features of contemporary apartment buildings in South Korea through an extensive review of the existing literature [16,58] and real-estate property catalogues, as well as regulations in terms of building insulation [59]. Accordingly, the building analyzed corresponds to the common and standard apartment typology constructed between the 1968 and the 2000. The apartment building presents a reinforced concrete structure that incorporates three elevator shaft/staircase core units, each connected to two apartment units on the left and right. There are six apartment units per floor, and a total of 15 apartment units per floor. The height of each floor is 2.50 m, while the ceiling height is 2.30 m. The central elevator shaft/staircase core units extend over the building roof for two floors, where the elevator machine room and water tank are positioned.
Figure 4 shows the BIM reconstruction of building 103. The main apartment unit module repeated throughout all 15 floors of building 103 is a standard 42 pyeong (Korean measuring unit for floor space consisting of 3.035 m2), for approximately 132 m2 gross area and 108 m2 usable floor space. The standard apartment unit presents four bedrooms surrounding a central space that is defined by the connection between the kitchen and the living room. On the south-oriented side of the apartment unit, an enclosed deck is positioned in front of both the living room and the bedrooms. An enclosed deck is also positioned in front of the northwest-oriented bedroom. Figure 5 shows the BIM reconstruction of the existing standard apartment unit in building 103, and the original plans retrieved from property catalogues from realtors.
Through analysis of the building construction, specific layers for components of exterior and interior walls, roof, and basement could be identified with a specific degree of certainty. The respective U-values of the building components have been calculated using the Honeybee components of the Ladybug tools. Accordingly, the survey of building 103 allowed information on the composition of the window systems and the degree of soiling to be retrieved, allowing both the U-values and transmittance indexes (g-values) of windows to be calculated. Table 2 provides an overview of the specific composition of the building elements and their respective U-values (for both building components and windows) and g-values (for windows).

3.2. Building Envelope Annual Cumulative Radiation Analysis and Selection of the Reference Apartment Unit

A reference apartment inside the exemplary apartment building has been selected to conduct the analysis of indoor comfort for building 103. The annual cumulative radiation analysis of the building envelope has been executed to provide comfort data that could describe the average condition of all apartment units inside building 103. Solar gains influence the amount of energy required for technical and passive heating and cooling, affecting operative schedules and user behavior. Accordingly, solar gain also influences the comfort condition of users in interior spaces of the apartment units. Furthermore, factors such as overheating due to the direct exposure of interior spaces to solar radiation, and differences between the local mean radiant and operative air temperature in specific zones of the apartment unit, have to be taken into account. The reference apartment unit for the execution of the energy simulation and the comfort analysis has been selected by individuating the apartment in building 103 that best presented the average cumulative radiation values for the entire year. Accordingly, the annual cumulative radiation for the building envelope has been analyzed using the Ladybug tools (Figure 6). External factors, such as self-shading and shadows from neighboring buildings, and the Expressway, have been taken into account in the parametric analysis [38,39]. Accordingly, the unit located on the 7th floor (18 m) presents the average cumulative annual radiation values and has been selected for the energy simulation of technical heating and cooling loads and indoor comfort analysis of the occupants.

3.3. Description of Operative Schedules for Building Energy Simulation

The calculations of energy loads for technical heating and cooling executed through the Energyplus simulation depend on two variables: user-defined heating and cooling set-points, and heat losses and gains through the building envelope. Additional variable Accordingly, hourly user operative schedules that define the target comfort temperature for each hour of the day have been defined for two periods of the year: winter (1 January to 31 May, and 1 October to 31 December), and summer (1 June to 30 September) (Table 3). The set-point temperatures for the heating and cooling operative schedules are defined according to the EN 15251 2007 comfort model, and the statistical analysis of the preference of apartment dwellers in South Korea in terms of heating and cooling temperatures for indoor comfort [57]. Technical heating of the apartment is executed through the use of the Korean traditional ondol floor heating system, whereas single cooling units are installed in each apartment for technical cooling during the summer period. Additionally, night and daytime ventilation is considered another means for passive cooling of the apartment during the summer period.
The energy simulation calculates the required energy to reach the specific set-point temperature according to the operative temperature schedule. Additionally, the amounts of heat losses and gains through the building envelope are measured according to three specific variables: air infiltration through discontinuities (including connection points between windows and the building construction, as well as cracks in the envelope), and through user-operated ventilation. Hourly ventilation schedules have been defined (Table 4), to measure the amount of heat losses (for winter) and gains (for summer) influencing the thermal balance of indoor spaces in the reference apartment unit analyzed by the opening of windows at particular hours of the day. The ventilation schedule assigns the percentage value of window opened for each hour for both winter and summer periods. The hourly fraction of window opened during each hour is calculated for each window of the apartment, according to the maximum openable surface for the window type defined. A maximum ratio of 50% of window areas has been set for north-oriented windows and glazing systems positioned in front of south-oriented bedrooms. Conversely, a maximum openable ratio of 30% for enclosed deck windows and glass doors between indoors and outdoors has been set. The ventilation schedule has been calculated according to the minimum airflow rate ratio for residential buildings and by taking into account levels of pollution in the neighborhood of Gireum caused by intense traffic concentration. The airflow rate has been accordingly set at a value of 0.002 m3/s, double the required minimum ventilation defined in Energyplus [60].
In addition to the temperature and ventilation operative schedules, a standard value has been set for air infiltration through the building envelope. The air infiltration value corresponds to 0.00045 m3/s per square meter façade, which according to Energyplus standards represents the amount of air filtering through the building envelope of a poorly maintained building [61].

3.4. Comfort Analysis of the Exisiting Reference Apartment Unit Condition

3.4.1. Comfort Maps for Four Representative Rooms in the Reference Apartment Unit

The Energyplus simulation executed for the existing condition of the reference apartment unit is described in detail in previous studies by the authors [38]. The energy simulation produced the relevant mean radiant, operative indoor temperatures for the zones of the reference apartment unit. Accordingly, the temperatures obtained through the energy simulation are analyzed to calculate the comfort condition of occupants according to the adaptive method following the EN 15251 2007 Class II standard. Figure 7 presents the comfort maps for four representative zones in the apartment: northeastern bedroom, kitchen, living room, and southwestern bedroom. Each of the four zones represents a specific condition of the apartment spaces, in terms of orientation, solar gains, Window-to-Wall Ratio (WWR), dimensions, function, and heat losses through other spaces of the apartment or the outdoors through the envelope. Accordingly, the analysis of the four rooms provides a good indication of the indoor comfort of occupants. Generally, occupants of the apartment experience reduced to no discomfort during the winter period, when acceptable indoor temperatures are reached through technical heating of the indoor spaces. However, during the short transition period between winter and summer (1 May to 30 June), and between summer and winter in autumn (31 August to 30 September), the amount of comfort hours is sharply reduced, due to the switching between the technical heating (ondol) and cooling (single conditioning unit) systems. The comfort analysis of the northeaster room (Figure 7a) shows the presence of discomfort hours even during the winter period, notwithstanding the activation of the heating system. The discomfort perceived during winter is due to the discrepancy in temperature between the mean radiant temperature of the interior room vertical surfaces (in particular, the window), and the air temperature of the room. In summer, building occupants perceive discomfort due to low temperatures, which is caused by the sharp variation in outdoor temperatures during June and between September and October (Figure 8), and the increased ventilation times during both daytime and nighttime. The kitchen (Figure 7b) presents an even higher amount of discomfort hours due to the low WWR of the room, with the consequent reduced amount of solar gains through the window glass, and therefore low indoor temperatures of the north-oriented space.
Additionally, both the kitchen and the living room (Figure 7c) define a central zone, where the two spaces are connected by a central glass door. Heat is dissipated easily due to the dimension of the macro-area, and the relatively high U-values of the glass-door and interior partition wall. In the living room, heat dissipation through the building structure and energy transfer to colder zones of the apartment cause higher discomfort hours in summer. Discomfort hours are also tied to both heat losses through the window glass of the enclosed deck window with high WWR, and the low solar gains caused by the presence of enclosed decks in between the indoors and the outdoors. The southwestern bedroom (Figure 7d) showed the lowest amount of discomfort hours, mostly positioned in the evening hours of June, end of September, and start of October, due to the increased ventilation and the smaller width of the enclosed deck positioned between the indoors and the outdoors. Conversely, the lower distance between the southwestern bedroom and the outdoors is also the cause of increased solar gains through the window glass during the morning, with lower discomfort hours.

3.4.2. Comfort Charts of the Reference Apartment Unit Rooms

Four rooms were selected for the comfort analysis of the reference apartment unit: the bedroom in the northeast, the kitchen, the living room, and the bedroom in the southwest. Figure 9 shows the adaptive comfort charts for the four selected rooms, which were the result of the comfort analysis according to EN 15251—mixed model EN [62]. The figure illustrates the total hours per year during which a specific indoor operative temperature corresponds with a specific outdoor prevailing temperature. The comparison of the adaptive comfort analysis of the four selected rooms unveils specific differences in comfort conditions between the north-oriented and south-oriented rooms. Discomfort in all rooms of the apartment unit was caused by temperature differences between day and night hours during the transition months in spring and autumn. Temperatures could decrease by 2–3 °C in less than 2 h between afternoon and evening. The outdoors air temperature differences between day and night result in differences between the mean radiant temperature of the building envelope interior surfaces and the indoor air temperature, particularly during the night. During early spring, at the beginning of May, and late autumn, at the end of September and beginning of October, the heating system maintained indoor air temperatures to scheduled set points. The difference between indoor air temperature and the mean radiant temperature of the building envelope interior surfaces therefore caused discomfort. Due to the high building envelope U-values, solar gains received during the day are rapidly lost during the night and can therefore not compensate for the transmission heat losses.
South-oriented rooms benefit from higher solar gains than north-oriented rooms, due to the increased exposition to solar radiation and higher WWR. However, when outdoor temperatures drop below indoor temperatures, high U-values and large glass surfaces of the windows result in considerable heat losses. Therefore, the increase of indoor temperatures in south-oriented rooms due to received solar energy was limited mainly to daytime hours. During the night, when the outdoor temperatures drops, solar gains were rapidly lost. The enclosed decks in front of south-oriented rooms and the northwestern bedroom further reduced cumulative indoor solar gains. The influence of solar gains, WWR, and window U-values on the indoor comfort can be explained by comparing the conditions of the two bedrooms in (i) the northeast, and (ii) the southwest. Both rooms had an annual comfort hour percentage of approximately 90%. The bedroom in the northwest (i) received lower solar gains due to smaller WWR and indirect solar access, due to its orientation. However, heat losses through the glazing were reduced as well, due to the small window surface. The bedroom in the southwest (ii) had higher solar and indoor heat gains. However, the heat gains were rapidly lost, due to transmission heat losses caused by the high window U-value and WWR.
The kind of connection between rooms also had a relevant impact on indoor comfort. The kitchen and the living room were the two largest rooms in the apartment unit. The kitchen had the lowest WWR of approximately 3% of all rooms and received very limited solar gains through a small window. A glass-door with a high U-value of approximately 3 W/m2K was positioned between the kitchen and the living room. Therefore, potential heat gains in the south-oriented living room were constantly transferred to the kitchen. The heat transfer increased the indoor air temperature in the kitchen, which resulted in lower discomfort hours. The living room had the highest WWR of 86% of all apartment unit rooms. Glass doors were located between the living room and the 1.60 m deep enclosed deck, as well as between the living room and the kitchen. The living room also had an open connection with the central corridor. The loadbearing walls between the living room and the southeastern and southwestern bedrooms had high U-values of 2.64 W/m2K. The U-value of non-bearing interior walls was 1.57 W/m2K and was therefore lower. The open connections and high U-values of the living room walls, windows, and doors resulted in comparable high heat losses to the surrounding rooms.
Accordingly, even though the WWR and solar gains of the living room and the kitchen were very different, the living room and the kitchen had almost the same percentage of annual comfort hours. The percentage was 85.71% in the living room, and 82.48% in the kitchen.

3.4.3. Thermal Comfort Maps for the Existing Condition of the Reference Apartment Unit

The thermal comfort maps (Figure 10) display the indoor comfort condition of occupants reached for each room of the apartment by depicting the amount of annual comfort hours in percentage for the subdivision of the indoor apartment floor space in 1 m2 tiles. The calculation of annual comfort hours is executed for the entire year (Figure 10a), winter (from 1 January to 31 May—Figure 10b), and summer (from 1 June to 31 August—Figure 10c).
The comfort analysis for the entire year (Figure 10a) shows average comfort hours of 82% for the entire apartment. In particular, the northeast and southwest-oriented bedrooms in the apartment enjoy a higher amount of annual comfort hours, due to the increased solar gains through the windows provided by the direct interface with the outdoors (northeast-oriented bedroom) and a narrower enclosed deck space (southwest-oriented bedroom). The winter period comfort analysis (Figure 10b) provides an outlook of the occupants’ comfort condition when the ondol floor heating system is operative. Since the set-point temperatures defined for the operative schedule of the technical heating system fall in the comfortable range defined by the standard EN 15251 2007 Class II, indoor comfort hours in the apartment for winter reach a 100% factor. Conversely, during the summer period (Figure 10c), a strong distinction in comfort hours can be observed between spaces directly facing the outdoors or positioned against narrower enclosed decks, and the remaining rooms in the apartment. In particular, as observed also for the annual comfort analysis, both the northeast and southwest-oriented bedrooms enjoy 80% comfort hours, due to the direct interface with the outdoor and the reduced width of the enclosed deck positioned on the southwest. Accordingly, solar gains provided by direct (for the south-oriented façade) and indirect (for the north-oriented façade) daylight penetrating through the windows during the morning hours are increased, due to the higher exposure of the bedrooms to sunlight. During the evening and night hours, the solar energy stored during the daytime allows the indoor air temperature to reach uncomfortable levels more slowly, when compared with other rooms in the apartment. Therefore, a higher amount of comfort hours is reached in both bedrooms. Conversely, the remaining spaces of the apartment show an average 67% of comfort hours during summer. In particular, the kitchen zone connecting with the living room shows the lowest amount of summer comfort hours, with a factor of 62% comfort hours. Due to lower WWR and direct connection with other apartment spaces, the kitchen obtains a reduced amount of solar gains through the window and dissipates passive solar heat more quickly to other rooms of the apartment, thus reaching lower temperatures more quickly, resulting in fewer comfort hours during summer.
A relevant aspect of the comfort condition for the existing situation in the reference apartment is the influence of the balance between WWR and solar gains on indoor thermal comfort. Comparably high differences in thermal comfort due to unbalanced WWR can be observed for the South-oriented bedrooms. In the southeastern bedroom, the lower WWR should cause lower heat losses through the window glass, and therefore increase comfort hours. However, since an enclosed deck space is positioned in front of the bedroom and the WWR is lower than for the southwest-oriented bedroom, solar gains are decreased; and, in comparison with the southwest-oriented bedroom, thermal comfort suffers lower comfort hours. Accordingly, in terms of indoor comfort, a lower WWR does not compensate for reduced solar gains. Conversely, increased heat losses through the window during the evening and night hours cause the higher WWR of the southwest-oriented bedroom. However, increased solar gains during the morning increase the comfort hours in the bedroom. Therefore, the presence of buffer spaces, such as enclosed decks, contributes to the dispersion of solar heat, lower solar gains, and reduced comfort hours in the rooms of the apartment; whereas, direct sunlight gains in the indoors can compensate for increased heat losses due to a higher window glass surface.

3.5. Apartment Renovation Strategies Defintion

The development of improvement strategies and, in particular, the definition of the enhanced building envelope system modules (Figure 11), is based on the results of the energy, comfort, and daylight analyses. For the improvement of thermal comfort, the following observations influenced the development of the improvement strategies:
(1)
Discrepancies between the mean radiant and indoor air operative temperatures: accordingly, a better performing insulation system is introduced into the enhanced building envelope, to reduce the temperature difference between the interior vertical surfaces of the apartment unit zones, and the air temperature of the indoors.
(2)
Excessive solar heat losses and gains: in particular for the indoor spaces oriented towards the south, the WWR has been reconfigured to prevent excessive heat losses panes during winter and solar gains in summer through the window glass. Accordingly, window systems integrated into the enhanced building envelope panels have been re-dimensioned to achieve a more balanced WWR, and specific glazing systems with low U-value have been selected on the basis of the available products in South Korea.
(3)
Buffer zones between indoors and outdoors: as solar gains and heating energy for south-oriented rooms are dispersed in the non-conditioned enclosed deck spaces, interior rooms of the reference apartment unit are expanded into the enclosed deck areas, allowing direct interfacing of the rooms with the outdoors.
To resolve the issues observed through the comfort analysis of the existing condition of the analyzed reference apartment unit, the following solutions were developed:
(1)
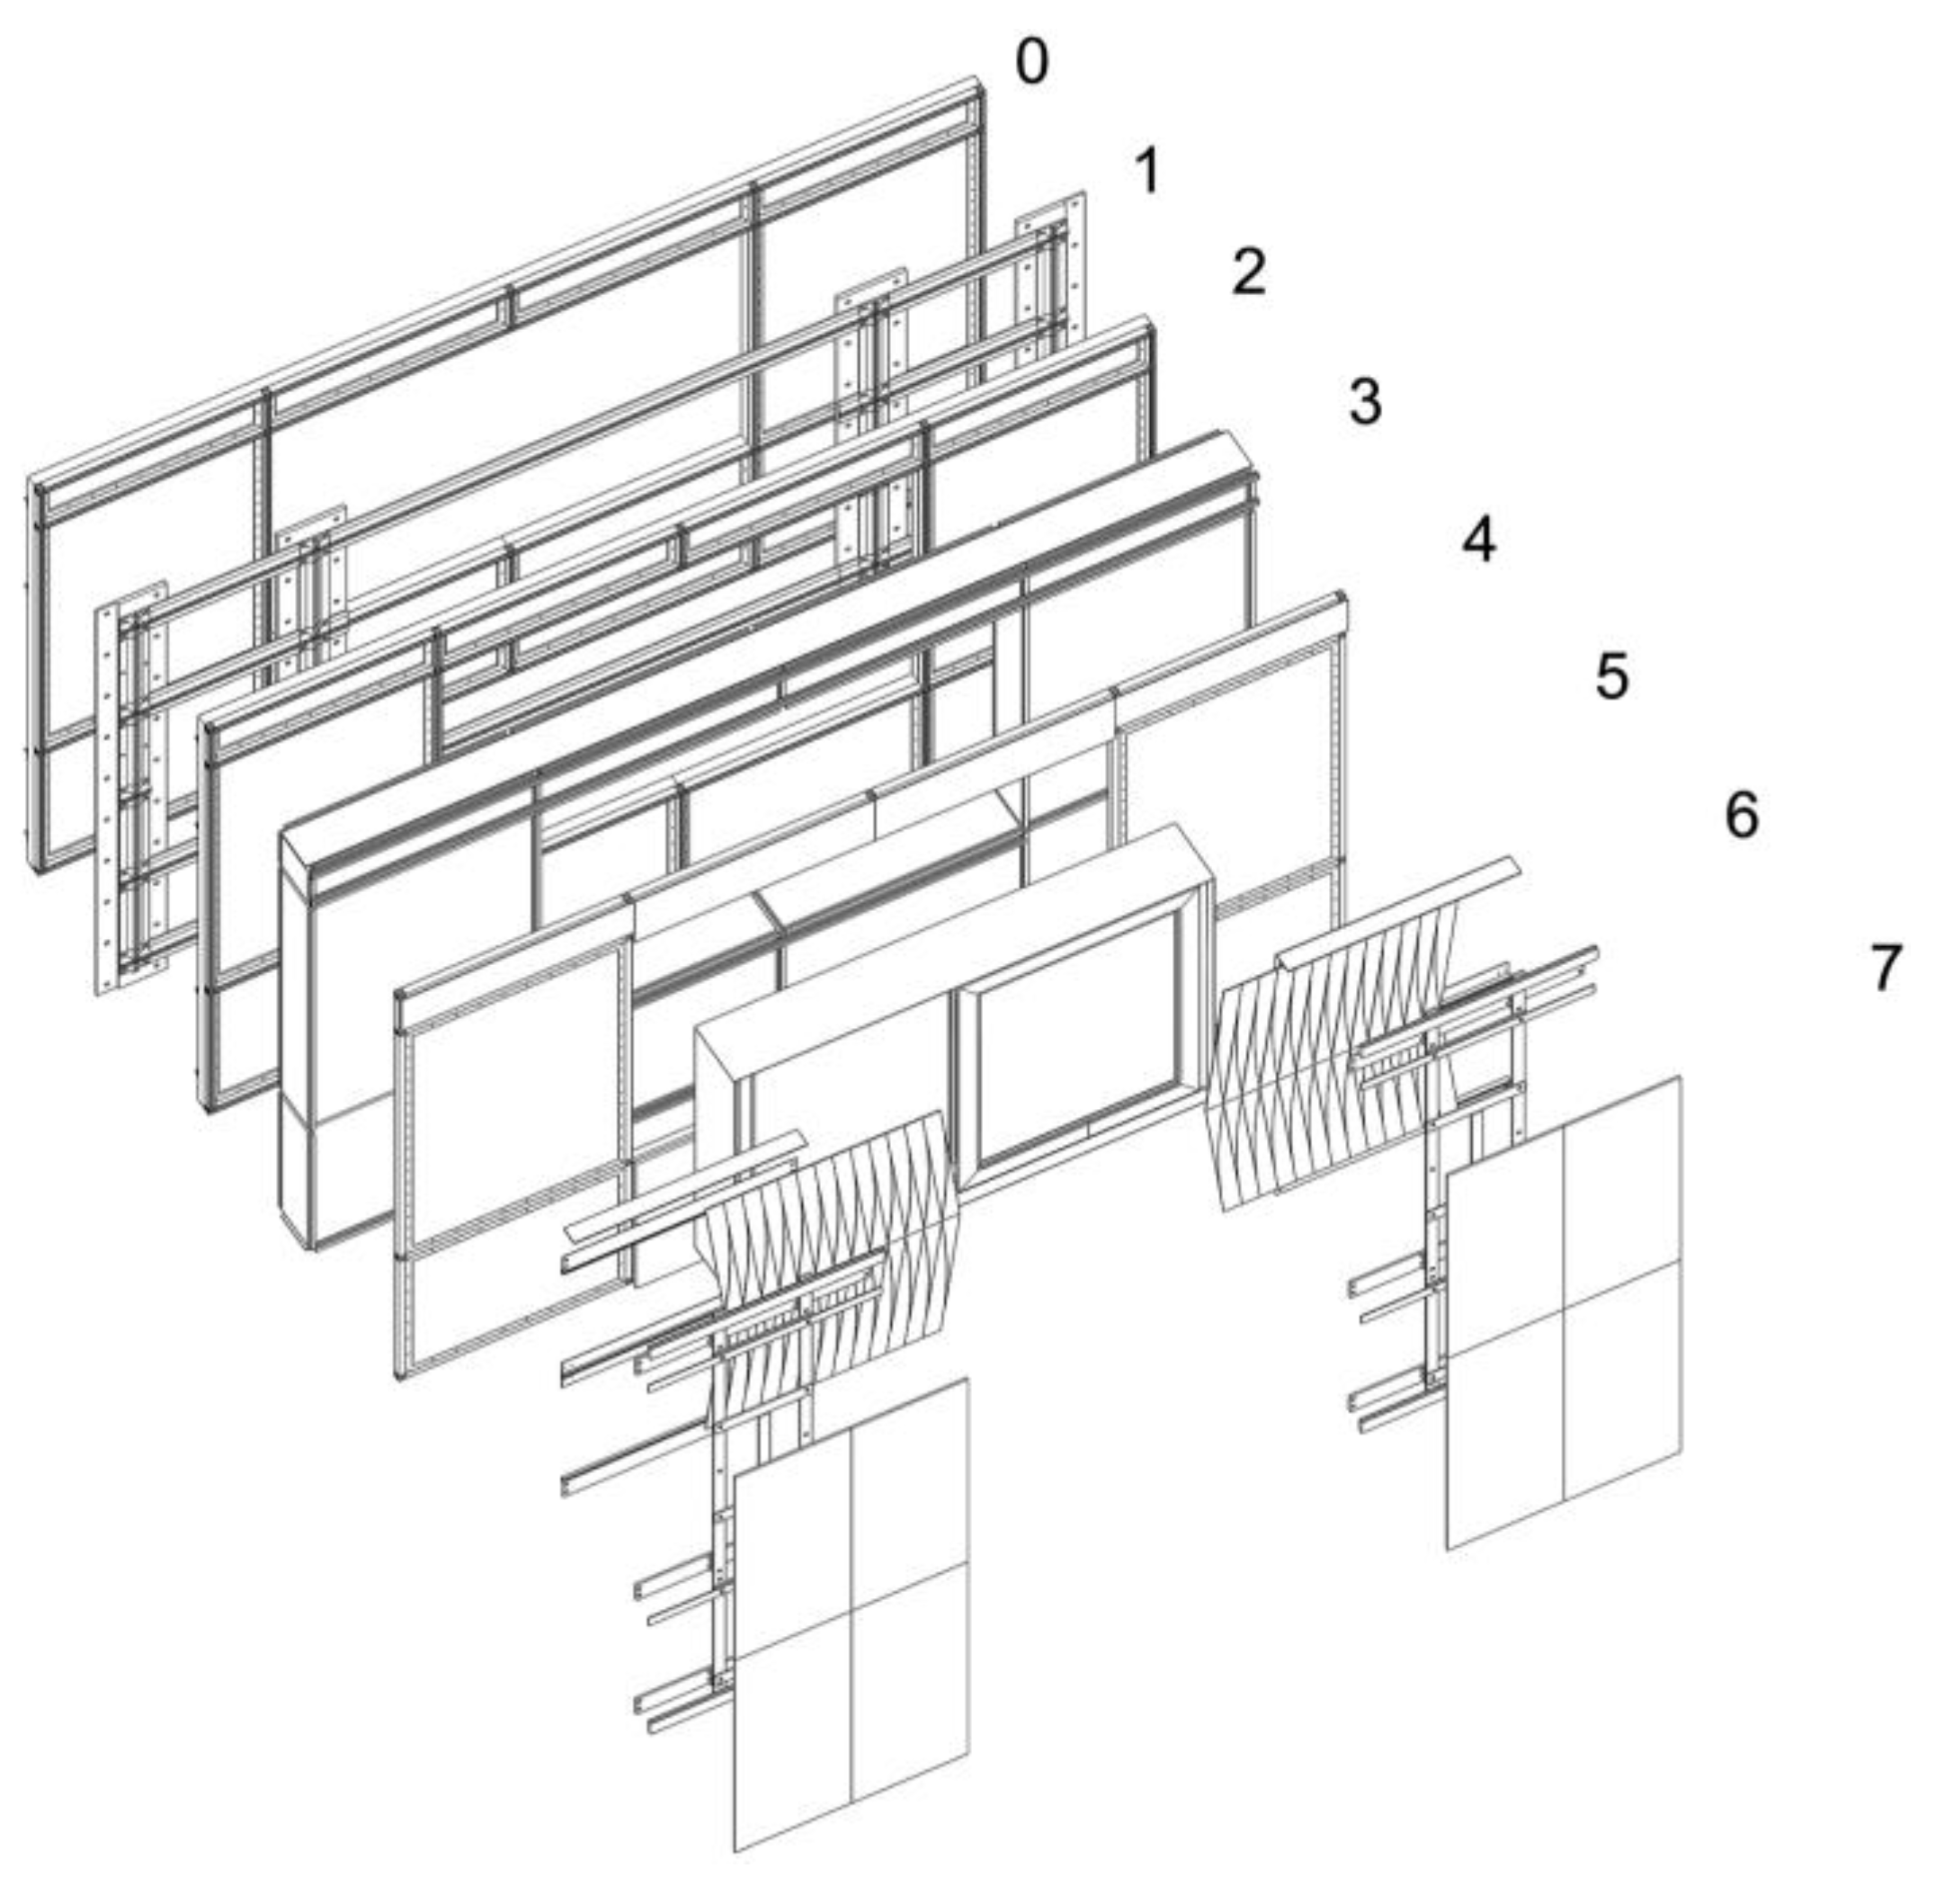
Development of enhanced building envelope modules with increased insulation, to reduce the variation between the mean radiant temperature of vertical surfaces in indoor zones, and the air operative temperature.
(2)
Adjustment of the WWR for both the south and north-oriented façades of the apartment: reduction from 76 to 25% of the WWR of the south-oriented façade windows by installing improved window components in the modular façade panels of the enhanced building envelope system; increase of the WWR for the north-oriented façade from 15 to 18% to reach optimal balance between indirect solar gains and heat losses through the window glass. The reduction in terms of WWR in the south-oriented façade is due to two factors: the improved g-value of the windows, which increases the cumulative solar radiation penetrating through the window glazing (i) and the direct interface with the outdoors, which allows spaces in the indoors to receive an increased amount of natural daylight.
(3)
Decrease of the windows U-values from approximately 3.00 to 2.00 W/m2K, to reduce heat losses through the window glass.
(4)
Re-configuration of the interior apartment layout: extension of the indoor rooms to the front enclosed decks for south-oriented bedrooms and the living room, as well as the northwest-oriented bedroom (Figure 12). Accordingly, the reconfiguration of the apartment layout defines a direct interface of indoor zones with the outdoors and increases the amount of direct solar gains through the window glass in the south-oriented zones and indirect solar energy in the northwest-oriented bedroom. Accordingly, the technically heated and cooled apartment surface and the usable floor space of indoor zones of the apartment are expanded by approximately 17%. Since the apartment bedrooms are expanded into the enclosed deck spaces, the overall lengths of the southwestern, southeastern, and northwestern bedrooms are increased. Accordingly, interior spaces located near the inner core of the apartment could suffer from low solar access, and have their visual comfort reduced by the extension intervention. Therefore, to provide each bedroom with additional storage space, storage spaces enclosed in a prefabricated removable partition system are defined in the inner zones of both the southeastern and northwestern bedrooms.
(5)
Integration of an external passive solar shading system in the enhanced envelope system modules. The solar shading system is composed of vertical sliding blinds that can be operated manually by occupants by opening the windows and reaching to inward-oriented handles that operate the sliding rail-mechanism (Figure 13). Single blinds can be synchronously rotated. The shading system is installed behind the external cladding panels of the enhanced envelope modules positioned in front of all four south and north-oriented bedrooms of the apartment, and can be slid manually through a rail system from its encasement position in front of the window glass.is The shading system is activated to fulfill functional requirements, such as complete sunlight obstruction during the early morning to adapt to the rest schedule of occupants, and to prevent overheating in the zones of the apartment. Accordingly, the simulation for the operation of the solar shading system is integrated with the Energyplus simulation of the renovated apartment. The calculation of indoor temperatures included the reduction of solar gains due to the use of solar shadings according to an operative program based on conditional statements (Table 5). Accordingly, the temperature calculations for the zones of the renovated apartment condition allow analysis of the interior comfort, taking into account the adaptation of users to the energy introduced into the apartment by direct and indirect solar gains.

3.6. Comfort Analysis of the Renovated Reference Apartment Unit Condition

3.6.1. Comfort Maps for Four Representative Rooms in the Renovated Reference Apartment Unit

Figure 14 presents an overview of the comfort maps resulting from comfort analysis of the renovated apartment condition according to the hybrid adaptive comfort model based on EN 15251 2007 comfort Class II. The indoor comfort analysis has been executed for the entire apartment according to the Energyplus simulation of the renovated apartment layout integrated with the enhanced building envelope system. Operative schedules defined for the existing apartment condition remain unaltered, so as to quantify improvement correlated specifically to the changes in the building envelope and the apartment building layout and considering user behavior in altering their comfort condition as constant. For the northeast-oriented bedroom (Figure 14a), discomfort hours measured during the last weeks of May for the existing apartment condition have been resolved, thanks to the increase in insulation installed in the enhanced building envelope panels, and the reduction in difference between mean radiant surface temperature of vertical surfaces and the operative air temperature of indoor zones. However, the installation of double window components replacing the existing glazing system has resulted in a limited increase of discomfort during the evening hours of the first weeks of July and the evening and morning hours during the 18 of July, due to local temperature variations. In particular, discomfort is caused by the higher volume of air supplied to the bedroom through natural ventilation caused by the increase of WWR. However, the comfort balance for the entire year calculated for the northeast-oriented bedroom benefits from a slight increase of annual comfort hours (from 90.19 to 90.45% for a total of approximately 228 h). For the kitchen area (Figure 14b), discomfort hours during summer and winter have been consistently reduced, due to the improvement of insulation in the building envelope, and the introduction of a new window. Accordingly, winter discomfort hours due to mean radiant and operative air temperature discrepancies have been resolved, and discomfort hours during the first weeks of July and September, as well as the last weeks of August, have been reduced, thanks to the introduction of additional indirect solar gains through the new window. However, heat losses to other apartment zones through the interior walls and the comparably low WWR (10%) limit the amount of comfort hours added by the renovation intervention during the first weeks of June, where temperature variations between daytime and nighttime produce consistent discomfort for occupants. The indoor comfort condition of occupants for the south-oriented rooms (Figs. 14c and d) after the renovation of the apartment unit has reached a comparably higher average increase of comfort hours (+5%) than for the north-oriented bedrooms (+3%). The increase of comfort hours is caused by the reduction of the WWR for the single bedrooms, the increase of insulation, and the new direct interface of the zones with the outdoors, as well as increased solar gains due to direct solar access. Accordingly, a substantial reduction of discomfort hours can be measured for the living room (Figure 14c), in particular during the last weeks of June, the first weeks of July, and the month of August. Comfort improvement is caused in the living room by the decreased WWR (from 86.6 to 35%) and the decrease of window U-values for approximately 1 W/m2K, which prevents solar heat gains dispersion. Accordingly, the direct interface with the outdoors increases the amount of solar gains in the living room, allowing a more uniform redistribution of heat from the living room to the other rooms in the apartment. Variations in the mean day temperature during the month of June are nevertheless a source of discomfort for the occupants, tied to the dispersion of heat to other zones of the apartment unit, due to the presence of the glass door between the kitchen and the living room, and the interior corridor. The comfort condition for the southwester room (Figure 14d) has increased during the last weeks of June and the first weeks of July, as well as during September. However, the increase of comfort hours is comparably lower for the southwestern room than for the living room, as the extension of the bedroom in the enclosed deck spaces has involved a reduced amount of supplementary space, given the already reduced width of the enclosed deck positioned in front of the bedroom. The reduction of heat losses due to lower insulation and window U-values contributed mainly to the increase of comfort hours in the southwest bedroom.
Table 6 summarizes the overall comfort condition for the four reference rooms. Accordingly, only the kitchen comfort annual hours do not reach the threshold of 90%, due to the limited extent of the intervention, and the introduction of only another window with the same restrained dimensions of the existing one, due to the structural stability requirements in opening new window spaces in the building’s load-bearing façade wall. The average annual comfort hours increase is 3.11% for all four rooms, and 5.07% for all rooms except the northeastern bedroom, which accounts for the lowest comfort hours increase.

3.6.2. Adaptive Comfort Charts for Selected Rooms of the Renovated Reference Apartment Unit

The comfort analysis for the renovated reference apartment unit was executed for the same rooms as for the comfort analysis of the existing apartment unit. The results showed different rates of increased comfort in specific rooms after renovation.
Figure 15 shows adaptive comfort charts for four rooms after renovation for the kitchen (Figure 15a), the northeastern room (Figure 15b), the southern living room (Figure 15c), and the southwestern room (Figure 15d). The improved thermal insulation of the building envelope renovation system results in reduced uncomfortable hours during the months of May, June, July, and October for both the northeastern bedroom and the kitchen.
The improved building envelope resolved the discomfort caused by the existing building envelope, by differences between the air and mean radiant temperatures of room surfaces during May and October. However, the operation of the renovated apartment had adverse effects on the indoor comfort. After renovation, the number of hours with indoor temperatures above 26 °C was reduced by the increased night ventilation during colder outside temperatures. The resulting lower indoor temperatures during evening and night caused occupant discomfort. As ventilation schedules were left unaltered to allow for the calculation of improvements defined only by the introduction of the new building envelope system and apartment configuration, cold outside air introduced into the apartment through ventilation in the transition months increased the amount of discomfort hours during the middle of June and September. However, in comparison with the existing apartment unit, annual discomfort hours were significantly reduced. The amount of comfort hours in the selected rooms was improved by 4 to 5.6%.
Due to the improved solar gains during cold outside temperatures, indoor comfort temperatures in the northeastern room and the kitchen had increased by approximately 2 °C, in comparison with the existing apartment unit. Hourly values distributed on the threshold of the comfort zone in the adaptive comfort graphs of both rooms are now located on the top limit border, instead of being positioned on the lower bottom threshold.

3.6.3. Thermal Comfort Maps for the Renovated Condition of the Reference Apartment Unit

Figure 16 illustrates the comfort maps generated by distributing the results of the comfort analysis obtained by evaluating the temperature data from the Energyplus simulation of 1 m × 1 m subdivisions of the floor space of the renovated reference apartment unit through the comfort standard EN 15251 Class II.
The comfort analysis executed for the entire year (Figure 16a) shows an overall comfort increase for all rooms located in the apartment unit. The average increase of comfort hours per year calculated for all apartment unit zones is approximately 6% annual comfort hours (525.6 h). In particular, the comfort condition of north-oriented spaces lies in the 87–97% range of annual comfort hours, with improved comfort condition caused by direct access to the outdoors for the northwestern bedroom, and increased solar gains in the kitchen due to the increased WWR. Conversely, in the south-oriented room, a clear distinction between areas reaching 98–100% annual comfort hours, and zones located near the window showing lower comfort values of 85–90% of annual comfort hours, results from the reorganization of the internal spaces due to the new apartment unit layout configuration. Lower annual comfort hour values are limited to areas experiencing overheating due to constant direct solar lighting near the window. Spaces with lower comfort conditions are nevertheless located in the additional floor space acquired for the south-oriented rooms through the expansion of the apartment into the enclosed deck spaces and represent less than 5% of the cumulative space of the extended rooms. The comfort analysis of the winter period (Figure 16b) shows an almost uniform comfort condition of 100% annual comfort hours for the zones of the apartment due to the activation of the heating system. However, the distinction between zones with constant annual comfort and spaces located near the window with lower annual thermal comfort hours is enhanced by the difference in terms of overall winter comfort hours between the two different zone types, which can reach even 10%. The lower sun altitude in winter produces increased overheating of the spaces located near windows due to direct lightening, which therefore causes lower comfort hours for zones located near windows. However, the integration of the shading system in the Energyplus simulation allows the concentration of lower comfort hours in a reduced space, lowering the cumulative area experiencing lower winter comfort hours. The summer comfort analysis (Figure 16c) shows the highest reduction of discomfort for the entire year, with an average increase of comfort hours of 10%. Accordingly, the main sources of discomfort in summer are the increased heat losses caused by the direct interfaces of south-oriented zones and the northwestern room with the outdoors. With the expansion of interior rooms into enclosed deck spaces, the amount of external air directly introduced into the apartment is increased by maintaining the same ventilation schedules defined for the existing apartment condition, causing a lower increase of comfort hours. Limited indirect solar gains and the northern orientation of the kitchen still determine the kitchen as the space with the lowest comfort. Lower comfort temperatures in the kitchen also influence heat losses from the living room to colder interior spaces and cause lower comfort hours for the living room space. In general, the comfort condition of occupants in the apartment has increased and has reached a balance between the north and south-oriented rooms due to the increased insulation inserted into the panels of the modular building envelope. The decreased heat losses from the indoors to the outdoors through the renovated building envelope reduce the need for occupants to actively intervene to change the thermal comfort during specific times of the year when temperature variations during the day would require constant changes of clothing, ventilation, and shading to reach comfortable temperatures.

4. Discussion

This study attempts to provide an assessment of indoor comfort in Korean apartment buildings through the analysis of a standard apartment unit and the application of a BIM-parametric renovation framework. In particular, the execution of energy simulations partially takes into account local conditions. Local conditions included the cumulative solar radiation incident on the building envelope, shading from neighboring buildings, and the average U-value and transmission indexes of Korean construction components. Conversely, outdoor dry bulb temperature and humidity data are retrieved from the Energyplus database for the climatic zone of Seoul. Climatic data offer only an approximation of the real thermal condition of the area selected for the execution of the case study analysis. Accordingly, the BIM-parametric system should be expanded to take into account local variations in terms of temperature and humidity depending on phenomena such as traffic concentration, urban heat island effect, soil sealing, and water runoff, among others. The introduction of local variables into the simulation of building energy demand and occupants’ comfort would allow a higher degree of precision in modeling the indoor and outdoor comfort condition of existing apartments. Accordingly, simulations of the energy demand of apartment units could be more accurately produced. Local variables determined by natural and anthropogenic elements exert a specific effect on the condition of the building envelope. External agents could greatly affect the extension and range of the interventions required for the in-situ refurbishment of the analyzed building and similar apartment construction, such as the amount of insulation or the construction materials utilized for the design of the enhanced building envelope modules.
Furthermore, the analysis of local conditions can improve the refinement of hybrid adaptive comfort models, which have only recently found application in the scientific literature (see Section 2, “Materials and Methods”). The individuation of dynamics influencing user behavior in actively altering their comfort conditions allows the correction of thermal comfort thresholds in the hybrid adaptive comfort model. The identification of external dynamics allows even prediction of the user behavior, if dwellers were compelled to select between active (technical heating and cooling) and passive (natural ventilation, increased clothing) measures to reach their desired comfort conditions. In the case of building 103, the exemplar case of traffic particulate concentration in the Gireum neighborhood defines a specific agent influencing the willingness of users to open windows to provide their apartments with natural ventilation and passive cooling. Accordingly, such dynamic could greatly influence the indoor comfort of apartments, and the acceptable comfort thresholds for apartment dwellers.
Additionally, local tendencies and characteristics in terms of the choice of heating and cooling technical systems can greatly influence the resulting preferences in terms of indoor comfort for the case of South Korea. For the setting of comfort indoor temperatures and schedules in the Energyplus simulations of both existing and renovated apartment unit conditions presented in this research, a benchmark study [57] that collected statistical data on preferred heating and cooling temperatures for indoor comfort in South Korean apartment has been consulted. Accordingly, the use of the ondol traditional floor heating system in South Korea influences the mean radiant temperature of the floor surfaces in apartment buildings. Specifically, the benchmark study shows that the required ondol floor heating mean radiant surface temperatures tend to be higher than the acceptable comfort threshold calculated for the EN 15251 Class II model. Higher temperature values depend on the functioning of the ondol heating system as the air temperature of indoor spaces would reach a comfortable temperature levels through convection. Moreover, the introduction of outside air through natural ventilation during winter would contribute to enhancing the difference between air and mean radiant surface temperatures. Therefore, specific adjustments to the comfort model used to evaluate indoor user conditions should be introduced. Temperature adjustments would reflect the specific technologies and use modes for technical heating and cooling.
For the execution of the Energyplus simulation, two schedules, one for winter and one for summer, have been defined. Accordingly, the definition of the two schedules is based on the relatively short duration of spring and autumn seasons in South Korea, in terms of mean temperatures and precipitation concentration [63]. However, the months between March and June, as well as between September and November, show a comparably higher average temperature difference between daytime and nighttime in respect of the entire year. Variations in terms of outdoor temperatures can greatly influence the comfort condition of apartment occupants, and their adaptive behavior in changing their comfort conditions. Ventilation, and heating and cooling set-point operative schedules for both active and passive solutions could be altered extensively, even only for one week or daily cycle. Accordingly, sharp local temperature variations can contribute to reducing the overall annual amount of comfort hours, altering therefore results for the indoor comfort analysis of apartment units. Since daily temperature transitions exceeding variations of 5 °C in less than 3 h, such as those that occur during spring and autumn in South Korea, can contribute to altering comfort solutions and strategies, and different scenarios in terms of operative schedules and user interventions should be defined. Each scenario should be defined by the combination of active and passive schedules in altering the indoor comfort conditions in South Korean apartments. Adaptive scenarios can vary based on the alteration of clothing and intensity of natural ventilation, as well as heating and cooling set-points. Specific adaptive scenarios determine a more detailed and precise method to define the real behavior of apartment occupants than the statistical analysis of a significant pool of apartment buildings in South Korea. Moreover, the energy consumption for technical cooling and heating in apartment buildings can be compared according to different adaptive scenarios. The best performing case could be selected as the one providing the lowest energy consumption and highest thermal comfort, both impacting the wellbeing of users, and resulting in a more sustainable energy consumption for apartment buildings.
The Energyplus simulation executed for the analysis, comparison, and quantification of indoor comfort hour improvements between the existing and renovated apartment unit conditions identifies the influence of non-conditioned buffer enclosed deck zones on indoor comfort. The solution proposed for the renovation of the apartment unit analyzed is the extension of indoor spaces into the buffer zones. The extension of the apartment unit indoor floor space creates de facto new areas that require additional energy for technical cooling and heating. However, the overall reduction in U-value for the building envelope allows energy loads for technical heating and cooling to be substantially reduced. The addition of new zones requiring technical cooling and heating could influence the energy demand of renovated apartment buildings. Increased technically heated and cooled area could prevent further optimization of energy consumption and indoor comfort. Additionally, the presence of buffer zones is considered beneficial for the dissipation of excessive heat from solar gains, reduction of temperature decrease/increase due to filtration of air introduced in the apartment through natural ventilation. Furthermore, passive temperature control in apartment units is depending on outdoor temperature variations, through the increase or decrease of the exposure of indoor spaces to non-conditioned areas. Accordingly, the definition of minimal alternative renovation strategies, such as the replacement of enclosed deck windows with better-performing components, and the quantification of indoor comfort improvement according to the principle of minimum intervention, should be additionally analyzed. The definition of low-intensity renovation strategies allows determination of the potential benefit buffer zones could improve indoor comfort with the minimum material and economic expense for the renovation of apartment buildings.
The renovation of the apartment building analyzed in this research proposes the installation of a solar shading system, both for functional and comfort purposes. The influence of the shading system on the indoor comfort of the renovated apartment condition has been evaluated through the inclusion of Bidirectional Scattering Distribution Function (BSDF [64])-based window lighting models. The BSDF-based method factored in the calculation of solar gains and resulting air temperature for the zones of the Energyplus apartment unit model. Accordingly, the operative schedules defined for the deployment of the shading system determine an active intervention of users to alter their comfort condition by effectively diminishing the amount of light penetration indoors. Therefore, the operative model based on user intervention on the orientation of solar shading should be accounted for in the evaluation of the adaptive comfort model for the calculation of indoor comfort hours through the EN 15251 Class II comfort model. However, the calculation of temperatures according to pre-set operative conditions is executed through the BIM-parametric renovation framework in a precedent step, before the mapping of indoor comfort for apartment spaces. Therefore, the use of passive methods, such as solar shading and natural ventilation, are not included in the same model, but separately included in the assessment of indoor comfort. The adaptive comfort model defines in fact comfort zones that take into account the potential action of users in changing their comfort condition through natural ventilation only. However, the comfort analysis according to the adaptive comfort model is executed after the calculation of indoor temperatures, following the dynamic simulation of solar gains. Different execution procedures for specific passive strategies can alter the comfort model and produce unclear results. Accordingly, a more comprehensive model should be defined to take into account different passive strategies and their effects on indoor comfort, without the need to subdivide the analysis process into specific modules.
To solve issues with the alternate phasing of the comfort analyses of data produced by energy simulations depending on the behavior of users, a recursive indoor comfort evaluation model could be established within the BIM-parametric renovation system. A recursive comfort analysis system calculates the comfort condition of occupants in multiple instances by introducing corrections in repeated energy simulation and comfort analysis iterations. The comfort analysis iterations evaluate the impact of different passive and active strategies in altering the indoor temperature, humidity, and daylight. Each recursion allows change in the user-defined variables, such as the heating and cooling set points, ventilation schedules, shading orientation, and operation to minimize energy demand, as well as maximize indoor comfort. The recursive comfort method could therefore define a specific tool to assess indoor comfort with more accuracy, depending on detailed local conditions for the apartment units analyzed.

5. Conclusions

The research presented provides an iterative and modular BIM-parametric integrated framework for aged building renovation that specifically addresses the quantification of indoor comfort improvements. The framework is capable of quantifying indoor comfort hours for dwellers of apartment buildings through BIM virtualization and the model simulation of an exemplary apartment building. The BIM-parametric integrated framework can individuate sources of discomfort through the analysis of indirect factors, such as climate data and contextual shading. Further comfort variables include direct factors, such as operative schedules for technical cooling and heating, and comfort control factors. A detailed and precise comfort model for apartment buildings in South Korea is provided. Through the integration of the definition of an enhanced building envelope system in the BIM-parametric renovation framework, an average of 5.5% increase of comfort hours could be obtained after the renovation of the apartment building. The involvement of the BIM-parametric integrated renovation framework in the development of renovation projects for aged buildings allows advantage to be taken of a holistic view of the sustainable aspects of building renovation. Therefore, this BIM-parametric integrated framework increases the overall feasibility of sustainable apartment building renovation. Furthermore, this framework can contribute to the reduction of planning time and related monetary costs.

Author Contributions

This research was executed by F.M.A. with T.S. in South Korea and U.D. in Germany. All authors contributed equally to the writing of this paper and read and approved the final manuscript.

Funding

This research was supported by the Basic Science Research Program through the National Research Foundation of Korea (NRF) and funded by the Ministry of Education (2018R1D1A1B07050989).

Acknowledgments

The authors would like to thank Kyoyoung Hwang and Narae Lee for their assistance and translation of literature from Korean to English.

Conflicts of Interest

The authors declare no conflict of interest.

References

  1. Kim, J.I. Constructing a “Miracle”, Architecture, National Identity and Development of the Han River, A Critical Exploration of Architecture and Urbanism: Seoul 1968-1988; University of California: Berkeley, CA, USA, 2008. [Google Scholar]
  2. Lee, J.-W. Economic growth and human development in the Republic of Korea, 1945–1992. Reconstruction 2007, 1945, 61. [Google Scholar]
  3. Lee, S. Urban Housing Policy in Korea According to Paradigm Shift; Korea research Institute for Human Settlements: Sejong City, Korea, 2016. [Google Scholar]
  4. Kim, K.-H. Housing and the Korean economy. J. Hous. Econ. 2004, 13, 321–341. [Google Scholar] [CrossRef]
  5. La Grange, A.; Jung, H.N. The commodification of land and housing: The case of South Korea. Hous. Stud. 2004, 19, 557–580. [Google Scholar] [CrossRef]
  6. Chung, H.S.; Kim, J.H. Housing speculation and housing price bubble in Korea. KDI Sch. Pub Policy Manag. Pap. 2004. [Google Scholar] [CrossRef]
  7. Choi, J. The traditional characteristics reflected in the plan of modern apartment houses in Korea. J. Archit. Plan. Res. 1999, 16, 65–77. [Google Scholar]
  8. Choi, K.-J.; Jihn, J. A Study on the Change of the Apartment Unit Plan in National Housing—Focused on Institutional and Social Changes. J. Korean Hous. Assoc. 2015, 26, 123–131. [Google Scholar] [CrossRef]
  9. Bak, C.C.; Son, C.B.; Shik, H.S. Study on the Analysis of Construction Period and Material Amount of Apartment, 1990; Architectural Institute Of Korea: Seoul, Korea, 1990; pp. 498–501. [Google Scholar]
  10. Choi, D.S.; Lee, M.E.; Lee, H.C. Energy Consumption Characteristics and Evaluation of Thermal Insulation Performance in Accordance with Built Year of Apartment Complex. Korea Inst. Ecol. Archit. Environ. 2014, 14, 79–86. [Google Scholar] [Green Version]
  11. Koh, S.-B. Temporal and Spatial Characteristics of Apartment Development by Types of Construction Policies—A Case Study Focusing on Apartments in Seoul. J. Urban Des. Inst. Korea Urban Des. 2014, 15, 61–79. [Google Scholar]
  12. Bang Shin, H. Living on the edge: Financing post-displacement housing in urban redevelopment projects in Seoul. Environ. Urban. 2008, 20, 411–426. [Google Scholar] [CrossRef]
  13. KOSTAT. Complete Enumeration Results of the 2016 Population and Housing Census; Ministry of Strategy and Finance: Sejong, Korea, 2016.
  14. KOsis Statistical Database —Environment. Available online: http://kosis.kr/eng/statisticsList/statisticsList_01List.jsp?vwcd=MT_ETITLE&parentId=101_E#SubCont (accessed on 12 July 2018).
  15. Chung, I.-U. The Current Status of Old Apartments and the Remodeling Policies in Korea; Land&Housing Corporation, World cities summit 2014: Singapore, 6 June 2014. [Google Scholar]
  16. Kang, B. History of Korean Apartment Housing Projects; Community Housing Study Committee: Seoul, Korea, 1999. [Google Scholar]
  17. Park, M.; Tae, S. Suggestions of Policy Direction to Improve the Housing Quality in South Korea. Sustainability 2016, 8, 438. [Google Scholar] [CrossRef]
  18. Yoon, J.D. Establishment of Strategy for Developing Housing Business According to Changing Environment; Seoul, Korea, 2010; pp. 5–8. [Google Scholar]
  19. Shin, H.B. Property-based redevelopment and gentrification: The case of Seoul, South Korea. Geoforum 2009, 40, 906–917. [Google Scholar] [CrossRef]
  20. Križnik, B. Changing approaches to urban development in South Korea. Int. Dev. Plan. Rev. 2013, 35, 395–418. [Google Scholar] [CrossRef]
  21. Jänicke, M. “Green growth”: From a growing eco-industry to economic sustainability. Energy Policy 2012, 48, 13–21. [Google Scholar] [CrossRef]
  22. Jung, H.G.; Shin, S.W.; Lee, B. Study of the Assessment Baseline of Carbon Dioxide Emissions based on the Analysis of Building Energy Efficiency Rating System. Korea Inst. Ecol. Archit. Environ. 2013, 13, 11–19. [Google Scholar]
  23. Lee, M.-K.; Kim, Y.-S.; Kang, S.-J.; Ryu, J.-C.; Kim, W.-D.; Han, K.-J.; Balmes, C.; Lee, Y.-H.; Kim, S.-J. Korea’s Green Growth Experience: Process, Outcomes and Lessons Learned; Global Green Growth Instittue: Seoul, Korea, 2015. [Google Scholar]
  24. Jones, R.S.; Yoo, B. Achieving the “Low Carbon, Green Growth” Vision in Korea; OECD: Paris, France, EU:; 2012. [Google Scholar]
  25. Kim, S.A.; Ah, P.J. Current Situation and Direction of the Long-life Apartment Housing in Korea, 2014; The Korean Housing Association: Seoul, Korea, 2014; pp. 98–103. [Google Scholar]
  26. Yeo, M.-S.; Yang, I.-H.; Kim, K.-W. Historical changes and recent energy saving potential of residential heating in Korea. Energy Build. 2003, 35, 715–727. [Google Scholar] [CrossRef]
  27. Ferreira, M.; Almeida, M. Benefits from energy related building renovation beyond costs, energy and emissions. Energy Procedia 2015, 78, 2397–2402. [Google Scholar] [CrossRef]
  28. Ferreira, M.; Almeida, M.; Rodrigues, A. Impact of co-benefits on the assessment of energy related building renovation with a nearly-zero energy target. Energy Build. 2017, 152, 587–601. [Google Scholar] [CrossRef]
  29. Michael, A.; Gregoriou, S.; Kalogirou, S.A. Environmental assessment of an integrated adaptive system for the improvement of indoor visual comfort of existing buildings. Renew. Energy 2018, 115, 620–633. [Google Scholar] [CrossRef]
  30. Manz, H.; Micallef, D.; Borg, S.P.; Buhagiar, V. A parametric building energy simulation case study on the potential and limitations of passive design in the Mediterranean climate of Malta. Sustain. Build. 2018, 3, 4. [Google Scholar] [CrossRef]
  31. Lee, Y.-J.; Leigh, S.-B.; Lee, K.-H. A Study on the Operational Strategy for Hybrid Ventilation System in Apartment unit focused on Indoor Air Quality. Korea Inst. Ecol. Archit. Environ. J. 2004, 4, 203–210. [Google Scholar]
  32. Kim, S.G. Study on Thermal Comfort in according to Rate of Opening Windows of Flat-type Apartment. Korea Inst. Ecol. Archit. Environ. J. 2013, 16, 93–98. [Google Scholar]
  33. Lee, S.-J.; Cheong, C.H.; Hwang, S.; Kim, T.; Leigh, S.-B. Evaluation of the Indoor Thermal Comfort in Naturally Ventilated Apartment During Summer. Korea Inst. Ecol. Archit. Environ. J. 2010, 10, 59–66. [Google Scholar]
  34. Chun, C.-Y.; Bae, N.-R. A Study on Acceptable Thermal Comfort Zone and Resident Behavior of Operating Cooling Devices in Apartments. Korean J. Air-Cond. Refrig. Eng. 2005, 17, 477–486. [Google Scholar]
  35. Lee, J.-W.; Hwang, H.-Y. An Investigation on the Effect of Duration of Sunshine on the Heating Energy of Apartment Houses. Korean J. Air-Cond. Refrig. Eng. 2005, 17, 277–284. [Google Scholar]
  36. Moon, S.Y.; Jang, D.H. A Study on the thermal comfort change according to the Planting Type in housing complex. Korea Inst. Ecol. Archit. Environ. J. 2012, 12, 65–75. [Google Scholar]
  37. Shin, H.-i. A Study on the Energy Consumption and their Patterns in Apartment Housing Units Size and Orientation. J. Archit. Inst. Korea Plan. Des. 2016, 32, 231–240. [Google Scholar] [CrossRef]
  38. Amoruso, F.; Dietrich, U.; Schuetze, T. Development of a Building Information Modeling-Parametric Workflow Based Renovation Strategy for an Exemplary Apartment Building in Seoul, Korea. Sustainability 2018, 10, 4494. [Google Scholar] [CrossRef]
  39. Amoruso, F.M.; Dietrich, U.; Schuetze, T. Integrated BIM-Parametric Workflow-Based Analysis of Daylight Improvement for Sustainable Renovation of an Exemplary Apartment in Seoul, Korea. Sustainability 2019, 11, 2699. [Google Scholar] [CrossRef]
  40. Khemlani, L. Autodesk Revit: Implementation in Practice; White Paper Autodesk: Mill Valley, California, 2004; Available online: https://www.aboutcivil.org/papers/autocad-Revit-Implementation-WP.pdf (accessed on 19 July 2018).
  41. McNeel, R. Rhino3D. Available online: https://www.rhino3d.com/ (accessed on 20 May 2019).
  42. McNeel, R. Grasshopper Generative Modeling for Rhino. Computer Software (2011b). Available online: http://www. grasshopper3d. com (accessed on 20 May 2019).
  43. Mostapha Sadeghipour Roudsari; Pak, M. Ladybug: A Parametric Environmental Plugin for Grasshopper to Help Designers Create an Environmentally Conscious Design. In Proceedings of the 13th International IBPSA Conference Lyon, France, 25–30 August 2013; IBPSA, Ed.; Available online: https://www.ibpsa.org/proceedings/bs2013/p_2499.pdf (accessed on 20 May 2019).
  44. Larson, G.W.; Shakespeare, R. Rendering with Radiance: The Art and Science of Lighting Visualization; Booksurge LLC.: Charleston, SC, USA, 2004. [Google Scholar]
  45. Mans, D. Bumblebee. Available online: https://www.grasshopper3d.com/group/bumblebee (accessed on 21 September 2018).
  46. Crawley, D.B.; Lawrie, L.K.; Winkelmann, F.C.; Buhl, W.F.; Huang, Y.J.; Pedersen, C.O.; Strand, R.K.; Liesen, R.J.; Fisher, D.E.; Witte, M.J.; et al. EnergyPlus: Creating a new-generation building energy simulation program. Energy Build. 2001, 33, 319–331. [Google Scholar] [CrossRef]
  47. Guglielmetti, R.; Macumber, D.; Long, N. OpenStudio: An Open Source Integrated Analysis platform. In Building Simulation 2011; National Renewable Energy Laboratory: Sydney, Australia, 2011. [Google Scholar]
  48. LBNL. LBNL, WINDOW 7beta: PC Program for Analyzing Window Thermal Per-formance; LBNL: Berkeley, CA, USA, 2012.
  49. ASHRAE. ASHRAE Standard 55-2007. Thermal Environment Conditions for Human Occupancy; ASHRAE Standing Standard Project Committee 55, Ed.; ASHRAE: Atlanta, GA, USA, 2007. [Google Scholar]
  50. Toe, D. Development of an Adaptive Thermal Comfort Equation for Naturally Ventilated Buildings in Hot and Humid Climates. Front. Archit. Res. 2018, 2, 145–154. [Google Scholar]
  51. Fanger, P.O. Thermal Comfort. Analysis and Applications in Environmental Engineering; Danish Technical Press: Copenhagen, Denmark, 1970. [Google Scholar]
  52. O’Brien, W.; Gunay, H.B. The contextual factors contributing to occupants’ adaptive comfort behaviors in offices—A review and proposed modeling framework. Build. Environ. 2014, 77, 77–87. [Google Scholar] [CrossRef]
  53. Deuble, M.P.; de Dear, R.J. Mixed-mode buildings: A double standard in occupants’ comfort expectations. Build. Environ. 2012, 54, 53–60. [Google Scholar] [CrossRef]
  54. De Dear, R. Recent Enhancements to the Adaptive Comfort Standard in ASHRAE 55-2010. In Proceedings of the 45th Annual Conference of the Architectural Science Association, Sydney, Australia, 16–19 November 2011; ANZAScA: Sydney, Australia, 2011. [Google Scholar]
  55. Van der Linden, A.C.; Boerstra, A.C.; Raue, A.K.; Kurvers, S.R.; de Dear, R.J. Adaptive temperature limits: A new guideline in The Netherlands: A new approach for the assessment of building performance with respect to thermal indoor climate. Energy Build. 2006, 38, 8–17. [Google Scholar] [CrossRef]
  56. Fabrizio, E.; Monetti, V. Methodologies and Advancements in the Calibration of Building Energy Models. Energies 2015, 8, 2548–2574. [Google Scholar] [CrossRef] [Green Version]
  57. Jang, H. Modelling of Existing High-Rise Apartment Buildings for Energy-Efficient Refurbishment in South Korea; University of Sheffield: Sheffield, UK, 2016. [Google Scholar]
  58. VV., A. Apartment Encyclopedia (Seoul and Bundang/Ilsan); Seijn Planning: Seoul, Korea, 1998. [Google Scholar]
  59. Kim, J.; Chun, J.; Lee, B. Study about Change of Insulation Standard in Apartment in Its Effect. J. Archit. Inst. Korea 2009, 11, 125–132. [Google Scholar]
  60. ASHRAE. ANSI/ASHRAE Standard 62.1-2010. Ventilation for Acceptable Indoor Air Quality; American Society of Heating, Refrigerating, and Air-Conditioning Engineers, Inc.: Altanta, GA, USA, 2010. [Google Scholar]
  61. O’Neill, Z.; Narayanan, S.; Brahme, R. Model-Based Thermal Load Estimation In Buildings. In Proceedings of the Fourth National Conference of IBPSA-US, New York, NY, USA, 11–13 August 2010. [Google Scholar]
  62. CEN. EN 15251—Indoor Environmental Input Parameters for Design and Assessment of Energy Performance of Buildingsaddressing Indoor Air Quality, Thermal Environment, Lighting and Acoustics; CEN: Brussels, Belgium, 2007. [Google Scholar]
  63. Seoul Monthly Climate Averages. Available online: https://www.worldweatheronline.com/seoul-weather-averages/kr.aspx (accessed on 20 August 2018).
  64. Konstantoglou, M.; Jonnson, J.C.; Lee, E.S. Simulating complex window systems using BSDF data. In 26th Conference on Passive and Low Energy Architecture (PLEA); PLEA-Arch: Quebec City, QC, Canada, 2009. Available online: https://facades.lbl.gov/publications/simulating-complex-window-systems (accessed on 20 May 2019).
Figure 1. Housing construction statistics for South Korea: (a) Units of residential building sorted according to typology constructed during the period of the “Han River miracle” (1962–1996) [16]; (b) Distribution of housing typologies per household composition [13].
Sustainability 11 03950 g001
Figure 2. Visual representation of the BIM-parametric renovation framework: each phase, from the analysis of the existing building and definition of the enhanced building envelope system to the building BIM model update is described according to the different software and tools used. Each phase of the BIM-parametric renovation framework is described in the text.
Sustainability 11 03950 g002
Figure 3. Localization of building 103 in (a) South Korea and Seoul (color-marked zones on the city map represent apartment neighborhoods in the city); (b) the Gireum district; (c) the Sambu apartment complex within the urban structure defined by the Nabeu (“Central”, Korean) Expressway and the main commute traffic arteries, Dongsomun-ro and Jeongneung-ro.
Sustainability 11 03950 g003
Figure 4. BIM virtual reconstruction of apartment building 103; (a) South-oriented façade; (b) latitudinal section through the building with view of the fenestration of the north-oriented façade.
Sustainability 11 03950 g004
Figure 5. BIM virtual reconstruction of apartment building 103; (a) Type floor; (b) Standard 42 pyeong apartment unit; (c) View of the north-oriented façade.
Sustainability 11 03950 g005
Figure 6. Cumulative solar radiation analysis of apartment building 103 executed with the Ladybug tools: (a) Radiation distribution calculated for the entire year across a hemispherical map of the sky; (b) calculation of solar radiation incident on the building envelope of building 103 for 21 June, 12:00 (nominally Summer Solstice); (c) Annual solar cumulative radiation for the south-oriented façade of building 103 (the marked area corresponds to the portion of façade occupied by the reference apartment unit on the 7th floor).
Sustainability 11 03950 g006
Figure 7. Annual comfort maps for four reference rooms in the existing apartment unit; comfort is calculated according to a binary scale, between (−1 and 0) (too cold to comfortable. (a) Northeast-oriented bedroom; (b) Kitchen; (c) Living room; (d) Southwest-oriented room.
Sustainability 11 03950 g007
Figure 8. Annual outdoor dry bulb temperatures for the climatic zone of Seoul collected from the Energyplus weather data of the ASHRAE database and visualized through Ladybug tools.
Sustainability 11 03950 g008
Figure 9. Adaptive comfort charts for the four selected reference apartment unit rooms: (a) bedroom in the northeast; (b) Kitchen; (c) Living room; (d) bedroom in the southwest. Hourly temperature values included within the comfort polygon outlined in the graph are considered comfortable according to the EN 15251 standard, Class II.
Sustainability 11 03950 g009
Figure 10. Comfort maps for the existing reference apartment unit analyzed with indication of the ratio of annual/seasonal comfort hours in percentage (from 0%-black to 100%-white comfort hours): (a) annual comfort map (1 January to 31 December); (b) winter period (1 January to 31 May—the period between 1 October and 31 December shows the same 100% comfort hour ratio measured for the first winter months of the year); (c) summer period (1 June to 30 September).
Sustainability 11 03950 g010
Figure 11. Exemplar model of a façade module for the enhanced building envelope system: (0) internal wood panel; (1) support construction in steel; (2) interior panel support frame in wood; (3) insulation layer with wood encasement; (4) exterior support wood frame with cladding material and vapor barrier; (5) double glazing clear glass window system; (6) manually operable sliding blade shading system; (7) aluminum sub-construction for the Building Integrated Photovoltaic (BIPV) panels [38].
Sustainability 11 03950 g011
Figure 12. Comparison and quantification of extension and reconfigured indoor space for the existing (left) and renovated (right) apartment unit layout. Red-marked surfaces represent new storage areas procured.
Sustainability 11 03950 g012
Figure 13. Compact representation of an exemplary façade module from the enhanced apartment building envelope system, On the left side of the window component, the solar shading system composed by sliding rails is shown oriented of 90° from the window glass surface; additionally, geometrically shaped sound absorption and refraction elements are displayed both above and below the window.
Sustainability 11 03950 g013
Figure 14. Annual comfort maps for four reference rooms in the renovated apartment unit; comfort is calculated according to a binary scale, between −1 (too cold) and 0 (comfortable). (a) Northeast-oriented bedroom; (b) Kitchen; (c) Living room; (d) Southwest-oriented room.
Sustainability 11 03950 g014
Figure 15. Adaptive comfort charts (EN 15152 hybrid comfort model) for four renovated reference apartment unit rooms: (a) northeastern bedroom; (b) kitchen; (c) living room; (d) southwestern bedroom. Hourly temperature values included within the comfort polygon outlined in the graph are considered comfortable according to the EN 15251 standard, Class II.
Sustainability 11 03950 g015
Figure 16. Comfort maps for the reference apartment unit analyzed with indication of the ratio of annual/seasonal comfort hours in percentage (from 0%-black to 100%-white comfort hours): (a) annual comfort map (1 January to 31 December); (b) winter period (1 January to 31 of May—the period between 1 October and 31 December shows the same 100% comfort hour ratio measured for the first winter months of the year); (c) summer period (1 June to 30 September).
Sustainability 11 03950 g016
Table 1. Building simulation parameter data sources for the calibration of the virtual apartment building and unit models.
Simulation ParameterData Source
Apartment building construction plansRealtor catalogues of apartment buildings for the existing reference apartment construction
Building envelope and structural system compositionScientific literature on the construction of apartment buildings in South Korea
Opaque construction components’ U-valuesEnergyPlus simulation based on common material parameters retrieved from scientific literature
Transparent construction components’ U-values and g-valuesShort-term survey of the building envelope and WINDOW simulation of transparent components’ U-values and transmission indexes
Heating and cooling set-point temperature schedulesReference studies for average user preferences in terms of heating and cooling set-point temoperatures for South Korea
Ventilation scheduleMinimum ventilation standards according to the American Society for Heating, Refrigerating and Air-conditioning Engineers (ASHRAE) standards, wind rose analysis executed for the climatic zone of Seoul, indoor comfort thresholds for air speed according to the adaptive comfort model, time-based exterior traffic pollutants and particulate matter concentration
Infiltration through the building envelopeQualitative analysis of the exterior building envelope and reference standard infiltration values defined by EnergyPlys (range of values for different building envelope conditions)
Occupation schedulesAnalysis of average working hours/day for the Korean active population and average household composition retrieved from statistical data
Table 2. Building components specifics and relative calculation of U-values and g-values.
Building ComponentDescriptionThickness (cm)U-Value [W/(m2K)]
Insulated load bearing wall (northern exterior wall/southern wall between enclosed deck and interior rooms)Double 125-mm reinforced concrete layer with core insulation (50 mm) in polystyrene panels, 5-mm interior and exterior mortar and finish layer34.500.63
Exterior enclosed deck wall 115-mm light concrete wall11.501.63
Roof350-mm reinforced concrete slab and 70-mm insulation in polystyrene panels35.000.46
Basement slab450-mm reinforced concrete layer with 70-mm insulation in polystyrene panels56.500.45
Interior wall (nonstructural) 125-mm light concrete layer12.001.57
Interior wall (structural)250-mm reinforced concrete layer25.002.63
Interior slab (ceiling and floor)250-mm reinforced concrete slab, 30-mm screed, and 10-mm floor cladding23.001.09
Window ComponentDescription—Length× Height (mm)
All windows have aluminum frames and double clear glazing systems
g-ValueU-Value [W/(m2K)]
Enclosed deck 380 × 2103.1630.65
Glass door200 × 2003.2240.65
Southeast Bedroom250 × 1103.0190.65
Northwest Bedroom250 × 1103.0190.72
Northeast Bedroom130 × 1003.1530.72
Kitchen90 × 503.4320.72
Table 3. Heating and cooling schedules and set points during winter and summer periods for the Energyplus simulation of the reference apartment unit.
Heating and Cooling ScheduleWinter Period
1 January–31 May and 1 October–31 December
Summer Period
1 June–30 September
Hours of the dayWorking day—heating set point in °CHoliday—heating set point in °CWorking day—cooling set point in °CHoliday—cooling set point
1–721223025
822222625
922222625
1022222525
1122222525
1222222425
1322222425
1422222525
1522222525
1622222525
1722222425
1822222425
1922222525
2022222525
21–2421223025
Table 4. Ventilation schedule for Energyplus apartment simulation.
Ventilation ScheduleWinter Period
1 January–31 May and 1 October–31 December
Summer Period
1 June–30 September
Hours of the dayWorking day—ventilation area (time)Holiday—ventilation area (time)Working day—ventilation area (time)Holiday—ventilation area (time)
1–60.00 (0 min.)0.00 (0 min.)0.40 (24 min.)0.35 (21 min.)
70.04 (2.5 min.)0.03 (2 min.)0.75 (45 min.)0.35 (21 min.)
80.00 (0 min.)0.00 (0 min.)0.75 (45 min.)0.35 (21 min.)
90.03 (2 min.)0.03 (2 min.)0.75 (45 min.)0.35 (21 min.)
100.00 (0 min.)0.00 (0 min.)0.50 (30 min.) 0.35 (21 min.)
110.04 (2.5 min.)0.03 (2 min.)0.50 (30 min.)0.35 (21 min.)
120.00 (0 min.)0.00 (0 min.)0.10 (6 min.)0.35 (21 min.)
130.03 (2 min.)0.03 (2 min.)0.10 (6 min.)0.35 (21 min.)
140.00 (0 min.)0.00 (0 min.)0.10 (6 min.)0.35 (21 min.)
150.04 (2.5 min.)0.03 (2 min.)0.10 (6 min.)0.35 (21 min.)
160.00 (0 min.)0.00 (0 min.)0.20 (12 min.)0.35 (21 min.)
170.03 (2 min.)0.03 (2 min.)0.20 (12 min.)0.35 (21 min.)
180.00 (0 min)0.00 (0 min.)0.45 (27 min.)0.35 (21 min.)
190.04 (2.5 min.)0.03 (2 min.)0.75 (45 min.)0.35 (21 min.)
200.00 (0 min)0.00 (0 min.)0.75 (30 min.)0.35 (21 min.)
210.05 (3 min.)0.03 (2 min.)0.50 (30 min.)0.35 (21 min.)
22–240.00 (0 min.)0.00 (0 min.)0.40 (24 min.)0.35 (21 min.)
Table 5. Ventilation schedule for Energyplus apartment simulation.
Shading System Parameters—Bedrooms Value
Shading system type Vertical blinds
Position External
Shading material Thickness: 0.55 mm, Sol. Refl.: 0.65; Sol. Trans.: 0; Sol. Emit.: 0.9; Conductivity: 221 W/mK
Shading control set point control logic for the activation of the shading system Blinds are activated if the zone temperature exceeds the upper limit of acceptable temperatures according to the adaptive comfort model (average for winter: 23 °C; average for summer: 26.70 °C)
Distance from glass 0.10 m
Number of shades 10–12 (according to window width, single shades are 0.15 m wide in the horizontal plane)
Shading rotation angle Southern façade: 30° south (left turn)
Northern façade: −30° south (left turn)
Table 6. Overview of comfortable hours in percentage of total hours for selected rooms in the existing and renovated reference apartment unit according to the adaptive model. The improvements of comfortable hours in % of total hours, too warm uncomfortable hours in % of total hours, and too cold uncomfortable hours in % of total hours, are also shown for the renovated apartment unit rooms.
Reference Zone (Comfort Analysis According to EN 15251 Hybrid Comfort Class II)Adaptive Comfort—Existing Apartment Condition
Annual Comfort Hours (%)
Adaptive Comfort—Renovated Apartment Condition
Annual Comfort Hours (%)
Adaptive Comfort—Renovated Apartment Condition
Annual Comfort Hours Increase (%)
Adaptive Comfort
Percentage of Annual Hours
Too Hot/Too Cold (%/%)
Northeastern bedroom90.1990.45+0.260/9.54
Kitchen82.4887.73+5.250/12.26
Living room85.7191.31+5.600/8.68
Southwestern room89.2193.57+4.360/6.42
Values in italics are below the comfortable hours’ threshold of 90% of total hours.

