Article

Findings from a Pilot Light-Emitting Diode (LED) Bulb Exchange Program at a Neighborhood Scale

1
Utah Clean Energy, Salt Lake City, UT 84103, USA
2
Department of Atmospheric Sciences, University of Utah, Salt Lake City, UT 84112, USA
3
Pulmonary Division, School of Medicine, University of Utah, Salt Lake City, UT 84112, USA
*
Author to whom correspondence should be addressed.
Sustainability 2019, 11(14), 3965; https://doi.org/10.3390/su11143965
Submission received: 12 June 2019 / Revised: 15 July 2019 / Accepted: 18 July 2019 / Published: 22 July 2019
(This article belongs to the Special Issue Urban Pollution, Health Impacts, and Mitigation Strategies)

Abstract

:
In the United States, 44% of low-income households struggle to pay their utility bills, affecting their ability to afford necessities such as food and health expenses. There is a high demand for, but low availability of, energy efficiency services in underserved neighborhoods, creating an opportunity for community-based programs to fill this inherent gap. This pilot project aims to bring energy savings and education to a uniquely targeted portion of Salt Lake City, UT, through the exchange of light-emitting diode bulbs and examines its feasibility in addressing energy insecurity at larger scales. Through the 8-month project duration, 1432 bulbs were exchanged at 23 events reaching 181 households in low-income areas that, through a year of use, were estimated to save residents approximately $18,219 in electricity bills, reducing CO2 emissions from power plants by 122 metric tons. Since this pilot reached less than 1% of households, we extrapolated a reach of 2%, 5%, and 7.5%, and found substantial potential decreases in power plant emissions and financial savings. Ongoing expansion efforts include more direct engagement with trusted members of the targeted communities and stronger attempts to engage participants in energy efficiency education as our project encountered some difficulties in reaching the intended population.

1. Introduction

1.1. Socioeconomic Divide of Energy Accessibility and Insecurity

Solutions to addressing climate change require both technical and behavioral change to diminish energy use [1], with energy efficiency paving a pathway for participation for all income levels. Energy efficiency has the potential to assist low- and moderate-income homes to save an estimated $13 billion annually in the United States due to energy cost savings through energy efficiency action [2]. However, encouraging an energy-user or home-owner to change behavior or take action to conserve energy or use energy more efficiently can be challenging. Often, this requires the coordination of multiple actors [3] and can be difficult when the user often violates the rational choice of saving money.
Energy insecurity (also often referred to as energy poverty or fuel poverty) is the inability to afford to pay monthly utility bills to support proper heating, cooling, and other energy needs in the home [4]. This issue is pervasive in the United States: nearly half (44%) of low-income households struggle to pay their utility bills [5]. The median energy burden on the average American household was found to be 3.5% of income, while the median energy burden on the average low-income household was more than twice as high, at 7.2% of income [6]. Following low-income households, other vulnerable demographics that face a greater energy burden include African Americans (5.4%), Latinos (4.1%) and renters (4%) [6]. Households with high energy burdens often have to choose between paying for necessities, such as food and medical expenses, and adequate heating, cooling, and lighting. As a result, households with a high energy burden may be improperly heated or cooled, and maintain inadequate lighting [6]. These conditions can increase incidences of physical and psychological ailments. Research has shown that higher rates of asthma, respiratory problems, heart disease, and stress may result from this unhealthy home environment [6,7,8,9,10].
Energy insecurity is a distributional justice issue, which concerns the equitable social distribution of a good or service. Distributional justice surrounding energy insecurity is primarily caused by income inequality, discrepancies in energy prices, and inconsistencies in housing stock and energy efficiency [4]. Addressing energy justice requires an understanding of the three main components of the “justice framework”. First, how environmental hazards are distributed throughout society; second, the distribution of benefits, such as affordable access to energy, throughout society; and third, equitable representation in decision-making [11]. Social perception also contributes to the injustice surrounding the provision of energy. In the U.S. there is an expectation of an energy-intensive standard of living with a low cost for utility services [12]. This, coupled with a general lack of knowledge about the intensity of energy use or how energy is produced, creates obstacles in alleviating the effects of energy injustice [12].
Two federal and state government programs that serve to address energy inequality are the Weatherization Assistance Program (WAP) [13] and the Low-Income Home Energy Assistance Program, also known as the Home Energy Assistance Target (HEAT) program [14]. WAP is a Department of Energy program that assists income-qualifying households facing a high energy burden with safety, comfort, and efficiency improvements to their homes. Qualifying participants for this program must fall at or below 200 percent of the federal poverty line [15] and are assisted through the provision of energy efficiency updates to homes to decrease home energy burdens. The HEAT program provides services to high energy-burden households in the form of utility bills and energy crisis assistance for households with incomes at or below 150 percent of the federal poverty level. Localized networks of government agencies and nonprofits distribute the funds for these programs.
While these essential programs aim to address injustices caused by energy disparity, they also undergo challenges in meeting the great need of services. Areas of difficulty in program execution are seen in the distribution of funds and variability in effectiveness of energy cost savings. A review of state WAPs found that most commonly, weatherization efforts include lighting, insulation, and air sealing upgrades, but do not address electrical components or smart thermostat installation [6]. Despite variability in state programs, the non-monetary benefits of program participation, such as increased health and safety factors, are not negligible [5]. Renters often face greater challenges towards implementation, as they are at the mercy of their landlords’ decisions to supply appliances, which carry little incentive to be energy efficient since utility bills are often paid by renters. Furthermore, renters typically have limited knowledge of how long they will reside in their residence, making high-capital cost-efficiency investments risky if they do not remain in the unit long-term [16].

1.2. Efforts to Improve Energy Efficiency

In addition to government-funded assistance programs, many utilities also offer low-income families financial support and energy efficiency upgrade programs. Despite these programs, there is high demand for, but low availability of, energy efficiency services in underserved communities. One strategy to increase the participation of underserved groups in energy efficiency programming is to develop partnerships with non-energy related community organizations that work directly with low-income households [5]. Community-based energy efficiency projects can empower and encourage members of a community to take action collectively while surpassing individual barriers to energy efficiency upgrades and education [4]. Using a community-based approach allows organizations and communities to hold productive conversations about the connections of energy access and social justice issues [4]. This framework encourages the development of programs that provide assistance to communities of color, renters, and low-income groups through trusted networks of existing organizations.
In order to develop equitable energy efficiency programs that are also more cost-effective and scalable than traditional weatherization service, programs can focus on the provision of residential lighting upgrades, at no cost to the resident, instead of whole-house retrofits, which are inherently limited in terms of scale. Light-emitting diode (LED) bulbs provide an excellent opportunity to deliver immediate savings in a low-cost, non-invasive way that is appealing to both renters and homeowners alike. LED light bulbs use 75% less energy than traditional incandescent bulbs, and can last up to twenty-five times longer [17]. Additionally, they require minimal effort to install, making them a great first step towards implementing energy efficiency measures. However, the higher capital cost of bulbs and limited availability can be a barrier for low-income communities [17]. This has motivated the development of programs that distribute or exchange old, inefficient light bulbs for energy efficient LEDs.
An examination of low-income and efficiency programs reported in published literature and white papers found five programs, varied in scope and geographic location, that focus on distribution and installation of LED bulbs [18,19,20,21,22]. Among the five programs, four were initiated through utilities and one through a coalition of universities. Two programs (in Ohio and Washington D.C.) targeted low-income households by distributing energy efficient light bulbs at local food banks; others did not require specific participation characteristics. Only one program conducted post-program data reporting, and only one of the five programs utilized a light bulb “swap” format [18]. A summarized comparison of program elements can be found in Appendix A, Table A1.
Utility-sponsored energy efficiency programs are a common model to encourage residents to adopt more energy efficient technologies. However, this model typically relies on residents proactively seeking, purchasing, and then installing or hiring someone to install the more energy efficient device. For residents who face a high energy burden or have limited disposable income, the utility-sponsored energy efficiency programs are not a perfect fit. There are additional programs offered through other entities to support local emissions reduction efforts.
To encourage higher adoption of energy efficient practices, it is essential that a program address the biases that influence consumer energy use patterns. These influential patterns lead energy users to make economically irrational choices with their energy use [23]. Patterns such as maintaining the status quo, satisfice with “good enough” results, tendency to be loss and risk averse, perceptions of “sunk costs”, as well as distorted temporal discounting can affect rational consumer choice. Rational choice is not the only motivator for behavior, as influences from internal (awareness, values, attitudes, emotion) and external (economic, social, cultural) factors also affect the propensity for energy conservation [24].

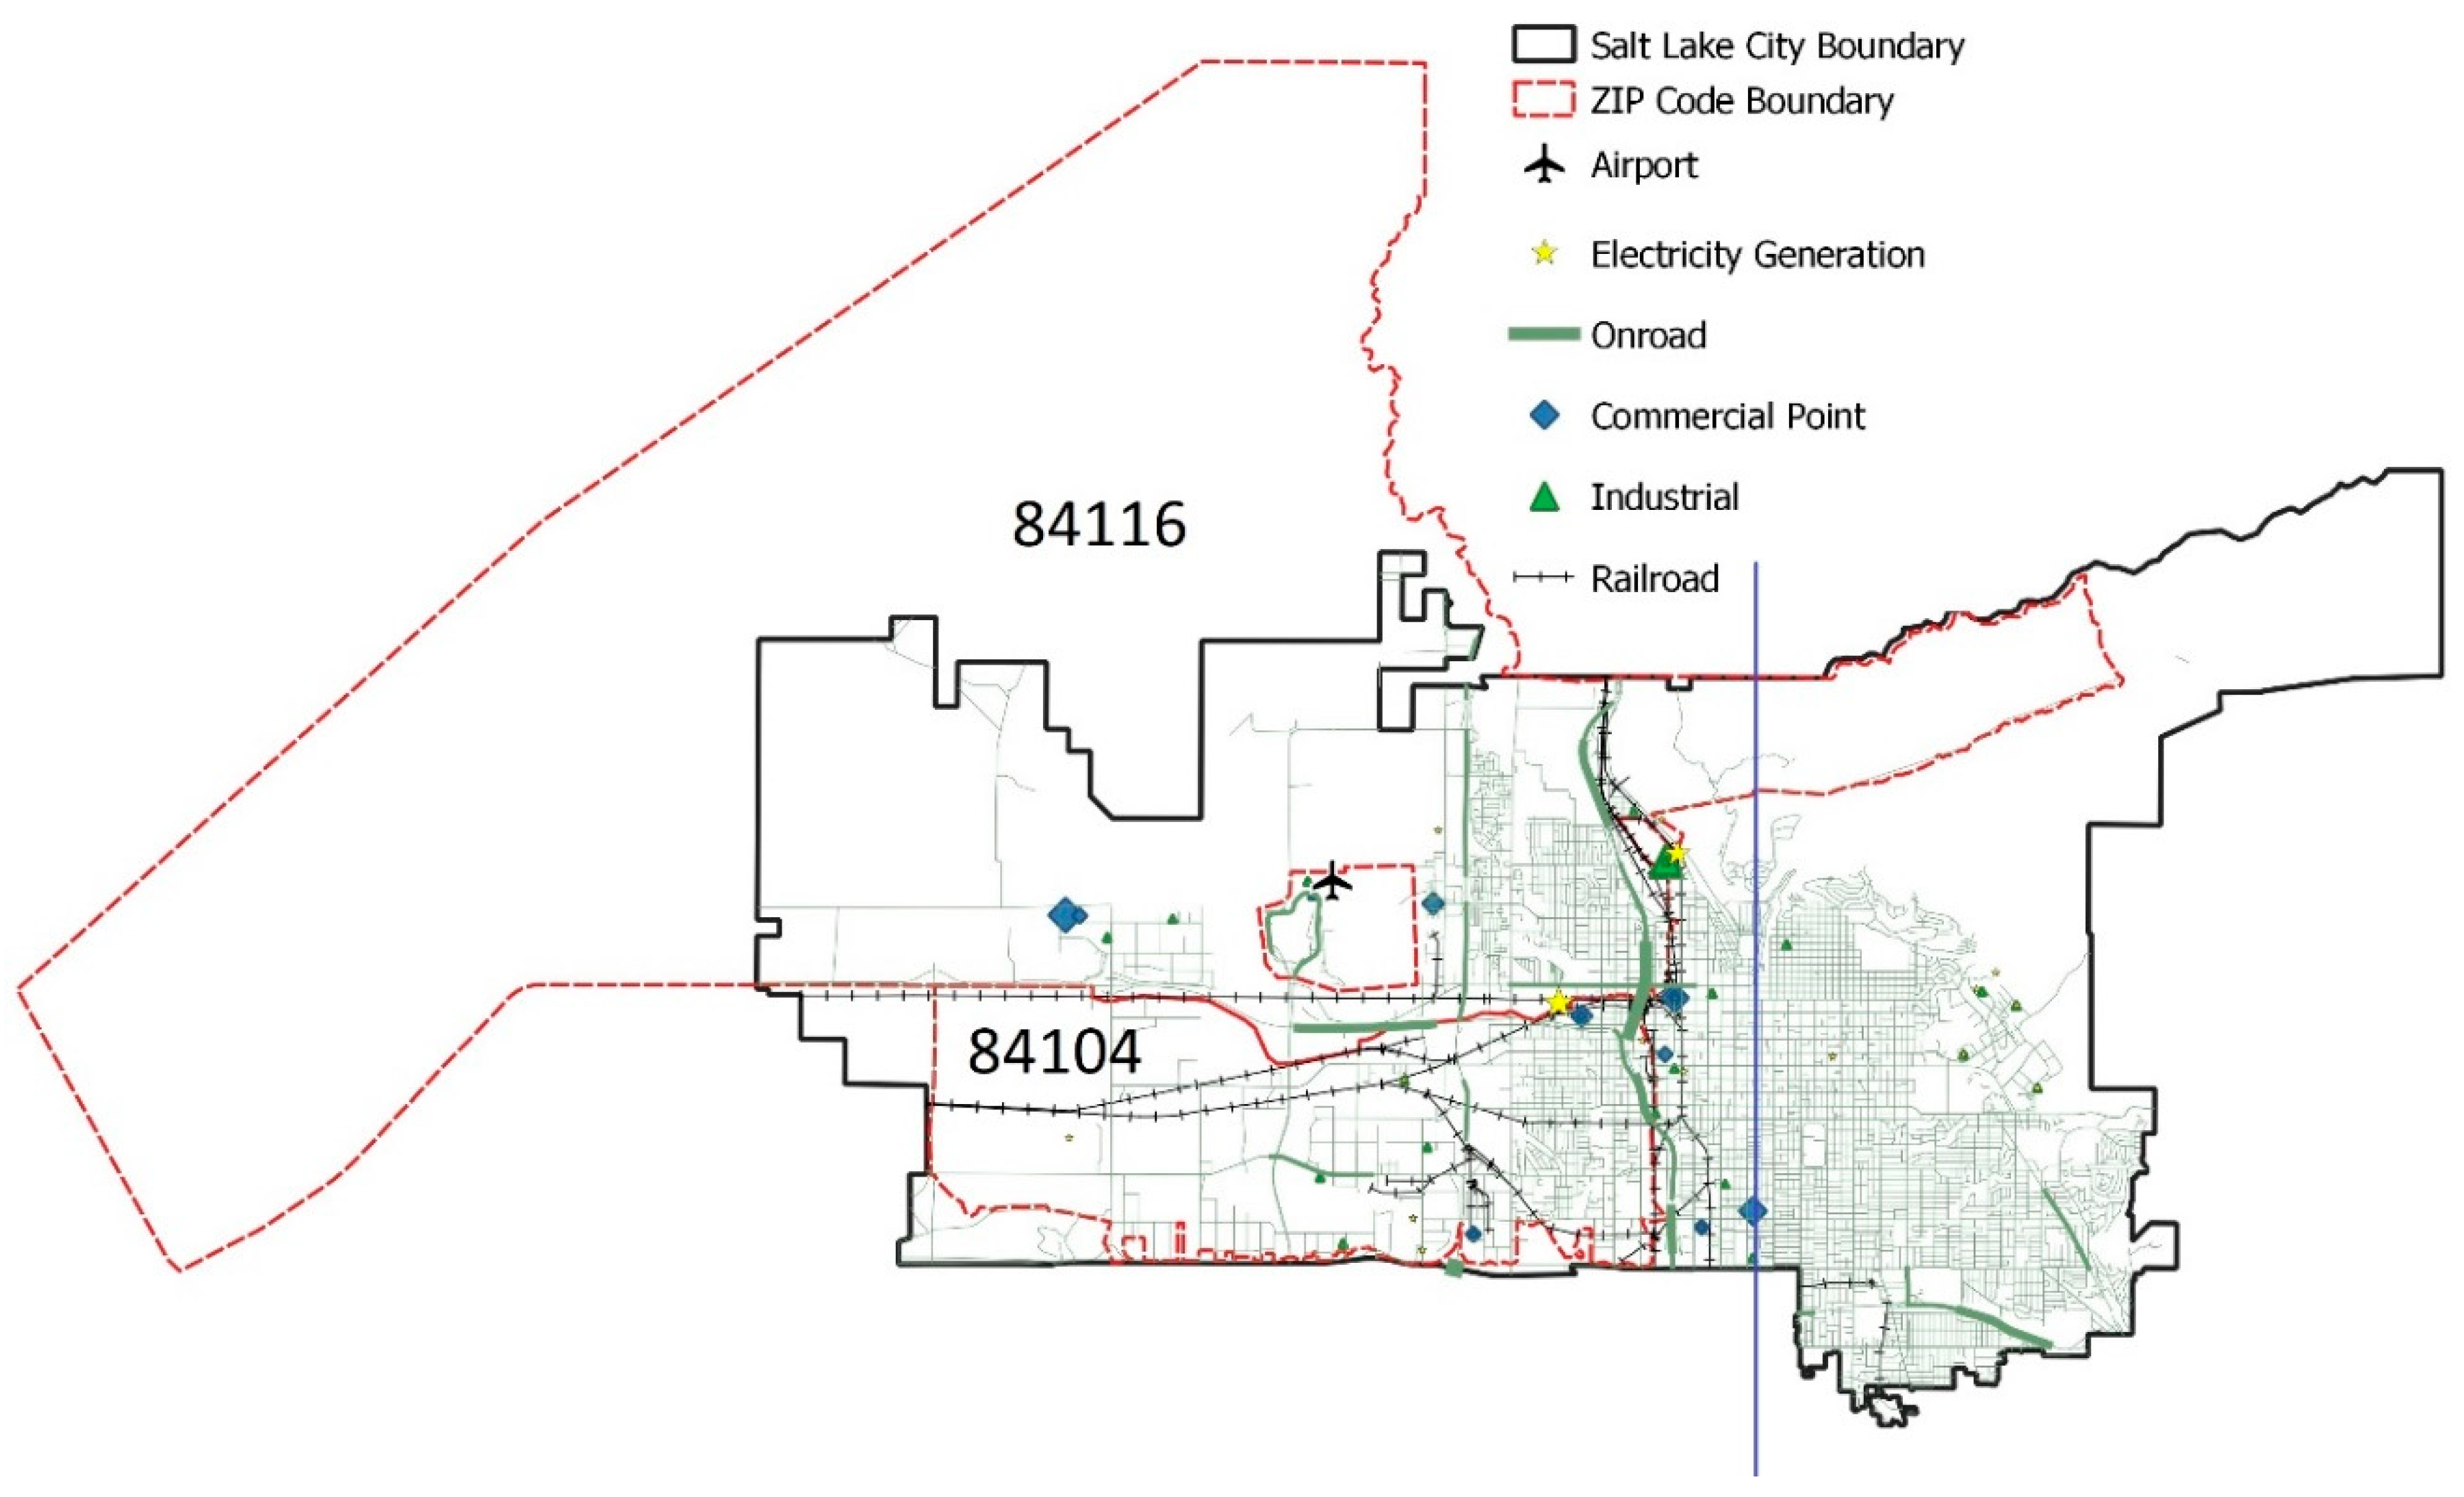
1.3. Case Study: Salt Lake City

In this manuscript we present, as a case study, a pilot program administered by a local Salt Lake City environmental non-profit, Utah Clean Energy (UCE) that aims to:
  • Elicit behavior change by encouraging adoption of energy efficient measures and technology.
  • Address behavior change of groups of individuals considered to be more difficult to reach.
  • Lower cost barriers to provide accessibility of energy technologies by providing free LED bulbs.
Salt Lake City (SLC), Utah’s capital city with a population of 200,000, lies within Salt Lake County (SLCo), and is located at the heart of the Wasatch Front (Figure 1). The Wasatch Front is the main metropolitan area of the state of Utah with approximately 35% of the state’s population residing in Salt Lake County alone [25]. The Salt Lake Valley (SLV) is bounded by the Wasatch Mountain Range to the east, Oquirrh Mountain Range to the west, the Traverse Mountains to the south, and the Great Salt Lake to the Northwest, resulting in a topographical bowl of mountains that almost completely surround the SLV.
While the entire Salt Lake Valley is prone to experiencing severe air pollution, certain parts of the city are more likely to experience elevated levels of PM2.5 [26]. These areas are largely concentrated in the commonly defined “West Side” of Salt Lake City that lies west of I-15. Substantial spikes in air particulates on SLC’s West Side are largely attributable to its numerous industrial facilities that include the airport, railways, refineries, as well as heavily trafficked highways (Figure 2) [27]. The combination of industrial polluters and significant vehicle emissions contribute to an air quality landscape that contains larger and more instances of emissions sources than other parts of the SLV.
Given the adverse public health and energy burden implications of poor air quality in SLC’s West Side and the significant role buildings play in emissions generation (approximately 39% of emissions are attributable to the building sector) [28], there is a considerable opportunity to improve local air quality and community resilience by implementing energy efficiency projects in this area. According to Dominion Energy, the natural gas utility, there is a notable overlap of low-income residents and residents with a higher-than-average consumption of natural gas in these neighborhoods [29]. While the bulk of energy efficiency actions capable of improving local air quality are tied directly to reducing automobile-related gasoline emissions [30], natural gas emissions from buildings are a close second, particularly during the winter. However, these actions and technologies are often more expensive and harder for low-income homeowners or renters to implement, especially without existent ideological buy-in to the importance of energy efficiency [31].
In addition to differences in air quality, the West Side of SLC also has a lower median household income than other parts of the city [32] and is the most culturally and ethnically diverse part of Utah. The combination of these factors poses challenges to the West Side to overcome the air quality burdens it faces. Residents of this area are also more likely to speak a language other than English, which makes many utility and advocacy group messages relating to air quality, relayed predominantly in English, unhelpful to the population. Additionally, West Side residents of lower socioeconomic status are unlikely to possess the financial resources necessary to make home improvements that protect their health and simultaneously lower energy bills. The West Side’s lower median household income compared to the rest of SLC also makes its population more vulnerable to experience energy insecurity. What’s more, Salt Lake County families who fall below 50% of the federal poverty level (i.e., those who have an annual income of $24,600 for a family of 4) spend a staggering 21% of their income on energy ($1698/year or $141/month) [33].
Two main factors determined the UCE pilot target ZIP Codes of 84104 & 84116. First, the income discrepancy between the eastern and western sides of the city, of which the West Side ZIP Codes of 84104 & 84116 house more low-income residents. This provides an opportunity to offer an energy saving opportunity to communities which would normally encounter a cost and accessibility barrier to these technologies. Second, the increased pollution and PM2.5 concentrations experienced in these two ZIP Codes and on the West Side of the SLV, are higher than its eastern counterpart. Energy-saving light bulbs do not directly improve local air but do provide a tangible first step in educating community members about energy efficiency energy use, pollution, and local air quality. Energy efficient light bulbs also save residents energy and money.
The rest of this manuscript is structured as follows: Section 2 describes the materials and methods, Section 3 presents the results, Section 4 provides a discussion of the findings, and Section 5 draws conclusions gained from this study.

2. Materials and Methods

The pilot project was informed by background research and local expert knowledge of the authors, community leaders, and stakeholders engaged through the formulation process. The goal was to communicate with community members potential avenues to reduce energy consumption (programs such as HEAT as well as the LED exchange) to directly save them money, as well as reducing their emissions footprint to positively impact air quality, which is a well-known concern in the Salt Lake Valley. Another component of the educational portion of the program was a follow-up survey to understand whether participants were able to take advantage of these services in addition to potential behavioral change motivated by what they learned from the community events. The list of steps performed were:
  • Survey and community engagement event design with input from community leaders.
  • Participation at community engagement events.
  • Analysis of survey data from community engagement events.
  • Sending follow-up survey to community engagement event participants.
  • Analysis of data from follow-up survey.
  • Calculation of energy, financial, and emissions reductions from pilot project.
  • Extrapolation of potential benefits for an expanded project.

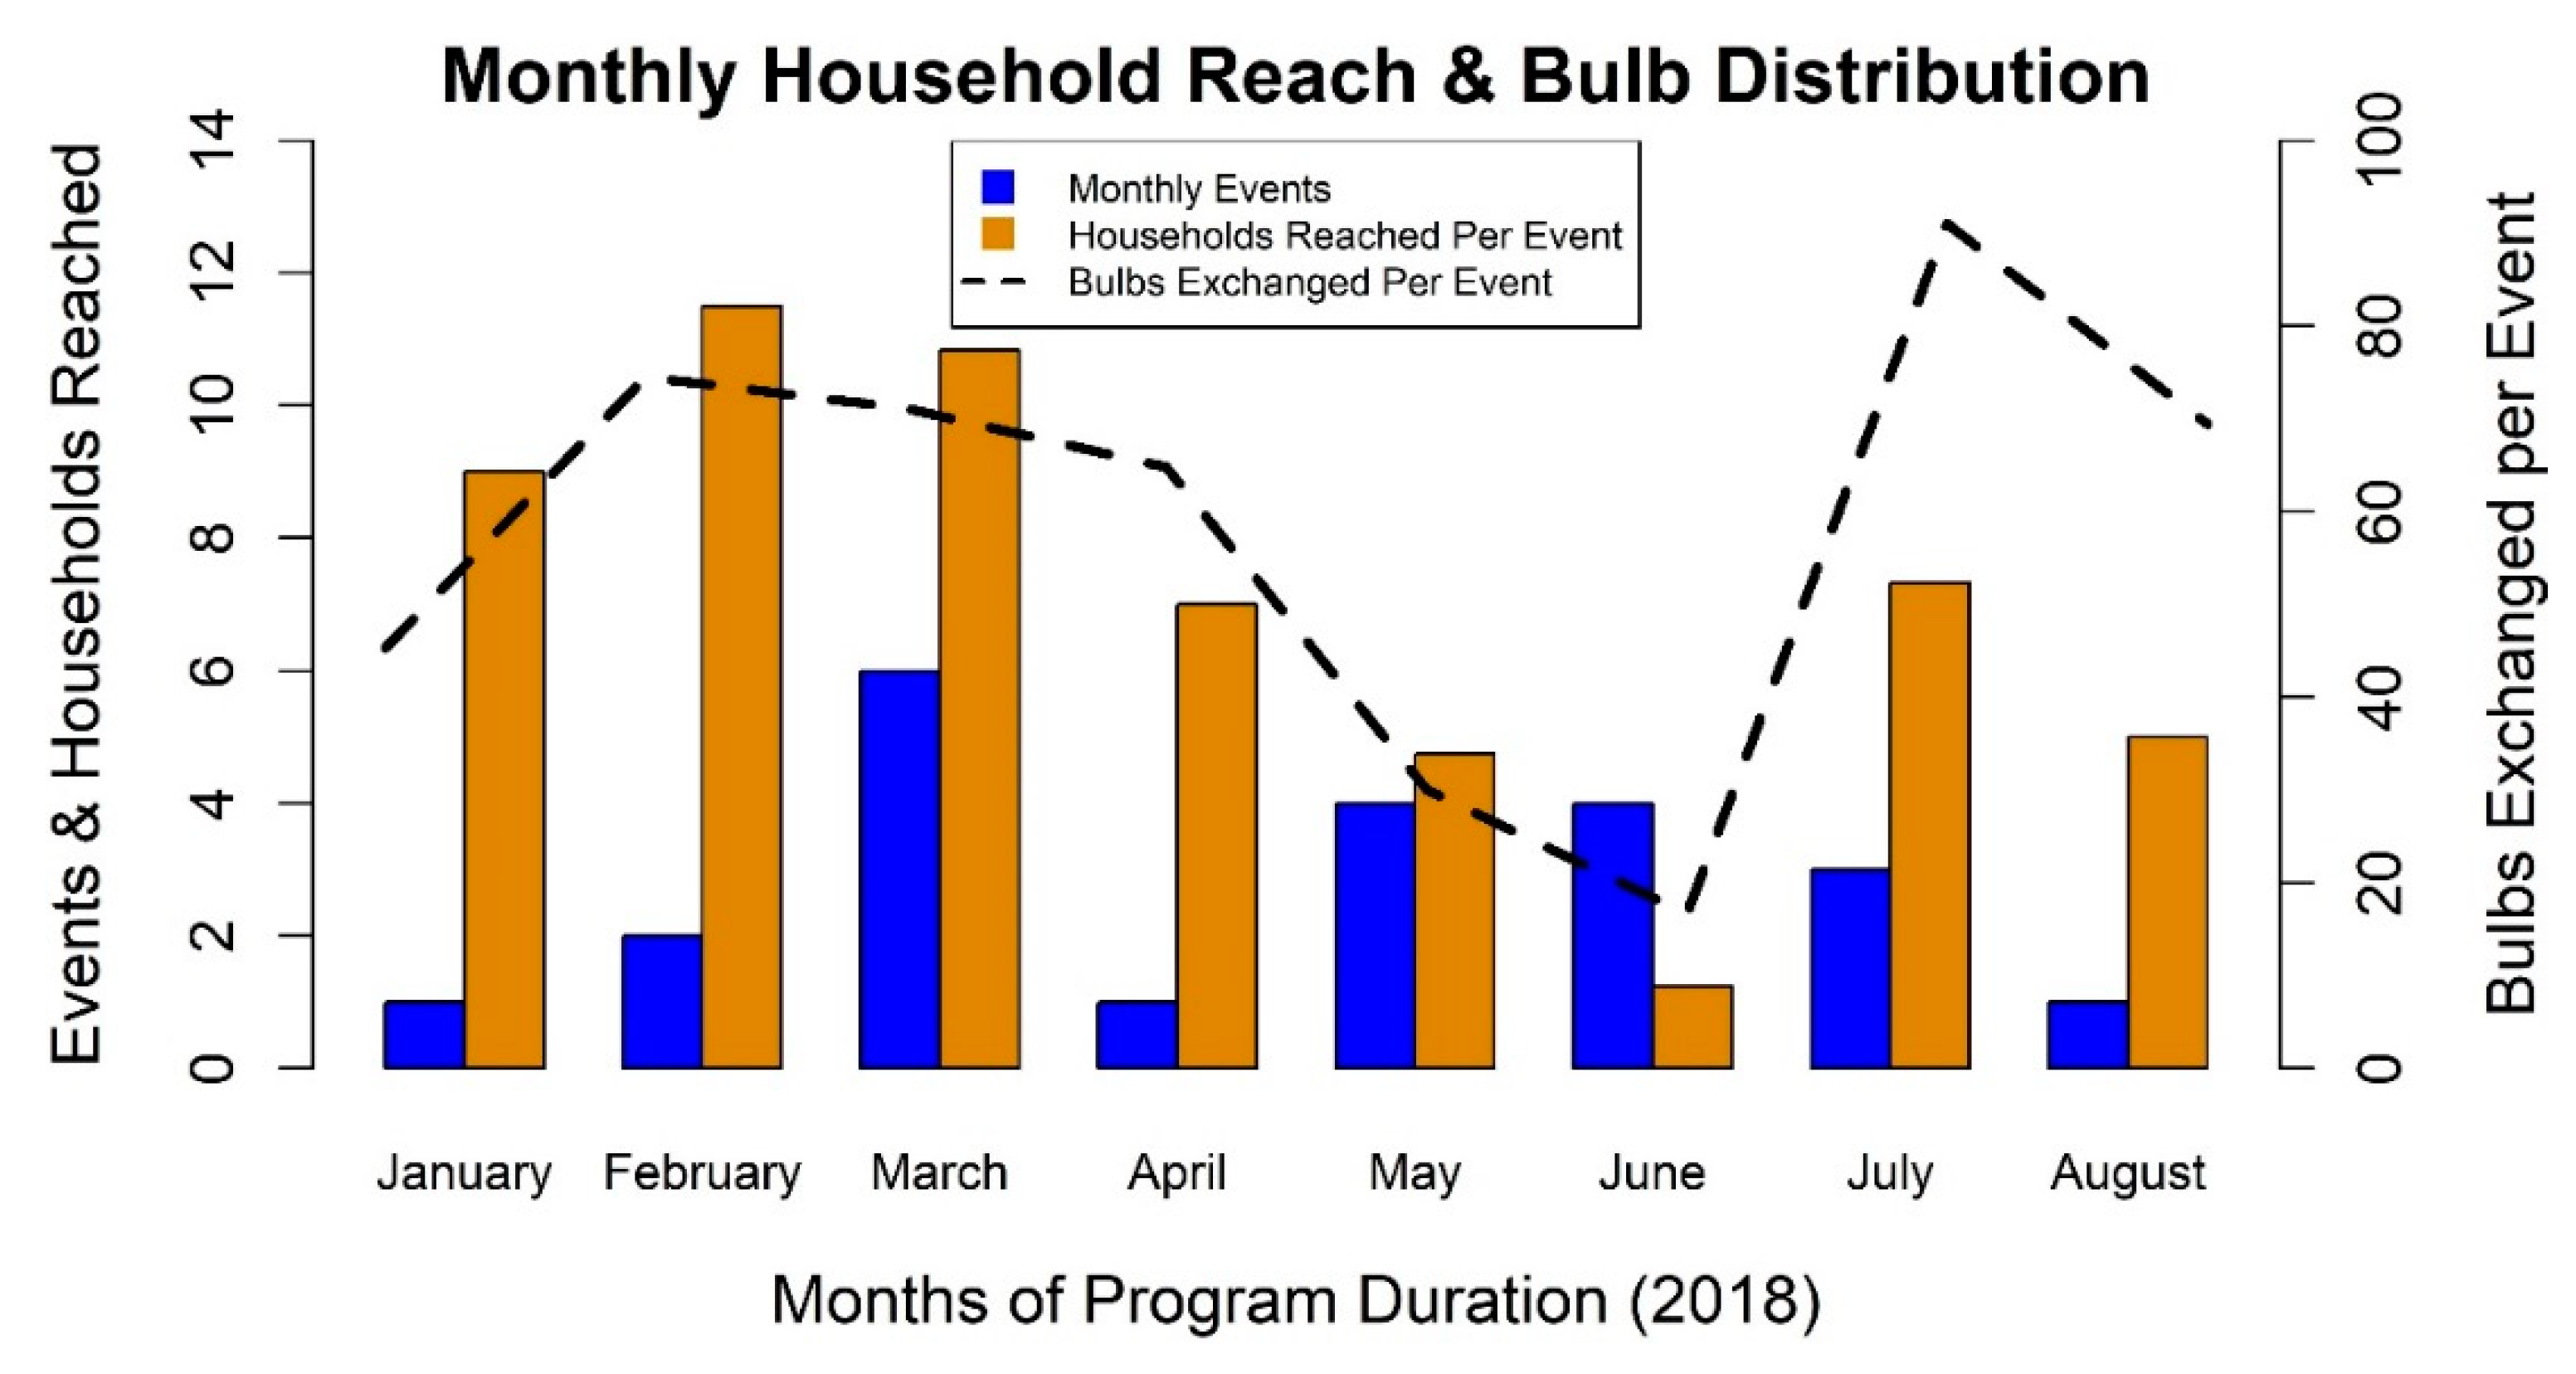
2.1. Community Engagement Events

From January to August 2018, UCE staff attended various community events in targeted areas of the city to hold “Light Swaps”. These events were designed based on discussions with community leaders, stakeholders, and site availability. The events provided the free opportunity for community members to exchange up to 15 older, functional light bulbs with up to 15 energy-saving 9-watt LEDs. The exchange element to this program was imperative for reporting purposes, as this assumed that participants would install the new bulbs immediately, therefore leading to immediate energy, financial, and emissions savings that could be quantified. Comparable to 60-watt light bulbs, these LEDs were 2700 Kelvin (emitting warmer light) as opposed to those that emit bluer white light that measure upwards of 6500 Kelvin. Warmer light emitted from the lower-kelvin bulbs has been found to minimize the impact of artificial light on human health [34]. In addition to free LED light bulbs, participants also received educational materials about the connection energy efficiency has to health, air quality, and climate change, as well as information about other available energy efficiency programs in the area.
Another equally important facet of the program was its educational component, which focused on energy conservation and its implications on health, air quality, and climate change. The pilot was not solely intended to be transaction-based through the exchange of light bulbs, but also aimed to help participants realize the importance of energy efficiency through educational outreach on the benefits of and opportunities to implement energy efficiency in their own lives. At UCE pilot exchange events, participants received information about additional low- or no-cost energy saving strategies that could be easily implemented in order to further increase energy and monetary savings in addition to their LED bulbs. The UCE pilot also presented information about how certain energy efficiency actions could improve local air quality at community council meetings, radio shows, and television news, and created a standing educational display about the intersection of these topics at a local community center in the West Side. Through this program model, UCE began to build relationships with West Side community members and community organizations.
In order to appropriately and more effectively deploy this pilot, UCE partnered with local community leaders and organizations with a presence in the target neighborhoods. The program design process was purposely collaborative in order to increase program efficacy. By leveraging these partnerships, UCE was able to develop relationships and build trust with community organizations and community leaders, better tailor direct promotional efforts of the program, and interface with existing energy and health-related programs to maximize offerings. Through various partnerships, the UCE pilot was able to reach a greater number of households with energy upgrades, surpassing our goal of 150 households by 31.
In order to promote individual light bulb exchange, UCE utilized Facebook’s targeted ad feature to reach residents of the two ZIP Codes, as well as posted flyers around the target communities. We also worked with community event organizers to brainstorm additional methods of promoting specific Neighborhood Light Swap events. For certain events, UCE also employed additional tactics in order to better tailor promotional efforts to that target audience. For example, one Light Swap event was held at a health fair hosted by a county government senior citizen center. Operating under the assumption that many attendees of that senior center did not have Facebook, UCE staff instead gave a brief presentation about the program one week prior to the event taking place and distributed flyers to remind them to bring light bulbs to the health fair later in the week. As a result, participation rates were one of the highest of the 23 total Light Swaps. In addition to these tactics, the UCE pilot was also featured on local news stations, radio, print newspapers, and a local podcast.
As a component of the light bulb exchange, program participants were required to complete a two-page survey (Appendix A, Table A2) that solicited demographic and geographic information including: participant’s address, ethnicity, preferred language, household income bracket, and number of people in the household. This data was used to both determine program success in reaching a population representative of the area’s demographic diversity, and in helping to iteratively adjust program outreach and messaging strategies.
Utilizing the data collected from participant surveys and exchanged light bulbs, we were able to determine:
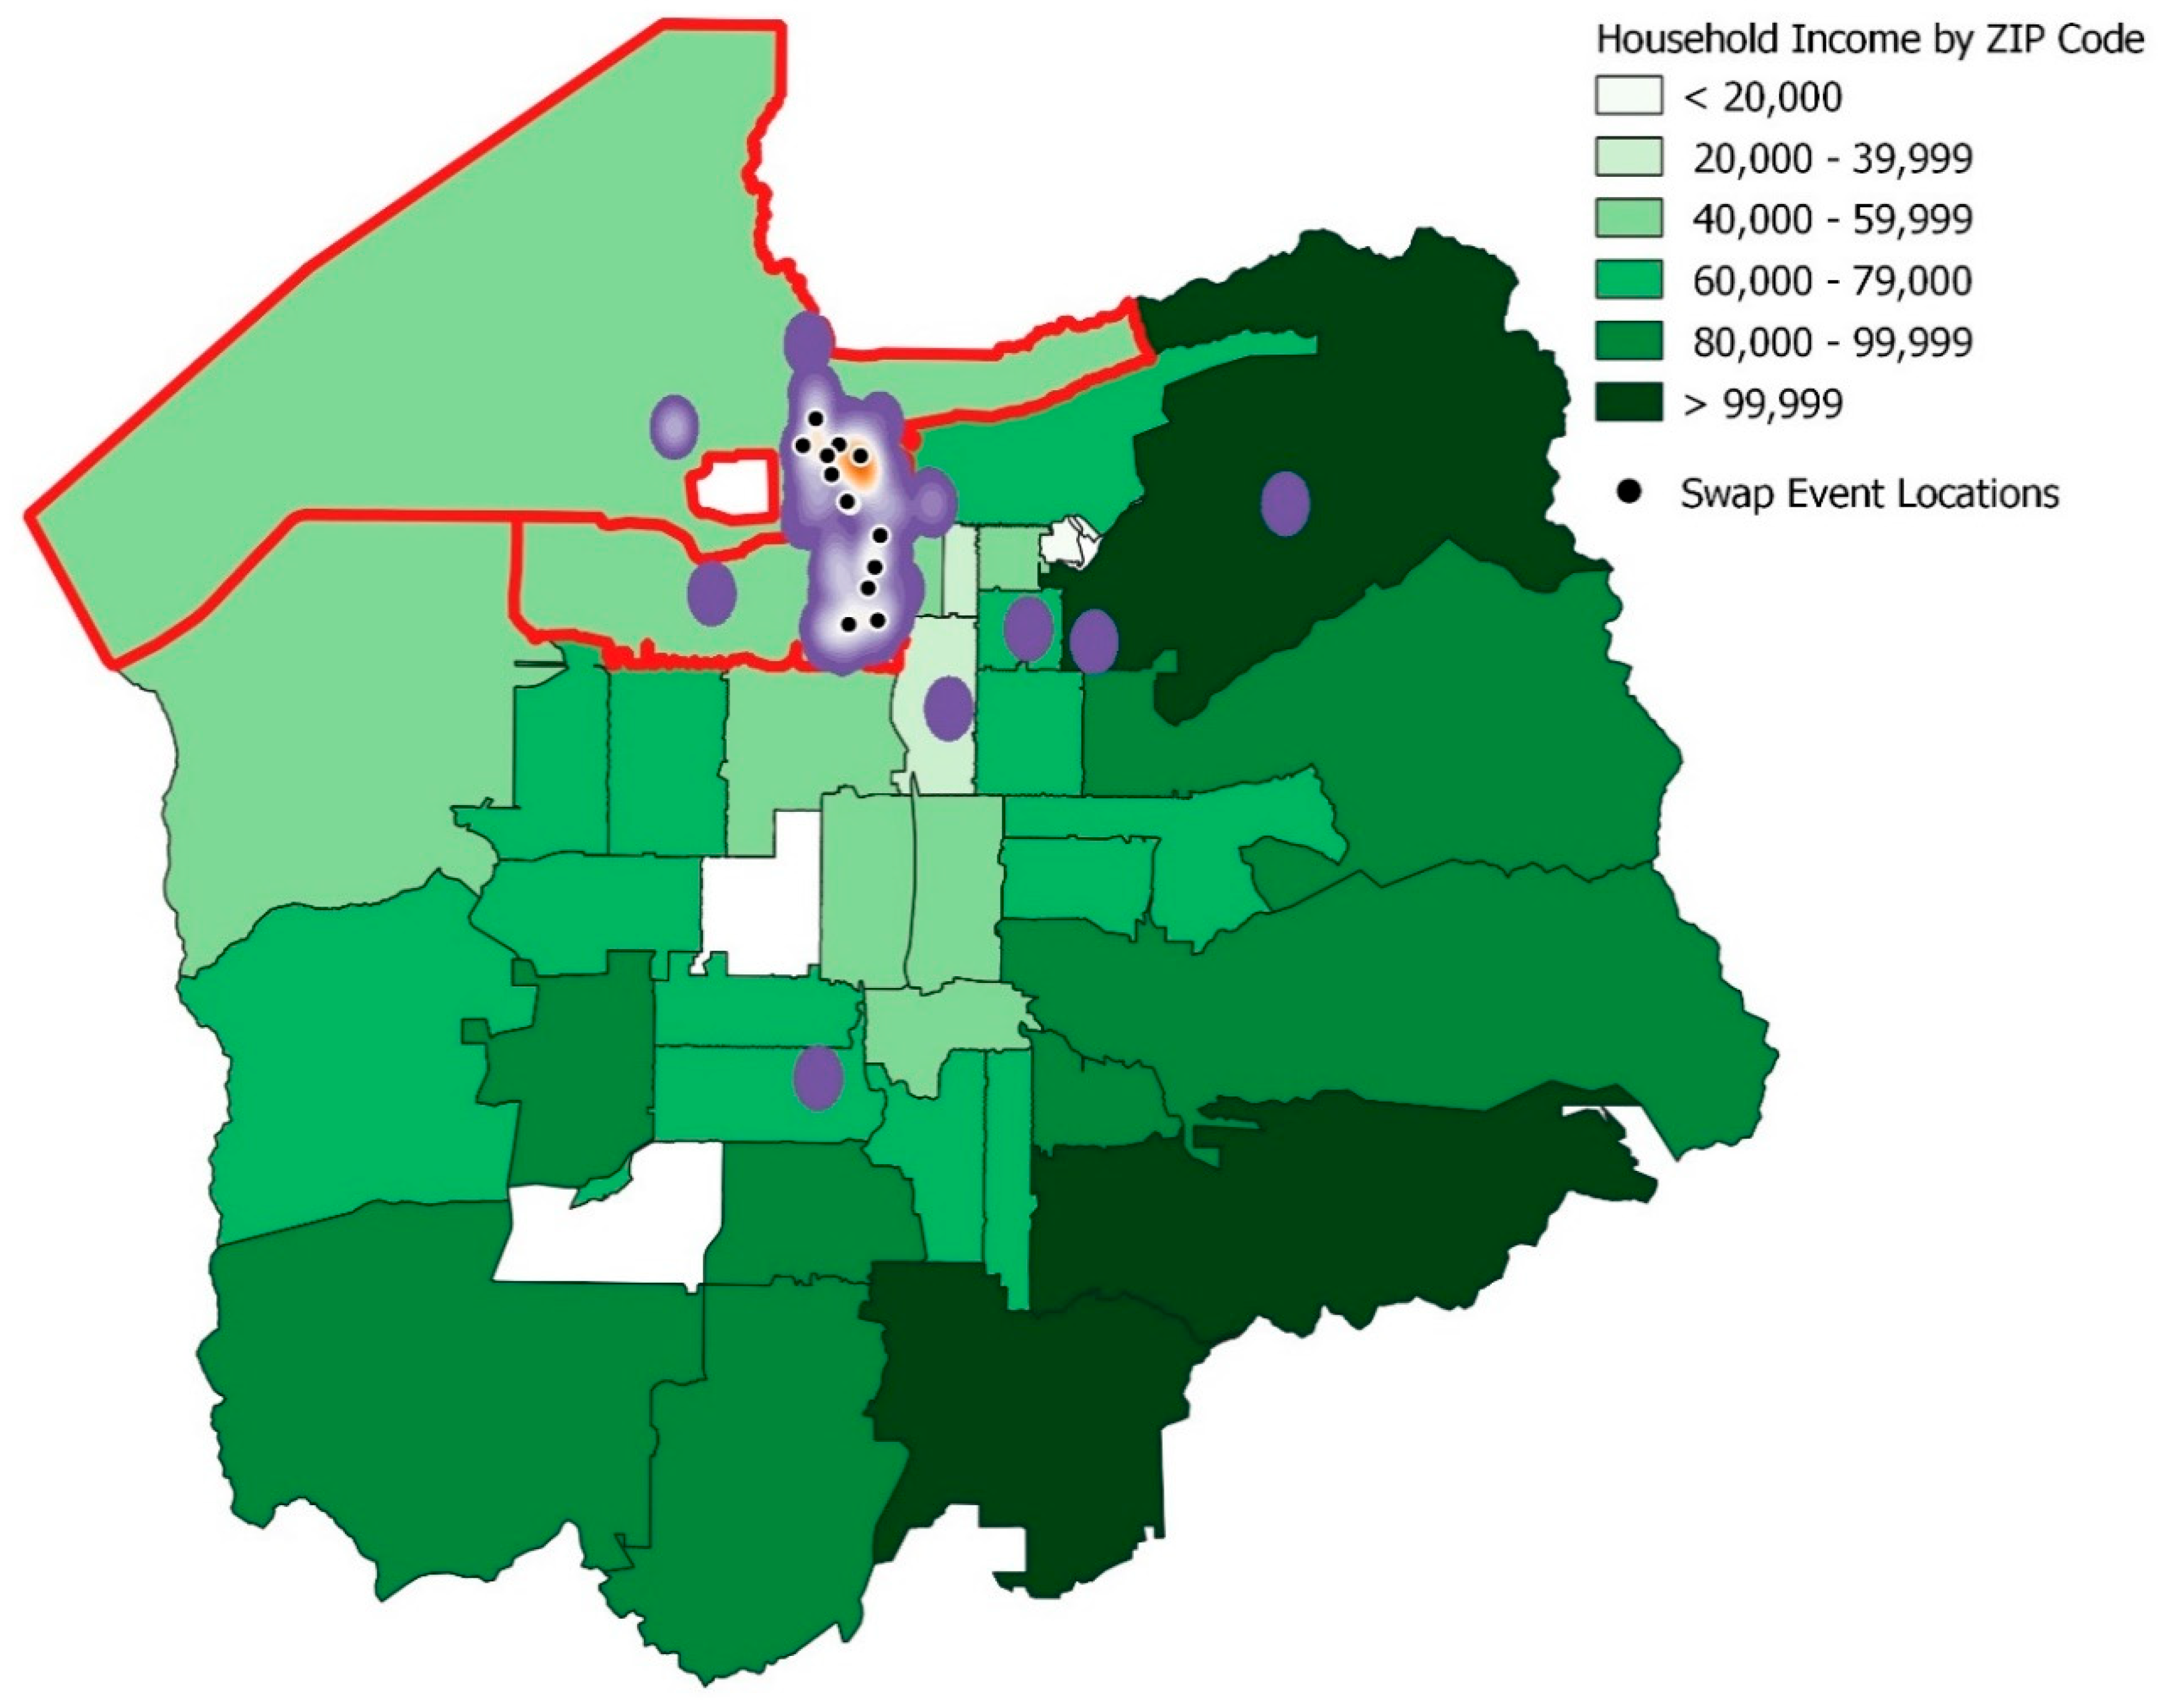
  • The spatial distribution of program participants throughout participating ZIP Codes, and the relative distance between participating households and swap locations.
  • The energy savings and emission reductions resulting from this program, which was based on actual wattage of exchanged bulbs compared to LEDs and was calculated in terms of annual kWh savings and carbon dioxide emissions reductions.
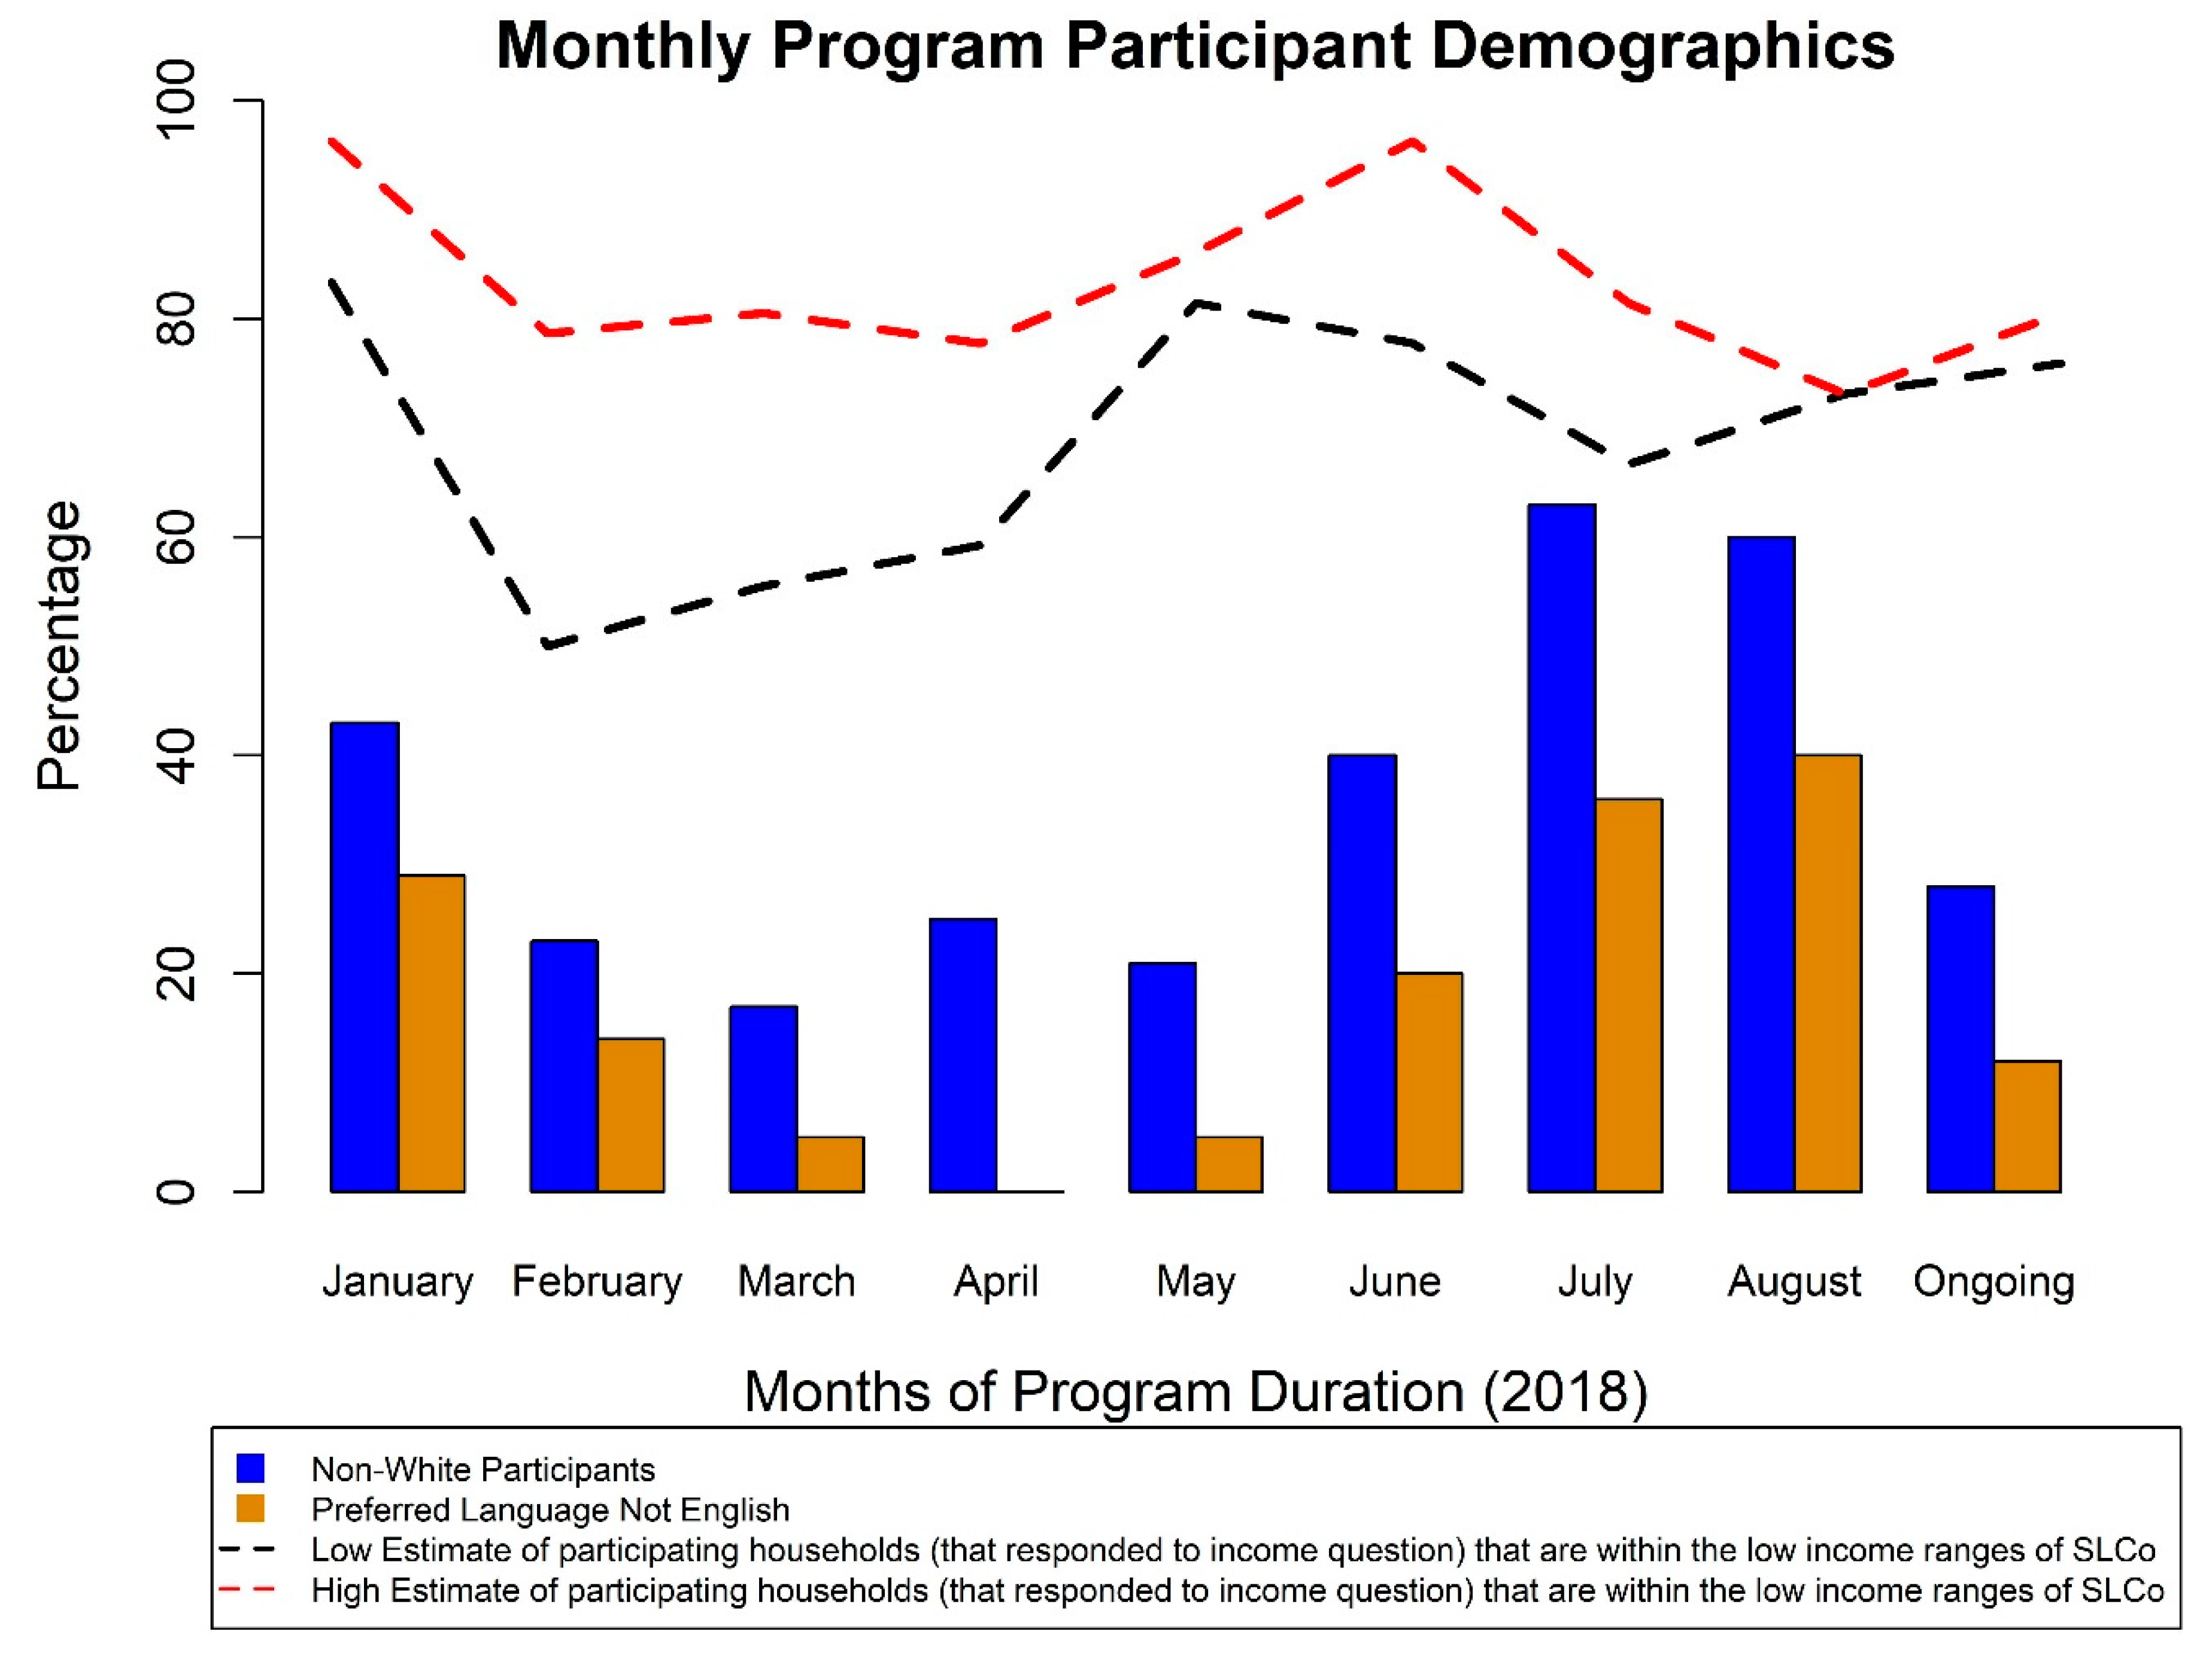
  • The percentage of program participants that either fell below the Federal Poverty Line or met the criteria to be classified as “low-income,” “very low-income,” or “extremely-low income” according to the Federal Income Guidelines for Salt Lake City [35] (Appendix A, Table A3).

2.2. Follow-Up Survey

The UCE pilot was not only concerned with energy reduction and financial savings, but also with increasing participants’ knowledge on energy efficiency and its implications on health, air quality, and climate change. To gauge this component of the program, UCE emailed a follow-up survey to participants (Appendix A, Table A4). We measured the success of the program’s educational outreach component on the responses from those that completed the survey with a particular focus on whether participants had sought additional resources such as insulation assistance with Energy Experts (a local company offering subsidized services for low-income households, Salt Lake City, UT, USA), HEAT/WAP, and energy saving kits from Rocky Mountain Power (electricity utility company, Salt Lake City, UT, USA). In order to incentivize participants to complete the follow-up survey, UCE promoted that those who completed the survey would be entered to win one of three $50 gift cards.

2.3. Calculation of Energy and Financial Savings

In order to calculate energy reduction and financial savings associated with the light bulb exchanges, we recorded the wattage of each exchanged light bulb to calculate an average light bulb wattage. Most light bulbs exchanged included the original manufacturer’s wattage rating; however, the manufacturer’s wattage rating was not visible on 27 of the total 1432 bulbs exchanged. To account for these 27 bulbs, UCE assumed a wattage of 60 for each as this was the most common light bulb present in the exchange. Based on the 1405 exchanged light bulbs with a visible wattage stamp, UCE calculated that the average exchanged light bulb was 48.6 watts.

2.4. Calculation of Avoided Emissions

Calculations of emissions saved relied on data provided by the Emissions & Generation Resource Integrated Database (eGRID) [36], which utilizes information provided by the United States Energy Information Administration (EIA) and United States Environmental Protection Agency (EPA) Clean Air Markets Program Data. We utilized eGRID’s calculated emission factors for each kilowatt-hour (kWh) of electricity saved in the state of Utah to calculate the equivalent amount of carbon dioxide emissions that are avoided as a result of the electricity saved through the UCE pilot. Specifically, this analysis relies on the categorized output emissions rate based on the specific integrated resource pool used to power the state of Utah [36]. This rate reflects an aggregate average of the emissions for the Northwest Power Pool to which Utah belongs, and does not take account of the point source emissions from local power plants in specific cities or regions of the state.
Utilizing the eGRID conversion rates of the total kilowatt-hours of electricity saved to pounds of carbon dioxide (CO2), nitrogen oxides (NOx), nitrogen dioxide (NO2), and carbon dioxide equivalent (CO2e) for the state of Utah, the program was able to quantify reductions of each type of emissions annually. The wattage of every light bulb exchanged for a 9-watt LED was recorded to calculate a light bulb average for the entire program which was used in these quantifications. In order to have a temporal figure, calculations were also based off of an assumption that participant lights, on average, were turned on for 8 h each day (Appendix A, Table A5).

2.5. Scaling Potential Energy Savings

UCE utilized pilot data to extrapolate the potential for emissions savings and net benefits if the program were scaled. This coarse estimate of net costs and benefits of expanded programming relies on several key data points collected from the pilot program including: participating households, self-identified ethnicity, program costs, calculated avoided emissions, and calculated cost savings. Other assumptions utilized in calculating program expansion were the average watts for exchanged bulbs, project duration, and events per month. These data sets were used to estimate the scaling up of a wide-reaching “Light Swap” for the ZIP Codes of 84104 and 84116.
We also calculated a cost-benefit comparison of program expansion utilizing the UCE pilot costs, valued energy savings from exchanged bulbs, and avoided emissions valued at the social cost of carbon. Pilot costs include materials for events, such as tabling materials and printing costs, as well as labor hours for outreach, program organization, and events, plus reimbursement of miles traveled for events and meetings. It is important to note that the LED bulbs for the pilot were donated in entirety by Rocky Mountain Power, Salt Lake City’s utility company. For the program extrapolation, it was assumed that a discount of 40% be applied to per unit cost to account for potential discounts due to large bulk acquisition or incentives from partnered retailers. Energy savings from exchanged bulbs were calculated in the same manner as the UCE pilot, utilizing differences in wattage for exchanged bulbs and a rate of $0.11/kWh. Lastly, the avoided emissions due to swapped bulbs were valued at the social cost of carbon rate of $39.19, reflecting a value of $36 as defined by the EPA [37], adjusted for annual growth at an interest rate of 3.5% [38]. The present value of net benefits was found by subjecting the calculated net value (value of benefits minus cost of implementation) to an interest rate of 5.5% for each implementation year. This was then summed to reveal the total present value of net benefits over the lifetime of an LED. The full present value of net benefits could be considered as the discounted rate of avoided emissions at the social cost of carbon over the lifetime of the LED 9-watt bulb, on average 40,000 use hours (approximately 14 years of daily, 8-h use).
We utilized the same key model with adjusted assumptions to examine the outcomes of an expanded Light Swap at one hundred percent participation in the targeted ZIP Codes and all Salt Lake City ZIP Codes. In this scenario, we extended the project lifetime to 5 years of implementation and 8 events per month to reach these ambitious goals.

3. Results

3.1. Demographic Characteristics of Program Participants

Throughout 23 events over the eight-month period of the program duration, the UCE pilot reached a total of 181 households and exchanged a total of 1432 light bulbs with 9-watt LEDs (Figure 3). Twenty-two events were held on a specific day and time as part of a larger community event, while one event was held continuously from March to June 2018 during open hours at a community center to provide greater convenience for residents interested in participating but unable to attend specific events.
In order to gauge the success of outreach, we included a required question on the survey asking how participants heard of the program. 92 percent of households responded to that question, revealing that the most common way participants found out about the Light Swap program was through Facebook (25%), followed by “at the event”, and “at the senior center” (both 13%). Through surveying event participants, we were able to extract demographic information that would be valuable for guiding future community outreach efforts. Based on participant survey responses, demographic data representing the 181 participating households is presented in Table 1 and Appendix A, Figure A1. Appendix A, Table A6 lists the estimated percentages of participating households that would be considered low or very-low income.

3.2. Spatial Analysis of Program Reach

The spatial analysis of the participating households was made possible through the collection of self-reported addresses from respondents, which were kept confidential aside from their use for analytical purposes. Of the 181 participating households, 177 addresses were utilized in spatial analysis as there were 4 participating households that did not disclose an address or disclosed an address that was unable to be read or geolocated. Figure 4 shows a heatmap resolved at 0.5-mile resolution for each participant and includes swap event locations and Appendix A, Table A7 lists the transit accessibility of event locations.
The event location type with the highest number of participants was the library, which saw 40 participating households across 4 events. This was closely followed by a community center, which was the location of the ongoing Light Swap and two other events seeing 35 participating households.
Some findings of the spatial analysis of the program were:
  • 97.80% of participating households were able to be geolocated.
  • 92.65% of geolocated homes (164 homes) were found to be within a one-mile radius of an event location.
  • Of the geolocated households, 3.95% (7 homes) fell outside the target ZIP Codes due to accidental participation.

3.3. Follow-Up Survey Responses

Twenty-two percent of those who received the email survey completed it. Responses to the follow-up survey are shown in Appendix A, Table A4. Members of the outreach team spent a significant portion of their interactions with LED swap participants explaining programs such as HEAT and WAP, as well as rebates from the utility company (Rocky Mountain Power) and assistance programs from Energy Experts. A large number of respondents (75%) reported that after participating in the UCE pilot, their understanding and awareness of the connection between saving energy and reducing pollution had increased some or increased significantly. However, less than half of respondents had sought out additional assistance from Rocky Mountain Power, Energy Experts, or the WAP/HEAT programs.

3.4. Electricity and Emissions Savings Resulting from the Pilot Project

The UCE pilot exchanged a total of 1432 inefficient light bulbs (with an average wattage of 48.6 watts) for 9-watt LED light bulbs. Given an assumption that each light bulb would be on for 8 h per day, these exchanged bulbs accounted for 165,623 kWh of electricity savings, which is equivalent to the annual electricity consumption of 19.1 average Utah homes [39]. These values are derived from monthly consumption for 724 Utah homes resulting in an average annual consumption of 8688 kWh for 2018. The potential annual emissions reductions that the UCE pilot could achieve are listed in Table 2.
Additionally, the UCE pilot delivered an estimated $18,219 in financial savings across the total 181 participating households, saving each household an average of $100.66. Rocky Mountain Power charges Utah customers using a tiered rate design, which ranges from $0.08–$0.14 in the summer (May through September) and $0.08–$0.11 in the winter (October through April). Because of this range, UCE assumed an average of $0.11 to utilize in this calculation [40].

3.5. Taking Energy Savings to Scale: Estimated Impact

There are several key assumptions that UCE changed to estimate expanded programming of a future UCE pilot, but otherwise rely on data reflecting actual participation in the pilot program. The comparison between actual data and modified assumptions for extrapolation in the program expansion are shown in Appendix A, Table A8. UCE identified a linear relationship between various event factors in the pilot program. Equation (1) describes the mean response in exchanged light bulbs as a function of the number of participating households and order/number of previous events:
µE,H = β0 + β1H + β2E,
Here µ is the number of lightbulbs exchanged during event number E consisting of H participating households. The coefficients β0, β1, and β2 were calculated to be −24.0485, 7.6481, and 2.1214, respectively.
Table 3 reflects the outcome of extrapolated increased participation in the ZIP codes of 84104 and 84116, reflecting the assumptions of Appendix A, Table A8. Calculations are based on a 2%, 5%, and 7.5% participation rate in the targeted ZIP codes.
The outcome of the present value of summed net benefits due to valued avoided carbon and electricity savings is shown in Table 4. While the pilot produced clear benefits, expanding the program, even to relatively modest levels, would yield significant monetary benefits.

4. Discussion

The pilot project described in this manuscript is impact and unique for two main reasons. The first is the 1-for-1 exchange component, which provides more certainty that participants will install the LEDs immediately in place of inefficient bulbs that they exchanged. As a result, we can more accurately quantify the impact of the pilot project on energy, economic, and emissions savings. Secondly, consistent appearance at community events and community centers assisted with the participation in this program. By being involved in every opportunity available to the program, we were able to reach a large spectrum of community members. For example, the highest attended event was an Asian American cultural celebration at a local library.

4.1. Program Participation

The pilot study showed that there are non-negligible seasonal differences in participation. Events held during the winter months tended to attract a substantially higher number of households leading to larger numbers of bulbs exchanged. A possible explanation is that during the summer many families are vacationing and there are competing events such as festivals and outdoor recreational activities. Since the events were held in different locations, a larger study with consistent locations could shed light on this observation.
Event locations were not selected for their proximity to transit, but it is important to consider the existence of accessible transportation options to event locations for participants without vehicles. We found that less than 2% of the participating households were located farther than a 10-min walk from a bus stop, and all event locations were within a 10-min walk of at least 3 bus stops. It is important to note that in this analysis, the schedule of bus routes was not examined in the context of event times. In future iterations of LED exchanges, it may be worthwhile to collect information on how participants arrived to exchange their light bulbs to evaluate if participants utilized public transportation to arrive at event locations.
Less than 4% of participating households were located outside the target ZIP codes. These community members were considered “accidental participants” since they arrived at the event without knowing the ZIP code restriction but were ultimately not turned away. The high percentage of targeted participation is likely due to targeted ads in social media as well as a successful community liaison participation.

4.2. Challenges Encountered

There were difficulties present throughout the Neighborhood Light Swap pilot. Complications occurred when soliciting personal information from a small number of participating residents. Most commonly, this was experienced due to: linguistic barriers, cultural differences, and at times, weariness to the survey with regards to how the program sponsor would use the information collected. All participants were informed that their responses were for grant reporting purposes only, but some felt uncomfortable answering certain questions despite the opportunity to opt out of answering more sensitive questions regarding topics like ethnicity and income. Other community members expressed distrust at providing their personal contact information such as email, phone number, and address out of concerns about their privacy. Additionally, some program participants spoke only Spanish, which complicated verbal communication, as not all staff were proficient in the language. Understanding these demographics (especially those that correlate with a greater likelihood to experience energy insecurity such as income, ethnicity, and renting), is imperative to future community program work. An examination of these figures suggests that future iterations of this program should pursue stronger collaboration with organizations, leaders, and government services agencies associated with vulnerable communities in order to encourage greater participation by community members who would benefit the most from energy efficiency. Since the primary goal of the project was to exchange LEDs within the target ZIP codes, the demographic distribution of participants was less relevant. However, future efforts will seek to engage more representative participation.

4.3. Potential Energy Savings by Program Expansion

There are several key items to note about the extrapolation calculations utilizing the linear equation representing the response in bulbs given the number of participating households and number of events. First, as the relationship of bulbs as a mean response of participating households and number of events is a linear relationship, it does not represent the marginal decline in participation after reaching a saturation point of participating households. Second, due to the manner that the linear equation was used in these calculations, there is no way to implement a limit or bound on the number of bulbs exchanged by a household. This does not reflect the 15-bulb limit per household as dictated in the pilot program. Last, as this is an extrapolation beyond observable data, it should be viewed as a coarse estimate that may not reflect actual participation in the program. In this case, it provides a general idea of what large-scale implementation of LED exchange programing may look like.
Expanding programming to the entirety of Salt Lake City could also provide increased benefits. Utilizing the same key assumptions of the extrapolation within 84104 and 84116 at 2% of total households in all Salt Lake City ZIP Codes (84101–84106, 84109, 84116) added an additional 1375 participating households for an exchange of an additional 10,513 light bulbs. Expanding the program reach to 2% of the entirety of Salt Lake City equates to an additional 928.84 metric tons of CO2 in avoided emissions each year after the project implementation is completed. This is a financial benefit of approximately $2.9 million dollars in electricity savings and valued carbon emissions at the social cost of carbon.
In the final scenario where one hundred percent of participation occurs, we assume that all 18,281 households in 84,104 and 84,116 and 87,010 households located in all Salt Lake City ZIP codes would participate in the program. The estimated impact from the two ZIP codes would lead to an exchange of 147,383 LED bulbs, amounting to 13,021.74 metric tons of carbon (14,354.01 US short tons) each year after the implementation of the project is completed. Benefits from this exchange would be valued at over $21 million in net benefits due to electricity savings and avoided carbon emissions over the 14-year bulb lifetime. By assuming all participation of Salt Lake City ZIP codes, these 87,010 households would exchange 673,030 LED bulbs (roughly 8 per household). This equates to a potential savings of 59,464 metric tons of carbon annually after full project implementation and over $96 million dollars in net benefits over 14 years due to avoided carbon and electricity savings. We estimate the cost of such an ambitious goal to be $528,365 over a 2-year implementation.

5. Conclusions

5.1. Implications

The UCE pilot successfully achieved measurable energy, emissions, and financial savings in residential households in targeted locations to combat the issue of energy insecurity. This was accomplished by providing free lighting upgrades, resources, and education to residents. The UCE pilot engaged 181 households, exceeding its goal of 150 households, and saved each household an estimated $100.66 annually, on average. The impacts from this pilot have reduced demand for electricity resulting in a reduction of 122.23 tonnes of CO2 emissions per year. These reductions are non-trivial, at both the individual and collective level. Beyond the immediate impacts, the education provided to residents showed that the majority of residents became more aware of their energy consumption and adopted behavior leading to reductions. Establishing a connection with the local community as well as community organizers for future energy savings projects was a significant step in further program implementations and useful knowledge.

5.2. UCE Pilot Limitations & Obstacles

Funding for staff time and funding to purchase materials were the greatest limitations for this program. Because the UCE pilot was provided completely free of charge to participants, it could not generate funds to directly support the program offerings and increased staff time. In addition to this limitation, we have also found there to be obstacles of cultural and linguistic differences in reaching more households. Although materials were translated into another common language, Spanish, the UCE pilot would have benefited from engaging a “messenger” with a direct relationship to targeted communities so that participation might increase. This could also aid in the communication of this program as staff have not always been able to accommodate those speaking languages other than English, nor address certain concepts in a way culturally relevant or understandable to some. We envision avenues circumventing this obstacle such as strengthening and creating more partnerships with organizations and groups serving these various communities in the area in our expansion efforts.
Despite the UCE pilot’s success in terms of emissions reductions and participation, analysis of participants’ demographic data indicates that participants in the UCE pilot were not representative of the ethnic and income demographics of the target ZIP Codes. Several factors may have contributed to this result, including: the distance of UCE pilot event locations from public transit, the lack of culturally relevant messaging, the lack of Spanish-speaking staff at events, and the lack of trusted messengers participating in events. To address the lack of demographic representation among participants, subsequent expansion efforts will include more direct engagement with trusted members of the targeted communities and stronger attempts to engage participants in energy efficiency education.

5.3. Future Work

This program will continue following the initial pilot. UCE was selected by Salt Lake City as a grant recipient to continue this work administering a Community Energy Engagement program beginning late 2018. Rebranded as “Empower SLC”, UCE is moving beyond hosting light bulb exchanges at community events. To provide greater convenience to residents, UCE has established six permanent light bulb exchange locations administered through three partnering organizations in the two ZIP Codes: a community center, a food pantry, and four locations that provide utility bill payment assistance. Participants can exchange up to 15 light bulbs during facility hours of operation at the community center, upon receiving food pantry service, or at their utility bill payment assistance appointment.
In addition to these permanent light bulb exchanges, the Empower SLC program has introduced a partnership project titled Energy Ambassadors. This provides an opportunity for selected organizations or groups working with various communities along the West Side. An Energy Ambassador is a representative (or a small team of representatives) that will (1) teach residents in the target ZIP Codes about the importance of energy efficiency and (2) help residents cut energy waste in their homes through organizing and hosting creative and impactful events at convenient locations in the community. The Energy Ambassadors initiative seeks both to achieve energy and pollution reductions while furthering the mission of each participating organization through the awarding of a grant to support their core mission. Through this program branch, Empower SLC seeks to reach more diverse households than the UCE pilot, as it has the potential to overcome community distrust, language, or cultural barriers, thus addressing the pilot program’s limitations.

Author Contributions

Conceptualization, D.L.M., E.R., K.E., S.S., S.W.M.; Methodology, E.R., K.E.; Software, D.L.M., E.R., S.S.; Validation, E.R., S.S., S.W.M.; Formal Analysis, E.R., S.S., S.W.M.; Investigation, D.L.M., E.R., S.S., S.W.M.; Resources, D.L.M., K.E.; Data Curation, E.R., K.E., S.S., S.W.M.; Writing—Original Draft Preparation, S.W.M.; Writing—Review & Editing, D.L.M., E.R., K.E., S.S., S.W.M.; Visualization, D.L.M., S.S.; Supervision, D.L.M., K.E.; Project Administration, K.E.; Funding Acquisition, D.L.M., K.E.

Funding

This research was funded by: The Funders’ Network, The George S. & Dolores Doré Eccles Foundation, The Community Foundation of Utah, The Richard, K. and Shirley, S. Hemingway Foundation, and The Telemachus Foundation to Empower the Poor and End War.

Acknowledgments

The LED bulbs used in the exchange were provided by Rocky Mountain Power.

Conflicts of Interest

The authors declare no conflict of interest. The funders had no role in the design of the study; in the collection, analyses, or interpretation of data; in the writing of the manuscript, or in the decision to publish the results.

Abbreviations

The following abbreviations are used in the manuscript:
CO2Carbon dioxide
CO2eCarbon dioxide equivalent
eGRIDEmissions & Generation Resource Integrated Database
HEATHome Energy Assistance Target
kWhKilowatt-hour
LEDLight-emitting diode
NAAQSNational Ambient Air Quality Standards
NO2Nitrogen dioxide
NOxNitrogen oxides
PM2.5Fine particulate matter
SLCSalt Lake City
SLCoSalt Lake County
SLVSalt Lake Valley
UCEUtah Clean Energy
USUnited States
EPAEnvironmental Protection Agency
WAPWeatherization Assistance Program

Appendix A

Table A1. Community residential energy efficiency programs conducted in the United States that contained a light bulb exchange, direct install, or distribution element in their model.
Program LocationRequirements of ProgramExchange or Distribution ComponentSecondary Information Collected
Southern West Virginia* Undetermined.Distributed at local food banks.None.
Washington D.C.Yes, income.Direct install program.Yes.
Dayton, Ohio* Undetermined.Distributed at local food banks.None.
Avon, ColoradoNone.Exchange component.None.
University of California, UC Davis, coalition of local community collegesYes, must be an alumni, faculty or staff member, or student.Discount program on various LED light bulbs.None.
* We were unable to determine if these food banks had income requirements to receive their service.
Table A2. Survey given during LED exchange events.
            SLC Neighborhood “Watt Swap”
     Thank you for participating in our Neighborhood “Watt Swap” today!
Please fill out this form so we can track the amount of money and energy saved in the community through installing these high efficiency light bulbs. We will also send you additional tips to keep saving money and energy and reducing pollution in our communities.
             —Utah Clean Energy team
    January 20, 2018—Glendale Public Library, Environment + You Festival
* Required
1. Email address *
2. What is your name? *
3. What is your zip code? *
This program is only eligible to people living in the 84104 and 84116 zip codes at this time. Sorry for any inconvenience that may cause!
Mark only one oval.
O 84104
O 84116
4. What is your street address? *
5. How many incandescent bulbs did you turn in today? *
Mark only one oval.
O 1
O 2
O 3
O 4
O 5
6. How many CFL bulbs did you turn in today? *
Mark only one oval.
O 1
O 2
O 3
O 4
O 5
7. How many energy-saving LED bulbs did you receive today? *
Mark only one oval.
O 1
O 2
O 3
O 4
O 5
8. Where will you be installing your new energy-saving LED bulbs? *
Check all that apply.
O Bedroom(s)
O Front room/family room
O Kitchen
O Bathroom
O Porch/exterior
O Other:
9. Do you rent or own your home? *
Mark only one oval.
O Rent
O Own
10. If you rent, what is your landlord’s contact information?
11. When is your appointment with Energy Experts? *
If you didn’t bring any bulbs to swap today, please enter a date and time so we can coordinate the delivery of your new LED bulbs! Have 5 bulbs ready to turn in at the time of your appointment, and they will give you 5 LED bulbs. If you do not yet have an appointment, please write N/A.
12. How did you hear about this event? *
13. What is your preferred language? *
Mark only one oval.
O English
O Spanish
O Other:
14. Please specify your ethnicity. *
Mark only one oval.
O Hispanic or Latino
O Pacific Islander
O Asian
O African American
O Native American or American Indian
O Caucasian
15. What is your household annual income? *
Mark only one oval.
O $0–$12,060
O $12,061–$24,360
O $24,361–$36,180
O $36,181–$48,720
O $48,721–$64,960
O Greater than $64,960
16. How many people are in your household? *
17. What is your phone number? *
18. Are you willing to fill out a follow-up questionnaire? *
Mark only one oval.
O Yes
O No
19. Questions, comments, ideas, notes
Let us know how we’re doing! We welcome all suggestions, especially for additional locations/events to host Swap events.
Table A3. Household income brackets participants could select from as well as an option to “opt out” on their survey. While these income ranges are based on federal and Salt Lake City poverty guidelines, they slightly differ from these values for several reasons, including: improved ease of completing the survey from the participant perspective; increased ability to determine income classifications outside of the poverty range (including low-income and extremely low-income categorizations) as determined by Salt Lake County’s Housing and Human Development Income Guidelines [35]; and increased ability to determine participants’ eligibility for weatherization services (200% of poverty threshold) [15], in order to send targeted referrals to qualified participants.
Income BracketIncome Range (US$)
#1$0–$12,060
#2$12,061–$24,360
#3$24,361–$36,180
#4$36,181–$48,721
#5$48,722–$64,960
#6$64,960+
Income bracket #1: lower and upper boundaries based on 2017 federal poverty guidelines for a single person household.
Income bracket #2: lower boundary based on the upper bound of Income bracket #1; upper bound based on 2017 federal poverty guidelines, 150% poverty line for a 2-person household.
Income bracket #3: lower boundary based on the upper bound of Income bracket #2; upper bound based on a value between the Salt Lake City Housing and Community Development Dept’s income guideline: very low income value for 3 person household ($36,050) and to the 150% of the federal poverty line for a 4 person household ($36,900).
Income bracket #4: lower boundary based on the upper bound of Income bracket #3; upper bound based on 300% of the federal poverty line for a 2 person household ($48,720), which is close to 200% of the federal poverty line for a 4 person household ($49,200) and 150%of the federal poverty line for a 6 person household ($49,440).
Income bracket #5: lower boundary based on the upper bound of Income bracket #4; upper bound based on 400% of the federal poverty line for 2 person household ($64,960), which is between the 150% of the federal poverty line for an 8 person household ($61,980) and 200% of the federal poverty line for a 6 person household ($65,920).
Table A4. Follow-up questionnaire sent to LED exchange participants, with answers in parentheses. 41 total responses were received and some respondents did not complete the full survey.
        Neighborhood “Light Swap” Follow-Up Questionnaire/Vecindario “Intercambio de Bombillas” Cuestionario
Thank you for participating in Utah Clean Energy’s Neighborhood “Light Swap” program! Your feedback through this questionnaire will help us improve our program in the future, and everyone who submits a questionnaire will be entered to win a $50 Visa Gift Card! We appreciate your participation and your willingness to fill out this follow-up questionnaire. Please let us know if you have any suggestions on how we can improve our program in the “Comments” section below.
            Thank you, The Utah Clean Energy Team
¡Gracias por participar en el programa “Vecindario Intercambio de Bombillas” por Utah Clean Energy! ¡Sus repuestos nos ayudará mejorar el programa en el futuro, y todos quien responde a este cuestionario será ingresados para ganar una targeta de $50 de Visa! Agradecemos su participación y su disposición a completar este cuestionario de seguimiento. Háganos saber si tiene algún sugerencias sobre cómo podemos mejorar nuestro programa en la sección “Comentarios o preguntas”.
            Gracias, El equipo de Utah Clean Energy
* Required
1. Have you ordered a free Rocky Mountain Power Wattsmart Starter Kit?/¿Has ordenado un Rocky Mountain Power Wattsmart kit? *
Mark only one oval.
O Yes/Sí (31.7%)
O No (24.4%)
O I already did in the past / Ya pedí uno en el pasado (4.9%)
O I wan’t aware that I could order a Wattsmart Starter Kit/No sabía que esta oportunidad existía (19.5%)
O I plan to order one / Planeo pedir un kit (19.5%)
2. Have you made an appointment with Energy Experts to increase your attic insulation and seal your home’s air leaks?/¿Has hecho una cita con Energy Experts para aumentar el aislamiento de su ático y sellar las fugas de aire de su casa? *
Mark only one oval.
O Yes / Sí (22%)
O No (46.3%)
O I already had one in the past/Ya tuve una cita en el pasado (17.1%)
O I wasn’t aware of the opportunity to make an appointment with Energy Experts/No sabía que esta oportunidad existía (7.3%)
O I plan to make an appointment/Planeo hacer una cita (7.3%)
3. Have you contacted HEAT for assistance paying your energy bill?/¿Has contactado asistencia HEAT? (asistencia con la factura de energía) *
Mark only one oval.
O Yes / Sí (4.9%)
O No (46.3%)
O I already receive HEAT assistance/Ya recibo asistencia HEAT (2.4%)
O This is not applicable to me/Esta no es aplicable a mi (39%)
O I plan to contact them/Planeo ponerme en contacto con ellos (7.3%)
4. Have you applied for energy improvements through Utah’s Weatherization Assistance Program?/¿Solicitaste mejoras de energia a través del Programa de Asistencia Climatización de Utah? *
Mark only one oval.
O Yes / Sí (2.4%)
O No (78%)
O I already have in the past / He aplicado en el pasado (2.4%)
O I plan to apply / Planeo aplicar (17.1%)
5. Have you applied for rebates from Rocky Mountain Power and/or Dominion Energy?/¿Solicitó reembolsos desde Rocky Mountain Power y/o Dominion Energy? *
Mark only one oval.
O Yes/Sí (22%)
O No (48.8%)
O I have in the past / He aplicado en el pasado (22%)
O I plan to apply for rebates / Planeo solicitar reembolsos (7.3%)
6. After participating the in the Light Swap, have you taken other steps to save energy at home? If so, please describe the changes you’ve made./Después participando en el programa Light Swap, ¿has hecho algo más para ahorrar energía en tu casa? *
Various answers were received as it was free form.
7. Since participating in the Light Swap program, are you more aware of how saving energy at home helps to reduce pollution?/Desde que participó en el programa Light Swap, ¿es más consciente de cómo ahorrar energía en el hogar ayuda a reducir la contaminación? *
Mark only one oval.
O Yes, I am a lot more aware / Sí, soy mucho más consciente (34.1%)
O Yes, I am a little bit more aware / Sí, soy poco más consciente (41.5%)
O No, my awareness hasn’t changed / No, mi conciencia no ha cambiado (24.4%)
8. Would you recommend this program to a friend?/¿Recomendarías este programa a un amigo? *
Mark only one oval.
O Yes/Si (100%)
O No (0%)
O Other:
9. How would you describe your experience participating in the “Light Swap” program? Please feel free to share your story./¿Cómo describirías participando en el programa “Light Swap”?
10. This pilot program is made possible through the generosity of several foundations and private donors. Their continued support will allow us to expand our program’s offerings and availability around the state. Are you willing to talk with a member of Utah Clean Energy’s staff about your experience as a “Light Swap” participant and allow us to share your story with the donors that financially support this work? *
Mark only one oval.
O Yes
O No
11. Additional comments or questions?/¿Comentarios o preguntas?
  • Awesome! And very thankful.
  • easy and accessible
  • Needed one the following day
  • It was a great experience. After getting some LEDs from the program I bought enough to fill the house.
  • Very helpful.
  • Great program. Great way to start our LED light journey.
  • Simple and helpful
  • Confusing. I only found out about it because my mother went.
  • Such an easy way to trade for energy saving bulbs.
  • easy, just brought in lights and they gave me new ones
  • It was hard to find a location because the times and places kept changing
  • The ladies who helped me were very nice!
  • I thought it was a great way to learn how to conserve energy.
  • Only 60 Watt bukbs? I had assumed they would swap all my different wattage bulbs for equivalent luminance bulbs! (Suggestion for next big push!) Now I’m stuck with many new bulbs that won’t DO the job the old ones were intended for ie. Spotlights!
  • Positive
  • easy
  • Very easy
Free $50 Visa gift card opportunity drawing! Please provide your information below so we can contact you if you win the $50 Visa gift card./¡Gratis oportunidad a ganar un tarjeta de $50 de Visa! Por favor proporciona tu información abajo asi podemos contactarte si ganes la tarjeta de $50 de Visa.
12. Name / Nombre *
13. Email / Correo electrónico *
14. Telephone Number / Número de teléfono *
Table A5. Conversion rates used in our emissions calculations, including eGRID’s original units (lbs per kWh) along with the converted rates to SI units (kg per kWh).
Emission TypeKilograms (kg) of Emissions Per kWh of Electricity GeneratedPounds (lbs) of Emissions Per kWh of Electricity Generated
CO20.738 kg1.627 lbs
NOX0.00076 kg0.001676 lbs
NO20.000010 kg0.000024 lbs
CO2e0.743 kg1.638 lbs
Figure A1. Monthly participant demographics using survey responses on income, ethnicity, and preferred language. An additional category- “Ongoing”—represents the permanent light bulb exchange hosted by a local community center from March to June 2018. Percentages are based on completed survey question responses (income: 86%, ethnicity: 90%, language: 98%).
Sustainability 11 03965 g0a1
Table A6. Low and high estimated percentages of participating households that would be considered at least “low-income” by SLCo but may also fall into “very low-income” or “extremely-low income” categories as well. Also included is the estimated percentages of participants that would qualify for state weatherization services.
Low Estimate- Households Qualifying as “Low-Income” a (SLCo Standard)High Estimate- Households Qualifying as “Low-Income” a (SLCo Standard)Low Estimate- Households Qualifying for Weatherization Assistance Services (at/Below 200% of Federal Poverty Line)High Estimate- Households Qualifying for Weatherization Assistance Services (at/Below 200% of Federal Poverty Line)
Number of households b1031326590
Percentage of total households57%73%36%50%
a: This includes participants qualifying as also “very low-income” or “extremely-low income”. b: Number of households in this table are representative of the 86% of participants that responded to the income survey question.
Table A7. Transit accessibility of event locations using the addresses of participating households.
Number of Participating Households That Live Greater Than A 10-Minute Walk from A Bus StopNumber of Those Households Identified that Were within a 10-Minute Walk of an Event LocationEvent locations within a 10-Minute Walk of at Least 3 Bus StopsAverage Number of Bus Stops within a 10-Minute Walk of All 23 Event Locations
3 of 1812 of 323 of 2318.64
Table A8. Key assumptions of program expansion extrapolation.
Neighborhood Light Swap PilotExtrapolated Program Expansion
Proportion of participating householdsZIP 84104
0.90%
ZIP 84116
0.99%
2.0%, 5.0%, 7.5%
(for both ZIP Codes)
Project duration8 months24 months
Average events per month2.75 events4 events
Exchanged bulb watt average48.6150

References

  1. Mundaca, L.; Ürge-Vorsatz, D.; Wilson, C. Demand-side approaches for limiting global warming to 1.5 °C. Energy Effic. 2019, 12, 343–362. [Google Scholar] [CrossRef]
  2. Wilson, E.J.; Harris, C.B.; Robertson, J.J.; Agan, J. Evaluating energy efficiency potential in low-income households: A flexible and granular approach. Energy Policy 2019, 129, 710–737. [Google Scholar] [CrossRef]
  3. Reddy, S.M.; Montambault, J.; Masuda, Y.J.; Keenan, E.; Butler, W.; Fisher, J.R.; Asah, S.T.; Gneezy, A. Advancing conservation by understanding and influencing human behavior. Conserv. Lett. 2017, 10, 248–256. [Google Scholar] [CrossRef]
  4. Reames, T.G. Targeting energy justice: Exploring spatial, racial/ethnic and socioeconomic disparities in urban residential heating energy efficiency. Energy Policy 2016, 97, 549–558. [Google Scholar] [CrossRef]
  5. Cluett, R.; Amann, J.; Ou, S. Building Better Energy Efficiency Programs for Low-Income Households; American Council for an Energy-Efficient Economy: Washington, DC, USA, 2016.
  6. Drehobl, A.; Ross, L. Lifting the High Energy Burden in America’s Largest Cities: How Energy Efficiency Can Improve Low Income and Underserved Communities; American Council for an Energy-Efficient Economy: Washington, DC, USA, 2016.
  7. Wright, F. Old and Cold: Older People and Policies Failing to Address Fuel Poverty. Soc. Policy Adm. 2004, 38, 488–503. [Google Scholar] [CrossRef]
  8. Liddell, C.; Morris, C. Fuel poverty and human health: A review of recent evidence. Energy Policy 2010, 38, 2987–2997. [Google Scholar] [CrossRef]
  9. Heyman, B.; Harrington, B.; Heyman, A. The National Energy Action Research a Randomised Controlled Trial of an Energy Efficiency Intervention for Families Living in Fuel Poverty. Hous. Stud. 2011, 26, 117–132. [Google Scholar] [CrossRef]
  10. Hernández, D.; Bird, S. Energy Burden and the Need for Integrated Low-Income Housing and Energy Policy. Poverty Public Policy 2010, 2, 5–25. [Google Scholar] [CrossRef] [PubMed]
  11. Sovacool, B.K.; Heffron, R.J.; McCauley, D.; Goldthau, A. Energy decisions reframed as justice and ethical concerns. Nat. Energy 2016, 1, 16024. [Google Scholar] [CrossRef] [Green Version]
  12. Sovacool, B.K. The cultural barriers to renewable energy and energy efficiency in the United States. Technol. Soc. 2009, 31, 365–373. [Google Scholar] [CrossRef]
  13. Department of Energy. Weatherization program Notice 18-3 Effective Date; Department of Energy: Washington, DC, USA, 2018.
  14. Stoltzfus, E. The Low-income Home Energy Assistance Program: (LIHEAP); Congressional Research Service, Library of Congress: Washington, DC, USA, 2003.
  15. Department of Health and Human Services. Annual Update on the HHS Poverty Guidelines; Department of Health and Human Services: Washington, DC, USA, 2017; pp. 8831–8832.
  16. Bird, S.; Hernández, D. Policy options for the split incentive: Increasing energy efficiency for low-income renters. Energy Policy 2012, 48, 506–514. [Google Scholar] [CrossRef] [PubMed] [Green Version]
  17. Reames, T.G.; Reiner, M.A.; Ben Stacey, M. An incandescent truth: Disparities in energy-efficient lighting availability and prices in an urban U.S. county. Appl. Energy 2018, 218, 95–103. [Google Scholar] [CrossRef]
  18. VanderLaan, M. Lightbulb Swap at Eagle County Fair, Sponsored by Encore Electric. Lakewood, CO, USA, 2018. Available online: https://www.encoreelectric.com/lightbulb-swap-at-eagle-county-fair-sponsored-by-encore-electric/ (accessed on 21 July 2019).
  19. Loge, A.; Graeber, N. UC Launches Million Light Bulb Challenge Community Buy Program: UC Students, Staff, Faculty and Alumni Can Purchase High-Quality, Energy-Efficient Light Bulbs at a Great Price; University News: Davis, CA, USA, 2018; Available online: https://www.ucdavis.edu/climate-science/news/uc-launches-million-light-bulb-challenge-community-buy-program-1 (accessed on 21 July 2019).
  20. The Dayton Power and Light Company. Dayton Power and Light Partners with the Foodbank for Energy Savings; The Dayton Power and Light Company: Cincinnati, OH, USA, 2017. [Google Scholar]
  21. Vermont Energy Investment Corporation. Innovative Low-Income Utility Programs. Burlington, VT, USA, 2015. Available online: http://www.neuac.org/wp-content/uploads/2015/09/1-E-Innovative-Distribution-Channels.pdf (accessed on 21 July 2019).
  22. Appalachian Power. W.Va. food pantries to distribute energy efficient light bulbs as part of partnership with Appalachian Power. Columbus, OH, USA, 2014. Available online: https://www.appalachianpower.com/info/news/viewRelease.aspx?releaseID=1615 (accessed on 21 July 2019).
  23. Frederiks, E.R.; Stenner, K.; Hobman, E.V. Household energy use: Applying behavioural economics to understand consumer decision-making and behaviour. Renew. Sustain. Energy Rev. 2015, 41, 1385–1394. [Google Scholar] [CrossRef] [Green Version]
  24. Dillahunt, T.; Mankoff, J.; Paulos, E.; Fussell, S. It’s not all about Green: Energy Use in Low-Income Communities. In Proceedings of the 11th International Conference on Ubiquitous Computing, Orlando, FL, USA, 30 September–3 October 2009; ACM: New York, NY, USA, 2009; pp. 255–264. [Google Scholar]
  25. Kem, C.; Gardner Policy Institute. Utah’s Long-term Demographic and Economic Projections. Salt Lake City, UT, USA, 2017. Available online: https://gardner.utah.edu/wp-content/uploads/Kem-C.-Gardner-County-Detail-Document.pdf (accessed on 21 July 2019).
  26. Bares, R.; Lin, J.C.; Hoch, S.W.; Baasandorj, M.; Mendoza, D.L.; Fasoli, B.; Mitchell, L.; Catharine, D.; Stephens, B.B. The Wintertime Covariation of CO2 and Criteria Pollutants in an Urban Valley of the Western United States. J. Geophys. Res. Atmos. 2018, 123, 2684–2703. [Google Scholar] [CrossRef]
  27. Patarasuk, R.; Gurney, K.R.; O’Keeffe, D.; Song, Y.; Huang, J.; Rao, P.; Buchert, M.; Lin, J.C.; Mendoza, D.; Ehleringer, J.R. Urban high-resolution fossil fuel CO2 emissions quantification and exploration of emission drivers for potential policy applications. Urban Ecosyst. 2016, 19, 1013–1039. [Google Scholar] [CrossRef]
  28. United States Environmental Protection Agency, National Emissions Inventory (NEI). Air Pollutant Emissions Trends Data. Washington, DC, USA, 2013. Available online: https://www.epa.gov/air-emissions-inventories/air-pollutant-emissions-trends-data (accessed on 21 July 2019).
  29. Camp, B. Dominion Energy ThermWise Programs. Salt Lake City, UT, USA, 2018. Available online: https://www.thermwise.com/ (accessed on 21 July 2019).
  30. Mendoza, D.; Gurney, K.R.; Geethakumar, S.; Chandrasekaran, V.; Zhou, Y.; Razlivanov, I. Implications of uncertainty on regional CO2 mitigation policies for the U.S. onroad sector based on a high-resolution emissions estimate. Energy Policy 2013, 55, 386–395. [Google Scholar] [CrossRef]
  31. Steg, L. Promoting household energy conservation. Energy Policy 2008, 36, 4449–4453. [Google Scholar] [CrossRef]
  32. U.S. Census Bureau; American Community Survey. 2017 American Community Survey 5-Year Estimates; Table B19001; U.S. Census Bureau: Suitland, MD, USA, 2018.
  33. Boyce, D.; Wirfs-Brock, J. High Utility Costs Force Hard Decisions for the Poor. Available online: http://insideenergy.org/2016/05/08/high-utility-costs-force-hard-decisions-for-the-poor/ (accessed on 21 July 2019).
  34. Falchi, F.; Cinzano, P.; Elvidge, C.D.; Keith, D.M.; Haim, A. Limiting the impact of light pollution on human health, environment and stellar visibility. J. Environ. Manag. 2011, 92, 2714–2722. [Google Scholar] [CrossRef] [PubMed]
  35. Department of Housing and Urban Development. Income Limits; Department of Housing and Urban Development: Washington, DC, USA, 2018. Available online: https://www.huduser.gov/portal/datasets/il/il18/Section8-IncomeLimits-FY18.pdf (accessed on 21 July 2019).
  36. U.S. Environmental Protection Agency. eGRID Summary Tables 2016; United States Environmental Protection Agency: Washington, DC, USA, 2016.
  37. U.S. Environmental Protection Agency. Social Cost of Carbon; United States Environmental Protection Agency (EPA): Washington, DC, USA, 2013.
  38. Nordhaus, W.D. Revisiting the social cost of carbon. Proc. Natl. Acad. Sci. USA 2017, 114, 201609244. [Google Scholar] [CrossRef] [PubMed]
  39. Monroe, C.; Director of Customer Solutions at Rocky Mountain Power. Personal Communication (telephone interview), 5 January 2019.
  40. Rocky Mountain Power. Electric Service Schedule No. 1 State of Utah; 9/5/2014. Rocky Mountain Power: Salt Lake City, UT, USA, 2014; Available online: https://www.rockymountainpower.net/content/dam/rocky_mountain_power/doc/About_Us/Rates_and_Regulation/Utah/Approved_Tariffs/Rate_Schedules/Residential_Service.pdf (accessed on 21 July 2019).
Figure 1. Study area showing the location of ZIP Codes 84104 and 84116 (outlined in red) within Salt Lake County, Utah, along with average household income.
Sustainability 11 03965 g001
Figure 2. Emission sources in Salt Lake City and North-South vertical line located on State Street, dividing the East from the West Side. Symbol size is associated with relative emission magnitude.
Sustainability 11 03965 g002
Figure 3. Monthly Neighborhood Light Swap events, average number of participating households, and average number of light-emitting diode (LED) light bulbs distributed per event. This figure does not include the Light Swap that was held continuously from March 2018 to June 2018, where a total of 26 households were reached with a total of 207 LEDs.
Sustainability 11 03965 g003
Figure 4. Heatmap resolved at 0.5-mile resolution for all participants. Swap event locations are shown as black dots, target ZIP codes are outlined in red and household income by ZIP code is also displayed.
Sustainability 11 03965 g004
Table 1. UCE pilot participant demographic characteristics based on participant survey responses.
DemographicComposition of Pilot Participant PoolSurvey Question Response Rate
Average Annual Income$32,720.85 (low estimate)
$43,709.04 (high estimate)
(57–73% of households are estimated to fall in the “low-income”, “very low-income”, and “extremely low-income” categories outlined for SLCo)
86%
Average Household SizeThree people.94%
Ethnicity Identities72% Caucasian
21% Hispanic or Latinx
3% Asian
2% Native American
1% Pacific Islander
90%
Preferred Language87% English
12% Spanish
1% Other
100%
Home Ownership Rate81% Owner
19% Renter
97%
Table 2. Annual emissions reductions attributable to Utah Clean Energy (UCE) pilot.
PollutantAmount Reduced Annually (SI Units)Amount Reduced Annually (Imperial Units)
CO2122.23 tonnes134.73 tons
NO251.82 kg277.58 lbs
NO23.61 kg3.97 lbs
CO2e123.06 tonnes135.65 tons
Table 3. Estimated impact of increased participation in 84104 and 84116 ZIP codes.
Actual Neighborhood Light Swap Pilot
BulbsMetric Tons CO2Value of Savings at Social Cost of CarbonValue of Electricity Savings 1Value of Year’s Total BenefitsImplementation Cost
8 Month Pilot1432122.23$4878.17$18,218.56$23,096.73$25,045.00
Extrapolating 2% Participation in Targeted ZIP Codes
BulbsMetric Tons CO2Value of Savings at Social Cost of CarbonValue of Electricity SavingsValue of Year’s Total BenefitsImplementation Cost
Year 1: 2739242.00$9658.15$36,070.44$45,728.59$31,874.58
Year 2: 7626673.78$26,890.49$100,428.32$127,318.81$35,275.93
Total:10,365915.78 $67,150.51
Extrapolating 5% Participation in Targeted ZIP Codes
BulbsMetric Tons CO2Value of Savings at Social Cost of CarbonValue of Electricity SavingsValue of Year’s Total BenefitsImplementation Cost
Year 1: 4836427.26$17,051.84$63,683.77$80,735.60$33,333.96
Year 2: 9724859.10$4286.66$128,050.94$162,337.60$36,735.80
Total:14,559 1286.36 $70,069.76
Extrapolating 7.5% Participation in Targeted ZIP Codes
BulbsMetric Tons CO2Value of Savings at Social Cost of CarbonValue of Electricity SavingsValue of Year’s Total BenefitsImplementation Cost
Year 1: 6584581.67$3214.46$86,699.40$109,913.86$34,550.35
Year 2: 11,4711013.51$40,449.28$151,066.57$191,515.85$37,952.19
Total:18,0551595.18 $72,502.54
1 The value of electricity savings listed for each year corresponds to only the savings associated with the bulbs exchanged in that year.
Table 4. Net present value of benefits over the course LED lifespan in different participation scenarios.
Participation ScenariosSummed Net Present Value of Benefits During LED Lifetime (14 Years)
Actual Neighborhood Light Swap Pilot$186,835.33
Extrapolating 2% Participation in Targeted ZIP Codes$1,395,098.72
Extrapolating 5% Participation in Targeted ZIP Codes$1,997,641.47
Extrapolating 7.5% Participation in Targeted ZIP Codes$2,499,779.35

