Evolution of Grazing Practices in Belgian Dairy Farms: Results of Two Surveys
by
 ,
,
Françoise Lessire
1 ,
,
Samuel Jacquet
2,
Didier Veselko
3,
Emile Piraux
3 and
Isabelle Dufrasne
1,2,* 1
Department of Veterinary Management of Animal Resources, University of Liège, Animal Nutrition Unit, Quartier Vallée 2 Avenue de Cureghem, 6, 4000 Liège, Belgium
2
Centre des Technologies Agronomiques (CTA), Rue de la Charmille, 16 4577 Modave, Belgium
3
Comité du Lait, Route de Herve, 104 4651 Battice, Belgium
*
Author to whom correspondence should be addressed.
Sustainability 2019, 11(15), 3997; https://doi.org/10.3390/su11153997
Submission received: 4 July 2019
/
Revised: 19 July 2019
/
Accepted: 22 July 2019
/
Published: 24 July 2019
(This article belongs to the Special Issue Sustainable Grazing Systems)
Abstract
:Numerous publications have highlighted the potential role of grassland in the mitigation of the greenhouse gas (GHG) emissions of the agricultural sector. Yet, the preservation of grassland is included in the main objectives of the greening policies of the European Union (EU). To assess how this greening program has influenced the behaviour and perceptions of the dairy sector, two surveys were foreseen during the project LIFE dairyclim and sent to all the dairy farmers of Wallonia (Belgium) at three-year intervals (2016 – 2019). The answer rates reached 32.6%. Questions concerned four topics: General farm description, grazing practices, perceptions and expectations, and general grassland management. Following the results of these surveys, a large majority of lactating dairy cows grazed in Wallonia (96.5%). The main differences between 2016 and 2019 were the increase in size of the dairy farms in terms of surface (77.2 ha in 2016 to 84.4 ha in 2019) and production, the disappearance of small farms of less than 60 cows, and the progression of the organic sector from 9.3% to 11.7%. Perceptions of farmers on grazing differed following their grazing practices: No-grazing farmers were very sceptical about the advantages of grazing. On the opposite hand, organic farmers were very enthusiastic. Awareness of farmers about the preservation of landscape and the image of the sector for the consumers has increased during the three-year period. The requirements of the dairy industry and authorities were cited as incentives to keep grazing. The expectations of the farmers differed from 2016 to 2019 with a smaller proportion desiring to increase their grazing practices and more, staying stable. These results seem to indicate that the support of farmers and the involvement of authorities and stakeholders could contribute to maintain grazing.
1. Introduction
Following experts’ estimations, the agricultural sector contributes about 14.5% of global anthropic greenhouse gas (GHG) emissions [1,2]. Yet, net carbon fluxes from atmosphere to soil enable sequestration in grassland soils and lead to carbon storage i.e., carbon trapped in the soil [3]. This sinking potential is considered as a lever to alleviate the emissions of the sector [4,5]. However, this potential depends on several factors, including the type of grasslands. The importance of human intervention allows the characterization of the different grasslands i.e., natural grasslands with natural wild vegetation and no or moderate human intervention, permanent grasslands under strong or moderate agricultural management, and cultivated or improved grasslands with grass and crops produced alternately [6,7]. The average soil carbon storage was estimated at 90 t carbon/ha (C/ha), 70 t C/ha, and less than 45 t C/ha in high-altitude pastures, permanent pastures, and forests and land under annual crops, respectively [3]. The preservation of natural and permanent grasslands is thus essential for maintain of C stocks.
Some practices described as non-sustainable including conventional tillage, short crop rotations, large use of herbicides and pesticides, and heavy grazing, induce a release of the stocked carbon or modify plant growth, interfering with C storage [8,9,10].
Grazing can have both positive and negative impacts on C sequestration [11,12]. Yet, cows eating grass at high intensity reduce atmospheric C capture by the plants and emit methane (CH4), nitrous oxide (N2O), and carbon dioxide (CO2) by manure deposit and respiration. On the other hand, dung provides nitrogen (N) to the soil and enhances plant growth, increasing the amount of C sequestered. It is considered that in a well-managed grazing, the negative impact (i.e., removal of C by cows’ eating) and the positive aspect (i.e., increase in soil C by plant growth) are balanced [3]. The rational management of grazing plays thus an essential role in the C sequestration potential of grassland [13].
It is considered that in a well-managed grazing, the negative impact (i.e., removal of C by cows’ eating) and the positive aspect (i.e., increase in soil carbon by plant growth) are balanced [4]. The rational management of grazing thus plays an essential role in the C sequestration potential of grassland [12].
To ensure the preservation of grassland and C storage, several EU policies (especially the common agricultural policy (CAP) aim to limit land use changes [13,14]. Yet, payments to farmers under the CAP take into account sustainable practices regarding environment and climate. Thus, farmers are encouraged to diversify crops and maintain permanent grasslands [14]. Moreover, 5% of arable lands have to be converted in ecological focus areas [13]. In Belgium, at a regional level, the Walloon government takes initiatives to enhance sustainability of the agricultural sector by supporting the organic sector and promoting circular economy [15,16,17]. For example, direct sales from farm gate to consumers and diversification of dairy products are supported by providing help in administrative and financial procedures. All these practices allow farmers to get a better revenue from their activities and stimulate small structures more sustainable [17]. It also allows the restoration of the link between farmers and consumers. The stakeholders are involved in this evolution by rewarding environmentally sound practices.
In this context, we were interested in checking the grazing practices of Walloon dairy farmers through two surveys planned at an interval of three years.
The objectives of the study were:
- (1)
- Make an inventory of grazing practices in Wallonia.
- (2)
- Highlight the main evolutions of the dairy sector occurred during a three-year interval.
- (3)
- Investigate the effects of two subgroups on grazing problematic: The no-grazing farmers and the organic sector.
- (4)
- Evaluate the expectations and the perceptions of dairy farmers.
- (5)
- Identify the relationships between farmers and EU policies about land use and land use changes and define levers to improve the sustainable practices of Walloon dairy farms.
2. Materials and Methods
The questionnaire sent in 2019 is included as Appendix A. It was discussed between the partners involved in the project, including a scientist from Aarhus University, members of the association of Luxembourg breeders, Convis, scientists from the University of Liège, and a Belgian feed company, Dumoulin. Farm advisers (Fourrages Mieux, Socopro) were also consulted. After this meeting, 18 questions were formulated. The questionnaire was presented during farmers’ meeting to explain the objectives of the study. It was divided into 4 parts that aimed to provide information on several topics: In the first part, 7 questions gave an overview of the general farm management. In the second part, grazing practices were described on basis of answers to 8 questions. Perceptions and expectations of farmers were then questioned. A fourth set of questions investigated the management of temporary and permanent grasslands. Surveys were translated in French and German depending on the focused areas. The “Comité du Lait” that collects milk samples from all the Walloon dairy farms helped in disseminating the questionnaires in 2016 and 2019. Few changes were made from 2016 to 2019 unless it appeared that obvious misunderstandings occurred. The first release was achieved in January 2016 and the second one in January 2019. The deadline for taking into account the answers was set on 31 March in 2016 and 2019.
The statistical analyses were performed using SAS 9.3 (SAS Institute, 2002) and the software R (R-core Team 2016). Descriptive procedures were used (proc univariate—proc means) for the analysis of numeric values. The proc freq statement was used for the analysis of the categorical variables. Pearson’s chi-square test and Fisher exact test were used to test equality of proportions [18]. Cell chi-square allowed us to determine the importance of the participation of each cell to the global F-value. The analyses were at first performed on the whole dataset including data from 2016 and 2019. After this, several comparisons were conducted. We analyzed the data on temporary grasslands (TG) and permanent grasslands (PG) by a general linear model taking into consideration the farm system (conventional—CONV or organic—ORG), the year of data collection, and the interaction between both factors.
The following parameters were studied: The surface (ha), the production (ton dry matter—tDM), the organic and mineral fertilization (t/ha/year), and finally, the different production: % production as silage, % as LC grazing, % as heifers grazing.
3. Results
3.1. General Overview of the Results
3.1.1. General Farms’ Description
In 2016 and in 2019, the questionnaires were included in the milk analysis reports sent to all the Walloon dairy farmers. Thus, the number of mailings was estimated by counting the shipments delivered by the Comité du Lait. In 2016, 3,156 forms were sent. The answer rate was 32.2% with 1016 filled forms received. In 2019, 2806 forms were sent; that represents a decrease by 10.5% in comparison with 2016. We received 926 filled forms, representing an answer rate of 33%.
The first question concerned the exploitation system of the farms. In 2016, the forms where a change from CONV to ORG system was mentioned were assigned following this rule: If the change from CONV to ORG would occur in 2016, they were accounted as ORG. If the change was expected in 2019 (the farms that started their conversion project), the forms were included in CONV systems. By using this repartition key, 90.7% answers were identified as CONV and 9.3% as ORG. In 2019, the proportion of ORG farming increased at 11.7%. The type of production was diversified, and no difference was observed between the two surveys. Almost 4 out of 10 farms (36.3%) were specialized in dairy production, 23.1% produced meat and milk, 14.2% produced milk and cereals, and finally 26.3% produced meat, milk, and crops. The majority of the farmers was over the age of 50 years (60%). Two or more farmers were identified in only 23.2% of the filled forms. Following the results of the 2016–2019 surveys, the average Walloon dairy farm has a total agricultural surface of 80 ha, 73 cows, and an annual milk production of 6,778 liters per cow. An increase by 10% of the agricultural surface in 2019 (77.2 ha in 2016 vs. 84.9 ha in 2019) was noted in correlation with an increase in farms where the surface was of 125 to 200 ha (in 2016: 10.8% vs. 16.5% 2019; p < 0.001). Significant changes in frequencies distribution was also observed for the cows’ number and annual production: A significant diminution of farms with less than 60 cows occurred in 2019 (2016: 38.22% vs. 31.9% in 2019; p < 0.05). An increase in farms producing more than 8,000 liters/year was observed (2016: 29.4% to 33.8% in 2019; p < 0.01). It appears from the results that an intensification process occurred in Walloon farms despite the progression of the organic sector.
3.1.2. Grazing Practices
According to the survey, grazing was very common in Belgium with 96.5% of lactating cows (LC) grazing. The grazing season lasted four months and more (96%). We also observed a high percentage of grazing for young cattle (78%), for heifers (96.7%), and for dry cows (90.4%). The LC grazed mostly day and night (74%). On average, 19.8 ± 14.3 ha (n = 902; min = 0.9, max = 77 ha) were available for them. These areas increased from 19.8 ± 14.3 ha (min: 0.9 ha–max: 77.0 ha) in 2016 to 20.6 ± 15.2 ha (min: 0 ha–max: 104 ha) in 2019 (p < 0.001). Further, 66% of farms provided a complement to the grazed grass at any time. Continuous complementation decreased from 71.1% in 2016 to 63.3% in 2019 (p < 0.001). Complement fed was composed of grass silage (62.3%), maize silage (70.7%), hay (22.2%), or mixed components (48.3%) and in the majority (56.5%), consisted of two or three different feedstuffs. Due to this high level of complementation, the average grass intake in the summer period reached less than 50% (43.0%) of the total dry matter intake (DMI). This part increased slightly in 2019. More farmers declared that they did not complement at all in 2019 (6.34% vs. 2.20% in 2016; p < 0.001). On average, the proportion of grass in the winter diet represented 52.7%, yet grass silage is a major component of winter cows ‘diet in Wallonia.
3.1.3. Perceptions and Expectations
Four topics were envisaged: The effect of grazing on milk production costs, animal welfare, landscape, and environment. The possible answers were that the impact is positive, negative, or neutral. The effect of grazing on animal welfare was the most consensual with 92.9% of farmers acknowledging its positive impact. Concerning the effect on costs, 76.6% considered that grazing decreased the costs, 11.7% thought that it increased them, and 11.7% that it had no influence. More than 80% (82.5%) considered that grazing was positive on landscape. The positive opinions were less marked regarding the effect on environment, with 76.6% recognizing a positive impact and 17.6% being neutral. No difference between 2016 and 2019 was noted.
Farmers were questioned about their motivations to keep grazing: The most-mentioned reasons were to decrease production costs (72.5%) and for animal welfare (89.7%). Impact on image (49.6%), on landscape (45.6%), requirements from dairy industry or authorities (14.5%), and obligations (no other possible use of the land, 18.5%) were cited less frequently. From 2016 to 2019, two main changes were noted. The image of the dairy sector appeared to be of greater concern. In 2016, 46.1% of farmers mentioned the image as an incentive to keep grazing and this percentage rose to 53.6% in 2019 (p < 0.05). The requirements of authorities or the dairy industry were cited in 10.6% of answers in 2016 and this percentage increased to 18.9% in 2019. No question was set in 2016 about the access to a label linked with grazing but we included it in 2019. Eighty-three farmers were sensible to this incentive. This interest toward a label was more marked in conventional farms (75% CONV vs. 25% organic).
The question about the future was asked only to grazing farmers with four choices: Increase, decrease, stop, or stable. The majority of farmers expected to keep grazing stable (64.3%) and 24.2% expected to increase it. Only 11.4% expected to decrease or stop this practice. We observed a huge difference from 2016 to 2019. In 2016, 43% of farmers wished to increase their grazing practices vs. 39.9% desiring to keep it stable. In 2019, this trend changed: only 6.2% wanted to increase vs. 87.8% desiring to keep it stable. In 2016, 17.1% expected to decrease or stop. This percentage dropped to 6.0% in 2019. This observation could be due to relative shortage in available land.
3.1.4. Management of Permanent and Temporary Grasslands
Some questionnaires lacked information about more technical data like the use of mineral or organic fertilizers. The estimation of the production of grasslands was difficult to collect and only one form out of five supplied this information about TG and 12% about PG. We noticed some discrepancies, clearly linked to the confusion in units, mainly for organic fertilizers. We discarded the forms showing obvious mistakes. The mean results about the management of TG and PG in 2016 and 2019 are presented on Table 1 and Table 2. In 2016, 42.5% provided data on TG and 87.9% on PG. In 2019, this answer rate rose at 51% for TG and 89.4% for PG. The relative answer rate about TG/PG increased in 2019. This figure was estimated at 48% (427/883) in 2016 and at 57% (474/828 answers) in 2019. This difference could indicate a rise in PG.
No change in the average surface of TG or PG nor in production was noted from 2016 to 2019. More organic fertilizer was used in 2019 in both TG and PG (p < 0.001). Regarding mineral fertilizer, their use was more important in 2019 only on TG (p < 0.001).
3.2. Influence of Grazing Management
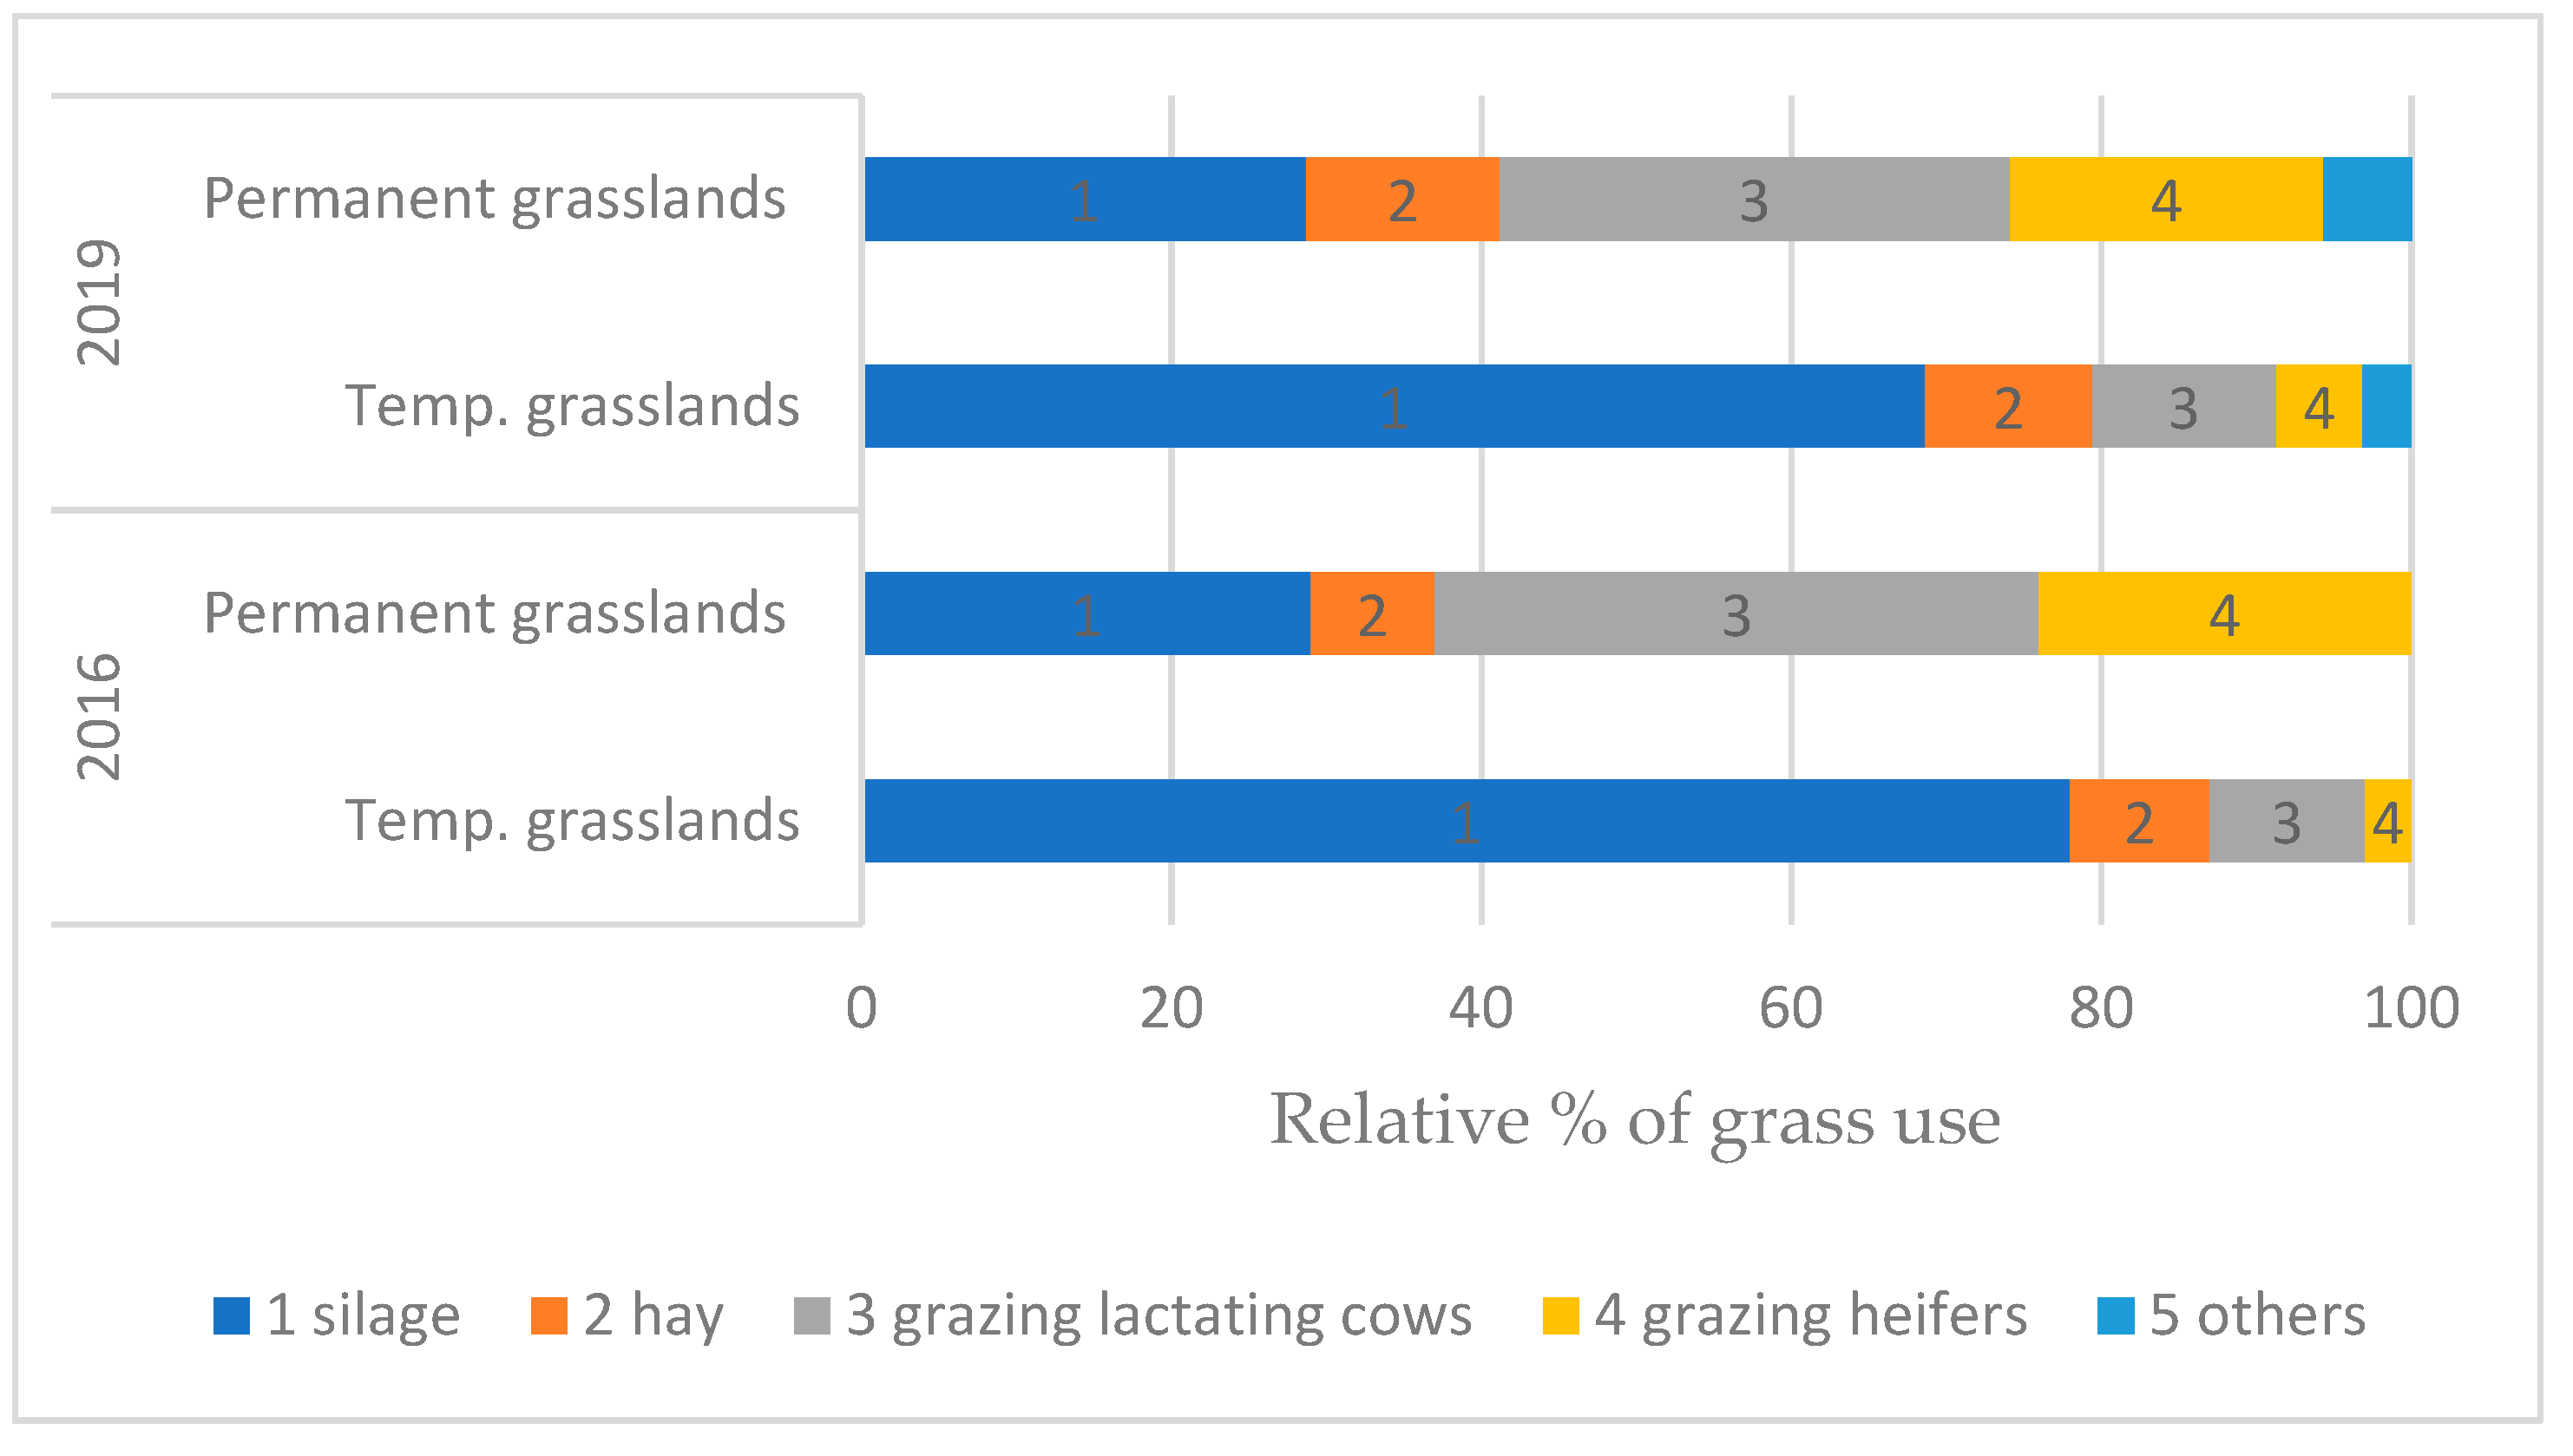
The use of grass differed following the type of grasslands and the year (Figure 1). Grass was mainly valued as silage on temporary grasslands and as grazed grass on permanent ones. More silage was produced in 2016 compared with 2019. It could be due to the drought reported in 2018 limiting the grass yield.
3.3. Influence of Grazing Practices
We analyzed the results of these two surveys to compare no-grazing farms (NG) with grazing ones (G) to identify the factors inducing abandonment of grazing.
3.3.1. General Description of NG Dairy Farms
The NG displayed the same range of activities than G. The size in ha increased in NG with 35.3% of them having more than 125 ha compared with only 12.8% G (p < 0.001). The number of cows increased also with 30.4% of NG having more than 150 cows compared with only 3% G (p < 0.001). These features were coupled with an increased production (73.6% > 8000 liters vs. 29.5% in G; p < 0.001). These results did not change from 2016 to 2019.
3.3.2. Perceptions of NG Dairy Farms
We observed significant differences regarding the perceptions of NG farms toward grazing. Only 33.9% considered that grazing could decrease production costs. Positive impacts were less recognized: 38.5% on animal welfare, 40.0% on landscape, and only 27.9% on environment. On However negative impacts were highlighted: 44.6% of answers noted a negative impact on production costs, and 37.7% on environment (Figure 2). Surveyed farmers noted a more neutral impact on landscape (36.9%) and animal welfare (33.9%). No difference appeared between 2016 and 2019.
We asked NG why they decided to stop grazing. Seven possibilities were proposed. Only 2/68 (2.9%) did not give any answer. The main invoked reasons were the decrease in milk yield (MY) observed in grazing cows (55.9%) and the difficult management (50%). More than two motivations (77.9%) were usually presented. In 2019, the climatic factors were an incentive for stopping grazing in 45.5% of answers vs. 22.9% in 2016 (Figure 3). In 2019, four to five motivations (36.4% of answers; p < 0.05) were given (vs. 11.4% in 2016), which suggests a very conscientious choice.
3.4. Influence of the Sector of Activity
The organic sector rose in 2019. We investigated how ORG farms differed from CONV ones and the impact of these specificities on farmers’ perceptions.
3.4.1. General Description of Organic Farms
The average ORG farm had a surface of 66 ha, 58.4 cows, and an annual milk production of 4630 liters per cow. Further, 60% of the ORG had a milk production level of less than 6000 liters/cow compared with 18.8% in CONV. The analysis of the frequencies distribution showed the higher percentage of farms of less than 50 cows (44.7% ORG vs. 33.7% in CONV; p < 0.05). Surprisingly, the size in ha was not significantly different.
No evolution of these parameters was noted from 2016 to 2019. Therefore, the noticed intensification of dairy practices could be attributed to the evolution of the CONV.
The activities developed on the ORG differed significantly from the CONV. They appeared less diversified with the main activities being milk (59.8% vs. 18.8% CONV; p < 0.001) and milk and meat (21.7% vs. 32.1% CONV; p < 0.001).
3.4.2. Perceptions of Organic Farmers
The ORG were very positive toward the effect of grazing on environment, production costs, landscape, and animal welfare (Figure 4). The main differences with the CONV were the decrease in negative opinions: the negative impact of grazing on costs was mentioned in 4.3% ORG only (vs. 12.5% in CONV), the percentage of negative opinions on landscape dropped from 11.3% in CONV to 2.7% in ORG, and on environment from 11.9% in CONV to 3.2% in ORG.
The reasons to keep grazing differed in organic farms. More than 90% kept grazing because of lowered production costs (90.5% vs. 70.7% in CONV; p < 0.001). The impact on landscape was noted in 64.0% ORG vs. 43.5% for CONV (p < 0.001). Requirements were more cited in ORG (30.7% vs. 12.7% in CONV; p < 0.001). This high percentage could be put in relation to the organic label. Nevertheless, no change in the frequency of this answer was noted for ORG from 2016 to 2019 while it increased from 8.6% in 2016 to 17.4% in CONV (p < 0.001).
In the future, 24.2% of ORG wanted to increase grazing and 64.3% to keep it stable. More than 10% (11.4%) wished to decrease or even stop it. The differences of expectations between 2016 and 2019 were more marked in ORG as 56.8% of ORG wished to increase in 2016 vs. only 7.1% in 2019, and 37.0% wanted to keep stable vs. 89.8% in 2019.
4. Discussion
The broad diffusion of the surveys was achieved with the help of the “Comité du Lait”. In 2016, 3,151 surveys were sent while the total of Walloon dairy producers was estimated at 3152 (Rapport annuel de la Conféderation Belge de l’Industrie laitière) [19]. In 2018, no figure was yet published but in December 2017, 2886 dairy producers were counted. We sent 2086 forms in January 2019. This decrease of 2.8% of the dairy producers seems coherent with the progression of the recent years [4]. Both surveys reached a high answer rate of more than 30%. We compared the collected data with the official figures regarding the size of farms, the number of cows per farm, and the average milk yield. The report “L’agriculture Wallonne en chiffres, 2019” [20] gave lower amounts than those obtained from our surveys. Following this source, the mean agricultural surface would be 57 ha with 58 cows per farm. For the organic sector, the following data are provided: Mean agricultural surface was 47 ha and 42 cows on average per farm. The conversion rate to the organic sector is estimated at 12.9%. However, these figures do not take into consideration the type of speculation while our surveys specifically addressed the dairy sector. Another source [21] provided more similar numbers indicating 71 cows per farm, an annual average MY of 6600 liters per cow per year, and a mean agricultural area of 62 ha including 42 ha of permanent grassland. Data from the surveys seem, thus, to be representative of the Walloon dairy sector.
The mean differences between the two surveys included the rise in size of farms of the conventional sector. It is even more marked in the no-grazing farms. On the other hand, the organic sector is progressing. These trends are confirmed by other sources [20,22]. Grazing remains the usual management practice in Wallonia with more than 96% of lactating cows on pastures. This feature has to be linked with the high percentage (55.5%) of the total agricultural area devoted to grasslands in Wallonia [23]. From 2016 to 2019, we noticed an increase in the self-sufficiency concern as it is demonstrated by the decrease in continuous complementation at grazing and the increase in no-complementation practice. However, the amount of grazed grass in summer diet still remains low (43%).
The perceptions of the surveyed producers did not vary from 2016 to 2019. On the contrary, discrepancies were identified between grazing and no grazing and between organic and conventional farmers. The grazing, and even more so the organic producers, were positive toward the advantages of grazing than those who had abandoned this practice. Other publications have also noticed that feature [24]. The positive impacts of grazing motivated the farmers to keep grazing as it is demonstrated by similar percentages of answers (e.g., 76.6% considered a positive impact of grazing on production costs and the decrease in production costs is invoked in 72.2% of answers to keep grazing). Many communications were disseminated among the farmers these last years about the high nutritive values of grazed grass and low production costs of grazing diets. It seems that they increased farmers’ awareness. The concern about the image of the dairy sector was a more noticeable incentive for grazing in 2019. It might be linked to the poor image of the agricultural sector more and more issued through the media and large public. Requirements of the dairy sector and of the authorities were more frequently cited in 2019. The reports of the Comité du Lait [25,26] stating a rise in the audits about milk produced on pastures from 21 in 2016 to 234 in 2018 confirm the concern of the stakeholders toward this problematic.
Reasons to stop grazing were difficulties in management, insufficient pastures, or lower MY. Yet, the no-grazing farms were the most intensive ones, indicating that the intensification of the farms might lead to loss this practice. However, it did not appear at this stage in the results from the steady percentage of LC grazing observed. Climatic conditions were more invoked in 2019 and were probably linked to the drought occurred in 2018.
The perception of the future changed from 2016 to 2019 with a large proportion of farmers willing to keep it stable. Possible explanations could be the difficulties to access to pastures, soil conditions, or to the instability linked to climatic conditions.
On basis of the analysis of these data, it appeared that the intensification of dairy farms could negatively affect grazing. This was not clearly demonstrated at this stage as a high percentage of LC still had access to pastures. However, the negative perceptions of NG farms could lead to abandoning or reducing grazing. This feature seems to confirm that a lever to mitigate climate impact could be the reduction in size of farms. However, this option is usually not privileged [27]. Conversely, the organic sector would alleviate the pressure on natural resources and the use of more sustainable practices if its progression continues. The development of labels and the requirements of the authorities/milk industry could favor the preservation of grazing and grassland as the Greening policy requires.
The awareness of dairy farmers about societal issues like preservation of landscape and image for the consumers seems more obvious. Initiatives leading to enhancing circular economy with direct sales on farm site could help in restoring communication between the wider public and farmers. The acknowledgment of the services they provide to the society (eco-systemic services) including, in particular, financial rewards could improve the interest and the collaboration of the sector.
5. Conclusions
The dissemination of the two surveys was broad and we reached a high answer rate, similar in 2016 and 2019. From 2016 to 2019, we observed, in Wallonia, an increase in farm size, especially marked in no-grazing ones. However, the grazing practices were still common despite the progressive intensification of the sector. During the period between the two surveys, we noticed an increasing concern about self-sufficiency and about the image of dairy farming. Different opinions about the future appeared and a larger proportion of dairy farmers expected to keep grazing stable in 2019. The progression of the organic farming, the interest of stakeholders and authorities, combined with the recognition of the consumer could be levers to maintain this practice. The involvement of farmers in environmental issues need to be acknowledged to enhance their collaboration in policies. Some initiatives such as the development of labels and a better reward for environmentally friendly products could grant their implication.
Author Contributions
Conceptualization, F.L. and L.D.; methodology, F.L. and L.D.; validation, F.L. and L.D.; resources: D.V. and E.P.; investigation, S.J. and F.L.; formal analysis: F.L.; writing—original draft preparation, F.L.; writing—review and editing, L.D.; supervision, L.D.; project administration, L.D.; funding acquisition, L.D.
Funding
This research was funded by the Executive Agency for Small and Medium-sized Enterprises, grant number LIFE14 CCM/BE/001187.
Acknowledgments
We acknowledge with thanks Fourrages Mieux ASBL and SOCOPRO for their support in the dissemination of the surveys.
Conflicts of Interest
The authors declare no conflict of interest.
Appendix A
| Questionnaire |  |
Introduction
The preservation of grasslands is crucial because of their impact on the productivity of dairy farms and on environmental and societal issues. The objective of this second survey intended to dairy farmers from Belgium (Wallonia) and from Luxembourg is the follow up of the grassland use in the dairy farms, as part of the project Life-Dairyclim. The results of the first survey are available on the website of the Life Dairyclim project: http://labos.ulg.ac.be/dairyclim/
1. What is the production system of your farm?
- ○
- Conventional
- ○
- Organic
- ○
- in Conversion
2. What are the activities in your farm?
- ○
- Only milk
- ○
- Milk and meat
- ○
- Milk and crops
- ○
- Milk, meat and crops
3. How old are the owner(s) of the farm? Several answers are possible
- ○
- Less than 30 y?
- ○
- 30–40 y?
- ○
- 40–50 y?
- ○
- 50–60 y?
- ○
- More than 60 y?
4. What was the total agricultural area of your farm in 2018?
- ○
- Less than 50 ha
- ○
- 50–75 ha
- ○
- 75–100 ha
- ○
- 100–125 ha
- ○
- 125–150 ha
- ○
- 150–200 ha
- ○
- 200–250 ha
- ○
- More than 250 ha
5. How many lactating cows were present on you farm in 2018?
- ○
- Less than 50
- ○
- 50–100
- ○
- 100–150
- ○
- 150–200
- ○
- 200–250
- ○
- More than 250
6. What was the average annual milk production per cow and per year in your farm in 2018?
- ○
- Less than or equal to 6000 L/y
- ○
- Between 6000 and 8000 L/y
- ○
- Between 8000 and 10,000 L/y
- ○
- Between 10,000 and 12,000 L/y
- ○
- More than 12,000 L/y
7. What is the main breed of your herd?
- ○
- Holstein
- ○
- Jersey
- ○
- Other
8. For 2018, could you fill the following table?
| Arable Grasslands | - | I don’t know |
| Superficie (ha) | ○ | |
| Production (t/ha/year) | ○ | |
| Proportion of the production (%) | ||
| ○ Silage | ○ | |
| ○ Hay | ○ | |
| ○ Grazing - Cows | ○ | |
| ○ Grazing - Heifers | ○ | |
| ○ Not used | ○ | |
| If silage, number of cuts? | ○ | |
| Arable grasslands (year) | ||
| ○ 1–2 | ○ | |
| ○ 2–3 | ○ | |
| ○ plus | ○ | |
| Manure (t/ha/year) | ○ | |
| Slurry (t/ha/year) | ○ | |
| Mineral N (kg N/ha/year) | ○ | |
| % legume in the grassland | ○ | |
| ○ 0% | ○ | |
| ○ 20% | ○ | |
| ○ 40% | ○ | |
| ○ more | ○ | |
| Permanent grasslands | I don’t know | |
| Superficies (ha) | ○ | |
| Production (t/ ha/year) | ○ | |
| Proportion of the production (%) | ||
| ○ Silage | ○ | |
| ○ Hay | ○ | |
| ○ Grazing - cows | ○ | |
| ○ Grazing - Heifers | ○ | |
| ○ Not used | ○ | |
| If silage, number of cuts? | ○ | |
| Manure (t/ha/year) | ○ | |
| Slurry (t/ha/year) | ○ | |
| Mineral N (kg N/ha/year) | ○ | |
| % legume in the grassland | ○ | |
| ○ 0% | ○ | |
| ○ 20% | ○ | |
| ○ 40% | ○ | |
| ○ more | ○ |
9. What is your opinion on grazing (in general)? Several answers are possible
Does it lower production costs?
- ○
- Yes
- ○
- No
- ○
- Neutral
Does it improve animal welfare?
- ○
- Yes
- ○
- No
- ○
- Neutral
Does it contribute to preserve landscape?
- ○
- Yes
- ○
- No
- ○
- Neutral
Is it beneficial for environment?
- ○
- Yes
- ○
- No
- ○
- Neutral
10. In your farm, which cattle were grazing in 2018?
Young cattle
- ○
- Yes
- ○
- No
Heifers
- ○
- Yes
- ○
- No
Lactating cows
- ○
- Yes
- ○
- No
10.1. If the lactating cows do not usually graze, what are the reasons therefore?
- ○
- Pastures too far from the stable
- ○
- Grazeable areas insufficient
- ○
- Lower milk yield at grazing
- ○
- Difficult or expensive management
- ○
- Poor climate conditions
- ○
- Poor soil conditions
- ○
- Economical: better opportunities for land use
The following answers concerned only the lactating cows in 2018
10.2. How many ha are available for the lactating cows?
11. How long is the grazing period on average?
- ○
- Less than 2 months
- ○
- 2–4 months
- ○
- More than 4 months
12. Which kind of grazing do you practice?
- ○
- Daytime
- ○
- Day and night
- ○
- Few hours a day
13. Do you supply any feed complement during the grazing period on top of the concentrate provided at milking?
- ○
- Permanently
- ○
- Most of the time
- ○
- Occasionally
- ○
- Never
14. What type(s) of complement feed do you supply on top of the concentrate provided at milking?
- ○
- Hay
- ○
- Grass silage
- ○
- Maize silage
- ○
- Cereals
- ○
- Composed compounds
- ○
- Other
15. Could you estimate the grazed grass percentage (%DM) in the cows’ diet during the summer time?
- ○
- Less than 25%
- ○
- 50–75%
- ○
- 25–50%
- ○
- I don’t know
16. Could you estimate the grass percentage (%DM) in the cows’ diet during the wintertime?
- ○
- Less than 25%
- ○
- 25–50%
- ○
- 50–75%
- ○
- More than 75%
- ○
- I don’t know
17. Why do you keep grazing
- ○
- Lower production costs
- ○
- Improves welfare
- ○
- Better image for consumer
- ○
- Preservation of landscape and biodiversity
- ○
- Requirements of dairy industry or authorities
- ○
- No other land use possible
- ○
- Premium/label
- ○
- Other
18. How do you foresee grazing practices in your farm for the next 5 years?
- ○
- I expect to increase
- ○
- I expect to decrease
- ○
- I expect to stop
- ○
- I expect to stay stable
References
- Gerber, P. Greenhouse Gas Emissions from the Dairy Sector; Report FAO; FAO: Rome, Italy, 2010. [Google Scholar]
- Tubiello, F.N.; Salvatore, M.; Ferrara, A.F.; House, J.; Federici, S.; Rossi, S.; Biancalani, R.; Condor Golec, R.D.; Jacobs, H.; Flammini, A.; et al. The Contribution of Agriculture, Forestry and other Land Use activities to Global Warming, 1990–2012. Glob. Chang. Biol. 2015, 21, 2655–2660. [Google Scholar] [CrossRef] [PubMed]
- Soussana, J.-F.; Loiseau, P.; Vuichard, N.; Ceschia, E.; Balesdent, J.; Chevallier, T.; Arrouays, D. Carbon cycling and sequestration opportunities in temperate grasslands. Soil Use Manag. 2004, 20, 219–230. [Google Scholar] [CrossRef]
- Dollé, J.B.; Faverdin, P.; Agabriel, J.; Sauvant, D.; Klumpp, K. Contribution de l’élevage bovin aux émissions de GES et au stockage de carbone selon les systèmes de production. Fourrages 2013, 215, 181–191. [Google Scholar]
- Garnett, T.; Müller, A.; Röös, E.; Smith, P.; de Boer, I.J.M.; Ermgassen, E.Z.; Herrero, M.; van Middelaar, C.; Schader, C.; van Zanten, H. Grazed and Confused? Ruminating on Cattle, Grazing Systems, Methane, Nitrous Oxide, the Soil Carbon Sequestration Question—What It All Means for Greenhouse Gas Emissions; Oxford University: Oxford, UK, 2017; pp. 1–149. [Google Scholar]
- Søegaard, K.; Gierus, M.; Hopkins, A.; Halling, M. Temporary grassland-challenges in the future. In Proceedings of the 14th Symposium of the European Grassland Federation on Permanent and Temporary Grassland: Plant, Environment and Economy, Ghent, Belgium, 3–5 September 2007; pp. 27–38. [Google Scholar]
- Kosztra, B.; Büttner, G.; Hazeu, G.; Arnold, S. Updated CLC Illustrated Nomenclature Guidelines; European Environment Agency: Wien, Austria, 2017; pp. 1–124. [Google Scholar]
- Soussana, J.F.; Allard, V.; Pilegaard, K.; Ambus, P.; Amman, C.; Campbell, C.; Ceschia, E.; Clifton-Brown, J.; Czobel, S.; Domingues, R.; et al. Full accounting of the greenhouse gas (CO2, N2O, CH4) budget of nine European grassland sites. Agric. Ecosyst. Environ. 2007, 121, 121–134. [Google Scholar] [CrossRef]
- Soussana, J.F.; Tallec, T.; Blanfort, V. Mitigating the greenhouse gas balance of ruminant production systems through carbon sequestration in grasslands. Animal 2010, 4, 334–350. [Google Scholar] [CrossRef] [PubMed] [Green Version]
- Abdalla, M.; Hastings, A.; Chadwick, D.R.; Jones, D.L.; Evans, C.D.; Jones, M.B.; Rees, R.M.; Smith, P. Critical review of the impacts of grazing intensity on soil organic carbon storage and other soil quality indicators in extensively managed grasslands. Agric. Ecosyst. Environ. 2018, 253, 62–81. [Google Scholar] [CrossRef] [PubMed]
- Follett, R.F.; Reed, D.A. Soil Carbon Sequestration in Grazing Lands: Societal Benefits and Policy Implications. Rangel. Ecol. Manag. 2010, 63, 4–15. [Google Scholar] [CrossRef] [Green Version]
- Henderson, B.B.; Gerber, P.J.; Hilinski, T.E.; Falcucci, A.; Ojima, D.S.; Salvatore, M.; Conant, R.T. Greenhouse gas mitigation potential of the world’s grazing lands: Modeling soil carbon and nitrogen fluxes of mitigation practices. Agric. Ecosyst. Environ. 2015, 207, 91–100. [Google Scholar] [CrossRef]
- European Commission. Rapport de la Commission au Parlement Européen sur la Mise en Oeuvre de L’obligation en Matière de Surfaces D’intérêt Écologique au Titre des Paiements Directs Verts; European Commission: Brussels, Belgium, 2017. [Google Scholar]
- McDonagh, J. Rural geography I: Changing expectations and contradictions in the rural. Prog. Hum. Geogr. 2013, 37, 712–720. [Google Scholar] [CrossRef]
- Gerbrandy, G.-J. What’s the Largest Multinational of Europe? Bees Br. -Nature Why Care? Belgium Ecosystem Services: Corbais, Belgium, 2012; pp. 1–8. [Google Scholar]
- Belgian National Focal Point. Biodiversity 2020, Update of Belgium’s National Strategy; Moreau, R., Ed.; Belgian National Focal Point: Brussels, Belgium, 2014; ISBN 9708907324. [Google Scholar]
- Rosset, P.M. The Multiple Functions and Benefits of Small Farm Agriculture; Food First: Oakland, CA, USA, 1999; Volume 6370, pp. 77–82. [Google Scholar]
- Kim, H.-Y. Statistical notes for clinical researchers: Chi-squared test and Fisher’s exact test. Restor. Dent. Endod. 2017, 42, 152–155. [Google Scholar] [CrossRef] [PubMed]
- Confédération Belge de L’industrie Laitière. Rapport Année 2018. Available online: www.bcz-cbl.be (accessed on 16 May 2019).
- L’agriculture Wallonne en Chiffres. Rapport 2019. Available online: https://agriculture.wallonie.be/ (accessed on 16 May 2019).
- Les Chiffres Clés de la Production Laitière Wallonne. Available online: http://www.celluleinfolait.be/le-lait-en-wallonnie/lait-de-vache/ (accessed on 19 May 2019).
- L’agriculture Belge en Chiffres. Available online: https://statbel.fgov.be/fr (accessed on 19 May 2019).
- Evolution de L’économie Agricole et Horticole de la Wallonie. 2017. Available online: https://agriculture.wallonie.be/ (accessed on 3 June 2019).
- Kristensen, T.; Madsen, M.L.; Noe, E. The use of grazing in intensive dairy production and assessment of farmers attitude towards grazing. Grassl. Sci. Eur. 2010, 15, 964–966. [Google Scholar]
- Comité du Lait Rapport D’activité. 2017. Available online: https://www.comitedulait.be/ (accessed on 16 May 2019).
- Comité du Lait Rapport D’activité. 2019. Available online: https://www.comitedulait.be/ (accessed on 16 May 2019).
- York, L.; Heffernan, C.; Rymer, C. A systematic review of policy approaches to dairy sector greenhouse gas (GHG) emission reduction. J. Clean. Prod. 2018, 172, 2216–2224. [Google Scholar] [CrossRef]
Figure 1.
Proportional production of grass on temporary and permanent grasslands following results of 2016 and 2019 surveys. Abbreviations: LC, lactating cows; H, heifers; Temp: Temporary.
Figure 1.
Proportional production of grass on temporary and permanent grasslands following results of 2016 and 2019 surveys. Abbreviations: LC, lactating cows; H, heifers; Temp: Temporary.

Figure 2.
Perceptions on grazing. The positive and negative impacts are compared following the grazing (G) or no-grazing (NG) practices.
Figure 2.
Perceptions on grazing. The positive and negative impacts are compared following the grazing (G) or no-grazing (NG) practices.

Figure 3.
Reasons to stop grazing. Significant values are indicated. Abbreviations: insuff, insufficient; MY, milk yield.
Figure 3.
Reasons to stop grazing. Significant values are indicated. Abbreviations: insuff, insufficient; MY, milk yield.

Figure 4.
Influence of the production system on perceptions on grazing. *: Statistically significant differences.
Figure 4.
Influence of the production system on perceptions on grazing. *: Statistically significant differences.


Table 1.
Temporary and permanent grassland management: Some key facts in 2016.
| n1 | Temporary Grassland | n1 | Permanent Grassland | |
|---|---|---|---|---|
| Surface (ha) | 427 | 16.7 ± 21.32 | 883 | 45.3 ± 28.8 |
| Production (t DM/ha) | 82 | 11.2 ± 3.6 | 105 | 10.2 ± 5.7 |
| Cuts (/grazing season) | 401 | 3.1 ± 1.3 | 829 | 2.3 ± 1.6 |
| Organic fertilizer (t/ha/year) | 324 | 29.0 ± 17.6 | 599 | 27.3 ± 33.1 |
| Mineral fertilizer (kg N/ha/year) | 323 | 172 ± 196 | 599 | 149 ± 175 |
Note: n1: Number of received answers. 2: Values are means ± standard deviations (sd).
Table 2.
Temporary and permanent grassland management: Some key facts in 2019.
| n1 | Temporary Grassland | n1 | Permanent Grassland | |
|---|---|---|---|---|
| Surface (ha) | 474 | 17.7 ± 22.22 | 828 | 49.0 ± 34.9 |
| Production (t DM/ha) | 91 | 10.5 ± 3.6 | 105 | 8.9 ± 3.0 |
| Cuts (/grazing season) | 424 | 3.4 ± 1.2 | 829 | 2.9 ± 1.2 |
| Organic fertilizer (t/ha/year) | 362 | 39.0 ± 26.0 | 599 | 40.9 ± 70.7 |
| Mineral fertilizer (kgN/ha/year) | 265 | 179 ± 104 | 440 | 158 ± 93 |
Note: n1: Number of received answers. 2: Values are means ± sd.
© 2019 by the authors. Licensee MDPI, Basel, Switzerland. This article is an open access article distributed under the terms and conditions of the Creative Commons Attribution (CC BY) license (http://creativecommons.org/licenses/by/4.0/).
Share and Cite
MDPI and ACS Style
Lessire, F.; Jacquet, S.; Veselko, D.; Piraux, E.; Dufrasne, I. Evolution of Grazing Practices in Belgian Dairy Farms: Results of Two Surveys. Sustainability 2019, 11, 3997. https://doi.org/10.3390/su11153997
AMA Style
Lessire F, Jacquet S, Veselko D, Piraux E, Dufrasne I. Evolution of Grazing Practices in Belgian Dairy Farms: Results of Two Surveys. Sustainability. 2019; 11(15):3997. https://doi.org/10.3390/su11153997
Chicago/Turabian StyleLessire, Françoise, Samuel Jacquet, Didier Veselko, Emile Piraux, and Isabelle Dufrasne. 2019. "Evolution of Grazing Practices in Belgian Dairy Farms: Results of Two Surveys" Sustainability 11, no. 15: 3997. https://doi.org/10.3390/su11153997
Note that from the first issue of 2016, this journal uses article numbers instead of page numbers. See further details here.