Flood Assessment for Risk-Informed Planning along the Sirba River, Niger
by
 , , , ,
Maurizio Tiepolo
1,* ,
,
Maurizio Rosso
2 ,
,
Giovanni Massazza
1 ,
,
Elena Belcore
1,
Souradji Issa
3 and
Sarah Braccio
1 1
DIST, Politecnico and University of Turin, viale Mattioli 39, 10125 Turin, Italy
2
DIATI, Politecnico of Turin, Corso Duca degli Abruzzi 24, 10129 Turin, Italy
3
Direction Departementale de l’Agriculture, Gothèye, Niger
*
Author to whom correspondence should be addressed.
Sustainability 2019, 11(15), 4003; https://doi.org/10.3390/su11154003
Submission received: 29 June 2019
/
Revised: 18 July 2019
/
Accepted: 22 July 2019
/
Published: 24 July 2019
(This article belongs to the Special Issue Risk-Informed Sustainable Development in the Rural Tropics)
Abstract
:South of the Sahara, flood vulnerability and risk assessments at local level rarely identify the exposed areas according to the probability of flooding or the actions in place, or localize the exposed items. They are, therefore, of little use for local development, risk prevention, and contingency planning. The aim of this article is to assess the flood risk, providing useful information for local planning and an assessment methodology useful for other case studies. As a result, the first step involves identifying the information required by the local plans most used south of the Sahara. Four rural communities in Niger, frequently flooded by the Sirba River, are then considered. The risk is the product of the probability of a flood multiplied by the potential damage. Local knowledge and knowledge derived from a hydraulic numerical model, digital terrain model, very high resolution multispectral orthoimages, and daily precipitation are used. The assessment identifies the probability of fluvial and pluvial flooding, the exposed areas, the position, quantity, type, replacement value of exposed items, and the risk level according to three flooding scenarios. Fifteen actions are suggested to reduce the risk and to turn adversity into opportunity.
1. Introduction
In the first decade of this century, floods have struck 11.5 million people south of the Sahara [1]. It is not surprising that community preparedness appears in the Agenda of the African Union [2]. Nevertheless, between 2013 and 2017, official development aid spent just 0.1 million Euros on this activity against 12.4 billion Euros used for disaster risk reduction in the Subcontinent [3]. Various multilateral organizations have urged or are supporting the preparation of local disaster risk reduction and contingency plans [4,5]. At present, there is little information on the state of local planning [6]. So far, the scientific community has been engaged above all in flood vulnerability and risk assessments, important activities which are, however, difficult to coordinate with local planning. For some time, attempts have been made to improve communication between climatologists and planners, also providing to the latter simplified analysis methods [7], aiming for greater collaboration [8,9], and urging the analysts to recommend specific actions [10]. The community-based approach used in many assessments has not produced the quantitative information expected by planning [11] and seems inadequate to appreciate the risks caused by climatic changes that communities have not yet experienced [12]. Ultimately, the use of vulnerability and risk assessments in planning remains a critical point [13,14,15,16]. The systematic review of flood assessments in the sub-Saharan context produced in recent years (Table 1) reveals that just one in four identifies the exposed areas according to the probability of flooding. The threshold (flood level or amount of precipitation) above which flooding occurs is not identified. Therefore, the assessments cannot be used for early warning. One assessment out of four identifies the exposed items, but none considers among these the infrastructures and crops. Climate and land use/land cover changes are not considered. Just one assessment out of three identifies the actions in place to reduce risk. No assessment considers the opportunities offered by floods for sustainable rural development.
In summary, the problem is that the findings of the assessments are not aligned with the information requirements of planners and decision makers. One solution may be to abandon the practice of conducting assessments in an isolated manner and to develop them by coordinating the interests of several organizations. The pool assessments thus implemented would be more likely to contribute to disaster risk reduction (DRR) strategies [6]. A quicker solution would be to identify preliminarily the information required by the local plans and to establish the types of findings expected from the assessments accordingly.
The aim of this article is therefore to propose a flood risk assessment oriented at local development, risk prevention, and contingency plans. A detailed and focused flood risk assessment assists the evaluation (risk level, identification of actions) and decision-making process of risk preparation (giving priority to actions, localizing them, and planning them over time).
From here onwards, using the term ‘local level’, we will refer to the minimum administrative jurisdiction (the municipality) and the term ‘contingency plan’ will be considered synonymous with emergency plan.
The flood risk assessment is developed with four rural communities distributed along 30 km terminals of the Sirba River: Tallé (population 2603 in 2012), Garbey Kourou (4634), Larba Birno (4713), Touré (4065). All communities are on the left bank and belong to the municipality of Gothèye, Niger. The Sirba has a transboundary watershed of 39,138 km2, whose upstream part is in Burkina Faso (93%) and terminal part is in Niger (7%) (Figure 1).
Although these communities are primarily exposed to drought [22], they were flooded by the Sirba in August 2012, by heavy rainfall in July 2018, and by the backwater of the Niger River in January 2019 [43].
The risk assessment considers the risk (R) as ‘the probability of occurrence of hazardous events or trends multiplied by the consequences if these events occur’ [44]. The risk is therefore the product of the hazard (H), or ‘the potential occurrence of a natural or human-induced physical event or trend, or physical impact, that may cause loss of life, injury, or other health impacts, as well as damage and loss to property, infrastructure, livelihoods, service provision, and environmental resources’ and the potential damages (D): R = H × D. The damages from flooding have already been considered as a determinant of the risk in Niger [45], in the Global South [46,47,48,49,50,51], and in the OECD member states [52,53]. The equation used is an alternative to the one that includes exposure, vulnerability, and adaptation. Potential damages constitute the ultimate effect of exposure, vulnerability, and adaptation [54]. The damage calculation is done on the reconstruction or/and replacement cost of each item exposed to flood. Thus, the assessment considers only the tangible, direct costs that could be generated in buildings, infrastructures, and crops.
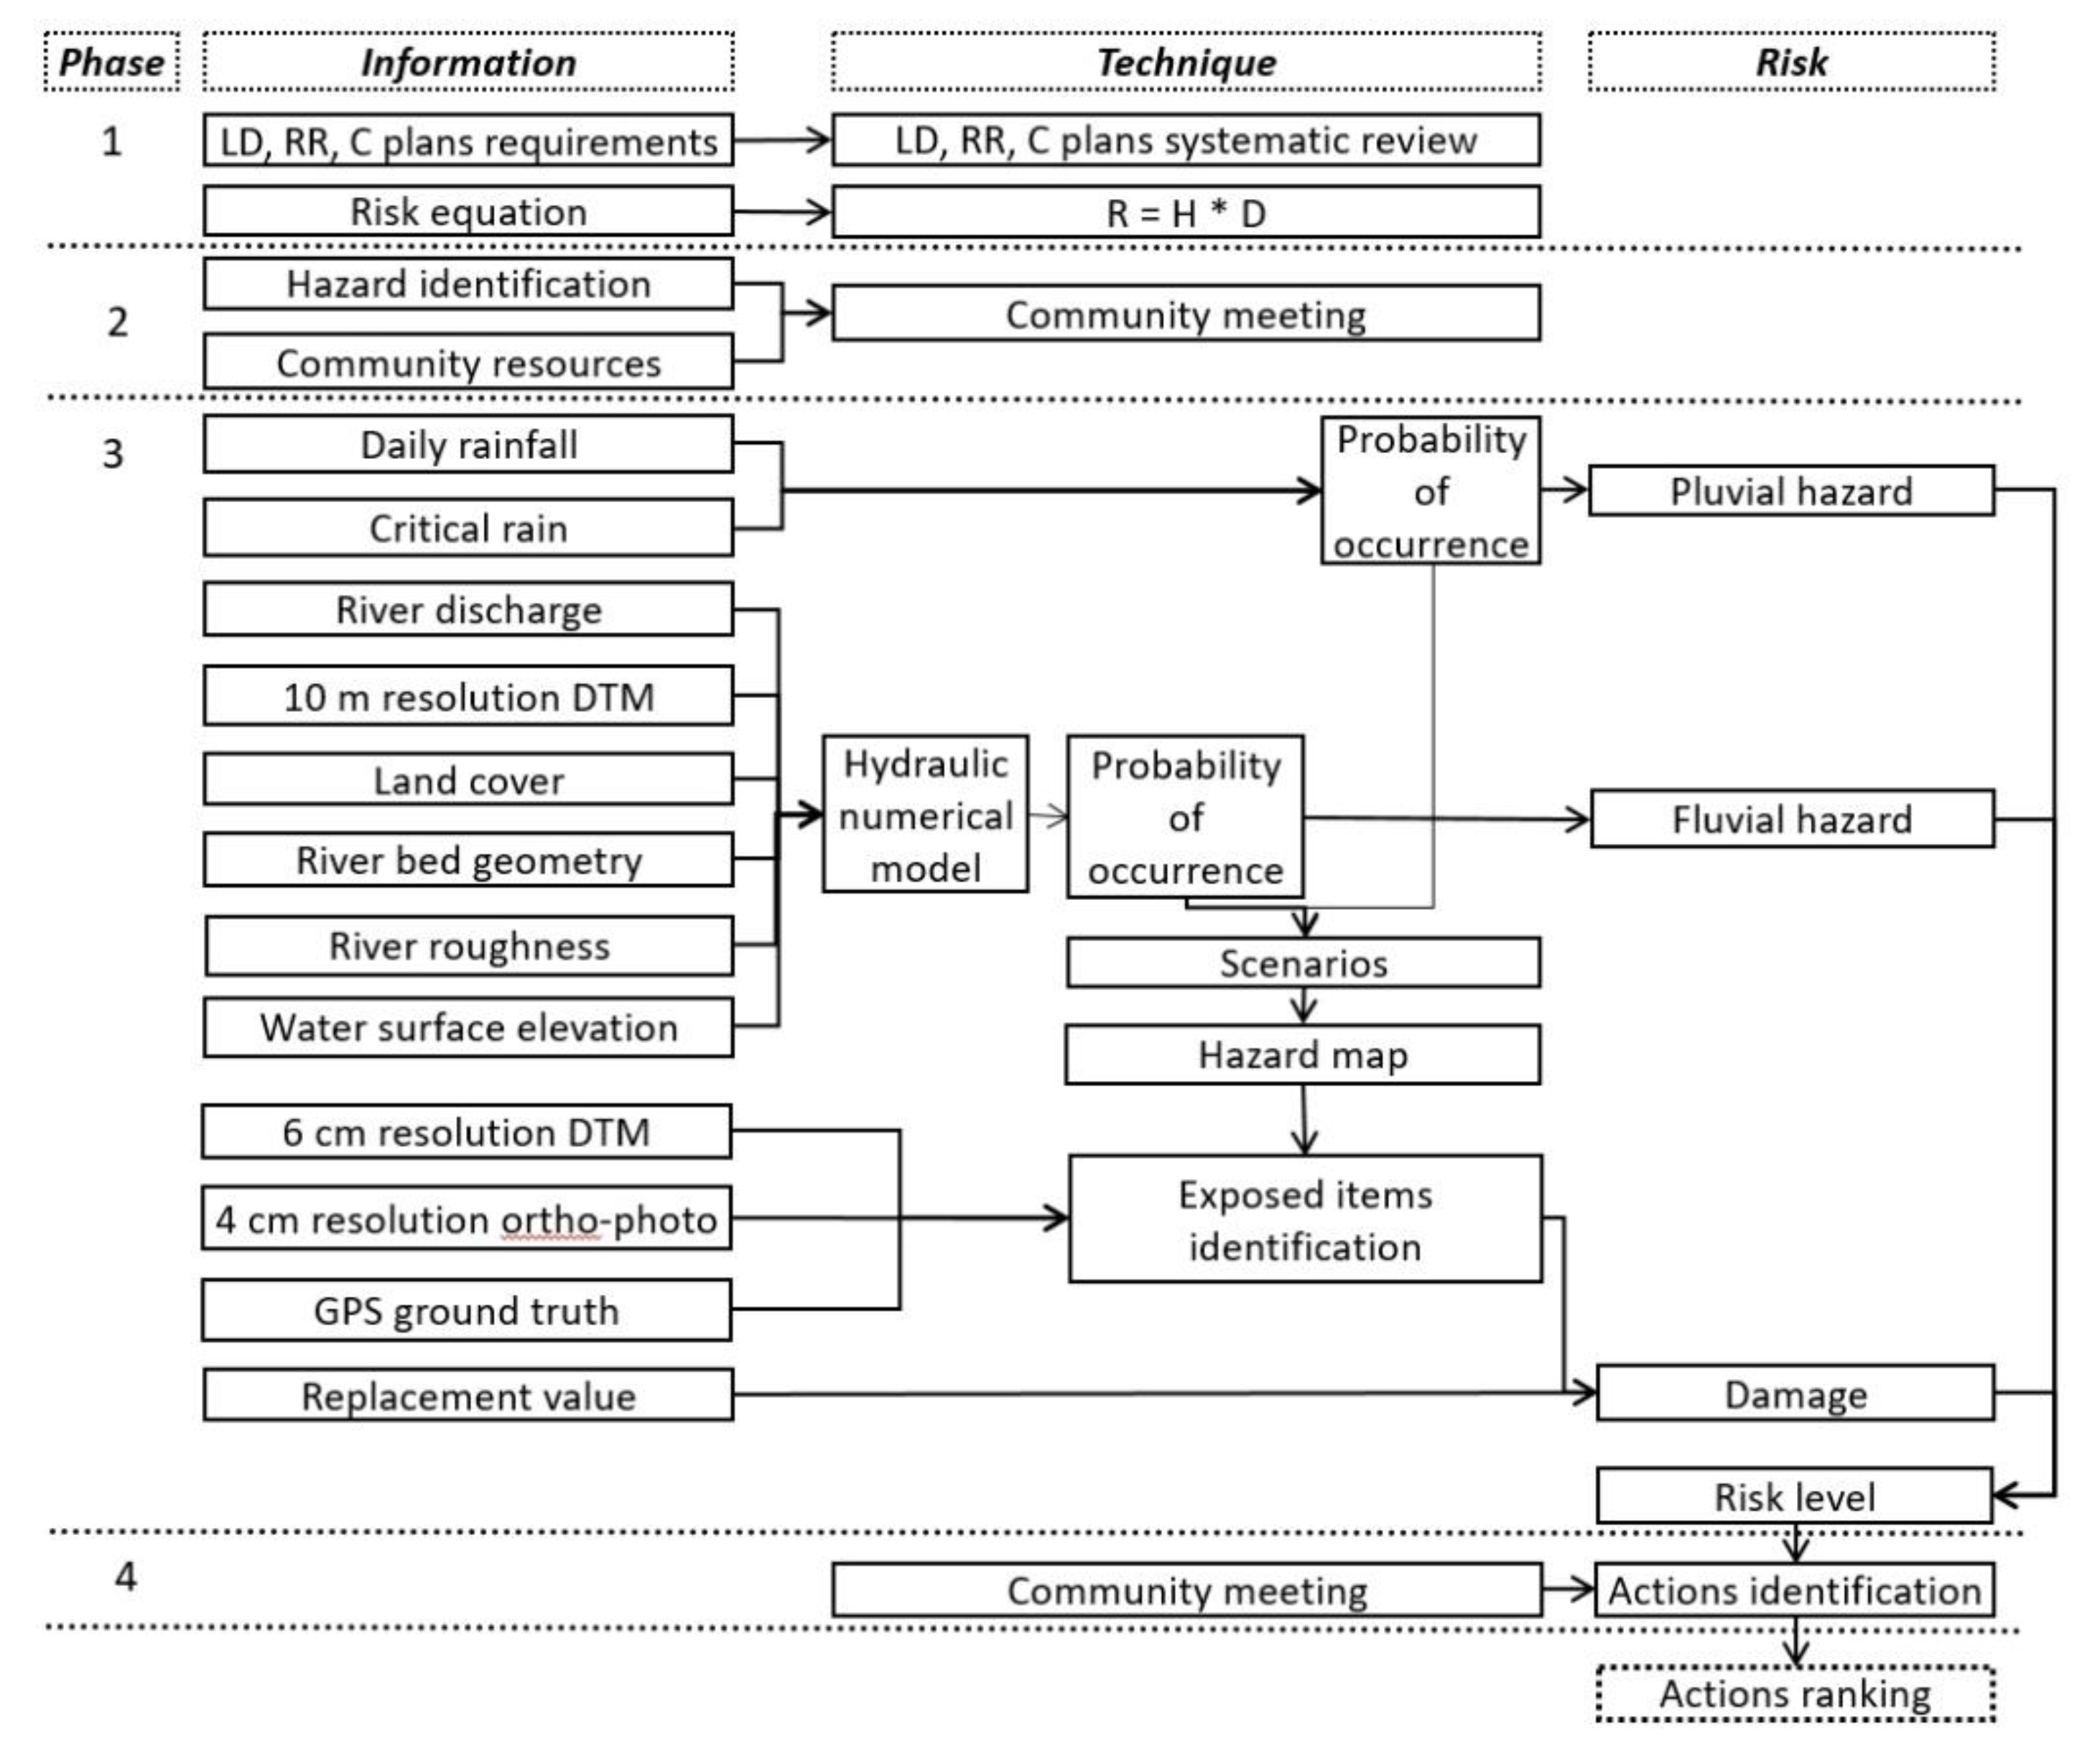
The risk assessment is a process of definition of the scope, criteria, comprehension of the context, identification, analysis, and assessment of the risk [55]. As a result, the assessment is organized into four phases.
The first phase identifies the information that should be used in planning according to national guidelines for the preparation of local plans and according to literature [56]. This makes it possible to establish the findings expected from the risk assessment. The flood risk levels used and the local plans required by law in Niger are therefore ascertained.
The second phase identifies the flood risks (sources, causes, and events) and the resources held by each community (capacity and assets) to address them.
The third phase is dedicated to analysis. The probabilities of fluvial and pluvial flooding are calculated and the consequent flood zones are mapped, the individual exposed items are identified, their replacement value is estimated, and the risk level is determined.
The fourth and final phase identifies the possible risk reduction actions, considering the ongoing adaptation efforts developed by each community.
Risk treatment (selection of actions, distribution over time, and implementation) is not the aim of the assessment as this belongs to the planning phase.
The findings of the assessment are obtained integrating local knowledge with methodologies and information still little used in sub-Saharan Africa but which are promising for their quality and appropriateness to local development, risk preparation, and contingency plans. In the next sections, the materials and methods, results achieved, discussion, and conclusions are presented.
2. Materials and Methods
The assessment of the fluvial and pluvial flooding risk in Tallé, Garbey Kourou, Larba Birno, and Touré uses local and technical knowledge according to four phases.
The first phase compares the results of the systematic review of the published vulnerability and risk assessments with the information required by the national guidelines for the preparation of development plans in Benin, Burkina Faso, Cameroon, Madagascar, Mauritania, Niger, Senegal, South Africa, Uganda, and that used in a selection of local plans. This first step highlights the outputs required from a planning-oriented risk assessment. As regards the risk criteria, the three flooding scenarios used by the Niger Basin Authority were considered: frequent (yellow), severe (orange), and catastrophic (red). The categories of local plans required by law in Niger were identified by questioning the Sustainable Development and Environment National Council (CNEDD, according to the French acronym) and the Directorate General for Civil Protection (DGPC, in French).
The second phase identifies, through meetings with each community, the hydro-climatic threats, the past catastrophic events, the rainfall threshold, and the flood level over which damages are produced and local resources mobilized to address them (Figure 2).
The third phase firstly calculates the probability of occurrence (1/return period) of a flood according to three scenarios of fluvial and pluvial flooding (frequent, severe, catastrophic). The probability of flooding of the Sirba and the backwater of the Niger Rivers is calculated based upon the discharge recorded respectively at the stations of Garbey Kourou in the period 1956–2018 and of Niamey in the period 1929–2019 with a Generalized Extreme Values approach [23].
The probability of pluvial flooding is calculated starting from the daily rainfall and related damages recorded by each community in a register provided by the National Directorate for Meteorology. The probability of occurrence of frequent, severe, and catastrophic rainfall is then calculated with respect to the daily precipitations recorded at the meteorological station of Gothèye (30 km away) between 1961 and 2015. Severe rainfall forms ephemeral water bodies in Larba Birno and Touré that may cause the collapse of buildings and the leakage of contents of the latrine pit.
The area exposed to fluvial flooding according to the three hazard scenarios was identified through the hydraulic numerical model developed on the HEC-RAS software in a 1D configuration [23]. The model calculates the water surface elevations for the different discharges and extends them on the riverbed geometry. The geometry was constructed on a Digital Terrain Model—DTM with 10 m of horizontal resolution, detailed by way of river cross-sections detected each kilometer and hydraulic structures. The roughness was based on riverbed granulometry and the downstream conditions considering the hydraulic levels of the Niger River. This model was calibrated with the hydraulic levels measured at the Bossey Bangou and Garbey Kourou hydrometric stations and in the communities during the 2018 rainy season. This tool allows, towards unsteady simulations conducted with measured hydrographs, the estimation of the propagation and submergence times during the fluvial flooding.
The area exposed to pluvial flooding was identified firstly with an inspection aimed at localizing the biggest ephemeral water bodies in late August 2018, when three-quarters of the annual precipitation had already been accumulated. The identification continued by taking red, green, blue (RGB) images with a 24.3 megapixel camera and RGB near-infrared (NIR) images with a specially created low-cost 5 MP optical sensor from an unmanned aerial vehicle (UAV) [55]. Two flights were made on each community on 14 and 15 September 2018 at 270 m above ground level with the RGB camera and at 120 m with the NIR camera. The collected data were processed with SfM software and orthophotos to 6 cm in RGBN and 4 cm in RGB were obtained for each community. From the RGB data, a DTM of 6 cm of resolution was generated [57]. The water was identified using the normalized differential water index (NDWI = (Green – NIR)/(Green + NIR)) [58] on the multispectral images obtained. Finally, the area surrounding the ephemeral water bodies was estimated by way of the DTM (Supplementary File 1).
The exposed items were identified by way of photo interpretation of the orthoimages at 4 cm resolution recorded by the UAV (Supplementary File 2). Finally, the areas of potential water stagnation (i.e., maximum expected extension of stagnation) were estimated on the basis of the DTM. Those images identify the latrines, granaries, boreholes, wells, fountains, photovoltaic miniplants, and rain-fed and irrigated crops that could not be identified on high-resolution satellite images (Figure 3).
The estimate of damages to the buildings is not based upon the stage-damage function, nor does it consider the flow velocity since the dwellings collapse once they are flooded, as the majority are built from crude earth masonry. The flooding duration and the depth of the water are considered in order to estimate the damages to the crops.
The replacement value of the buildings is estimated through a focus group in each community, considering the construction cost of a standard 24 m2 crude earth house, a latrine, a shower, and a granary. The crop yields are estimated by the Departmental Directorate for Agriculture of Gothèye, which also monitors the prices of agricultural products on the markets. Yields and prices of millet and paddy originate from statistics of the Ministry of Agriculture [59].
The risk level is obtained by multiplying the hazard by the damages in the case of fluvial and pluvial flooding according to the frequent, severe, and catastrophic scenarios.
The fourth phase identifies actions to reduce the risk associated with the type of flooding which threatens each community and with the exposed items as proposed by the individual communities during a participative meeting held on 25–26 June 2019 and integrated, after discussion, with some recurring actions in the examined plans.
3. Results
3.1. Aligning Flood Risk Assessments with Local Plans Requirements
The reduction of the hydro-climatic risk in Niger is essentially entrusted to the municipal development plan (MDP). From 2015, MDPs must identify the impact of climate change and actions to reduce it [60]. The local administrations are struggling to perform this task effectively. It must be considered that in Niger the municipalities are vast jurisdictions that include many rural settlements in strong expansion and multiplication. Gothèye, for example, as an administrative jurisdiction of 3600 km2, includes 146 rural settlements and over 93,000 inhabitants (2012). The rural municipalities and the consultants used by them to draw up development plans have access to scant geographical information and often do not have the tools, resources, and time to collect additional information and to process it. As a result, the risk reduction actions are identified based upon the needs expressed by the communities during rapid consultations. In the best cases, the planned actions concern the reduction of the runoff (half-moons, stone lines, trapezoidal bunds) and of riverbank erosion (gabions, tree planting), and the increase in tree cover, measures that have no resolving effects on the fluvial flooding risk.
Community adaptation plans as introduced firstly by the ANADIA project (Italian development aid) and then by the BRACED project (English development aid) are experimental, voluntary tools. Development plans for individual settlements, as tested in Togo, and risk reduction plans, quite common in Latin America, are uncommon in Niger. The latter are usually made up of a presentation report, a map of the flood-prone areas, a map of the exposed items, a zoning plan which subdivides the territory depending on the flood probability, and a regulation, which specifies what is permitted, prohibited, and worth doing in each zone. The risk reduction plans usually recommend the preparation of a contingency plan.
In future, the contingency plan, as tested on a municipal scale in Burundi, South Africa and on a scale of individual settlements in Mali, may be required by law in Niger to address the hydro-climatic hazards in the most densely populated flood risk areas. This plan should be coordinated with the early warning system (EWS) and constructed taking account of local capacities and assets. An emergency committee, a map of the flood areas according to flooding probability, a map of exposed items to guide information, the drills, and making accessible the refuge sites to households settled in flood-prone areas are recurrent components of this plan.
These components of the plans, as taken from the national guidelines of Niger and eight other African countries and from the literature, need specific information from vulnerability and risk assessments (Figure 4).
In the nine considered countries, municipal development plans made 98% of local plans, and are a consolidated planning tool, now in its third generation. Contingency, risk prevention, and adaptation plans at the local level remain still occasional tools.
The assessment thus provides useful information firstly for the MDPs and, prospectively, for the risk prevention and contingency plans.
3.2. Flood Hazards
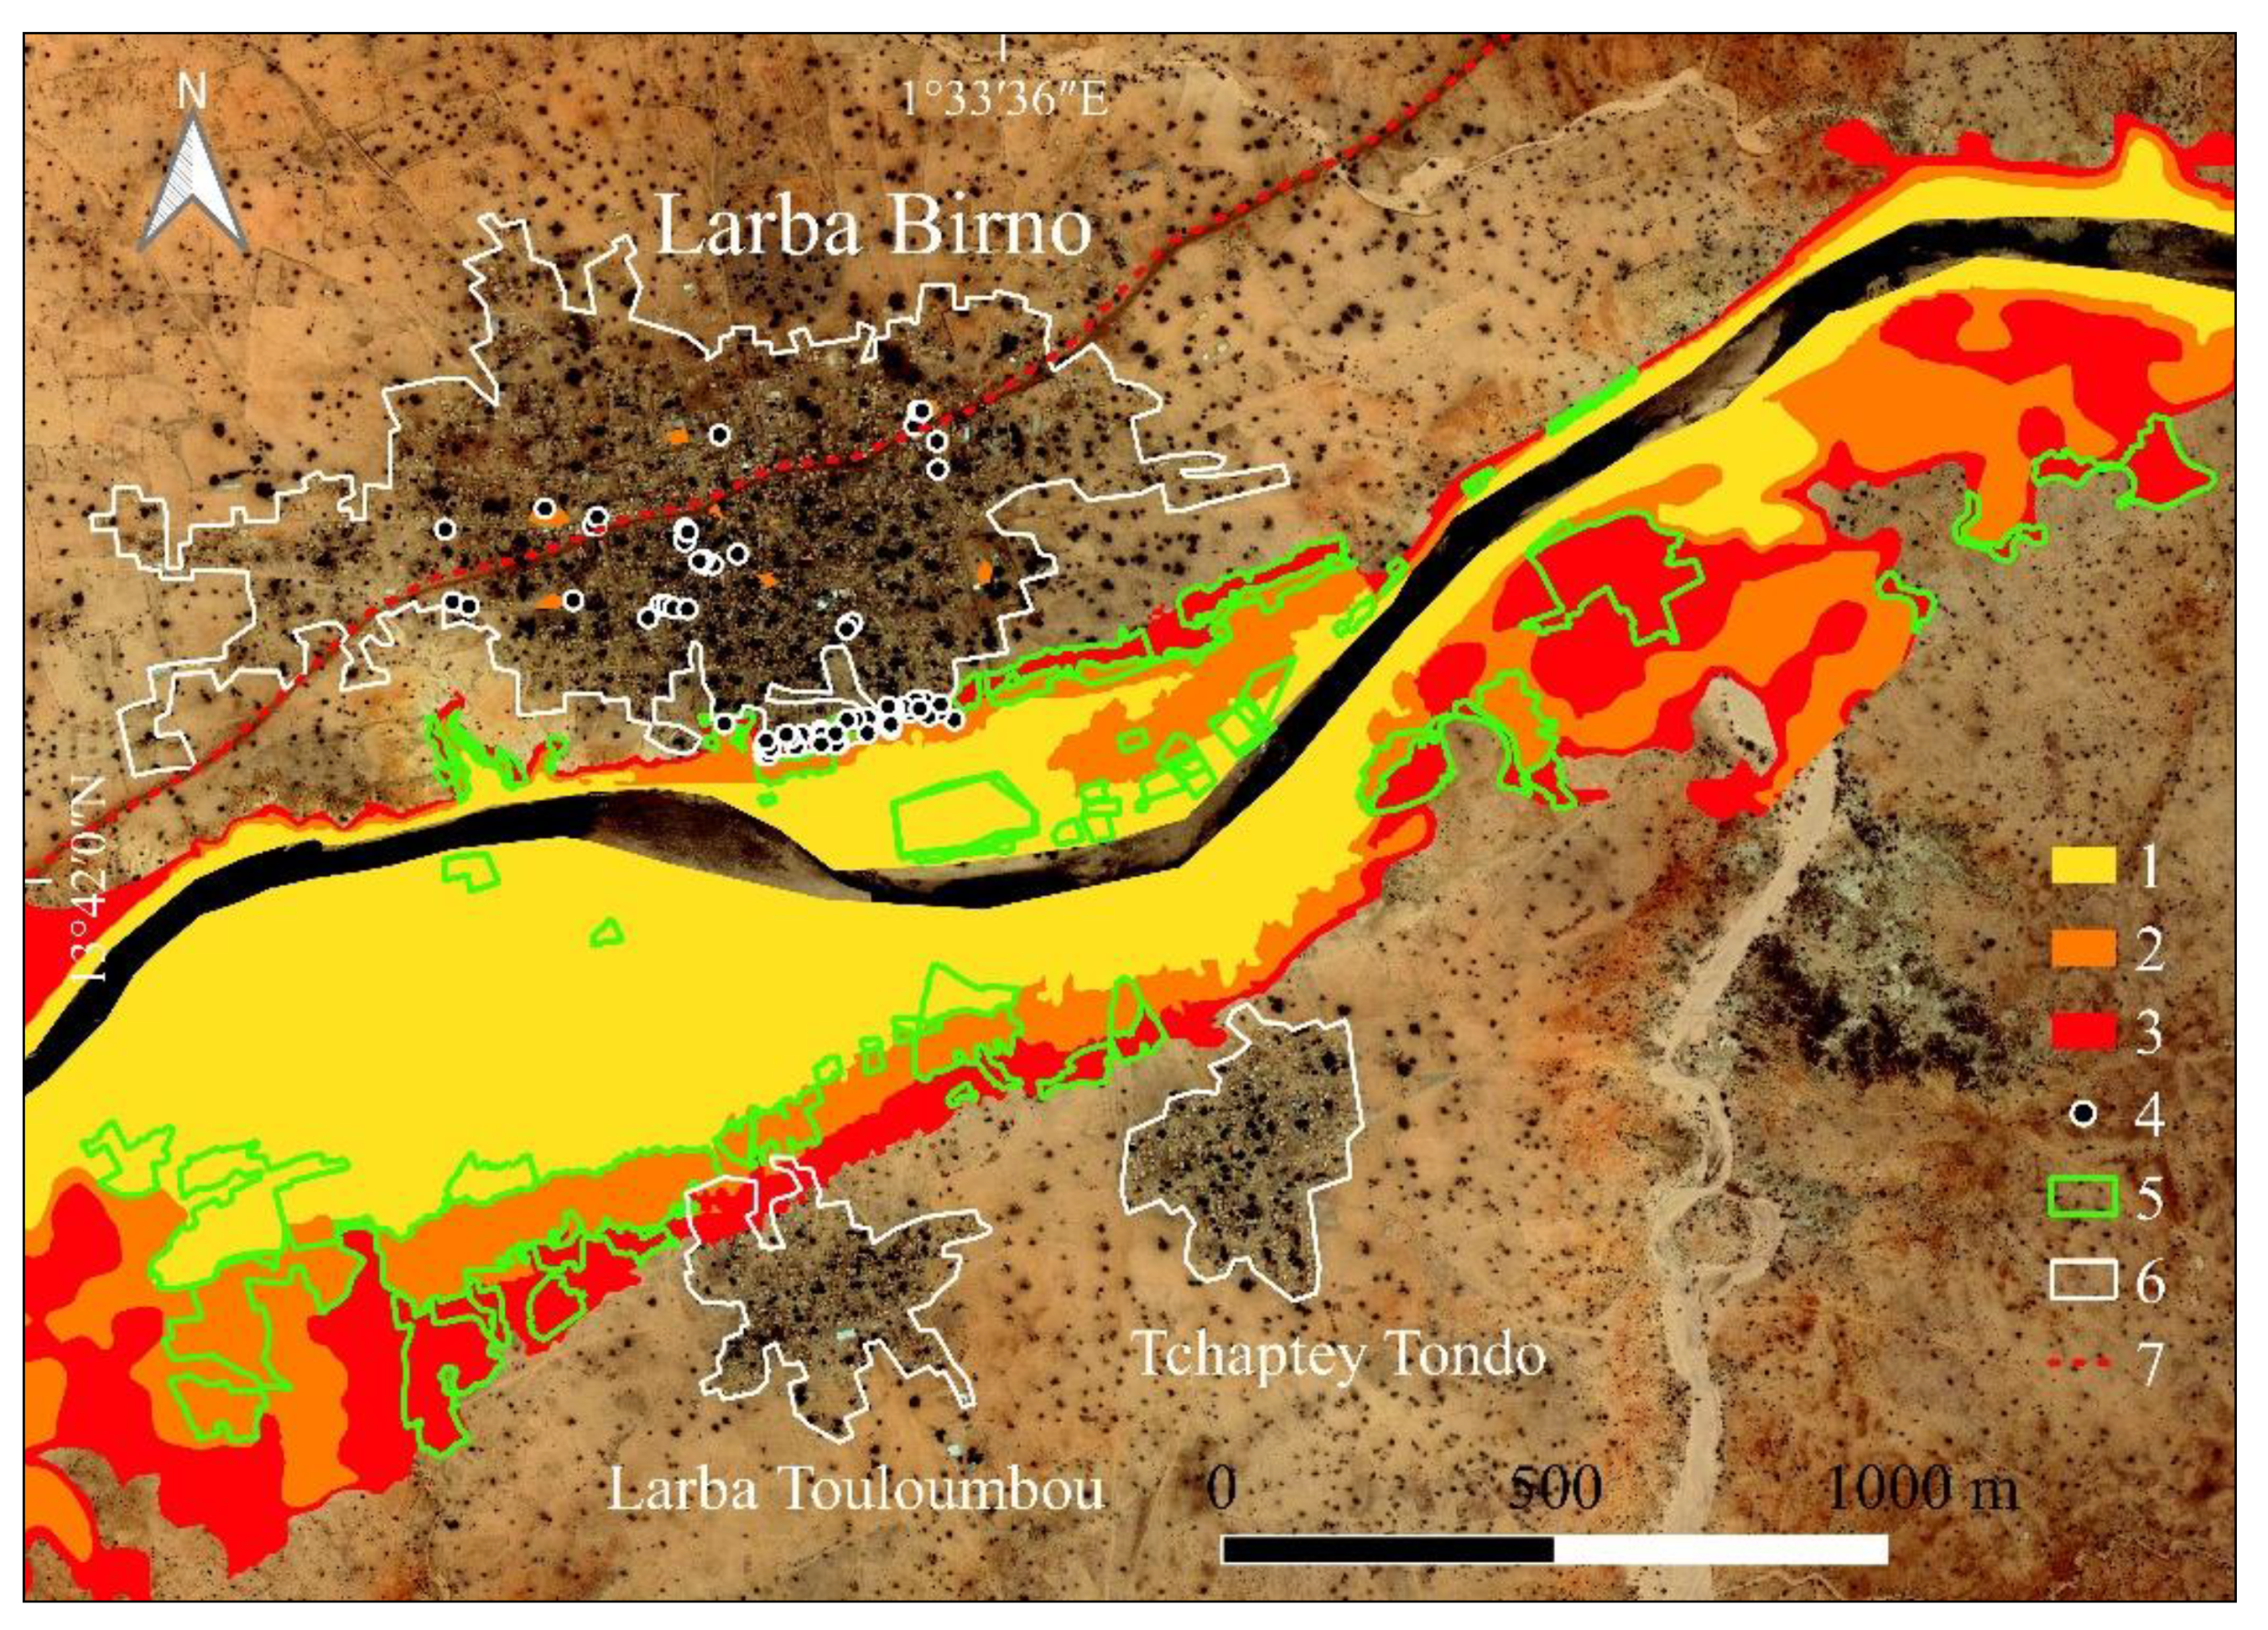
The four communities along the Sirba are exposed to fluvial flooding during the rainy season. Tallé is exposed to fluvial flooding also in the dry season, due to the backwater of the Niger River. Larba Birno and Touré are also exposed to pluvial flooding (Table 2, Figure 5, Figure 6, Figure 7 and Figure 8).
The analysis of the historical series of the Sirba discharge identifies that a flood of 800 m3/s has a return period (RP) of 10 years and can be considered frequent, a flood of 1500 m3/s has an RP of 30 years and is severe, and a flood of 2400 m3/s has an RP of 100 years and is catastrophic. The analysis of local precipitations highlights that a daily precipitation with 90 mm of rain has an RP of 10 years; it is frequent and can cause some damage. A daily precipitation with 100 mm of rain has an RP of 17 years, and should be considered a severe event as it generates great damage. A day with 200 mm of rain has an RP of 50 years and generates such damage as to be considered a catastrophic event (Table 2).
The hydraulic numerical model identifies areas exposed to frequent (RP of 10 years), severe (RP of 30 years), and catastrophic (RP of 100 years) flooding in circumstances of homogeneity of the historical series of discharges (stationary approach). The RP reduces respectively to 2, 5, and 10 years [43] if the nonstationary approach is adopted, necessary to consider strong changes in hydrology which reflect both changes in the climate [61] and in the land use/land cover [62,63,64].
The Sirba flood reaches its peak in 3–9 days and returns to normal level in 4–11 days. The propagation time from Bossey Bangou (108 km upstream of the Niger River, where a hydrometric station has operated since 2018) to Touré is 20 h, to Larba Birno is 26 h, and to Garbey Kourou and Tallé is 28 h.
3.3. Flood Damage
The very high resolution orthoimages facilitate the identification of exposed items that are not visible on satellite images (such as those available for free on Google Earth) and the identification of up to one-third more exposed items. The dwellings appear to have been withdrawn from areas exposed to frequent and severe flooding, but the crops, particularly the commercial crops in Tallé, wells, and boreholes at Larba Birno are plentiful (Table 3).
The area exposed to catastrophic flooding contains the bulk of the exposed items in two out of four communities. This stock of dwellings has the floor at ground level, the door has no threshold, and the walls and roof are made from crude earth. These constructions collapse as soon as the water enters inside or rains too intensely. Boreholes, wells, and fountains without a foundation above water level cannot be used for weeks. The lengthy duration of the flood destroys the crops, once submerged.
The total amount of damage is the highest in Tallé in the event of backwater of the Niger River, followed by Touré in the case of fluvial flooding, and by Larba Birno in the case of pluvial flooding (Table 4). Buildings account for the bulk of the damages in all scenarios and communities (from 84% to 92%) with the sole exception of the flood due to the backwater of the Niger River (Table 5).
3.4. Flood Risk Level
Larba Birno presents the highest risk due to a high value of exposed items in an area with medium probability of pluvial flooding (Table 6). Touré follows, with numerous dwellings in an area with medium probability of pluvial flooding. Then comes Tallé, with a high value of exposed items in an area with low probability of river flooding, and finally Garbey Kourou, with a low value of exposed items in an area with low probability of flooding.
3.5. Identification of Actions for Risk Reduction
Community meetings have shown that the pluvial flood opens up opportunities for recession farming (okra) in Garbey Kourou, in the ephemeral pond upstream of the road, and the fluvial flood allows crops of cowpeas, corn, and squash in Touré, especially on the right bank of the Sirba River.
The proposed actions consider these results and the actions in progress, limited to an emergency committee, flood drills, and a hydrometric station at Garbey Kourou, a manual rain gauge and a river gauge in every community, along with the withdrawal of dwellings from areas exposed to frequent and severe flooding (Table 7), a flood and drought multihazard community adaptation plan (2014) in Garbey Kourou and Tallé.
Other aspects to consider are that the inhabitants settled in the flood-prone area do not want to leave the river because they go there every day to do their laundry and to wash themselves, and there is the desire to remain in the large initial lots of the settlement, in which the ancestors lived. Finally, even in the case of destruction of the house by the river or heavy rains, the tendency is to reconstruct a little further upstream to reuse the clay of the old bricks that elsewhere would not be available or too tiring to transport. In many cases, therefore, it is not access to land that pushes some inhabitants into areas at risk but rather reasons linked to daily life, the cost of transfer, and the link with the place.
The limit of catastrophic flooding (which may occur with a probability 10 times higher according to a nonstationary approach) should be reported and the platform of the boreholes, wells, fountains, and photovoltaic miniplants should be raised as a result. The ephemeral water bodies within the built-up areas should be treated by a storm water drainage. Rain-fed crops should be moved away from the riverbanks. Paddy fields should be protected, remaking the river levees.
When farmers use their own land for commercial gardens, having them set back from the riverbanks should be possible. Cassava should be preferred to other crops since it demands less water.
Any flood risk prevention plan should contain a map of the flood area, the exposed actions, a zoning plan according to flooding probability, and a regulation.
The plan should prohibit further construction and the replacement of dwellings made from crude earth with durable dwellings in the area exposed to catastrophic flooding, unless the floor is above the level of the water.
As regards the contingency plan, an early warning system should be prepared and implemented using local rural radio and by spreading door-to-door information on how to prepare for flooding for all households settled in the area exposed to catastrophic flooding.
A contingency plan always includes a refuge site dimensioned on the number of inhabitants present in the area at risk. However, the communities along the Sirba do not need this structure because during the season in which a flood may occur, the settlements are emptied and the inhabitants move near the fields in temporary settlements to follow the crops. Drills should be organized every year and the emergency committee reactivated or established (Figure 9).
4. Discussion
Exceptions aside, the flood vulnerability and risk assessments considered in the systematic review are deficient in identifying the flood-prone area according to the frequency of the flood and critical rain, the exposed items, and the ongoing actions and they are, therefore, of little use for MDPs and, prospectively, for risk prevention and contingency plans at local level [14].
The initial problem was firstly to align the expected findings of the assessment with the necessary information to reduce flood risk. As a result, the requirements of information for each category of local plans in use in sub-Saharan Africa and in Niger, in particular, were identified. The assessment for Garbey Kourou, Larba Birno, Tallé, and Touré was developed using methods and information based upon those needs: a hydraulic numerical model, the river discharge time series, the long-term daily pluviometric series, DTM, and very high resolution orthoimage, completed by inspections and meetings with the communities. The adopted methodology is totally replicable in order to support the sustainable development of each rural community both in Sahelian areas and in similar contexts.
In this way, it was ascertained that the waters of the Sirba and the Niger Rivers slowly reach the flood peak. This involves the loss of crops once they are submerged. The flood subsides slowly. This means that recession agriculture after Niger River backwater is not possible and that the flood does not bring benefits to Tallé, but only damage. On the contrary, the fluvial flood in Larba Birno and the pluvial flood in Garbey Kourou allow recession agriculture. In these cases, climate change and the consequent flooding constitute an opportunity—an issue still little investigated by the literature. The slow river regime does, however, have an advantage: a flood propagation time long enough to allow for the mayor and the communities downstream to be alerted with sufficient warning to react, even if the flood peak occurs at night.
The multihazard assessment (fluvial flooding with two seasonal peaks and pluvial flooding) highlights that within a river reach of just 30 km, each community is exposed to specific hazards, has different exposed items in the flood prone area, and sometime offers rural development opportunities, and thus requires equally specific measures, a result opposite to that found in other studies [14].
Commercial crops are the main exposed items in the zone with high probability of fluvial flooding for all considered communities and, in the case of Tallé, also for the backwater of the Niger River.
Commercial agriculture is mainly carried out by women and is of crucial importance for rural households. Revenues obtained from the sale of cassava, potatoes, cabbage, squash, and tomatoes make it possible to compensate for the losses of rain-fed cereal crops in the event of agricultural drought and to sustain health, education, and clothing costs. The importance of damage to commercial crops that we have highlighted constitutes a paradox on which the literature has not sufficiently dwelt: To guarantee sustainable rural development in a semiarid context, it is essential to consider the risk of flooding as well as the risk of drought. However, the actions to protect commercial crops from flooding are expensive: the further away you go from the flood-prone area, the more need for wells whose realization, in the specific context of the Sirba, characterized by frequent rocky outcrops, can be very expensive.
The current assessments do not quantify the damages in such a detailed way due to the low-resolution images used, which prevent the individual exposed items from being localized.
The presence of many dwellings in the area exposed to catastrophic flooding, thus of many households, is scantly evidenced in the literature [24,32].
There are few risk reduction actions in progress. As to the actions to be developed, the list is longer and more specific (information, awareness, contingency plan, drills, basement/platform rise, storm water drainage, flood signals, prohibition of house consolidation, field metal fences) than that proposed by the assessments considered which mostly recommend early warning systems [20,21,29,38], resettlement [18,27,30], dam and levee construction [29,31,38], and house improvements [21,40]. These actions are not sufficient in the case study since they do not refer to specific hazards, exposed items, and plan categories.
The assessment identified the discharges at the upstream hydrometer located at Bossey Bangou, close to the Niger–Burkina Faso border, beyond which damages may occur downstream and their probability of occurrence linked the three hazard levels (frequent, severe, catastrophic) to the early warning.
The assessment demonstrates the potential of very high resolution DTM and orthoimages still little used in vulnerability and risk assessments at the local level south of the Sahara. This technology reduces the Information Technology divide if used by local firms using low-cost sensors. In addition, it offers information on the flood-prone areas and on the exposed items which high-resolution satellite images are unable to provide or which require lengthy and costly inspections.
The method that combines local knowledge and technical knowledge presents at least three advantages: it provides a complete photograph of each settlement, which inspections are unable to produce, it is feasible even in the sweltering months (April–May) during which it is not possible to perform lengthy inspections, and it provides a quantitative basis for risk monitoring. Nevertheless, the assessment does have two limits. First of all, the replacement value of the exposed items does not consider domestic vegetable gardens, plentiful above all on the right bank at Larba Birno, the service interruption of the boreholes, the wells, the fountains, the photovoltaic miniplants, or the impacts of ephemeral water bodies on health. Second, the value of production in recession agriculture was not calculated because the assessment took place too far after the last major flood (2012) and therefore the fields cultivated in this mode were no longer observable. These aspects should be addressed by future assessments. The estimate of damages is thus conservative. In addition, in the space of a few years, more high-value exposed items could be found in the area at low risk of river flooding in the absence of actions to limit their proliferation.
The findings of the assessment are above all of interest for local development, risk prevention, and contingency planning, since they provide precise quantities in defined locations and for a localized population in order to decide on a set of proposed actions. Secondly, the results of the assessment are used to validate the hydraulic numerical model: the detailed identification of the exposed items and the flooded areas allows for the optimization of their calibration and the observation of changes following future floods [65].
5. Conclusions
In Africa, south of the Sahara, flood risk assessments at the local level do not provide information aligned with those required by local development plans, risk prevention plans, and contingency plans. A recurrent case concerns the detail of the information provided by the assessments, which is often more appropriate to the regional scale than to the local one. Furthermore, the areas exposed to flooding, the items they contain, and the proposal of specific actions to reduce the risk of flooding appropriate to the particular characteristics of the investigated contexts are too often absent from the assessments. Assessments are therefore not very useful to support an informed decision-making process in risk reduction. To overcome this problem, the simplest solution is to firstly identify the information required by local plans and consequently establish the type of results that the assessment should achieve. Furthermore, this involves reviewing the assessment approach, which must consequently integrate local knowledge with scientific knowledge, for example, by supporting the local ITC (UAV images) which provide more detailed information than anything obtained through commercial high-resolution images.
The flood risk assessment developed along the Sirba River considers and meets the needs of local planning as it establishes the probability of occurrence according to the flooding scenarios established by the Niger River Basin Authority; it consequently identifies the flood-prone areas and exposed items, assesses the potential damages and risk level, and identifies 15 risk-reduction actions to be proposed to the decision makers. Contrary to conventional assessments, this work identifies the opportunities for rural development offered by an event generally considered adverse, such as flooding. The use of very high-resolution images, thereby limits the inspections to a few, targeted receptors, saving time.
The multihazard approach, the integration of local and scientific knowledge, and the techniques used to measure the level of risk and its determinants illustrated in this case study can inspire all those flood assessments on a community scale that must be realized in contexts where information is scarce.
Supplementary Files
Supplementary File 1Author Contributions
Conceptualization, M.T.; Methodology, M.T., M.R., and E.B.; Validation, G.M. and S.I.; Investigation, M.T., G.M., E.B., S.I., and S.B.; Writing—original draft preparation, M.T. and G.M.; Writing—review and editing, G.M.; Visualization, S.B.; Funding acquisition, M.T.
Funding
This research was funded by the Italian Agency for Development Cooperation, by Institute of Bioeconomy (IBE)-National Research Council of Italy (CNR) at Florence (leader), by the National Directorate for Meteorology of Niger (DMN), and by DIST-Politecnico and University of Turin within the project ANADIA2.
Acknowledgments
We would like to thank Vieri Tarchiani (IBE-CNR) and Katiellou Gaptia Lawan (DMN) for facilitating the field activities, Moussa Mouhimouni (DMN) and Mohamed Housseini Ibrahim (Directorate National of Hydraulics) for the information, Aziz Kountché (Africa Drone Service) for the UAV activity, Abdou Hidjo (chief of Garbey Kourou), Salou Mounkaila (chief of Larba Birno), Harouna Mounkeila (chief of Tallé), Issa Sirfi (chief of Touré), and Oumarou Issaka (Departmental directorate for environment, Gothèye) for participation at meeting discussion.
Conflicts of Interest
The authors declare no conflict of interest. The funders had no role in the design of the study; in the collection, analyses, or interpretation of data; in the writing of the manuscript, or in the decision to publish the results.
References
- EM DAT. The Emergency Events Database. 2019. Available online: www.emdat.be (accessed on 18 May 2019).
- African Union. Agenda 2063: The Africa We Want. 2013. Available online: https://au.int/agenda2063/goals (accessed on 18 May 2019).
- OECD 2019. Stats. Available online: https://stats.oecd.org/qwids (accessed on 18 May 2019).
- UNISDR, AAPDRR. African Union 2018. In Proceedings of the Declaration of the Sixth High Level Meeting on Disaster Risk Reduction, Tunis, Tunisia, 13 October 2018. Available online: www.unisdr.org/conference/2018/apr-acdrr (accessed on 18 May 2019).
- R-UNDG-Regional United Nations Development Group 2018. Strategic Framework to Support Resilient Development in Africa. 2018. Available online: https://www.preventionweb.net/files/57759_undgframeworkforresilientdevelopmen.pdf (accessed on 23 July 2019).
- UNDRR. Global Assessment Report on Disaster Risk Reduction; UNDRR: Geneva, Switzerland, 2019; ISBN 978-92-1-004180-5. [Google Scholar]
- Ferrier, N.; Emdad Haque, C. Hazard risks assessment methodology for emergency managers: A standardized framework for application. Natl. Hazards 2003, 28, 271–290. [Google Scholar] [CrossRef]
- Næss, L.O.; Norland, I.T.; Lafferty, W.M.; Aall, C. Data and process linking vulnerability assessment to adaptation decision-making on climate change in Norway. Glob. Environ. Chang. 2006, 16, 221–233. [Google Scholar] [CrossRef]
- Ciurean, R.L.; Schröter, D.; Glade, T. Conceptual frameworks of vulnerability assessments for natural disaster reduction. In Approaches to Disaster Management—Examinig the Implication of Hazards, Emergencies and Disasters; Tiefenbacher, J., Ed.; Intech Open: London, UK, 2013. [Google Scholar]
- Fussel, H.-M.; Klein, R.J.T. Climate change vulnerability assessments: An evolution of conceptual thinking. Clim. Chang. 2006, 75, 301–329. [Google Scholar] [CrossRef]
- Van Aalst, M.; Cannon, T.; Burton, I. Community level adaptation to climate change: The potential role of participatory community risk assessment. Glob. Environ. Chang. 2008, 18, 165–179. [Google Scholar] [CrossRef]
- Forsyth, T. Community-based adaptation: A review of past and future challenges. WIREs Clim. Chang. 2013, 4, 439–446. [Google Scholar] [CrossRef]
- Hay, J.E.; Mimura, N. Vulnerability, risk and adaptation assessment methods in the Pacific islands region: Past approaches, and considerations for the future. Sustain. Sci. 2013, 8, 391–405. [Google Scholar] [CrossRef]
- Mwale, F.D.; Adeloye, A.J.; Beevers, L. Quantifying vulnerability of rural communities to flooding in SSA: A contemporary disaster management perspective applied to the Lower Shire valley, Malawi. Int. J. Disaster Risk Reduct. 2015, 12, 172–187. [Google Scholar] [CrossRef]
- McDowell, G.; Ford, J.; Jones, J. Community-level climate change vulnerability research: Trends, progress, and future directions. Environ. Res. Lett. 2016, 11, 33001. [Google Scholar] [CrossRef]
- Adger, W.N.; Brown, I.; Surminski, S. Advances in risk assessment for climate change adaptation policy. Philos. Trans. R. Soc. A 2016, 376, 20180106. [Google Scholar] [CrossRef] [PubMed]
- Kienberger, S. Spatial modelling of social and economic vulnerability to floods at the district level in Búzi, Mozambique. Nat. Hazards 2012, 64, 2001–2019. [Google Scholar] [CrossRef]
- Osman, A.; Nyarko, B.K.; Mariwah, S. Vulnerability and risk levels of communities within Ankobra estuary of Ghana. Int. J. Disaster Risk Reduct. 2016, 19, 133–144. [Google Scholar] [CrossRef]
- Nabegu, A.B. Analysis of vulnerability to flood disaster in Kano State, Nigeria. Greener J. Phys. Sci. 2012, 4, 22–29. [Google Scholar]
- Ntajal, J.; Lamptey, B.L.; Sogbedji, J.M. Flood vulnerability mapping in the lower Mono river basin in Togo, West Africa. Int. J. Sci. Eng. Res. 2016, 7, 1553–1562. [Google Scholar]
- Komi, K.; Amisigo, B.A.; Diekkrüger, B. Integrated flood risk assessment of rural communities in the Oti river basin, West Africa. Hydrology 2016, 3, 42. [Google Scholar] [CrossRef]
- Hahn, M.B.; Riederer, A.M.; Foster, S.O. The livelihood vulnerability index: A pragmatic approach to assessing risks from climate variability and change—A case study in Mozambique. Glob. Environ. Chang. 2009, 19, 74–88. [Google Scholar] [CrossRef]
- Massazza, G.; Tamagnone, P.; Wilcox, C.; Belcore, E.; Pezzoli, A.; Vischel, T.; Panthou, G.; Ibrahim, M.H.; Tiepolo, M.; Tarchiani, V.; et al. Flood scenarios of the Sirba river (Niger) evaluation of the hazard tresholds and flooding areas. Water 2019, 11, 1018. [Google Scholar] [CrossRef]
- Rudari, R.; Beckers, J.; De Angeli, S.; Rossi, L.; Trasforini, E. Impact of modelling scale on probabilistic flood risk assessment: The Malawi case. E3S Web Conf. 2016, 7, 04015. [Google Scholar] [CrossRef]
- Tiepolo, M.; Braccio, S. Analyse-évaluation du risqué d’inondation et de sécheresse à micro-échelle: Garbey Kourou et Tallé au Niger. In Risque et adaptation climatique dans la region Tillabéri, Niger; Tarchiani, V., Tiepolo, M., Eds.; L’Harmattan: Paris, France, 2016; pp. 205–232. ISBN 978-2-343-08-493-0. [Google Scholar]
- Olatona, O.O.; Obiora-Okeke, O.A.; Adewumi, J.R. Mapping of flood risk zones in Ala river basin Akure, Nigeria. Am. J. Eng. Appl. Sci. 2017, 11, 210–217. [Google Scholar] [CrossRef]
- Olabode, A.D.; Ajibade, L.T.; Yunisa, O. Analysis of flood risk zones (Frzs) around Asa river in Ilorin using geographic information systems (GIS). Int. J. Innov. Sci. Eng. Technol. 2014, 1, 621–628. [Google Scholar]
- Ibrahim, B.A.; Tiki, D.; Mamdem, L.; Leumbe, O.L.; Bitom, D.; Lazar, G. Multicriteria analysis (MCA) approach and GIS for flood risk assessment and mapping in Mayo Kani division, Far North region of Cameroon. Int. J. Adv. Remote Sens. GIS 2018, 7, 2793–2808. [Google Scholar] [CrossRef]
- Akpejiori, J.I.; Ehiorobo, J.O.; Izinyon, O.C. Flood monitoring and flood risk assessment in Agenebode, Edo State, Nigeria. Int. J. Eng. Appl. 2017, 7, 53–59. [Google Scholar] [CrossRef]
- Oriola, E.; Chibuike, C. Flood risk analysis of Edu local government area (Kwara State, Nigeria). Sustainability 2017, 3, 106–116. [Google Scholar] [CrossRef]
- Koumassi, D.H.; Tchibozo, A.E.; Vissin, E.W.; Houssou, C. SIG et télédétéction pour l’optimisation de la cartographie des risques d’inondation dans le basin de la Sota au Benin. Rev. Ivoir. Sci. Technol. 2014, 23, 137–152. [Google Scholar]
- Rakotoarisoa, M.M.; Fleurant, C.; Taibi, A.N.; Rouan, M.; Caillaut, S.; Razakamanana, T.; Ballouche, A. Un modèle multi-agents pour évaluer la vulnérabilité aux inondations: Le cas des villages aux alentours du fleuve Fiherenana (Madagascar). Cybergeo 2018. [Google Scholar] [CrossRef]
- Ugoyibo, O.D.V.; Enyinnaya, O.C.; Souleman, L. Spatial assessment of flood vulnerability in Anambra local government area, Nigeria using GIS and remote sensing. Br. J. Appl. Sci. Technol. 2017, 19, 1–11. [Google Scholar] [CrossRef]
- Gebeyehu, A.; Teshome, G.; Birke, H. Flood hazard and risk assessment in Robe watershed using GIS and remote sensing, north Shewa zone, Amhara region in Ethiopia. J. Humanit. Soc. Sci. 2018, 23, 34–44. [Google Scholar] [CrossRef]
- Oyatayo, K.T.; Iguisi, E.O.; Sawa, B.A.; Ndabula, C.; Jidauna, G.; Irokua, S.A. Assessment of parametric flood vulnerability pattern of Makurundi town, Benue State, Nigeria. Conflu. J. Environ. Stud. 2019, 12, 11–28. [Google Scholar]
- Ejenma, E.; Sunday, V.N.; Okeke, O.; Eluwah, A.N.; Onwuchekwa, I.S. Mapping flood vulnerability arising from land use/land covers change along river Kaduna, Kaduna State, Nigeria. J. Humanit. Soc. Sci. 2014, 19, 155–160. [Google Scholar]
- Orewole, M.O.; Alaigba, D.B.; Oviasu, O.U. Riparian corridors encroachment and flood risk assessment in Ile-Ife: A GIS perspective. Open Trans. Geosci. 2015, 2, 19–20. [Google Scholar]
- Mayomi, I.; Dami, A.; Maryah, U.M. GIS based assessment of flood risk and vulnerability of communities in the Benue floodplains, Adamawa State, Nigeria. J. Geogr. Geol. 2013, 5. [Google Scholar] [CrossRef]
- Yahya, S.; Ahmad, N.; Abdalla, R.F. Multicriteria analysis for flood vulnerable areas in Hadejia-Jama’are river basin, Nigeria. Eur. Sci. Res. 2010, 42, 71–83. [Google Scholar]
- Afriyie, K.; Ganle, J.K.; Santos, E. The floods came and we lost everything’: Weather extremes and households’ asset vulnerability and adaptation in rural Ghana. Clim. Dev. 2018, 10, 259–274. [Google Scholar] [CrossRef]
- Dumenu, W.K.; Obeng, E.A. Climate change and rural communities in Ghana: Social vulnerability, impacts, adaptations and policy implications. Environ. Sci. Policy 2016, 44, 208–217. [Google Scholar] [CrossRef]
- Yawson, D.O.; Adu, M.O.; Armah, F.A.; Kusi, J.; Ansah, I.G.; Chiroro, C. A needs-based approach for exploring vulnerability and response to disaster risk in rural communities in low income countries. Australas. J. Disaster Trauma Stud. 2015, 19, 27–36. [Google Scholar]
- Tamagnone, P.; Massazza, G.; Pezzoli, A.; Rosso, M. Hydrology of the Sirba river: Updating and analysis of discharge time series. Water 2019, 11, 156. [Google Scholar] [CrossRef]
- IPCC. Annex II: Glossary. In Climate Change 2014: Synthesis Report. Contribution of Working Groups I, II and III to the Fifth Assessment Report of the Intergovernmental Panel on Climate Change; IPCC: Geneva, Switzerland, 2014; pp. 117–130. [Google Scholar]
- Tiepolo, M.; Braccio, S. Local and scientific knowledge integration for multi-risk assessment in rural Niger. In Renewing Local Planning to Face Climate Change in the Tropics; Tiepolo, M., Pezzoli, A., Tarchiani, V., Eds.; Springer Open: Cham, Switzerland, 2017; pp. 227–245. [Google Scholar]
- Acosta, L.A.; Eugenio, E.A.; Macandog, P.B.M.; Magcale-Macandog, D.B.; Hui Lin, E.K. Loss and damage from typhoon-induced floods and landslides in the Philippines: Community perceptions on climate impacts and adaptation options. Int. J. Glob. Warm. 2016, 9, 33–65. [Google Scholar] [CrossRef]
- Amirebrahimi, S.; Rajabifard, A.; Mendis, P.; Ngo, T. A framework for a microscale flood damage assessment and visualization for a building using BIM-GIS integration. Int. J. Digit. Earth 2016, 9, 364–386. [Google Scholar] [CrossRef]
- Brower, R.; Akter, S.; Brander, L.; Haque, E. Socioeconomic vulnerability and adaptation to environmental risk: A case study of climate change and flooding in Bangladesh. Risk Anal. 2007, 27, 313–326. [Google Scholar] [CrossRef]
- Mahmood, S.; Khan, A.; Mayo, S.M. Exploring underlying causes and assessing damages of 2010 flash flood in the upper zone of Panjkora river. Nat. Hazards 2016, 83, 1213–1227. [Google Scholar] [CrossRef]
- Perera, E.D.P.; Hiroe, A.; Srestha, D.; Fukami, K.; Basnyat, D.B.; Gautam, S.; Hasegawa, A.; Uenoyama, T.; Tanaka, S. Community-based flood damage assessment approach for lower west Rapti river basin in Nepal under the impact of climate change. Nat. Hazards 2015, 75, 669–699. [Google Scholar] [CrossRef]
- Rahman, A.; Khan, A. Analysis of flood causes and associated socio-economic damages in the Hindukush region. Nat. Hazards 2011, 59, 1239–1260. [Google Scholar] [CrossRef]
- Garrote, J.; Alvarenga, F.M.; Diez-Herrero, A. Quantification of flash flood economic risk using ultra-detailed stage-damage functions and 2-D hydraulic models. J. Hydrol. 2016, 541, 611–625. [Google Scholar] [CrossRef]
- Ernst, J.; Dewals, B.J.; Detrembleur, S.; Archenbeau, P.; Erpicum, S.; Pirotton, M. Micro-scale flood risk analysis based on detailed 2D hydraulic modelling and high resolution geographic data. Nat. Hazards 2010, 55, 181–209. [Google Scholar] [CrossRef]
- Zimmermann, M.; Loat, R. Flood Mapping. Global Water Partnership, World Meteorological Organization: Geneva, 2013. Available online: https://library.wmo.int/index.php?lvl=notice_display&id=16352#.XS7Wb3vOOUk (accessed on 18 May 2019).
- ISO 2018. ISO 31000: Risk Management-Guidelines, 2nd ed.; ISO: Geneva, Switzerland, 2018. [Google Scholar]
- Alexander, D. Towards the development of a standard in emergency planning. Disaster Prev. Manag. 2005, 14, 158–175. [Google Scholar] [CrossRef]
- Piras, M.; Belcore, E.; Pezzoli, A.; Massazza, G.; Rosso, M. Raspberry PI 3multispectral low-cost sensor for UAV based remote sensing. Case study in South-West Niger. Int. Arch. Photogramm. Remote. Sens. Spat. Inf. Sci. 2019, 4213, 207–214. [Google Scholar] [CrossRef]
- McFeeters, S.K. The use of the Normalized Difference Watrer Index (NDWI) in the delineation of open water features. Int. J. Remote Sens. 1996, 17, 1425–1432. [Google Scholar] [CrossRef]
- Republic of Niger; Ministry of Agriculture and Livestock. Rapport D’évaluation Préliminaire des Récoltes et Résultats Provisoires de la Campagne Agricole d’Hivernage; Ministère de l’Agriculture et de l’Élevage: Niamey, Niger, 2018. [Google Scholar]
- Republic of Niger; MDCAT; DGDRL. Directives Pour la Replanification D’un Plan de Développement Communal-PDC; Ministère du Développement Communautaire et de l’Aménagement du Territoire: Niamey, Niger, 2015. [Google Scholar]
- Bacci, M.; Mouhaïmouni, M. Hazard events characterization in Tillaberi region, Niger: Present and future projections. In Renewing Local Planning to Face Climate Change in the Tropics; Tiepolo, M., Tarchiani, V., Pezzoli, A., Eds.; Springer: Cham, Switzerland, 2017; pp. 41–56. [Google Scholar]
- Aich, V.; Liersch, S.; Vetter, T.; Andersson, J.C.M.; Müeller, E.N.; Hattermann, F.F. Climate or land use? Attribution of changes in river flooding in the Sahel zone. Water 2015, 7, 2796–2820. [Google Scholar] [CrossRef]
- Descroix, L.; Guichard, F.; Grippa, M.; Lambert, L.A.; Panthou, G.; Mahe, G.; Gal, L.; Dardel, C.; Quantin, G.; Kergoat, L.; et al. Evolution of surface hydrology in the Sahelo-Sudanian strip: An updated review. Water 2018, 10, 748. [Google Scholar] [CrossRef]
- Wilcox, C.; Panthou, G.; Bodian, A.; Bodian, A.; Blanchet, J.; Descroix, L.; Quantin, G.; Cassé, C.; Tanimoun, B.; Kone, S. Trends in hydrological extremes in the Senegal and Niger rivers. J. Hydrol. 2018, 566, 531–545. [Google Scholar] [CrossRef]
- De Moel, H.; Jongman, B.; Kreibich, H.; Merz, B. Flood risk assessment at different spatial scales. Mitig. Adapt. Strat. Glob. Chang. 2015, 20, 865–890. [Google Scholar] [CrossRef]
Figure 1.
The transboundary watershed of the Sirba River and the four communities.

Figure 2.
Flood risk assessment flowchart.

Figure 3.
Touré, 2018. Images for exposed items’ identification: Sentinel satellite image with 10 m resolution (top); satellite high-resolution image freely available from Google Earth showing (1) earth construction (center); very high resolution image taken from a UAV showing (1) hearth house, (2) latrines, (3) house entrance, (4) ephemeral water body, (5) millet (bottom).

Figure 4.
Use of vulnerability and risk assessments findings according to national guidelines for local development plan preparation in Niger and in eight other African countries.
Figure 4.
Use of vulnerability and risk assessments findings according to national guidelines for local development plan preparation in Niger and in eight other African countries.

Figure 5.
Tallé, 2018. Hazard and exposed items map: frequent (1), severe (2), catastrophic (3), flood-prone area, exposed house (4), well or borehole (5), field (6), built-up area (7), unpaved roads (8), and paved roads (9).
Figure 5.
Tallé, 2018. Hazard and exposed items map: frequent (1), severe (2), catastrophic (3), flood-prone area, exposed house (4), well or borehole (5), field (6), built-up area (7), unpaved roads (8), and paved roads (9).

Figure 6.
Garbey Kourou, 2018. Hazard and exposed items map: frequent (1), severe (2), catastrophic (3), flood-prone area, exposed house (4), field (5), built-up area (6), unpaved road (7).
Figure 6.
Garbey Kourou, 2018. Hazard and exposed items map: frequent (1), severe (2), catastrophic (3), flood-prone area, exposed house (4), field (5), built-up area (6), unpaved road (7).

Figure 7.
Larba Birno, 2018. Hazard and exposed items map: frequent (1), severe (2), catastrophic (3), flood-prone area, exposed house (4), field (5), built-up area (6), unpaved road (7).
Figure 7.
Larba Birno, 2018. Hazard and exposed items map: frequent (1), severe (2), catastrophic (3), flood-prone area, exposed house (4), field (5), built-up area (6), unpaved road (7).

Figure 8.
Touré, 2018. Hazard and exposed items map: frequent (1), severe (2), catastrophic (3), flood-prone area, exposed house (4), well or borehole (5), field (6), built-up area (7), unpaved roads (8).
Figure 8.
Touré, 2018. Hazard and exposed items map: frequent (1), severe (2), catastrophic (3), flood-prone area, exposed house (4), well or borehole (5), field (6), built-up area (7), unpaved roads (8).

Figure 9.
Use of risk assessment for local planning.


Table 1.
Sub-Saharan Africa, 2010–2019. Consistency of 23 vulnerability and risk assessments with the needs of local plans.
Table 1.
Sub-Saharan Africa, 2010–2019. Consistency of 23 vulnerability and risk assessments with the needs of local plans.
| Information Required by Planners and Decision Makers | Information Provided by Assessments (Reference) | |
|---|---|---|
| Community resources | Capacities | [14,17,18,19,20,21,22] |
| Assets | [17,19] | |
| Hazard | Probability of occurrence | [21,23,24,25] |
| Flood-prone area map | [18,23,25,26,27,28,29] | |
| According probability of occurrence | [21,23,29,30,31,32] | |
| Flood vulnerability map | [21,30,31,33,34,35,36,37,38,39] | |
| Exposed items | Location | [18,24,32] |
| Type | [18,22,24,25,27] | |
| Quantity | [18,22,24,25,32] | |
| Replacement value | [24,25] | |
| Risk index | [21,25] | |
| Vulnerability index | [19] | |
| Opportunities | - | |
| Actions | Ongoing | [18,22,25,27,38,40,41] |
| Future | [18,20,21,25,27,29,30,33,38,40,41,42] | |
Table 2.
Four communities along the Sirba River. Hazard.
| Hazard | Probability | Return Period | Discharge | Rainfall | |
|---|---|---|---|---|---|
| Level | % | Years | m3/s | mm | |
| Yellow | 10 | 10 | 800 | ||
| Fluvial Sirba | Orange | 3 | 30 | 1500 | |
| Red | 1 | 100 | 2400 | ||
| Backwater | Red | 5 | 20 | 2238 | |
| Yellow | 10 | 10 | - | 90 | |
| Pluvial | Orange | 6 | 17 | - | 100 |
| Red | 2 | 50 | - | 200 | |
Table 3.
Four communities along the Sirba River, 2018. Houses in flood-prone areas.
| Flood Hazard | Houses in Flood Prone Zones | ||||
|---|---|---|---|---|---|
| Type | Level | Garbey Kourou n. | Larba Birno n. | Tallé n. | Touré n. |
| Fluvial | Yellow | 0 | 0 | 6 | 0 |
| Fluvial | Orange | 24 | 3 | 20 | 3 |
| Fluvial | Red | 33 | 41 | 48 | 79 |
| Backwater | Red | 0 | 0 | - | - |
| Pluvial | Orange | - | 23 | - | 28 |
Table 4.
Four communities along the Sirba River. Replacement value of the exposed items K €.
| Flood Hazard | Replacement Value of the Exposed Items | |||
|---|---|---|---|---|
| Garbey Kourou K € | Larba Birno K € | Tallé K € | Touré K € | |
| Fluvial yellow | 0.2 | 1.3 | 13 | 0.3 |
| Fluvial orange | 8.2 | 4.1 | 6.9 | 1.3 |
| Fluvial red | 13.5 | 16.9 | 20.6 | 34.4 |
| Backwater red | 0 | 0 | 40.7 | 0 |
| Pluvial orange | 0 | 13.6 | 0 | 11.6 |
Table 5.
Four communities along the Sirba River. Exposure of houses over all exposed items (% of total replacement value, K €).
Table 5.
Four communities along the Sirba River. Exposure of houses over all exposed items (% of total replacement value, K €).
| Flood Hazard | Exposure of Houses over All Exposed Items | |||
|---|---|---|---|---|
| Garbey Kourou % | Larba Birno % | Tallé % | Touré % | |
| Fluvial yellow | 0 | 0 | 14 | 0 |
| Fluvial orange | 88 | 28 | 86 | 84 |
| Fluvial red | 92 | 91 | 69 | 87 |
| Backwater red | - | 0 | 0 | - |
| Pluvial orange | - | 100 | - | 100 |
Table 6.
Four communities along the Sirba River. Risk level.
| Flood Hazard | Risk Level | ||||
|---|---|---|---|---|---|
| Probability | Garbey Kourou M € | Larba Birno M € | Tallé M € | Touré M € | |
| Fluvial yellow | 10 | 0.02 | 0.13 | 1.3 | 0.03 |
| Fluvial orange | 3 | 0.27 | 0.12 | 0.23 | 0.04 |
| Fluvial red | 1 | 0.14 | 0.17 | 0.21 | 0.34 |
| Backwater red | 6 | - | - | 0.65 | - |
| Pluvial orange | 6 | - | 0.82 | - | 0.69 |
Table 7.
Four communities along the Sirba River. Ongoing adaptation actions.
| Flood Hazard | Action | On-Going Adaptation Actions | |||
|---|---|---|---|---|---|
| Garbey Kourou | Larba Birno | Tallé | Touré | ||
| Committee | ● | ||||
| Fluvial flood | Setback | ● | |||
| Hydrometric station | ● | ||||
| River gauge | ● | ● | ● | ● | |
| Pluvial flood | Manual pluviometer | ● | ● | ● | ● |
| Adaptation plan | ● | ● | ● | ||
| Drills | ● | ||||
© 2019 by the authors. Licensee MDPI, Basel, Switzerland. This article is an open access article distributed under the terms and conditions of the Creative Commons Attribution (CC BY) license (http://creativecommons.org/licenses/by/4.0/).
Share and Cite
MDPI and ACS Style
Tiepolo, M.; Rosso, M.; Massazza, G.; Belcore, E.; Issa, S.; Braccio, S. Flood Assessment for Risk-Informed Planning along the Sirba River, Niger. Sustainability 2019, 11, 4003. https://doi.org/10.3390/su11154003
AMA Style
Tiepolo M, Rosso M, Massazza G, Belcore E, Issa S, Braccio S. Flood Assessment for Risk-Informed Planning along the Sirba River, Niger. Sustainability. 2019; 11(15):4003. https://doi.org/10.3390/su11154003
Chicago/Turabian StyleTiepolo, Maurizio, Maurizio Rosso, Giovanni Massazza, Elena Belcore, Souradji Issa, and Sarah Braccio. 2019. "Flood Assessment for Risk-Informed Planning along the Sirba River, Niger" Sustainability 11, no. 15: 4003. https://doi.org/10.3390/su11154003
Note that from the first issue of 2016, this journal uses article numbers instead of page numbers. See further details here.