Sustainability Matters: Consumer Acceptance of Different Vertical Farming Systems

Department of Agricultural Economics and Rural Development, University of Goettingen, Marketing of Food and Agricultural Products, 37073 Göttingen, Germany
*
Author to whom correspondence should be addressed.
Sustainability 2019, 11(15), 4052; https://doi.org/10.3390/su11154052
Submission received: 24 June 2019
/
Revised: 18 July 2019
/
Accepted: 24 July 2019
/
Published: 26 July 2019
(This article belongs to the Special Issue Marketing of Sustainable Food and Drink)
Abstract
:Fresh produce within vertical farming systems grows vertically in different layers stacked atop each other, thus allowing for the efficient use of space. As the environment in vertical farming systems is completely controlled, neither sunlight nor soil is necessary. On the one hand, vertical farming may help to provide a healthy diet for the growing global population because it has a greater crop yield per square meter used than conventional farming; moreover, it can offer the opportunity to grow food in climatically disadvantaged areas. On the other hand, growth conditions may be perceived as unnatural and the entire vertical farming system as unsustainable. Therefore, understanding the consumers’ acceptance of vertical farming systems is important. This study is the first work to provide insights into consumers’ acceptance of three different vertical farming systems. Data are collected through an online survey of 482 consumers in Germany in February 2018. Drivers of consumer acceptance of vertical farming systems are identified through structural equation modelling. The results indicate that perceived sustainability is the major driver of consumer acceptance of vertical farming systems. The larger the system, the higher the likelihood that it will be considered as sustainable. Obviously, consumers perceive something like ecologies of scale.
1. Introduction
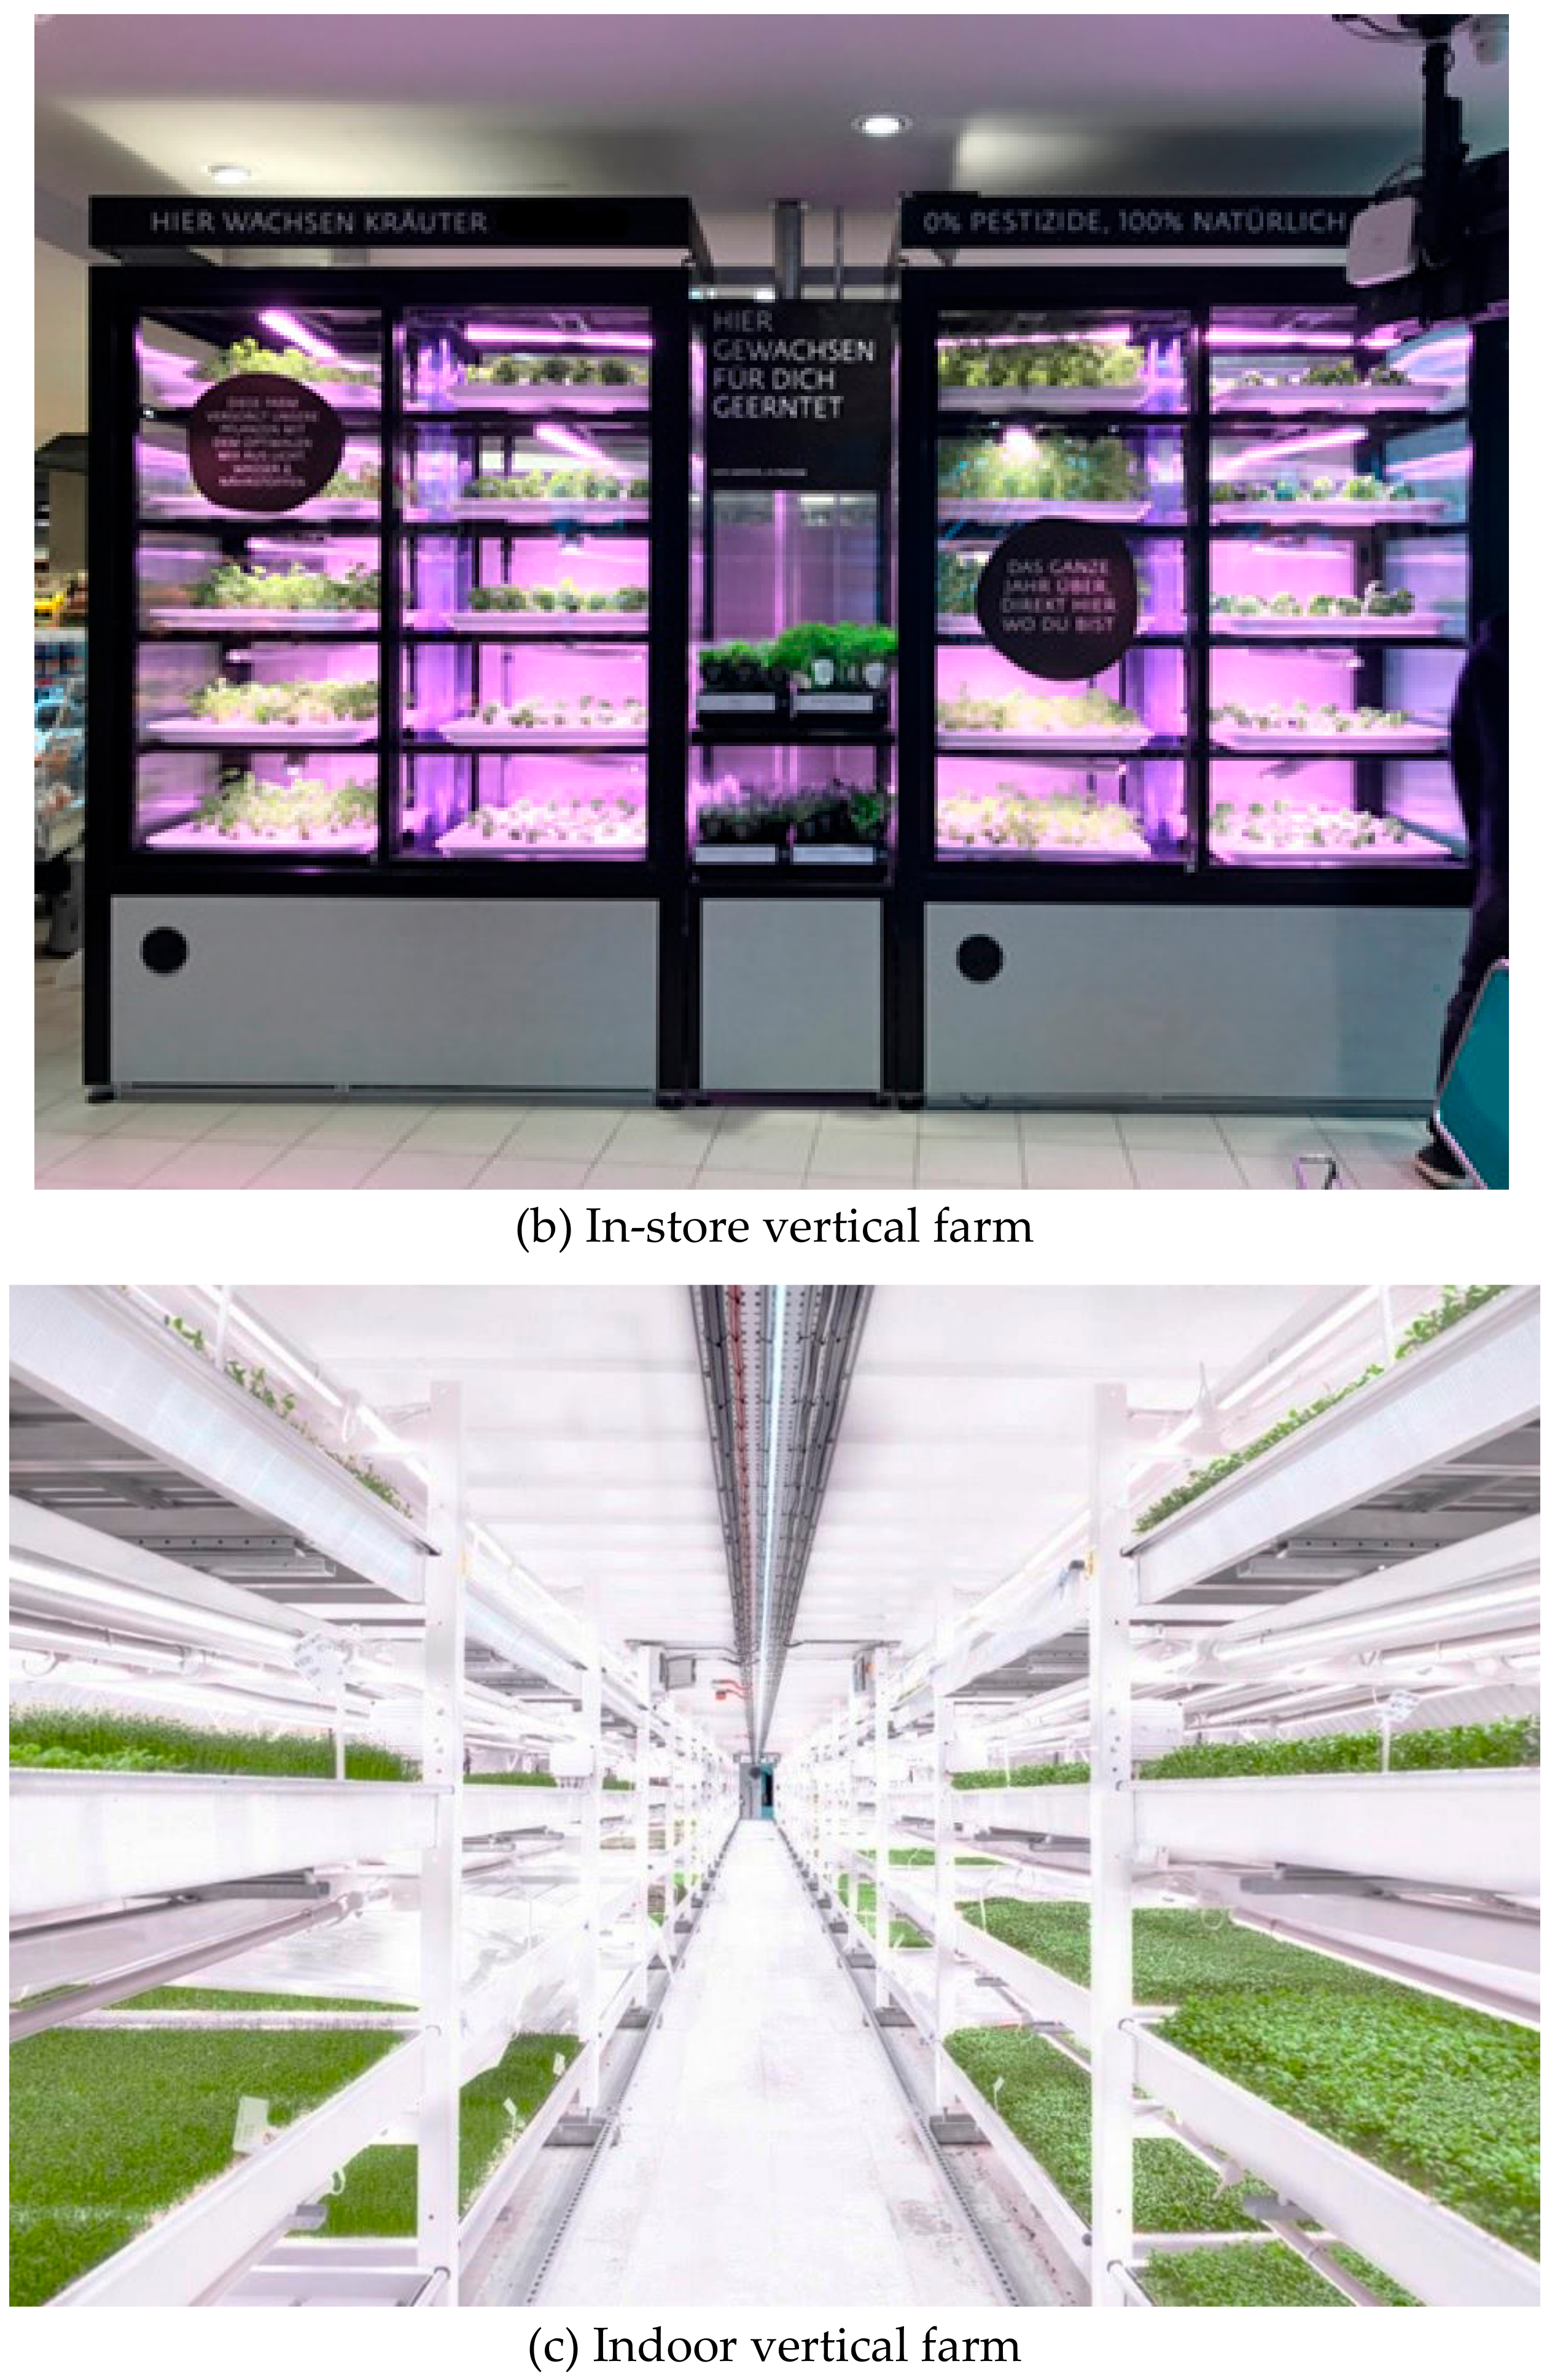
Urban agriculture has met growing interest in cities all over the world. Urban agriculture pertains to “an industry located within (intra-urban) or on the fringe (peri-urban) of a town, a city, or a metropolis, which grows or raises, processes and distributes a diversity of food and non-food products, (re-)using largely human and material resources, products and services largely to that urban area” [1] (p. 10). This definition covers a broad spectrum of inner-city growing systems. One of these systems is vertical farming, which refers to “a system of commercial farming whereby plants, animals, fungi and other life forms are cultivated for food, fuel, fiber or other products or services by artificially stacking them vertically above each other” [2] (p. 42). By this definition, vertical farming holds a special position within the frame of urban agriculture. Although several solutions are available, including windows to use sunlight and soil as substrate, this study focuses on the vertical farming systems with a fully controlled environment. There are three vertical farming systems that are commonly used. All three systems can grow salads, microgreens, and herbs. Vertical home farms can be fully controlled by the consumer via smartphone in terms of produce, lighting, and nutrient supply. By contrast, the in-store vertical farm is a glass cube in grocery stores, where consumers can watch the growth process, see the produce, and put the produce in their shopping carts from a shelf next to the cubic system. Finally, the products of indoor vertical farms are only found yielded and packaged without any direct consumer contact with the system. The first one constitutes vertical home farms (Figure 1) that are marketed by companies such as Agrilution (Munich, Germany) [3], Fibonacci (Moscow, Russia) [4], and Urban Cultivator (Surrey, British Columbia) [5]. The second type of vertical farming system, in-store vertical farms, is marketed by companies such as Infarm (Berlin, Germany) [6] and Urban Cultivator (Surrey, British Columbia) [7]. The third type, indoor vertical farms, is marketed by AeroFarms (Newark, United States) [8], GrowUp Urban Farms (London, Great Britain) [9], and Plenty (San Francisco, United States) [10], among others.
Vertical farming has both advantages and disadvantages. One advantage is that neither soil nor sunlight is needed in vertical farming; thus, soil-borne pests and most abiotic stresses such as environmental effects resulting from weather conditions or day lengths do not interfere with the system [11,12]. Vertical farms preferably use LED lights because their spectral range matches the needs of plants; furthermore, LED lights are long-lasting and cost and energy efficient. The climate inside the vertical farm is controlled. Plants may be grown and harvested all year round. As the layers inside the farm are stacked atop each other, the yield per unit (m²) is significantly higher than in traditional farming [13]. Another advantage is the opportunity to feed the growing urban population [14,15] as the world’s population in 2050 is predicted to reach 9 billion, 80% of which is expected to live in the cities [16]. Moreover, in contrast to traditional farming, vertical farming does not require a high amount of fuel for carrying out agricultural activities such as plowing and seeding. A disadvantage is thermal management because the semi-conductor junction temperature in LEDs is critical to the LED lifetime [2]. Another disadvantage is CO2 management, which must be controlled in the dense vertical farms with stacked floors [2,11]. In nature, light, carbon dioxide, and water are freely available, whereas these factors create additional costs in vertical farms [2]. Another drawback is the narrow range of suitable plants that must meet certain criteria (i.e., a height of 30 cm or less to fit into a system with vertical distances of 40–50 cm), tolerate dense growing conditions and low light intensity, grow in 10–30 days until harvest, and satisfy the saleable fresh weight (i.e., about 85% of the total weight, including roots) [12]. A critical point in assessing the advantages and disadvantages of vertical farming is the fact that hydroponic systems do not require sunlight and soil, which may have an impact on their nutritional quality. A review by Treftz et al. [17] summarizes the current mixed results about nutritional comparisons between hydroponic- and soil-grown fruits and vegetables. On the one hand, studies have shown that plants or their products from conventional agriculture contain better nutrients quality [17]. On the other hand, there is research which indicate better nutrient quality for hydroponic agriculture [17]. Third, there are studies which do not show any difference in the nutrient quality between the two growing systems [17].
The results of a life cycle assessment (LCA) indicate that the carbon footprint of vertically grown lettuce is five times higher in summer than that of lettuce grown on a conventional open field and in winter the carbon footprint is two times greater than that from conventionally grown field lettuce [15]. Drawing conclusions from the comparison of open field and vertical farming is difficult because their production methods considerably differ. For a better evaluation of the sustainability of vertical farming, a comparison with heated greenhouse production is necessary as this method is closest to the production conditions of vertical farming. Studies that include the LCA of both systems are scarce.
The results of consumer research reveal that local food production, naturalness, ethics, and environmental concerns are important aspects when purchasing food [18,19,20]. Aprile [21] reports that 95% of the respondents make an extra effort to purchase locally produced food. Furthermore, consumers recognize naturalness, safety, and absence of pesticides as more important drivers of their locally produced food choices than traditional production methods. Consumers generally have concerns about ethics and environmental issues, and these concerns have to be considered in the development of innovations for the food market [18]. Urban agriculture seems to be a valuable source for fresh produce as the demand for locally grown food continuously grows [19,20]. Moreover, knowledge and nutritional awareness can play a crucial role in the acceptance of food products as demonstrated in the consumption and success of functional foods [22] and artificial food additives [23] and the acceptance of irradiated food [24] and novel non-animal and animal products [25]. Subjective knowledge is more important than the objective knowledge in terms of decisions in environmentally sustainable food choices [26].
Previous research has focused on the social effects, economic and ecological parameters, and processes of vertical farming systems [2,12,27,28,29]. Furthermore, research on the acceptance of different types of urban agriculture such as public greenspaces, rooftop gardens, and vertical farming has addressed the interests of shareholders or stakeholders, including consumers, politicians, and urban planning departments [30,31,32]. The main preferences for the acceptance of urban food production are organic production, high quality, and regionality [29].
To the best of the authors’ knowledge, research about consumer acceptance of different vertical farming systems is lacking. However, one study examined the city inhabitants’ acceptance of different forms of urban agriculture, including vertical farming [33]. Its major finding was that urban agriculture projects focusing on a combination of commercial, ecological, and social goals are more likely to achieve a higher acceptance than technology-intensive projects that are merely sales driven [33]. Meanwhile, 65% of the participants rejected agriculture in multi-story buildings, aquaponic farms, and agroparks. Rooftop gardens are highly appreciated because they are unused landscape in the city and are lacking in competition over urban land use. The same point can be applied to one of the vertical farms included in this study; vertical farms in the western world are often found in old factory buildings or abandoned urban spaces, which are renovated, modernized, and used to supply food to local consumers, schools, restaurants, or hospitals [2,15].
In an experimental auction including lettuce produced in three different farming systems (vertical farm, greenhouse, and field farm), Bradford and Brenna [34] found that lettuce grown in a vertical farm is perceived as less natural and less likely to be purchased than lettuce from other production systems.
The aim of the current study is to measure the main driving forces for the acceptance of three different vertical farming systems and behavioral intention to buy the products or the system itself. This subject is important because vertical farming is viewed as a means of feeding the growing population and producing food in climatically disadvantageous regions. The comparison of the three systems determines whether they are perceived differently.
The three systems were selected because they are representative of the smallest (i.e., vertical home farms) and the largest system (i.e., indoor vertical farms) used for vertical farming in a fully controlled environment. Moreover, the in-store vertical farm was selected because of its diverse purposes compared to the other two systems, such as installation in grocery stores or restaurants. This selection of systems enables the researchers to investigate whether the decisions and attitudes of consumers change depending on the type of vertical farming system. The three different systems are depicted in Figure 1.
After the introduction, the conceptual framework of the included research model is described, followed by a material and method section where the study design and data analysis is explained. The result section gives a brief overview of some descriptive results and includes the partial least square model. Lastly, the results are interpreted in the discussion and conclusion section.
2. Conceptual Framework
To evaluate the acceptance of vertical farming systems, an extended technology acceptance model is used in this research based on the technology acceptance model (TAM) [35] and the theory of planned behavior [36]. Both TAM and theory of planned behavior are based on the theory of reasoned action [37].
For Davis [35] and Davis et al. [38], the fundamental determinants of consumer acceptance of technology innovations are perceived usefulness and perceived ease of use, which measure the attitude toward usage; attitude toward usage in turn measures the behavioral intention to use together with the perceived usefulness. The actual system utilization measures the behavioral intention to use the system.
The theory of reasoned action focuses on the prediction of behavior, and it is based on the attitude toward behavior and the subjective norm; additionally, it is extended by the determinant of perceived behavioral control by the theory of planned behavior [36,39].
The technology acceptance model was established to measure the acceptance of information technologies through validated determinants that are especially related to information technology; it is widely applied to assess usage and acceptance. The theories of reasoned action and planned behavior originate from social psychology, and they are designed to appraise human behavior [39]. However, both models are used in other sectors; various studies have investigated agricultural and food topics using the model that was largely extended or shaped to fit the research objective [40,41,42,43,44,45].
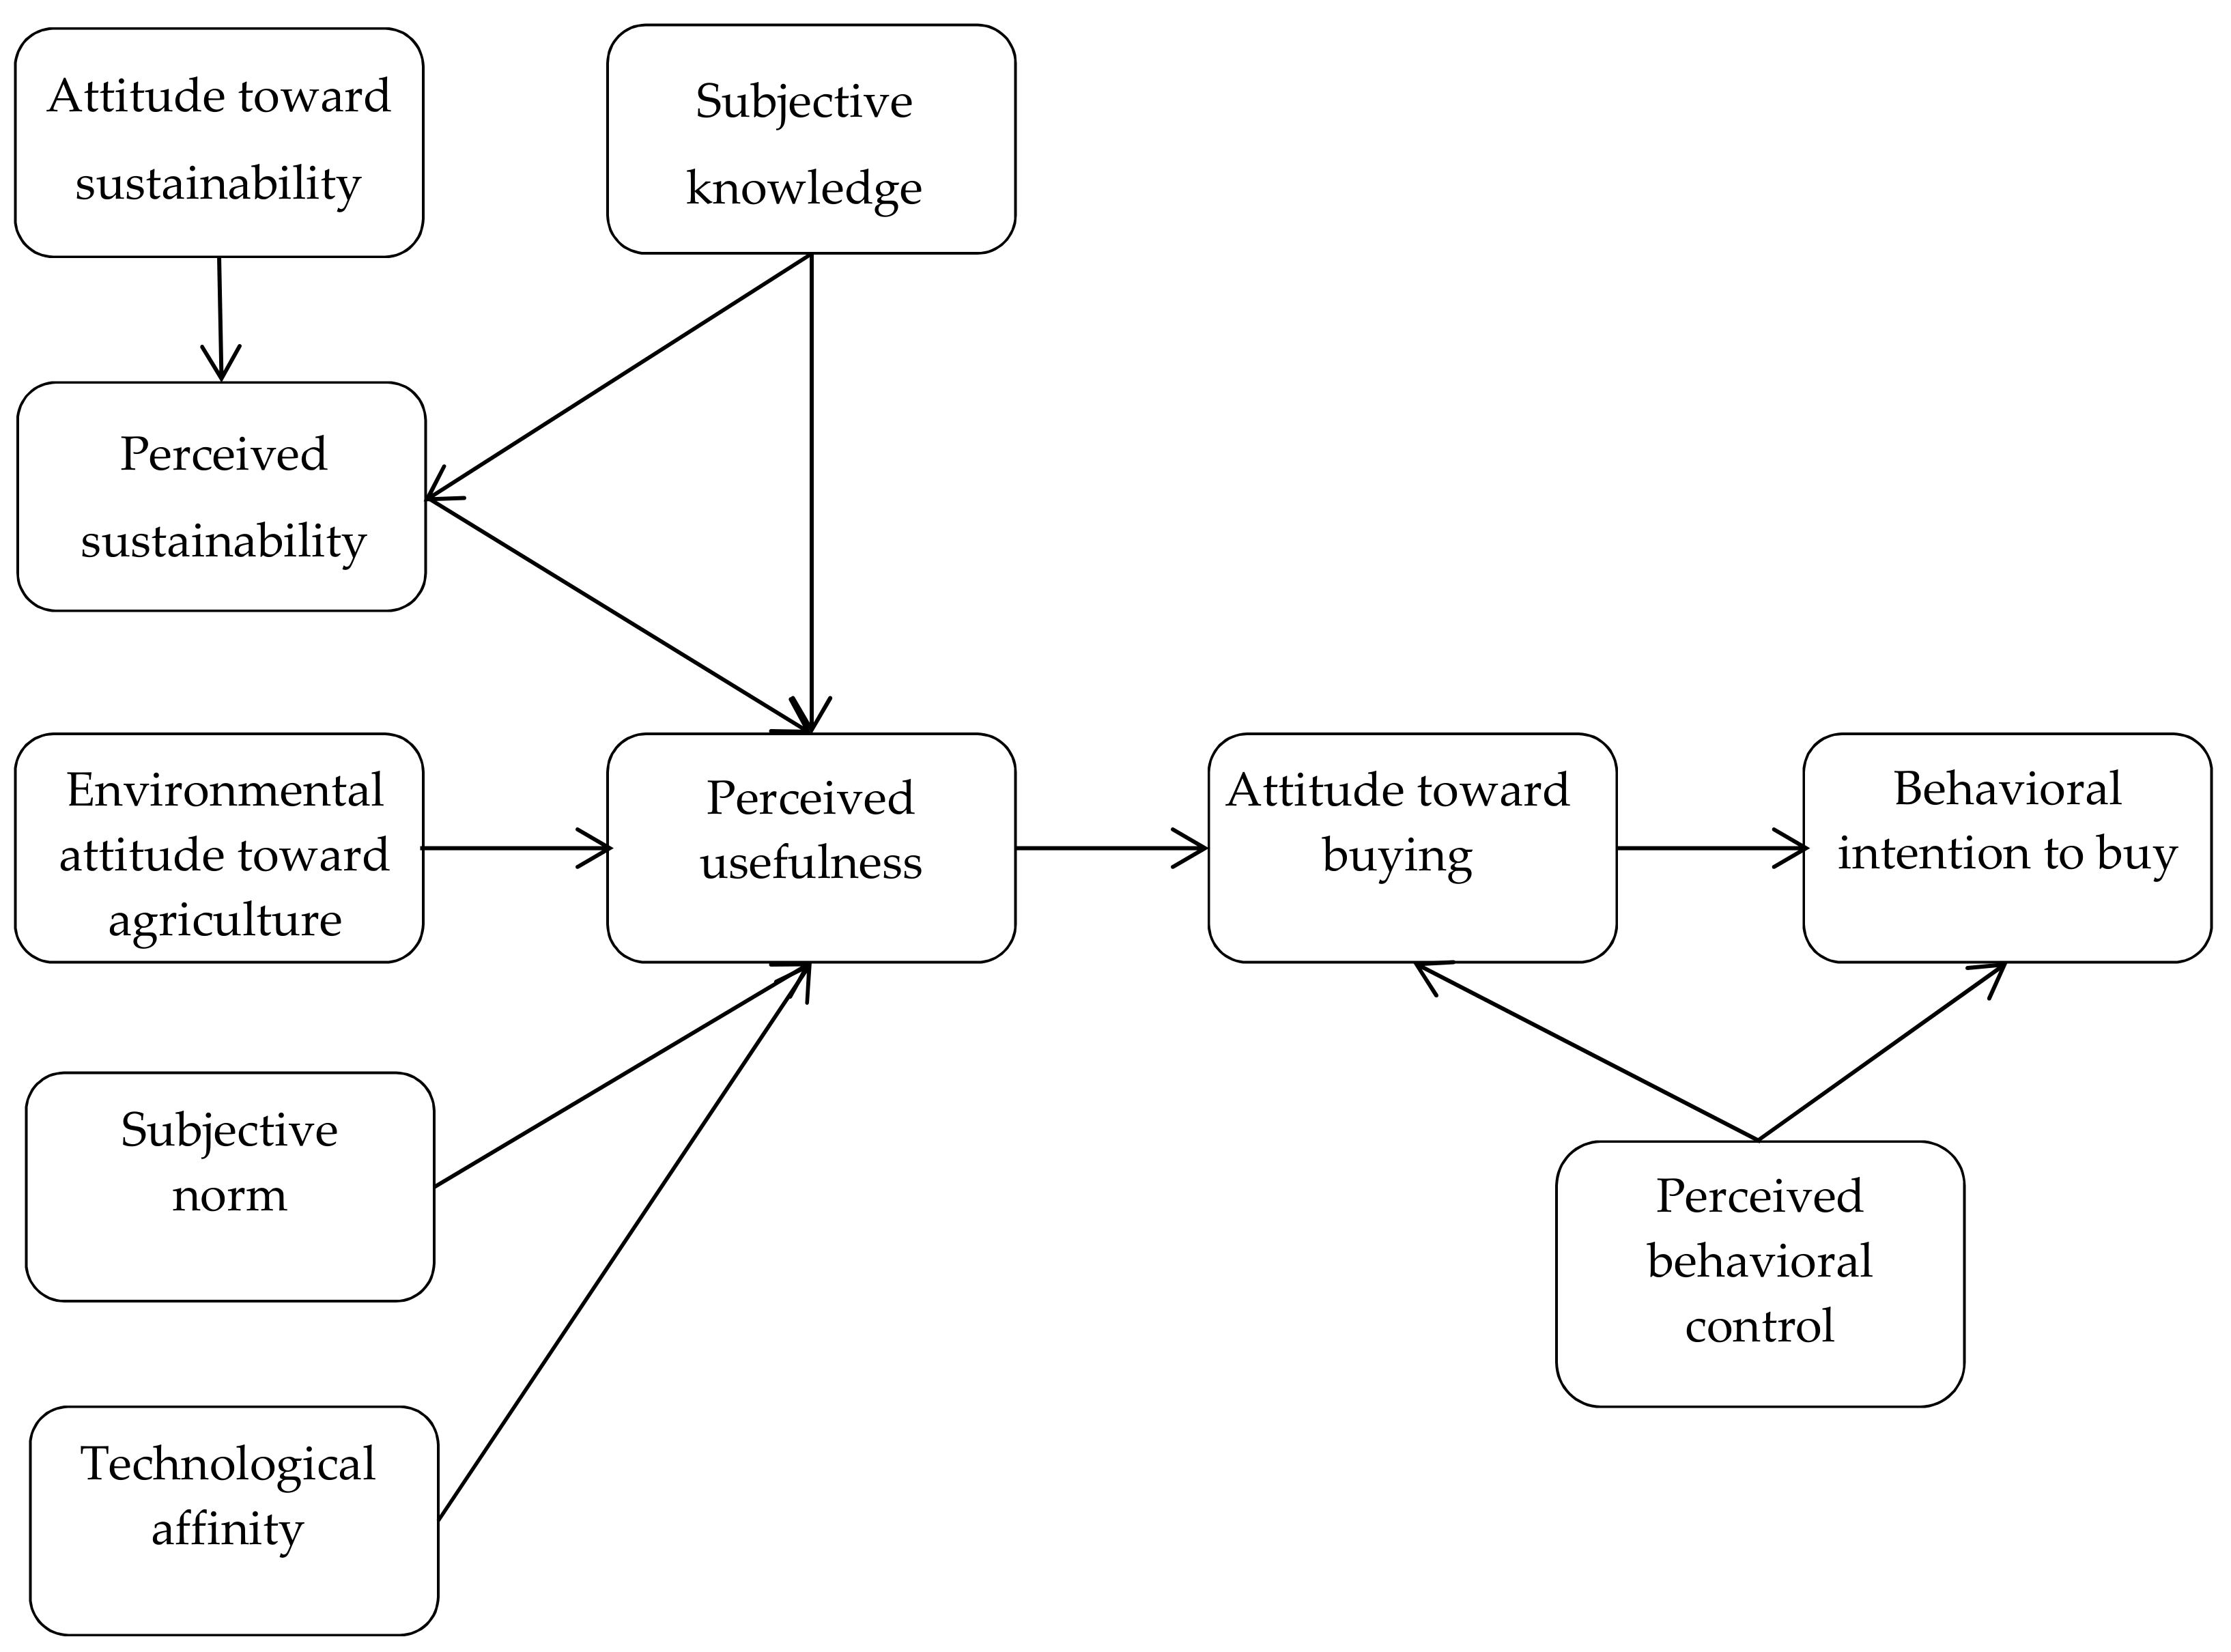
The underlying theories and studies lead to the development of an extended and customized TAM to measure the acceptance of the three different vertical farming systems (Figure 1). As no experience with the systems and products is expected, the perceived ease of use and the actual system usage are removed from the model.
In the final model, the attitude toward sustainability refers to perceived sustainability and subjective knowledge. The attitude toward sustainability is included in the model because these systems are regularly marketed as sustainable forms of agriculture. Moreover, the consumers’ subjective knowledge may influence the perceived usefulness.
The other variables that refer to perceived usefulness are perceived sustainability, environmental attitude toward agriculture, subjective norm, and the technology affinity. Measured by these variables, perceived usefulness is connected to the attitude toward buying, which finally engenders the behavioral intention to buy. As proposed in the theory of planned behavior, perceived behavioral control pertains to the attitude toward buying and the behavioral intention to buy [36]. All the explained relationships of the final model are presented in Figure 2.
3. Materials and Methods
3.1. Data Collection and Survey Design
In February 2018, a comprehensive survey among the German population was conducted using an online questionnaire through a professional online-access panel provider. Quotas were set for gender, age, and education to mirror the German population in terms of these characteristics. Some respondents had to be eliminated to ensure validity. Respondents who answered the questionnaire in less than a third of the average time (14 interviewees), straight-liners who answered in a certain pattern (6 interviewees), and participants who had numerous missing values (3 interviewees) were removed from the sample. In the end, a sample of 482 of the original 505 collected interviewees remained for the data analysis.
The survey started with socio-demographic questions and knowledge of and general attitudes toward agriculture and food. The current knowledge of and general attitudes toward agriculture and food statements were evaluated on a five-point Likert scale ranging from 1 (“I totally agree”) to 5 (“I do not agree at all”). A between-subjects design was subsequently applied.
The three vertical farming systems ranging from a small refrigerator-sized device for consumers at home (vertical home farms) to a middle-sized cube construction placed in grocery stores (in-store vertical farm) and an industry-sized vertical farm in an abandoned facility named indoor vertical farms, are visualized in Figure 1. The respondents were randomly allocated to one of the three systems, and they had to rate their opinion on several statements about the systems (split sample design). Each group obtained a brief, similar, and objective description of vertical farming and its advantages and disadvantages (Appendix A), as well as an adjusted text about the characteristics of the system to which they had been designated (Appendix B).
Vertical farming-specific statements (Table 4) followed these introductory texts of the three systems. To build the TAM constructs, the respondents had to evaluate statements on a five-point Likert scale ranging from 1 (“I totally agree”) to 5 (“I do not agree at all”), with one distinct variable (“I have already dealt with vertical farming”) consisting of three options (Yes/No/I don’t know) for the construct of subjective knowledge. Furthermore, four statements about the perceived sustainability had to be answered on a five-point semantic differential. All the statements were presented in a randomized order to avoid order effects. These statements built the foundation for the partial least-squares analysis.
3.2. Data Analysis
Data analysis was performed using the statistical software IBM SPSS 24/25 and SmartPLS 3. The partial least-squares analysis offers the possibility of an explorative evaluation of the collected data to identify connections and patterns in a structural equation modeling [46]. A total of ten constructs comprising reflective indicators were built. The indicators were evaluated through the underlying construct and expected to demonstrate a high correlation. Therefore, the elimination of one indicator will not produce significant changes in their loadings [46]. The indicators measured with loadings below 0.40 were eliminated from the model. Indicators with loadings between 0.40 and 0.70 should only be used if their elimination causes excessively high composite reliabilities [47]. In this study, three different systems and therefore groups and models were measured. This step prompted the decision to keep some indicators with loadings between 0.40 and 0.70, if the indicators displayed loadings above 0.70 in one of the other models. Otherwise, the technique proposed by Hair [46] was applied. The indicator loadings constituted the first part for testing the convergence validity, whereas the other part represented the average variance extracted. This criterion was used to verify the convergence validity of the model on the construct level, and the convergence validity should have a value of >0.50 to explain half of the variance of the construct’s indicators [46]. After building the path model (Figure 2), the calculations were performed with the partial least-squares method. As all the constructs were reflective measurement models, the evaluation of internal consistency reliability and convergence validity was necessary. Cronbach’s alpha is traditionally used for analyzing the internal consistency reliability. Composite reliability should also be considered; values above 0.60 for both measures are viewed as acceptable [46]. To test if discriminant validity between the constructs was given, the Fornell–Larcker criterion was analyzed to determine the need to apply any changes in the conceptual framework.
Furthermore, R² values as coefficients of determination of the dependent variables were measured along with the path coefficients of every relation between two constructs. The R² values indicate the effects of all the exogenous latent variables on the endogenous latent variables and represent the explained variance. Values >0.25 are considered as weak, >0.50 as moderate, and >0.75 as substantial [47]. The path coefficients p-values were subsequently measured via bootstrapping with 5000 subsamples with a significance level of 0.05. Additionally, the f²-effect sizes, which explained the relative effect of the exogenous constructs on the endogenous constructs, were validated with the bootstrapping method and the resulting p-values [46]. For the validation of the difference of the path coefficients between the three systems, a pairwise multi-group analysis including 5000 subsamples was applied.
4. Results
The sample consisted of 482 German citizens. The sample distribution of the quota parameters gender, age, and education worked in a way that mimicked the German population. For further validation and control, the size of the community, number of persons per household, and the net household income were evaluated and compared to the German population. The results revealed that the German population was well represented not only for the quota setting but also for additional properties. The characteristics of the sample are summarized in Table 1.
4.1. Descriptive Statistics
The descriptive statistics indicated that 76.8% of the respondents have never heard of vertical farming, whereas only 13.3% have. The remaining 5.8% are unsure if they have heard about vertical farming. Up to 80.7% of the respondents considered environmental friendliness as an important aspect of vertical farming. Meanwhile, 6.7% of the respondents have prior knowledge about vertical farming. Additionally, 61.3% of the respondents expressed skepticism toward the three systems’ decreased use of fertilizer. Up to 90.4% of the respondents perceived the three systems’ reduced usage of pesticide as beneficial for the environment. The results are presented in Table 2.
The between-subjects design resulted into three groups of n = 146 for the vertical home farm, n = 151 for the in-store vertical farm, and n=185 for the indoor vertical farm. Moreover, 49.0% and 50.3% of the respondents said that they will buy the respective products of the in-store vertical farm and the indoor vertical farm because of their features, but only 28.8% of the respondents claimed that they will purchase the vertical home farm for this reason. Furthermore, 25.3% of the respondents perceived the production technique of the vertical home farm as too artificial, whereas 37.7% and 31.5% of the respective consumers of in-store vertical farm and indoor vertical farm viewed the production technique as too artificial.
If the respondents had a possibility of buying a farming system, 28.8% indicated that they will purchase the vertical home farm. Meanwhile, 55.6% of the respondents said that they will purchase the products from the in-store vertical farm, whereas 46.7% stated that they will buy the products from the indoor vertical farm. The results are presented in Table 3.
The results of the perceived sustainability generally reveal a relatively positive outcome. Overall, it can be seen that the vertical-home farm has the lowest approvals. Furthermore, the results of the semantic differentials (perceived sustainability) imply that the vertical home farm differ significantly in their sustainability evaluation toward the in-store vertical farm and the indoor vertical farm.
The vertical home farm achieves the most positive value for all the items compared to the in-store vertical farm and the indoor vertical farm, signifying that it is viewed as more environmentally unfriendly than the other systems (as higher numbers show negative answers). Additionally, the vertical home farm is regarded as the most questionable among the systems and the indoor vertical farm as the most trendsetting one. As mentioned in the introduction, the vertical home farm was chosen because it is the smallest system while the indoor vertical farm is the largest system. The in-store vertical farm represents systems in between. Therefore, it can be noted that some results indicate that the larger the system, the more positive the assessment of the systems is. The indoor vertical farm has the highest values for a sustainable production of food products. Consumers also perceive that the indoor vertical farm contributes more to regional food production than the in-store vertical farm and the vertical home farm. The results of the ANOVA analysis and the respective post-hoc tests generally indicate that consumers judge the vertical home farm to be different from in-store vertical farm and indoor vertical farm; on the contrary, consumers state that in-store vertical farm and indoor vertical farm do not differ. The results are displayed in Table 4.
4.2. Structural Equation Model
First, the model was evaluated based on the quality criteria, and the relevant key indicators were then analyzed. Reliability measures such as composite reliability demonstrate very good values; moreover, the few lower Cronbach’s alpha coefficients presented in Table 5 are appropriate as literature states that values above 0.5 are valid if the statements fits together in a meaningful way [50]. The convergence validity, represented by the average variance extracted (AVE), is above the minimum value of 0.50 and can be considered as sufficient for all the constructs and all the systems. These results (Table 5) indicate the strength of the constructs and the variables upon which they rely.
The Fornell–Larcker criterion demonstrated that discriminant validity was given throughout the constructs; therefore, no changes in the allocation or elimination of the variables had to be undertaken.
The R² values and the underlying path coefficients were investigated after the validation of the model. The R² values of the perceived sustainability were extremely low for all three systems and significantly (p < 0.01) negatively influenced by the exogenous latent variable of subjective knowledge for the in-store vertical farm. For the vertical home farm, the path coefficient was significantly (p < 0.05) positive. The path coefficient of subjective knowledge on perceived usefulness was non-significant. Environmental attitude toward agriculture revealed non-significant path coefficients for all three systems leading to perceived usefulness. The subjective norm denoted significance (p < 0.05) for the vertical home farm, significance (p < 0.01) for the in-store vertical farm, and high significance (p < 0.001) for the indoor vertical farm. Technology affinity indicated significance (p < 0.01) only for the indoor vertical farm. All the other constructs lacked a significant influence on the R² value of perceived usefulness. The R² values for the endogenous latent variable of perceived usefulness were moderate for the vertical home farm (0.604) and the indoor vertical farm (0.590); by contrast, the value for the in-store vertical farm was lower (0.487), suggesting a weak classification [47]. The path coefficients leading to perceived usefulness revealed that perceived sustainability had the highest positive influence on a highly significant level (p < 0.001) for all three systems. Perceived behavioral control had a non-significant influence on the attitude toward buying, whereas it had a significant (p < 0.05) influence on the behavioral intention to buy for the vertical home farm. However, the explained variance of the attitude toward buying was on a high level for the vertical home farm (0.689), the in-store vertical farm (0.702), and the indoor vertical farm (0.683). Finally, the R² values for the behavioral intention to buy were on a high level for the vertical home farm (0.741), the in-store vertical farm (0.700), and the indoor vertical farm (0.652); meanwhile, the driver of these values was the attitude toward buying, with overall highly significant values (p < 0.001). The results are summarized in Table 6.
The f²-effect sizes indicated that the main path toward the behavioral intention to buy originated at the construct of perceived sustainability. The f²-effect sizes revealed that the main path (perceived sustainability → perceived usefulness → attitude toward buying → behavioral intention to buy) originated at the perceived sustainability and continued to the behavioral intention to buy. This path resulted in high effect sizes (f2), as visualized in Figure 3.
The R2 values indicated that the different constructs contributed to the explanation of the final construct of the path model. As an example, the R2 values for the vertical home farm are as follows: perceived sustainability, 0.050; perceived usefulness, 0.604; attitude toward buying, 0.689; and behavioral intention to buy, 0.741. All the R² values are included in Table 6.
The pairwise multi-group analysis tests whether the path coefficients of the different models are significantly different from each other. In this study, three systems were included and therefore three pairwise multi-group analyses were performed. The results suggested that the path coefficients (perceived sustainability → perceived usefulness) of the vertical home farm and the in-store vertical farm as well as the in-store vertical farm and the indoor vertical farm significantly differed. All the results are provided in Table 7.
5. Discussion and Conclusions
This study is the first work that contributes to the literature by providing insights into consumer acceptance of three different vertical farming systems (see Figure 1). In the following, it will be discussed (based on the model, see Figure 2) which forces influence consumer acceptance of vertical farming systems.
The path analysis reveals that perceived sustainability is the main driver of the acceptance of vertical farming. The more positive the sustainability of the system is perceived, the higher the chance to perceive the entire system as useful and finally to purchase the product and accept this new and innovative technology in food production. The finding that sustainability influences consumers’ food choice is consistent with prior research [51,52,53,54] and indicative of the growing importance of environmentalists in the debate on agricultural systems [54].
The individual constructs of the model affect the purchase decision. The construct of attitude toward sustainability has a slight influence on the consumers’ perceived sustainability of vertical farming systems. This construct contains statements about a healthy diet, environmental friendliness, and combating hunger. The results indicate that these three topics are rated as important. Earlier research showed that a healthy diet [55] is increasingly important to consumers. Worldwide, there is a youth movement called "Fridays for Future" who protest every Friday for the climate and urge policymakers to take climate policy action [56]. This development shows that environmental friendliness is gaining relevance not only in research, but also among the population.
Most consumers did not know vertical farming before participating in the survey. Consequently, subjective knowledge explains only to a small extent the perceived sustainability of vertical farming systems (vertical home farm and in-store vertical farm). It might change to a higher influence once consumers have more knowledge about and greater awareness of vertical farming. The influence of subjective knowledge is positive for the vertical home farm but negative for the in-store vertical farm. The variance in influence might be explained by the fact that consumers who lack knowledge about the in-store vertical farm regard it as sustainable. However, consumers who have already seen the in-store vertical farm (e.g., in the supermarket) may consider it as unsustainable. Thus, subjective knowledge has no significant influence on perceived usefulness for the three different systems.
Sustainability has become critically important in recent years in many research areas such as food production [54] and nutrition [53,57]. Despite the little knowledge about vertical farming, the majority rates the systems as environmentally friendly, which is one statement of the perceived sustainability construct. Although environmental friendliness is a well-known topic, consumers are not always aware that their own eating behavior has an impact on the environment [58,59,60]. Consumers who are aware of this fact try to be more environmentally conscious and consequently might consider vertical farming products in their food choices.
The comparison of the three vertical farming systems suggests that the larger the system, the more value toward sustainability is perceived by the consumers. As the main path of the model originates at the perceived sustainability, perceived sustainability can be viewed as a main reason for consumer acceptance. One assumption is that consumers believe that the system size has an influence on the perceived sustainability. Consumers may think that the yield in larger systems is higher and therefore the electricity usage is lower per product unit. This study is the first work to demonstrate this type of outcome for vertical farming, and it concurs with the suggestion to promote vertical farming systems by focusing on their sustainability [61]. This phenomenon that the size influences the sustainability is called ecologies of scale. Ecologies of scale contain the same basic idea as for economies of scale. In our case, perceived ecologies of scale denote that the size of a business has an impact on the assessment of sustainability [61]. Overall, vertical farming can be a production technique that particularly appeals to sustainability-oriented consumers.
Surprisingly, the environmental attitude toward agriculture does not influence the perceived usefulness, although the participants rated fertilizer use in conventional farming systems as excessively high [62,63]. This result might present an opportunity for vertical farming systems, as fertilizer does not contaminate the soil in the systems’ controlled environment. Additionally, consumers will appreciate a change in agriculture. Consumers may not realize vertical farming as an alternative to traditional agriculture and therefore it does not influence the perceived usefulness. The types of fresh produce that can be cultivated in vertical farming systems are quite limited compared to the wider variety of fresh produce that can be grown in conventional agricultural systems [64].
The perception of one’s own peer group (subjective norm) in relation to the purchase of vertical farming products slightly influences the perceived usefulness. There are differences according to the ANOVA results (Table 4) in approval of the vertical home farm by the social environment compared to the other systems (in-store vertical farm and indoor vertical farm). The differences can be because of the fact that the vertical home farm includes the entire cubic system and not only the fresh produce as it is the case with the in-store vertical farm and indoor vertical farm. One explanation will be that consumers believe that the vertical home farm is linked to an alternative lifestyle, and they do not want this association. When buying products from vertical farming systems, this alternative lifestyle is not visible to one’s own peer group.
Vertical farming as a new growing method causes some uncertainties that may differ in consumers with high and low affinities toward new food technologies or with different levels of knowledge about the systems. Technology affinity has an influence only on the perceived usefulness for the indoor vertical farm. The less positive assessment of the vertical home farm and the in-store vertical farm could have arisen from a lack of knowledge about the function and advantages of the respective systems. The two systems can be observed by the consumer, whereas the abandoned facility of the indoor vertical farm cannot be visited. Additionally, the fresh produce of the indoor vertical farm are sold in similar packaging as conventionally grown fresh produce in grocery stores. Therefore, consumers might not realize that they purchase fresh produce grown in a vertical farming system. A further explanation is that technological affinity only has an influence on the indoor vertical farm, since consumers will not regularly replace a vertical home farm with a follow-up model due to the high costs involved.
Perceived usefulness significantly affects the attitude toward buying. Consumers perceive vertical farming as a new technology for locally produced food. As demand for locally produced food is a rising trend [20], vertical farming can help to increase the quantity of locally produced food available because vertical farming systems are located within the city. Vertical farming production reduces food miles as well [65]. With regard to the different items of the construct of perceived usefulness, consumers only slightly believe that artificial lighting is too unnatural. One explanation for this result is that some consumers are familiar with LED lighting from horticulture (e.g., greenhouse production). Consumers are unsure in their judgement about the naturalness of the nutrient solution. Naturalness seems to be a critically important aspect in the perceived usefulness of the systems. The finding, that naturalness is an important aspect is in line with past research that clearly states that food naturalness influences consumers across the globe [66].
The attitude toward buying positively affects the behavioral intention to buy. Consumers weakly agree that vertical agriculture is not too artificial. Previous literature indicates that consumers prefer natural and traditionally produced food [67,68] and dislike additives that are perceived as too artificial [23]. Fresh products inside vertical farming systems grow without sunlight and on a non-soil substrate under adjusted environmental conditions [11]. These growing conditions may initially seem unnatural; however, the fact that the controlled environment inside the vertical farm uses neither herbicides nor pesticides should be considered. For this reason, fresh products grown in vertical farming systems do not come into contact with them and can fulfill the consumers’ need for naturally produced food. In a next step, an advisable approach will be the examination of how the sacrifice of herbicides and pesticides and thus the untreated growing condition is communicated to the consumer. The comparison of the systems reveals that the in-store and indoor vertical farm that are intended for industrial cultivation are evaluated to be the same, and these systems differ from the vertical home farm. In-store and indoor vertical farms are evaluated as slightly more positive than the vertical home farm. This result can be due to the absence of any perceived financial risk [69]—with these two systems, the fresh produce is purchased, whereas with the vertical home farm, the system itself is purchased. Another explanation is that with the vertical home farm the consumer has to actively grow and harvest the products himself whereas with the other two systems the consumer buys the products like other fresh produces during grocery shopping.
Perceived behavioral control does not have an impact on the attitude toward buying, but it does have a small influence on the behavioral intention to buy. The statements within the perceived behavioral control construct indicate an information overload [70], that is, consumers are sometimes so confused by an excessive amount of information that they are unable to process it. This fact can explain the higher positive effect size of the vertical home farm, as the consumer grows the fresh produce at home. Once consumers have purchased the vertical home farm, they are not exposed to further information (i.e., on the packaging of the product). Consumers only have to harvest the fresh produce and directly use it for cooking.
The final construct of the studied model is behavioral intention to buy. The results imply that consumers do not adopt extreme positions. The intention to buy the vertical home farm is significantly lower than the intention to buy the other two systems. Consumers are undecided on whether they will buy the products/system and whether they will recommend them to their social environment. One explanation for this case is that vertical farming is largely unknown and therefore no experience has been gained. Since consumers have no experience, they do not recommend vertical farming. Another attempt at explanation could be food neophobia [71], or the reluctance to eat or avoidance of new foods.
Overall, the results of the ANOVA analysis indicate that consumers recognize a difference between vertical home farm, in-store vertical farm, and indoor vertical farm, but they do not perceive a difference between in-store and indoor vertical farm. This result is expected because the products of those two vertical farming systems can be bought inside grocery stores, whereas the products of the vertical home farm are grown by consumers once they buy the vertical home farm.
The pairwise multi-group analysis denotes that depending on the vertical farming system, the influence of the constructs on the target variable differs.
Overall, the behavioral intention to buy products of vertical farming or a system itself depends to a great extent on the consumers’ perceived sustainability. The path analysis of the extended technology acceptance model reveals that the main path starts at the perceived sustainability through perceived usefulness, continues to the attitude toward buying, and finalizes in the behavioral intention to buy. Therefore, companies that market vertical farming systems are well advised to focus their communication strategy on sustainability aspects.
A possible limitation is the consumers’ lack of awareness of vertical farming systems and experience with these products. The authors presented detailed information about the three systems. However, attitudes may change when consumer set their own impressions. Additionally, consumers can purchase the vertical home farm itself, but they can only buy the fresh produce from in-store and indoor vertical farms. Therefore, one major difference regarding these three systems is the consumer involvement in the decision-making process. This factor may have biased the results.
Further research can analyze how attitudes and acceptance change over time in the case that vertical farming system will gain popularity. Another area of future research can be the investigation of the life cycle assessments of various vertical farming systems to determine any differences in their sustainability assessment. Evaluating the sustainability of vertical farming is generally difficult, especially for indoor vertical farming systems because they are mainly located within abandoned factory buildings. At each location, those buildings are different from each other—some may be small or large, whereas others may be shallow. The inner construction of the indoor vertical farming system consequently varies at each location.
Author Contributions
Conceptualization, K.J., A.H., and A.S.; data curation, K.J.; formal analysis, K.J. and A.H.; investigation, K.J. and A.H.; methodology, K.J. and A.S.; resources, K.J. and A.S.; software, K.J. and A.H.; supervision, A.S.; validation, K.J., A.H., and A.S.; writing—original draft, K.J. and A.H.; writing—review and editing, A.S.
Funding
The conduct of the project did not received external funding. For publication we acknowledge support by the German Research Foundation and the Open Access Publication Funds of University of Goettingen.
Conflicts of Interest
The authors declare no conflict of interest.
Appendix A
General Vertical Farming Description:
Original German text used in the survey:
Vertical Farming bedeutet für uns, dass Pflanzen auf mehreren Ebenen und ohne Tageslicht angebaut werden. Hierbei brauchen die Pflanzen keine Erde. Die Pflanzen werden mit Nährlösungen versorgt, die alle nötigen Nährstoffe enthalten. Die LED Beleuchtung wird auf die jeweiligen Pflanzen abgestimmt. So können stabile Erträge mit geringem Einsatz von Pflanzenschutzmitteln und Düngemitteln erzielt werden. Ebenso kann bis zu 95% Wasser gespart werden.
Translation of the German text:
For us, vertical farming means that plants are cultivated on several levels and without sunlight. The plants do not need soil. The plants are supplied with nutrient solutions that contain all the necessary nutrients. The LED lighting is adjusted to the respective plants. This enables stable yields to be achieved with low use of pesticides and fertilizers. Up to 95% water can also be saved.
Appendix B
Description of the Three Vertical Farming Systems:
Vertical-Home Farm:
Original German text used in the survey:
In diesem System können Sie zuhause Küchenkräuter und Salate anbauen. Per Handy-App können Sie die Temperatur, die Bewässerung und die Beleuchtung regeln. Es wird 98% weniger Wasser benötigt als in der herkömmlichen Produktion. Durch die individuelle LED-Beleuchtung kann das Pflanzenwachstum optimal unterstützt werden. Die App zeigt ihnen den Erntezeitpunkt der jeweiligen Pflanze an. Ebenfalls kann in der App neues Saatgut und Nährlösung bestellt werden. Für die Beleuchtung, Bewässerung und die Erzeugung des optimalen Klimas wird Energie verbraucht. Das Saatgut ist in eine Matte eingearbeitet, sodass Sie diese nur einlegen müssen. Die Pflanzen wachsen auf der Matte und werden über diese mit Nährstoffen versorgt. Es werden keine Pflanzenschutzmittel benötigt und es kann das ganze Jahr produziert werden.
Translation of the German text:
In this system you can grow kitchen herbs and salads at home. You can control the temperature, irrigation, and lighting via mobile phone app. It requires 98% less water than conventional production. The individual LED lighting can optimally support plant growth. The app shows you the harvest time of the respective plant. New seeds and nutrient solution can also be ordered in the app. Energy is consumed for lighting, irrigation, and creating the optimal climate. The seed is worked into a mat, so all you have to do is insert it. The plants grow on the mat and are supplied with nutrients via the mat. No pesticides are needed and it can be produced all year round.
In-Store Vertical Farm:
Original German text used in the survey:
In diesem System werden regional Küchenkräuter und Salate in transparenten, modular aufgebauten Systemen angebaut. Diese Systeme stehen zum Beispiel im Supermarkt, Krankenhaus oder Hotel. Das System benötigt wenig Platz. Es wird 90% weniger Wasser benötigt als in der herkömmlichen Produktion. Durch die individuelle LED-Beleuchtung kann das Pflanzenwachstum optimal unterstützt werden. Der Transportweg vom Erzeuger zum Supermarkt, Krankenhaus oder Hotel entfällt, deshalb sind die Transportwege sehr kurz und die Produktion umweltfreundlich. Für die Beleuchtung, Bewässerung und die Erzeugung des optimalen Klimas wird Energie verbraucht. Die Pflanze wächst in einem saugstarken Substrat aus Kokosfasern und die Wurzeln der Pflanzen hängen in einer Lösung die alle Nährstoffe enthält. Es werden keine Pflanzenschutzmittel benötigt und es kann das ganze Jahr produziert werden.
Translation of the German text:
In this system, regional kitchen herbs and salads are grown in transparent, modular systems. These systems can be found in supermarkets, hospitals, or hotels, for example. The system requires little space. It requires 90% less water compared to the conventional production system. The individual LED lighting can optimally support plant growth. The transport route from the producer to the supermarket, hospital, or hotel is no longer necessary, therefore the transport routes are very short and the production is environmentally friendly. Energy is consumed for lighting, irrigation, and creating the optimal climate. The plant grows in a highly absorbent substrate of coconut fibers and the roots of the plants hang in a solution containing all nutrients. No pesticides are needed and it can be produced all year round.
Indoor Vertical Farm:
Original German Text used in the survey:
In diesem System werden in leerstehenden Lagerhallen Küchenkräuter, Sprossen und Salate angebaut. Die Pflanzen wachsen in einer kontrollierten Umgebung. Es wird 70% weniger Wasser benötigt als in der herkömmlichen Produktion. Durch die individuelle LED-Beleuchtung kann das Pflanzenwachstum optimal unterstützt werden. Dadurch das die Erzeugung und der Verkauf in derselben Stadt liegen sind die Transportwege sehr kurz, und die Produktion umweltfreundlich. Für die Beleuchtung, Bewässerung und die Erzeugung des optimalen Klimas wird Energie verbraucht. Die Pflanze wächst in einem saugstarken Substrat (Kokosfasern oder Hanffasern) und die Wurzeln der Pflanzen hängen in einer Lösung die alle Nährstoffe enthält. Es werden keine Pflanzenschutzmittel benötigt und es kann das ganze Jahr produziert werden.
Translation of the German text:
In this system, kitchen herbs, sprouts, and salads are grown in empty warehouses. The plants grow in a controlled environment. It requires 70% less water compared to the conventional production system. The plant growth can be optimally supported by the individual LED lighting. Because the production and sale are located in the same city, the transport distances are very short and the production is environmentally friendly. Energy is used for lighting, irrigation, and creating the optimal climate. The plant grows on a highly absorbent substrate (coconut fibers or hemp fibers) and the roots of the plants hang in a solution containing all nutrients. No pesticides are needed and it can be produced all year round.
References
- Mougeot, L. Urban Agriculture: Definition, Presence, Potentials and Risks, and Policy Challenges; International Development Research Centre (IDRC): Ottawa, ON, Canada, 2000. [Google Scholar]
- Banerjee, C.; Adenaeuer, L. Up, up and away! The economics of vertical farming. J. Agric. Stud. 2014, 2, 40–60. [Google Scholar] [CrossRef]
- Agrilution. Plantcube. Available online: https://agrilution.de/products/plantcube-kaufen (accessed on 1 April 2019).
- Fibonacci. City Farms. Available online: http://home.fibonacci.farm/ (accessed on 1 April 2019).
- Urban Cultivator. Kitchen Cultivator 2019. Available online: http://www.urbancultivator.net/kitchen-cultivator/ (accessed on 29 March 2019).
- Infarm. Available online: https://infarm.com/grow/ (accessed on 1 April 2019).
- Urban Cultivator. Commercial Cultivator. Available online: http://www.urbancultivator.net/commercial-cultivator/ (accessed on 1 April 2019).
- AeroFarms. Our Farms. Available online: https://aerofarms.com/farms/ (accessed on 1 April 2019).
- GrowUp Urban Farms. Commercial-Scale Controlled Environment Production. Available online: https://www.growup.org.uk/about-us (accessed on 1 April 2019).
- Plenty. Available online: https://www.plenty.ag/ (accessed on 1 April 2019).
- Germer, J.; Sauerborn, J.; Asch, F.; de Boer, J.; Schreiber, J.; Weber, G.; Müller, J. Skyfarming an ecological innovation to enhance global food security. J. Consum. Prot. Food Saf. 2011, 6, 237–251. [Google Scholar] [CrossRef]
- Kozai, T.; Niu, G.; Takagaki, M. Plant Factory: An Indoor Vertical Farming System for Efficient Quality Food Production; Academic Press: Amsterdam, The Netherlands; Boston, MA, USA; Heidelberg, Germany, 2016. [Google Scholar]
- Kalantari, F.; Mohd Tahir, O.; Mahmoudi Lahijani, A.; Kalantari, S. A review of vertical farming technology: A guide for implementation of building integrated agriculture in Cities. Adv. Eng. Forum 2017, 24, 76–91. [Google Scholar] [CrossRef]
- Ackerman, K.; Conrad, M.; Culligan, P.; Plunz, R.; Sutto, M.-P.; Whittinghill, L. Sustainable food systems for future cities: The potential of urban agriculture. Econ. Soc. Rev. 2014, 45, 189–206. [Google Scholar]
- Despommier, D.D. The Vertical Farm: Feeding the World in the 21st Century, 1st ed.; Picador: New York, NY, USA, 2011. [Google Scholar]
- Al-Chalabi, M. Vertical farming: Skyscraper sustainability? Sustain. Cities Soc. 2015, 18, 74–77. [Google Scholar] [CrossRef]
- Treftz, C.; Omaye, S.T. Hydroponics: Potential for augmenting sustainable food production in non-arable regions. Nutr. Food Sci. 2016, 46, 672–684. [Google Scholar] [CrossRef]
- Grunert, K.G.; Jensen, B.; Sonne, A.; Brunsø, K.; Byrne, D.; Clausen, C.; Friis, A.; Holm, L.; Hyldig, G.; Kristensen, N.; et al. User-oriented innovation in the food sector: Relevant streams of research and an agenda for future work. Trends Food Sci. Technol. 2008, 19, 590–602. [Google Scholar] [CrossRef]
- Grebitus, C.; Lusk, J.L.; Nayga, R.M. Effect of distance of transportation on willingness to pay for food. Ecol. Econ. 2013, 88, 67–75. [Google Scholar] [CrossRef]
- Feldmann, C.; Hamm, U. Consumers’ perceptions and preferences for local food: A review. Food Qual. Prefer. 2015, 40, 152–164. [Google Scholar] [CrossRef]
- Aprile, M.C.; Caputo, V.; Nayga, R.M. Consumers’ preferences and attitudes toward local food products. J. Food Prod. Mark. 2016, 22, 19–42. [Google Scholar] [CrossRef]
- Hilliam, M. Functional foods: The western consumer viewpoint. Nutr. Rev. 1996, 54, S189–S194. [Google Scholar] [CrossRef] [PubMed]
- Bearth, A.; Cousin, M.-E.; Siegrist, M. The consumer’s perception of artificial food additives: Influences on acceptance, risk and benefit perceptions. Food Qual. Prefer. 2014, 38, 14–23. [Google Scholar] [CrossRef]
- Bruhn, C.M. Consumer acceptance of irradiated food: Theory and reality. Radiat. Phys. Chem. 1998, 52, 129–133. [Google Scholar] [CrossRef]
- Martins, Y.; Pliner, P. Human food choices: An examination of the factors underlying acceptance/rejection of novel and familiar animal and nonanimal foods. Appetite 2005, 45, 214–224. [Google Scholar] [CrossRef] [PubMed]
- Peschel, A.O.; Grebitus, C.; Steiner, B.; Veeman, M. How does consumer knowledge affect environmentally sustainable choices? Evidence from a cross-country latent class analysis of food labels. Appetite 2016, 106, 78–91. [Google Scholar] [CrossRef] [Green Version]
- Lin, B.B.; Philpott, S.M.; Jha, S. The future of urban agriculture and biodiversity-ecosystem services: Challenges and next steps. Basic Appl. Ecol. 2015, 16, 189–201. [Google Scholar] [CrossRef]
- Specht, K.; Siebert, R.; Hartmann, I.; Freisinger, U.B.; Sawicka, M.; Werner, A.; Thomaier, S.; Henckel, D.; Walk, H.; Dierich, A. Urban agriculture of the future: An overview of sustainability aspects of food production in and on buildings. Agric. Hum. Values 2014, 31, 33–51. [Google Scholar] [CrossRef]
- Specht, K.; Siebert, R.; Thomaier, S. Perception and acceptance of agricultural production in and on urban buildings (ZFarming): A qualitative study from Berlin, Germany. Agric. Hum. Values 2016, 33, 753–769. [Google Scholar] [CrossRef]
- Grebitus, C.; Printezis, I.; Printezis, A. Relationship between consumer behavior and success of urban agriculture. Ecol. Econ. 2017, 136, 189–200. [Google Scholar] [CrossRef]
- Sanyé-Mengual, E.; Anguelovski, I.; Oliver-Solà, J.; Montero, J.I.; Rieradevall, J. Resolving differing stakeholder perceptions of urban rooftop farming in Mediterranean cities: Promoting food production as a driver for innovative forms of urban agriculture. Agric. Hum. Values 2016, 33, 101–120. [Google Scholar] [CrossRef]
- Specht, K.; Siebert, R.; Thomaier, S.; Freisinger, U.; Sawicka, M.; Dierich, A.; Henckel, D.; Busse, M. Zero-Acreage Farming in the city of berlin: An aggregated stakeholder perspective on potential benefits and challenges. Sustainability 2015, 7, 4511–4523. [Google Scholar] [CrossRef]
- Specht, K.; Weith, T.; Swoboda, K.; Siebert, R. Socially acceptable urban agriculture businesses. Agron. Sustain. Dev. 2016, 36, 131. [Google Scholar] [CrossRef]
- Bradford, C.D.; Brenna, E. Will consumers find vertically farmed produce “out of reach”? Choices 2017, 32, 1–8. [Google Scholar]
- Davis, F.D. Perceived usefulness, perceived ease of use, and user acceptance of information technology. MIS Q. 1989, 13, 319. [Google Scholar] [CrossRef]
- Ajzen, I. From intentions to actions: A theory of planned behavior. In Action Control: From Cognition to Behavior, 1st ed.; Kuhl, J., Beckmann, J., Eds.; Springer: Berlin, Germany, 1985; pp. 11–39. [Google Scholar]
- Fishbein, M.; Ajzen, I. Belief, Attitude, Intention and Behavior: An Introduction to Theory and Research; Addison-Wesley: Boston, MA, USA, 1975. [Google Scholar]
- Davis, F.D.; Bagozzi, R.P.; Warshaw, P.R. User acceptance of computer technology: A comparison of two theoretical models. Manag. Sci. 1989, 35, 982–1003. [Google Scholar] [CrossRef]
- Venkatesh, V.; Morris, M.G.; Davis, G.B.; Davis, F.D. User acceptance of information technology: Toward a unified view. MIS Q. 2003, 27, 425. [Google Scholar] [CrossRef]
- Arvola, A.; Vassallo, M.; Dean, M.; Lampila, P.; Saba, A.; Lähteenmäki, L.; Shepherd, R. Predicting intentions to purchase organic food: The role of affective and moral attitudes in the theory of planned behaviour. Appetite 2008, 50, 443–454. [Google Scholar] [CrossRef] [PubMed]
- Flett, R.; Alpass, F.; Humphries, S.; Massey, C.; Morriss, S.; Long, N. Technology acceptance model and use of technology in New Zealand dairy farming. Agric. Syst. 2004, 80, 199–211. [Google Scholar] [CrossRef]
- Kassem, N.O.; Lee, J.W.; Modest, N.N.; Johnston, P.K. Understanding soft drink consumption among female adolescents using the theory of planned behavior. Health Educ. Res. 2003, 18, 278–291. [Google Scholar] [CrossRef]
- Kim, Y.G.; Woo, E. Consumer acceptance of a quick response (QR) code for the food traceability system: Application of an extended technology acceptance model (TAM). Food Res. Int. 2016, 85, 266–272. [Google Scholar] [CrossRef]
- Lautenschlager, L.; Smith, C. Understanding gardening and dietary habits among youth garden program participants using the Theory of Planned Behavior. Appetite 2007, 49, 122–130. [Google Scholar] [CrossRef] [PubMed]
- Voss, J.; Spiller, A.; Enneking, U. Zur Akzeptanz von gentechnisch verändertem Saatgut in der deutschen Landwirtschaft (The acceptance of genetically modified seeds in German agriculture). Agrarwirtschaft 2009, 58, 155–167. [Google Scholar]
- Hair, J.F.; Hult, G.T.M.; Ringle, C.M.; Sarstedt, M.; Richter, N.F.; Hauff, S. Partial Least Squares Strukturgleichungsmodellierung: Eine Anwendungsorientierte Einführung; Franz Vahlen: Munich, Germany, 2017. [Google Scholar]
- Hair, J.F.; Ringle, C.M.; Sarstedt, M. PLS-SEM: Indeed a silver bullet. J. Mark. Theory Pract. 2011, 19, 139–152. [Google Scholar] [CrossRef]
- Federal Statistical Office. Privathaushalte und Haushaltsmitglieder (Private Households and Household Members). Available online: https://www.destatis.de/DE/ZahlenFakten/GesellschaftStaat/Bevoelkerung/HaushalteFamilien/Tabellen/1_1_Privathaushalte_Haushaltsmitglieder.html (accessed on 5 June 2018).
- Federal Statistical Office. Statistical Yearbook. 2016. Available online: https://www.destatis.de/DE/Publikationen/StatistischesJahrbuch/StatistischesJahrbuch2016.pdf?__blob=publicationFile (accessed on 7 December 2017).
- Field, A. Discovering Statistics Using SPSS: (And Sex and Drugs and Rock ’n’ Roll), 3rd ed.; Sage: Los Angeles, CA, USA, 2011. [Google Scholar]
- Vecchio, R.; Annunziata, A. Willingness-to-pay for sustainability-labelled chocolate: An experimental auction approach. J. Clean. Prod. 2015, 86, 335–342. [Google Scholar] [CrossRef]
- Hüttel, A.; Ziesemer, F.; Peyer, M.; Balderjahn, I. To purchase or not? Why consumers make economically (non-)sustainable consumption choices. J. Clean. Prod. 2018, 174, 827–836. [Google Scholar] [CrossRef]
- Grunert, K.G.; Hieke, S.; Wills, J. Sustainability labels on food products: Consumer motivation, understanding and use. Food Policy 2014, 44, 177–189. [Google Scholar] [CrossRef] [Green Version]
- Grunert, K.G. Sustainablitity in the food sector: A consumer behaviour perspective. Int. J. Food Syst. Dyn. 2011, 2, 207–218. [Google Scholar]
- Willett, W.; Rockström, J.; Loken, B.; Springmann, M.; Lang, T.; Vermeulen, S.; Garnett, T.; Tilman, D.; DeClerck, F.; Wood, A.; et al. Food in the Anthropocene: The EAT–Lancet Commission on healthy diets from sustainable food systems. Lancet 2019, 393, 447–492. [Google Scholar] [CrossRef]
- The Lancet Planetary Health. Surging awareness. Lancet Planet. Health 2019, 3, e235. [Google Scholar] [CrossRef] [Green Version]
- Qaim, M. Globalisation of agrifood systems and sustainable nutrition. Proc. Nutr. Soc. 2017, 76, 12–21. [Google Scholar] [CrossRef]
- Macdiarmid, J.I.; Douglas, F.; Campbell, J. Eating like there’s no tomorrow: Public awareness of the environmental impact of food and reluctance to eat less meat as part of a sustainable diet. Appetite 2016, 96, 487–493. [Google Scholar] [CrossRef] [PubMed]
- Baroni, L.; Cenci, L.; Tettamanti, M.; Berati, M. Evaluating the environmental impact of various dietary patterns combined with different food production systems. Eur. J. Clin. Nutr. 2007, 61, 279–286. [Google Scholar] [CrossRef] [PubMed]
- Petruzzellis, L.; Winer, R.S. Rediscovering the Essentiality of Marketing: Proceedings of the 2015 Academy of Marketing Science (AMS) World Marketing Congress; Springer International Publishing: Cham, Switzerland, 2016. [Google Scholar]
- Schlich, E.H.; Fleissner, U. The ecology of scale: Assessment of regional energy turnover and comparison with global food. Int. J. Life Cycle Assess. 2005, 10, 219–223. [Google Scholar] [CrossRef]
- Rode, M.; Thiel, E.; Franko, U.; Wenk, G.; Hesser, F. Impact of selected agricultural management options on the reduction of nitrogen loads in three representative meso scale catchments in Central Germany. Sci. Total Environ. 2009, 407, 3459–3472. [Google Scholar] [CrossRef] [PubMed]
- Quan, Z.; Huang, B.; Lu, C.; Shi, Y.; Chen, X.; Zhang, H.; Fang, Y. The fate of fertilizer nitrogen in a high nitrate accumulated agricultural soil. Sci. Rep. 2016, 6, 21539. [Google Scholar] [CrossRef] [PubMed]
- Benke, K.; Tomkins, B. Future food-production systems: Vertical farming and controlled-environment agriculture. Sustain. Sci. Pract. Policy 2017, 13, 13–26. [Google Scholar] [CrossRef]
- Eigenbrod, C.; Gruda, N. Urban vegetable for food security in cities. A review. Agron. Sustain. Dev. 2015, 35, 483–498. [Google Scholar] [CrossRef]
- Román, S.; Sánchez-Siles, L.M.; Siegrist, M. The importance of food naturalness for consumers: Results of a systematic review. Trends Food Sci. Technol. 2017, 67, 44–57. [Google Scholar] [CrossRef]
- De Wilt, J.; Dobbelaar, T. Agroparks: The Concept, the Responses, the Practice; Innovation Network: Utrecht, The Netherlands, 2005. [Google Scholar]
- Sanyé-Mengual, E. Sustainability Assessment of Urban Rooftop Farming Using an Interdisciplinary Approach; Universitat Autònoma de Barcelona: Barcelona, Spain, 2015. [Google Scholar]
- Kaplan, L.B.; Szybillo, G.J.; Jacoby, J. Components of perceived risk in product purchase: A cross-validation. J. Appl. Psychol. 1974, 59, 287–291. [Google Scholar] [CrossRef]
- Jacoby, J. Perspectives on information overload. J. Consum. Res. 1984, 10, 432–435. [Google Scholar] [CrossRef]
- Pliner, P.; Hobden, K. Development of a scale to measure the trait of food neophobia in humans. Appetite 1992, 19, 105–120. [Google Scholar] [CrossRef]
Figure 1.
Three different vertical farming systems.


Figure 2.
Conceptual framework of the extended technology acceptance model.

Figure 3.
f²-effect sizes showing the relative effect of the exogenous latent variables on their related endogenous latent variables. Notes: * p < 0.05; ** p < 0.01; *** p ≤ 0.001; p < 0.05; vertical home farm (A): n = 146; in-store vertical farm (B): n = 151; indoor vertical farm (C): n = 185.
Figure 3.
f²-effect sizes showing the relative effect of the exogenous latent variables on their related endogenous latent variables. Notes: * p < 0.05; ** p < 0.01; *** p ≤ 0.001; p < 0.05; vertical home farm (A): n = 146; in-store vertical farm (B): n = 151; indoor vertical farm (C): n = 185.


Table 1.
Characteristics of the sample.
| Sample (in %) | German Population (in %) | ||
|---|---|---|---|
| Gender * | Male | 49.8 | 49.0 ** |
| Female | 50.2 | 51.0 ** | |
| Age * | 16–29 | 19.1 | 18.9 ** |
| 30–49 | 29.9 | 30.7 ** | |
| >50 | 51.0 | 50.4 ** | |
| No graduation yet | 3.7 | 4.0 ** | |
| Certificate of Secondary Education | 35.1 | 35.0 ** | |
| Education * | General Certificate of Secondary Education | 31.3 | 31.0 ** |
| General qualification for university entrance | 13.9 | 14.0 ** | |
| University degree | 16.0 | 17.0 ** | |
| Size of the community (inhabitants) | <300 | 2.9 | 42.0 ** |
| 300–999 | 3.9 | ||
| 1000–4999 | 13.1 | ||
| 5000–19,999 | 21.0 | ||
| 20,000–99,999 | 22.8 | 27.0 ** | |
| 100,000–499,999 | 16.6 | 31.0 ** | |
| >500,000 | 19.5 | ||
| Number of persons per household | 1 | 25.3 | 20.4 *** |
| 2 | 37.3 | 33.8 *** | |
| 3 | 14.9 | 18.3 *** | |
| 4 | 13.7 | 18.5 *** | |
| 5 | 2.1 | 8.9 *** | |
| > 6 | 1.2 | ||
| Net household income | <€1,300 | 25.9 | 17.8 ** |
| €1,300–€2,599 | 37.1 | 33.0 ** | |
| €2,600–€4,499 | 30.9 | 30.0 ** | |
| >€4,500 | 6.0 | 19.3 ** |
Table 2.
Descriptive statistics of the general approval of vertical farming.
| Statements | −−/− (in %) | −/+ (in %) | +/++ (in %) |
|---|---|---|---|
| The subject of “environmental friendliness” is important to me. | 3.1 | 16.2 | 80.7 |
| I’ve already informed myself about vertical farming. | 84.5 | 8.8 | 6.7 |
| The many different labels on food confuse me. | 21.3 | 26.9 | 51.9 |
| I have the feeling of having no control over the way that the food I consume is generated. | 15.8 | 26.5 | 57.7 |
| Finding the groceries that fulfill my demands is difficult. | 38.5 | 33.3 | 28.3 |
| The reduced use of fertilizers makes me skeptical. | 15.4 | 23.2 | 61.3 |
| The absence of pesticides is beneficial for the environment. | 2.9 | 6.7 | 90.4 |
Notes: −−/−: I do not agree at all /I do not agree; −/+: I partly agree; +/++: I agree/I totally agree.
Table 3.
Descriptive statistics of the statements for each system.
| Vertical Home Farm (A) (in %) | In-Store Vertical Farm (B) (in %) | Indoor Vertical Farm (C) (in %) | |||||||
|---|---|---|---|---|---|---|---|---|---|
| −−/− | −/+ | +/++ | −−/− | −/+ | +/++ | −−/− | −/+ | +/++ | |
| I will buy the system because of its features. | 46.6 | 24.7 | 28.8 | 18.6 | 32.5 | 49.0 | 11.4 | 38.4 | 50.3 |
| I think the production of food with the system is too artificial. | 43.1 | 31.5 | 25.3 | 29.3 | 33.1 | 37.7 | 31.0 | 37.5 | 31.5 |
| I will buy the system/its products. | 48.6 | 22.6 | 28.8 | 14.6 | 29.8 | 55.6 | 16.8 | 36.4 | 46.7 |
Notes: −−/−: I do not agree at all/I do not agree; −/+: I partly agree; +/++: I agree/I totally agree.
Table 4.
Constructs of the final structural equation modeling and their related items and ANOVA results.
Table 4.
Constructs of the final structural equation modeling and their related items and ANOVA results.
| Constructs | Indicators/Statements | Vertical Home Farm (A) MD/SD | In-store Vertical Farm (B) MD/SD | Indoor Vertical Farm (C) MD/SD |
|---|---|---|---|---|
| n = 146 | n = 151 | n = 186 | ||
| Attitude toward sustainability | A “healthy diet” is important to me. | 1.84/0.87 | 1.82/0.94 | 1.79/0.81 |
| “Environmental friendliness” is important to me. | 1.80/0.81 | 1.93/0.79 | 1.77/0.82 | |
| “Combating hunger” is important to me. | 2.01/1.01 | 2.22/1.00 | 2.08/1.03 | |
| Subjective knowledge | I know vertical farming | 1.96/0.41 | 1.92/0.47 | 2.29/1.12 |
| I have already dealt with vertical farming (yes/ no/I don’t know). | 4.48/0.93 | 4.40/0.96 | 4.42/0.97 | |
| I am interested in agricultural topics. | 2.86/1.14 | 2.95/1.05 | 3.02/1.16 | |
| Perceived sustainability * | Semantic differential: the system is useful/useless. | 2.29/1.12a | 1.93/0.92b | 1.89/1.01b |
| Semantic differential: the system is environmentally friendly/environmentally unfriendly. | 2.18/0.97a | 1.89/0.89b | 1.86/0.93b | |
| Semantic differential: the system is convincing/questionable. | 2.66/1.25a | 2.28/1.11b | 2.23/1.17b | |
| Semantic differential: the system is trendsetting/old-fashioned. | 1.96/0.87a | 1.71/0.79b | 1.68/0.76b | |
| The system stands for a sustainable production. | 2.33/0.92a | 2.18/0.91b | 2.05/0.88b | |
| Environmental attitude toward agriculture | The use of plant protection products in agriculture is irresponsible. | 2.30/1.04 | 2.34/1.16 | 2.00/1.02 |
| The use of fertilizer in agriculture is extremely high. | 1.82/0.93 | 1.87/0.88 | 1.74/0.83 | |
| A transition in the European agriculture must occur. | 1.97/0.96 | 1.99/0.97 | 1.87/0.881 | |
| Subjective norm * | My friends will approve of my purchase of the product. | 3.03/1.08a | 2.68/1.00ab | 2.59/0.98b |
| My family will approve of my purchase of the product. | 3.09/1.17 | 2.68/1.01 | 2.55/1.05 | |
| My colleagues will approve of my purchase of the product. | 3.20/1.13a | 2.95/1.12ab | 2.77/1.05b | |
| Technological affinity | I am skeptical about new technology. | 3.47/1.02 | 3.47/1.04 | 3.63/1.04 |
| The age of my technological devices is irrelevant. | 2.61/1.10 | 2.51/1.17 | 2.62/1.21 | |
| Perceived usefulness * | The system contributes to regional food production. | 2.49/0.96 | 2.16/0.95 | 2.05/0.89 |
| Artificial lighting is natural. | 2.57/1.23 | 2.64/1.16 | 2.51/1.14 | |
| Soilless production makes sense. | 2.99/1.17 | 2.78/1.04 | 2.75/1.09 | |
| Nutrient solution is not natural. | 2.97/1.12 | 3.00/1.12 | 2.51/1.14 | |
| For me, the product represents an added value. | 3.07/1.06a | 3.38/1.00b | 3.44/1.01b | |
| Perceived behavioral control | The number of labels on packaging confuses me. | 2.75/1.16 | 2.66/1.08 | 2.35/1.14 |
| I have the feeling of having no control over the production of my food products. | 2.50/1.12 | 2.42/0.96 | 2.32/1.03 | |
| Finding the food products that meet my requirements is difficult. | 3.26/1.04a | 3.13/1.04ab | 2.90/1.06b | |
| Attitude toward buying * | I will buy the product for its properties. | 3.29/1.19a | 2.61/1.07b | 2.48/0.98b |
| I perceive the production as too artificial. | 2.70/1.21a | 3.08/1.15b | 3.02/1.08b | |
| I am positive toward a purchase. | 2.99/1.23a | 2.47/0.99b | 2.33/1.00b | |
| Behavioral intention to buy * | I will buy the product if a possibility emerges. | 3.38/1.31a | 2.68/1.09b | 2.60/1.00b |
| I will recommend the product. | 3.31/1.22a | 2.87/1.04b | 2.81/0.97b | |
| How likely will you buy the product? | 3.54/1.18a | 2.71/1.07b | 2.59/1.00b |
Notes: * system specific constructs; scale from: 1 = “I totally agree” to 5 = “I do not agree at all” or 1 to 5 according to the semantic differential; different letters indicate a significant difference between the systems according to post-hoc tests of Games–Howell or Tukey.
Table 5.
Measurement of the internal consistency reliability and convergence validity of the constructs of the extended technology acceptance model.
Table 5.
Measurement of the internal consistency reliability and convergence validity of the constructs of the extended technology acceptance model.
| Construct | Items | Cronbach’s Alpha | Composite Reliability | Average Variance Extracted | ||||||
|---|---|---|---|---|---|---|---|---|---|---|
| Systems (n) | A (146) | B (151) | C (185) | A (146) | B (151) | C (185) | A (146) | B (151) | C (185) | |
| Attitude toward sustainability | 3 | 0.743 | 0.774 | 0.730 | 0.833 | 0.868 | 0.839 | 0.631 | 0.687 | 0.638 |
| Subjective knowledge | 3 | 0.531 | 0.539 | 0.627 | 0.752 | 0.756 | 0.794 | 0.505 | 0.518 | 0.565 |
| Perceived sustainability | 5 | 0.904 | 0.880 | 0.892 | 0.929 | 0.913 | 0.921 | 0.724 | 0.678 | 0.701 |
| Environmental attitude toward agriculture | 3 | 0.752 | 0.736 | 0.730 | 0.850 | 0.828 | 0.833 | 0.656 | 0.628 | 0.627 |
| Subjective norm | 3 | 0.922 | 0.915 | 0.914 | 0.951 | 0.945 | 0.946 | 0.865 | 0.851 | 0.853 |
| Technological affinity | 2 | 0.505 | 0.529 | 0.623 | 0.758 | 0.801 | 0.830 | 0.627 | 0.671 | 0.712 |
| Perceived usefulness | 5 | 0.863 | 0.801 | 0.780 | 0.901 | 0.862 | 0.852 | 0.646 | 0.556 | 0.537 |
| Perceived behavioral control | 3 | 0.775 | 0.630 | 0.699 | 0.807 | 0.778 | 0.831 | 0.594 | 0.545 | 0.621 |
| Attitude toward buying | 3 | 0.869 | 0.878 | 0.833 | 0.921 | 0.925 | 0.900 | 0.795 | 0.805 | 0.750 |
| Behavioral intention to buy | 3 | 0.920 | 0.913 | 0.924 | 0.949 | 0.945 | 0.952 | 0.862 | 0.852 | 0.869 |
Note: A = Vertical home farm; B = In-store vertical farm; C = Indoor vertical farm
Table 6.
R² values for the endogenous latent variables and path coefficients with significance levels of the related exogenous latent constructs.
Table 6.
R² values for the endogenous latent variables and path coefficients with significance levels of the related exogenous latent constructs.
| Endogenous Construct | Perceived Sustainability | Endogenous Construct | Perceived Usefulness | ||||
|---|---|---|---|---|---|---|---|
| System | A (R² = 0.050) | B (R² = 0.055) | C (R² = 0.031) | System | A (R² = 0.604) | B (R² = 0.487) | C (R² = 0.590) |
| Attitude toward sustainability | 0.057 | 0.143 | 0.160 * | Environmental attitude toward agriculture | –0.007 | 0.078 | 0.027 |
| Subjective knowledge | 0.198 * | –0.230 ** | 0.037 | Perceived sustainability | 0.571 *** | 0.513 *** | 0.603 *** |
| Subjective knowledge | 0.079 | –0.064 | –0.028 | ||||
| Subjective norm | 0.191 * | 0.217 ** | 0.185 *** | ||||
| Technological affinity | 0.074 | 0.088 | 0.137 ** | ||||
| Endogenous Construct | Attitude Toward Buying | Endogenous Construct | Behavioral Intention to Buy | ||||
| System | A (R²= 0.689) | B (R² = 0.702) | C (R² = 0.683) | System | A (R² = 0.741) | B (R² = 0.700) | C (R² = 0.652) |
| Perceived usefulness | 0.830 *** | 0.835 *** | 0.825 *** | Perceived behavioral control | 0.137 * | 0.081 | 0.103 |
| Perceived behavioral control | −0.005 | 0.047 | 0.016 | Attitude toward buying | 0.851 *** | 0.827 *** | 0.796 *** |
Notes: *** p < 0.001 significance level; ** p < 0.01 significance level; * p < 0.05 significance level; vertical home farm (A): n = 146; in-store vertical farm (B): n = 151; indoor vertical farm (C): n = 185.
Table 7.
Pairwise multi-group analysis.
| Vertical Home Farm (A) and In-store Vertical Farm (B) | Vertical Home Farm (A) and Indoor Vertical Farm (C) | In-store Vertical Farm (B) and Indoor Vertical Farm (C) | ||||
|---|---|---|---|---|---|---|
| Path Coefficient Difference | p-Value | Path Coefficient Difference | p-Value | Path Coefficient Difference | p-Value | |
| Subjective knowledge→Perceived usefulness | 0.041 | 0.371 | 0.062 | 0.213 | 0.021 | 0.422 |
| Subjective knowledge→Perceived sustainability | 0.475 | 0.042 | 0.127 | 0.109 | 0.348 | 0.901 |
| Attitude toward sustainability→Perceived sustainability | 0.086 | 0.758 | 0.076 | 0.753 | 0.010 | 0.427 |
| Perceived sustainability→Perceived usefulness | 0.265 | 0.009 | 0.013 | 0.445 | 0.252 | 0.991 |
| Environmental attitude toward agriculture→Perceived usefulness | 0.026 | 0.616 | 0.042 | 0.292 | 0.069 | 0.237 |
| Subjective norm→Perceived usefulness | 0.139 | 0.887 | 0.069 | 0.284 | 0.208 | 0.049 |
| Technological affinity→Perceived usefulness | 0.099 | 0.157 | 0.108 | 0.113 | 0.009 | 0.459 |
| Perceived usefulness→Attitude toward buying | 0.101 | 0.064 | 0.091 | 0.114 | 0.009 | 0.551 |
| Perceived behavioral control→Attitude toward buying | 0.002 | 0.506 | 0.024 | 0.407 | 0.022 | 0.386 |
| Perceived behavioral control→Behavioral intention to buy | 0.012 | 0.434 | 0.005 | 0.522 | 0.017 | 0.593 |
| Attitude toward buying→Behavioral intention to buy | 0.016 | 0.331 | 0.037 | 0.139 | 0.021 | 0.280 |
Notes: Two-tailed, bold signifies a significance level of p = 0.05.
© 2019 by the authors. Licensee MDPI, Basel, Switzerland. This article is an open access article distributed under the terms and conditions of the Creative Commons Attribution (CC BY) license (http://creativecommons.org/licenses/by/4.0/).
Share and Cite
MDPI and ACS Style
Jürkenbeck, K.; Heumann, A.; Spiller, A. Sustainability Matters: Consumer Acceptance of Different Vertical Farming Systems. Sustainability 2019, 11, 4052. https://doi.org/10.3390/su11154052
AMA Style
Jürkenbeck K, Heumann A, Spiller A. Sustainability Matters: Consumer Acceptance of Different Vertical Farming Systems. Sustainability. 2019; 11(15):4052. https://doi.org/10.3390/su11154052
Chicago/Turabian StyleJürkenbeck, Kristin, Andreas Heumann, and Achim Spiller. 2019. "Sustainability Matters: Consumer Acceptance of Different Vertical Farming Systems" Sustainability 11, no. 15: 4052. https://doi.org/10.3390/su11154052
Note that from the first issue of 2016, this journal uses article numbers instead of page numbers. See further details here.