Transformational Leadership, Systems, and Intrinsic Motivation Impacts on Innovation in Higher Education Institutes: Faculty Perspectives in Engineering Colleges


Abstract
:1. Introduction
2. Theoretical Background
2.1. Innovation
2.2. Higher Education and Innovation
2.3. Transformational Leaders
2.4. Leadership in Higher Education (HE)
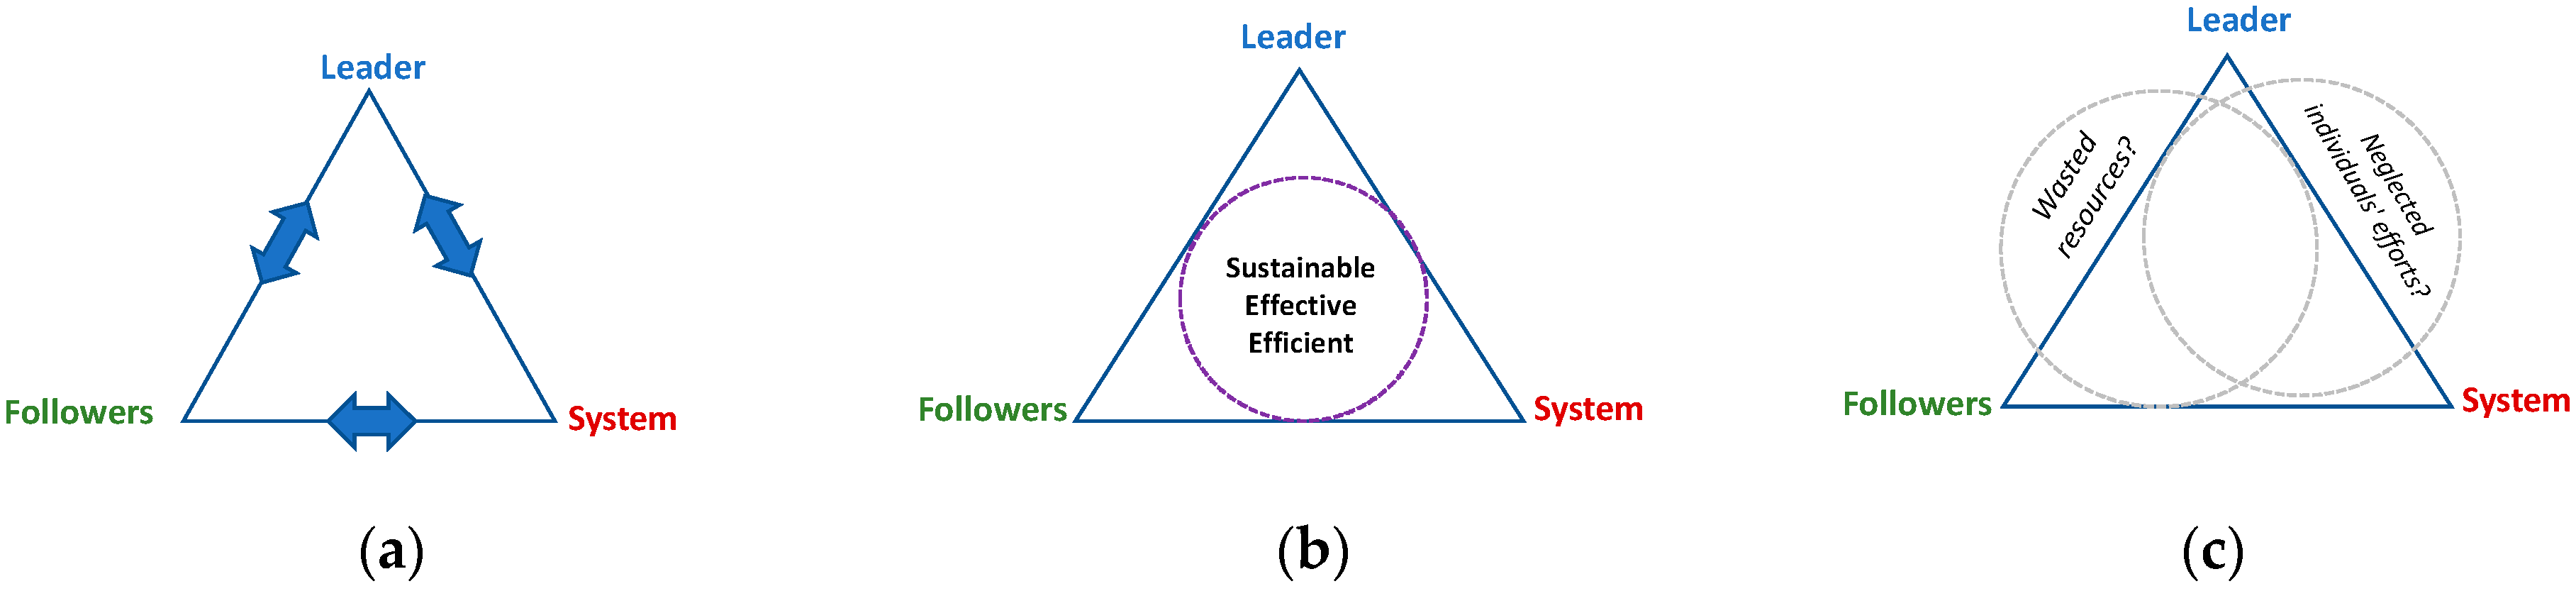
2.5. The Nexus of Leadership, Follower, and System
3. Methodology
3.1. Procedure and Instrumentation
3.1.1. Survey
3.1.2. Innovation Indicators
3.1.3. Qualitative Data
3.2. Sample
4. Results
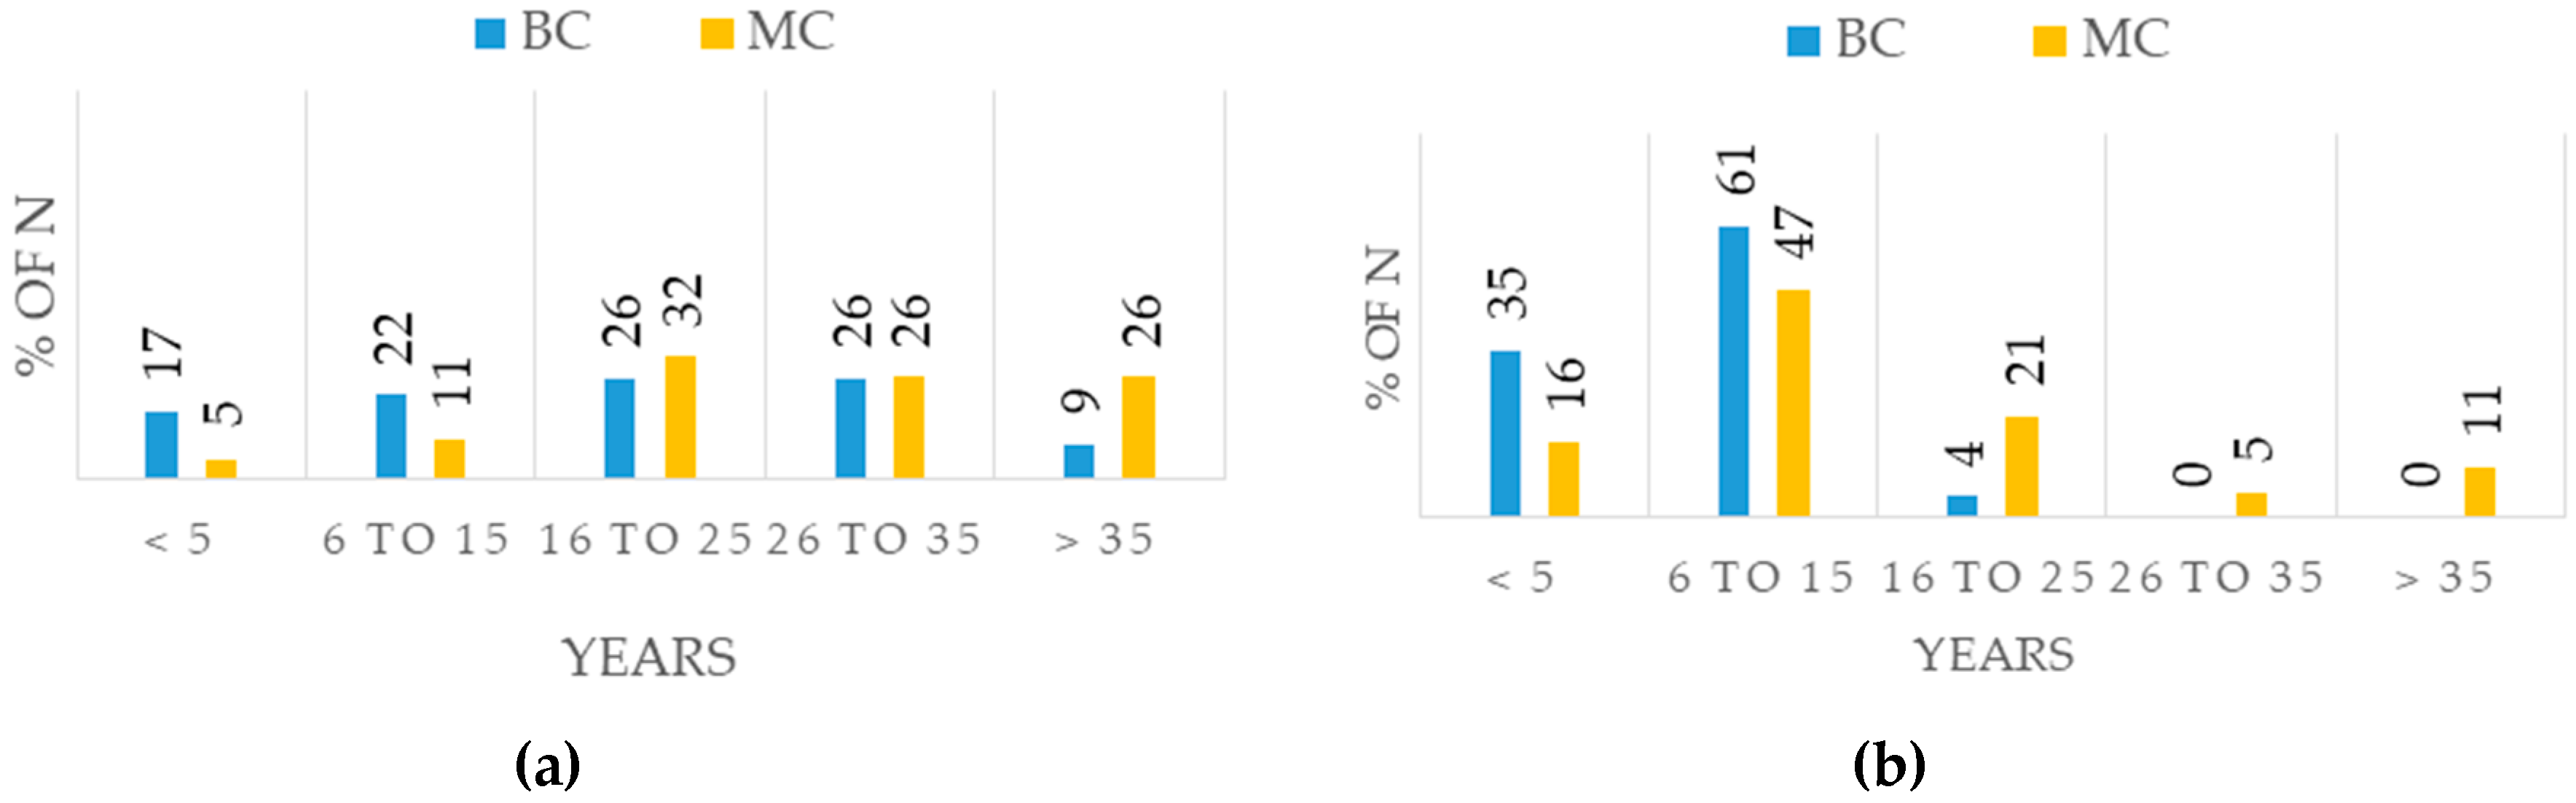
4.1. Demographics
4.2. MLQ Descriptive Statistic
4.3. System
4.4. Followership
4.5. Correlation between Main Pillars of Leadership, System and Followership Nexus
4.6. Innovative Output Indicators
5. Discussion
5.1. Qualitative Data (Stage Two)
5.2. Idealized Influence Behavior and Attribute (II B&A)
“A supporting factor here for being creative and innovative is the fact that it is flat structure. We have autonomy level that helps us be more creative, but again, too much freedom means we do everything by ourselves which can occupy a lot of our time.”
While in BC, even though the quantitative data showed higher (II) results for the BC leader, some indications of less autonomy and more hierarchal power influence were identified from the interviews, as in the following statements:“They give the right autonomy level to faculty.”
“To enhance creativity and innovation, leadership should not direct or judge the process at early stages and ensure faculty and students’ autonomy. Give room for experimental trial and error.”
5.3. Intellectual Stimulation (IS)
“It is about research and stops at research. No real development beyond that.”
“Innovation should not be a directed process so it can grow. Nor it should be judged at early stages. In addition, faculty and students need a good autonomy level for experimental errors.”
5.4. Individualized Consideration (IC)
“Developing innovation for individuals is not the job for this institution. Especially that it can’t be accurately measured nor have a direct fame or gain like in other sectors.”
“Leader’s role is to empower faculty members and recognize their accomplishments.”
“Innovative thinking should be encouraged more at the undergraduate level.”
“Leadership should consider attracting the big names in the field for collaboration to enhance the system and for capacity building.”
“Leadership should consider having the right mechanisms for evaluation starting by having competent people when evaluating projects’ proposals and allocating the right resources. Weak people should be laid off”
“Time is not enough for faculty to do innovative work.”
“Culture needs to be developed to train students how to commercialize their ideas with better collaboration among faculty and students.”
“Better and more direct connection from leadership is needed.”
“Mentorship for new faculty is needed. They tend not to ask not to appear weak; hence, a lot of time is wasted trying to navigate their ways through. This can be initiated by leadership.”
“Leaders need to set clear objectives and facilitate large scale projects, forming teams and put together mechanisms for funding (which are currently very good already).”
“Projects are not valued as publications.”
“Projects and community services consume more time and effort, but poorly perceived.”
“Special award for projects is needed.”
“We need better acknowledgment for faculty who do applied research “development,” which is different than the traditional focus of faculty (basic research and published papers) which is the current criteria faculty is being assessed on.”
6. Conclusions
Author Contributions
Funding
Acknowledgments
Conflicts of Interest
References
- McNamara, K.H. Fostering sustainability in higher education: A mixed-methods study of transformative leadership and change strategies. Environ. Pract. 2010, 12, 48–58. [Google Scholar] [CrossRef]
- Uhl, C.; Anderson, A. Green Destiny: Universities Leading the Way to a Sustainable Future. Bioscience 2001, 51, 36–42. [Google Scholar] [CrossRef]
- Ernst and Young. University of the Future: A Thousand Year Old Industry on the Cusp of Profound Change. 2012. Available online: http://www.ey.com/Publication/vwLUAssets/University_of_the_future/SFile/ (accessed on 1 March 2018).
- Barth, M.; Rieckmann, M. Academic staff development as a catalyst for curriculum change towards education for sustainable development: An output perspective. J. Clean. Prod. 2012, 26, 28–37. [Google Scholar] [CrossRef]
- Deutsche Bank. The broad Basis of Societal Progress; Deutsch Bank Research: Frankfurt, Germany, 2008. [Google Scholar]
- Banks, G. Australia’s Productivity Challenge and Human Capital; Presentation by the Chair of the Productivity Commission; Eidos Institute: Brisbane, Australia, 2008. [Google Scholar]
- Edwards, A. The Sustainability Revolution: Portrait of a Paradigm Shift; New Society: Gabriola Island, BC, Canada, 2005. [Google Scholar]
- Bowers, C. Educating for Eco-Justice and Community; The University of Georgia Press: Athens, GA, USA, 2001. [Google Scholar]
- McNamara, K. Pragmatic discourses and alternative resistance: Responses to climate change in the Pacific. Grad. J. Asia Pac. Stud. 2008, 6, 33–54. [Google Scholar]
- Orr, D. Earth in Mind: On Education, Environment and the Human Prospect; Island Press: Washington, DC, USA, 2004. [Google Scholar]
- Filho, W.L.; Raath, S.; Lazzarini, B.; Vargas, V.; Souza, L.D.; Anholon, R.; Orlovic, V. The role of transformation in learning and education for sustainability. J. Clean. Prod. 2018, 199, 286–295. [Google Scholar] [CrossRef]
- Oliveira, K.C.C. Relacionando Liderança Transformacional e Inovação na Educação. In Dissertação de Mestrado. Mestrado em Empreendedorismo e Internacionalização; Instituto Superior de Contabilidade e Administração do Porto: São Mamede de Infesta, Portugal, 2017. [Google Scholar]
- Leithwood, K.; Jantzi, D. Transformational school leadership for large-scale reform: Effects on students, teachers, and their classroom practices. Sch. Eff. Sch. Improv. 2006, 17, 201–227. [Google Scholar] [CrossRef]
- Li, H.; Sajjad, N.; Wang, Q.; Ali, A.M.; Khaqan, Z.; Amina, S. Influence of Transformational Leadership on Employees’ Innovative Work Behavior in Sustainable Organizations: Test of Mediation and Moderation Processes. Sustainability 2019, 11, 1594. [Google Scholar] [CrossRef]
- Denzin, N.K.; Lincoln, Y.S.; Smith, L.T. Handbook of Critical and Indigenous Methodologies; Sage: Thousand Oaks, CA, USA, 2008. [Google Scholar]
- Disterheft, A.; Caeiro, S.; Azeiteiro, U.M.; Filho, W.L. Sustainable universities—A study of critical success factors for participatory approaches. J. Clean. Prod. 2015, 106, 11–21. [Google Scholar] [CrossRef]
- Nazir, S.; Qun, W.; Hui, L.; Shafi, A. Influence of Social Exchange Relationships on Affective Commitment and Innovative Behavior: Role of Perceived Organizational Support. Sustainability 2018, 10, 4418. [Google Scholar] [CrossRef]
- Middlehurst, R. Changing Internal Governance: Are Leadership Roles and Management Structures in United Kingdom Universities Fit for the Future? High. Educ. Q. 2013, 67. [Google Scholar] [CrossRef]
- Deloitte. Making the Grade, 2011: A Study of the Top 10 Issues Facing Higher Education Institutions. Available online: http://www.deloitte.com/assets/Dcom-Ireland/Local%20Assets/Documents/Public520sector/IE_PS_making%20the%20grade_IRL_0411_WEB.pdf (accessed on 10 April 2019).
- Anderson, N.; Carsten, K.; De Dreu, W.; Nijstad, B.A. The reutilization of innovation research: A constructively critical review of the state-of-the-science. J. Organ. Behav. 2004, 25, 147–173. [Google Scholar] [CrossRef]
- Krogstrup, H.K. Evalue Rings Modeller; Hans Reitzel Forlag: Copenhagen, Denmark, 2016; p. 3. [Google Scholar]
- Wang, C.L.; Rafiq, M. Ambidextrous Organizational Culture, Contextual Ambidexterity and New Product Innovation: A Comparative Study of UK and Chinese High-tech Firms. Br. J. Manag. 2012, 25, 58–76. [Google Scholar] [CrossRef] [Green Version]
- Labin, S.N.; Duffy, J.L.; Meyers, D.C.; Wandersman, A.; Lesesne, C.A. Are search synthesis of the evaluation capacity building literature. Am. J. Eval. 2012, 33, 307–338. [Google Scholar] [CrossRef]
- O’Cass, A.; Heirati, N.; Ngo, L.V. Achieving new product success via the synchronization of exploration and exploitation across multiple levels and functional areas. Ind.Mark. Manag. 2014, 43, 862–872. [Google Scholar] [CrossRef] [Green Version]
- O’Reilly, C.A.; Tushman, M.L. Ambidexterity as a Dynamic Capability: Resolving the Innovator’s Dilemma; Harvard Business School: Cambridge, MA, USA, 2007; pp. 7–88. [Google Scholar]
- De Clercq, D.; Thongpapanl, N.T.; Dimov, D. Shedding new light on the relationship between contextual ambidexterity and firm performance: An investigation of internal contingencies. Technovation 2013, 33, 119–132. [Google Scholar] [CrossRef] [Green Version]
- Gibson, C.B.; Birkinshaw, J. The antecedents, consequences, and mediating role of organizational Contextual Ambidexterity. Acad. Manag. J. 2004, 47, 209–226. [Google Scholar]
- Brix, J. Innovation capacity building: An approach to maintaining balance between exploration and exploitation in organizational learning. Learn. Organ. 2019, 26, 12–26. [Google Scholar] [CrossRef]
- Simsek, Z.; Heavey, C.; Veiga, J.F.; Souder, D. A typology for aligning organizational ambidexterity’s conceptualizations, antecedents, and outcomes. J. Manag. Stud. 2009, 46, 864–894. [Google Scholar] [CrossRef]
- Güttel, W.H.; Konlechner, S.W. Continuously hanging by a thread: Managing contextually ambidextrous organizations. Schmalenbach Bus. Rev. 2009, 61, 150–172. [Google Scholar] [CrossRef]
- Havermans, L.A.; Den Hartog, D.N.; Keegan, A.; Uhl-Bien, M. Exploring the Role of Leadership in Enabling Contextual Ambidexterity. Hum. Resour. Manag. 2015, 54, S179–S200. [Google Scholar] [CrossRef]
- Farazmand, A. Innovation in strategic human resource management: Building capacity in the ageofglobalization. Public Organ. Rev. 2004, 4, 3–24. [Google Scholar] [CrossRef]
- Baark, E. The Role of Universities in the Innovation Systems of the Gulf: Vocational Training or Gateways to the World of Knowledge? In Proceedings of the Gulf Research Meeting 2015 Workshop 6: Transnational Knowledge Relations and Researcher Mobility for Building Knowledge-Based Societies and Economies in the Gulf, Cambridge, UK, 24–27 August 2015. [Google Scholar]
- Salmi, J. The Challenge of Establishing World-Class Universities; World Bank: Washington, DC, USA, 2009. [Google Scholar]
- Leydesdorff, L. The Knowledge-Based Economy and the Triple Helix Model. Ann. Rev. Inf. Sci. Technol. 2010, 44, 365–417. [Google Scholar] [CrossRef]
- Wooltorton, S.; Wilkinson, A.; Horwitz, P.; Bahn, S.; Redmond, J.; Dooley, J. Sustainability and action research in universities. Int. J. Sustain. High. Educ. 2015, 16, 424–439. [Google Scholar] [CrossRef]
- Howlett, C.; Ferreira, J.; Blomfield, J. Teaching sustainable development in higher education. Int. J. Sustain. High Educ. 2016, 173, 305e321. [Google Scholar] [CrossRef]
- Mumford, M.D.; Scott, G.M.; Gaddis, B.; Strange, J.M. Leading creative people: Orchestrating expertise and relationships. Leadersh. Q. 2002, 13, 705–750. [Google Scholar] [CrossRef]
- Csikszentmihalyi, M. Implications of a systems perspective for the study of creativity. In Handbook of Creativity; Sternberg, R.J., Ed.; Cambridge University Press: New York, NY, USA, 1999; pp. 313–335. [Google Scholar]
- Salancik, G.R.; Pfeffer, J. A social information processing approach to job attitudes and task design. Adm. Sci. Q. 1978, 23, 224–253. [Google Scholar] [CrossRef]
- Grant, A.M. The significance of task significance: Job performance effects, relational mechanisms, and boundary conditions. J. Appl. Psychol. 2008, 93, 108–124. [Google Scholar] [CrossRef]
- Piccolo, R.F.; Colquitt, J.A. Transformational leadership and job behaviors: The mediating role of core job characteristics. Acad. Manag. J. 2006, 49, 327–340. [Google Scholar] [CrossRef]
- Vila-Vázquez, G.; Castro-Casal, C.; Álvarez-Pérez, D.; del Río-Araújo, L. Promoting the Sustainability of Organizations: Contribution of Transformational Leadership to Job Engagement. Sustainability 2018, 10, 4109. [Google Scholar] [CrossRef]
- Kim, W.; Park, J. Examining structural relationships between work engagement, organizational procedural justice, knowledge sharing, and innovative work behavior for sustainable organizations. Sustainability 2017, 9, 205. [Google Scholar] [CrossRef]
- Bass, B.; Avolio, B.J. Improving Organizational Effectiveness Through Transformational Leadership. J. Organ. Chang. 1994, 17, 177–193. [Google Scholar]
- House, R.J.; Howell, J.M. Personality and Charismatic Leadership. Leadersh. Q. 1992, 3, 81–108. [Google Scholar] [CrossRef]
- Northouse, P.G. Leadership Theory and Practice, 6th ed.; Sage Publications: Thousand Oaks, CA, USA, 2012. [Google Scholar]
- Gouldner, A.W. The norm of reciprocity: A preliminary statement. Am. Sociol. Rev. 1960, 25, 161–178. [Google Scholar] [CrossRef]
- West, M.A.; Farr, J.L. Innovation and Creativity at Work: Psychological and Organizational Strategjes; John Wiley Sons: New York, NY, USA, 1990; pp. 265–267. [Google Scholar]
- Podsakoff, P.M.; MacKenzie, S.B.; Bommer, W.H. Transformational leader behaviors and substitutes for leadership as determinants of employee satisfaction, commitment, trust, and organizational citizenship behaviors. J. Manag. 1996, 22, 259–298. [Google Scholar] [CrossRef]
- Boamah, S.A.; Laschinger, H.K.S.; Wong, C.; Clarke, S. Effect of transformational leadership on job satisfaction and patient safety outcomes. Nurs. Outlook 2018, 66, 180–189. [Google Scholar] [CrossRef]
- Higher Education Funding Council for England. Evaluation of the Leadership Foundation for Higher Education. Available online: http://www.hefce.ac.uk/pus/reports/year/2010/lfheevaln/ (accessed on 10 April 2019).
- Clark, B. Creating Entrepreneurial Universities: Organizational Pathways of Transformation; IAU/Elsevier Science Ltd.: Oxford, UK, 1998. [Google Scholar]
- Clark, B. Sustaining Change in Universities: Continuities in Case Studies and Concepts; SRHE/Open University Press: Maidenhead, UK, 2004. [Google Scholar]
- Kotter, J.P.; Schlesinger, L.A. Choosing Strategies for Change. Harvard Bus. Rev. 2008, 57, 106–114. [Google Scholar] [CrossRef]
- Smith, G.P. The New Leader: Bringing Creativity and Innovation to the Workplace; Chart Your Course Publications: Conyers, GA, USA, 2002. [Google Scholar]
- Val, M.P.; Fuentes, C.M. Resistance to change: A literature review and empirical study. Manag. Decis. 2003, 41, 148–155. [Google Scholar] [CrossRef]
- Yukl, G.A. Leadership in Organizations; Prentice-Hall: Upper Saddle River, NJ, USA, 2006. [Google Scholar]
- Bharadwaj, S.; Menon, A. Making innovation happen in organizations: Individual creativity mechanisms, organizational creativity mechanisms or both? J. Prod. Innov. Manag. 2000, 17, 424–434. [Google Scholar] [CrossRef]
- Al-Mansoori, R.S.; Koc, M. Sustainability in Higher Education: The Impact of Transformational Leadership on Followers’ Innovative Outcomes A Framework Proposal. In Sustainability in University Campuses: Learning, Skills Building and Best Practice; Leal Filho, W., Bardi, U., Eds.; Springer: Cham, Switzerland, 2019. [Google Scholar]
- Gagné, M.; Deci, E.L. Self-determination theory and work motivation. J. Organ. Behav. 2005, 26, 331–362. [Google Scholar] [CrossRef] [Green Version]
- Zhang, X.; Bartol, K.M. Linking empowering leadership and employee creativity: The influence of psychological empowerment, intrinsic motivation, and creative process engagement. Acad. Manag. J. 2010, 53, 107–128. [Google Scholar] [CrossRef]
- Kong, M.; Xu, H.; Zhou, A.; Yian, Y. Implicit followership heory to employee creativity: The roles of leader-member exchange, self-efficacy and intrinsic motivation. J. Manag. Organ. 2019, 25, 81–95. [Google Scholar] [CrossRef]
- Bass, B.M.; Avolio, B.J. Multifactor Leadership Questionnaire: Manual and Sampler Set, 3rd ed.; Mind Garden Inc.: Palo Alto, CA, USA, 2004. [Google Scholar]
- Bass, B.M.; Avolio, B.J. Manual for the Multifactor Leadership Questionnaire (form 5X); Mind Garden: Redwood City, CA, USA, 2000. [Google Scholar]
- Heinnovate. Available online: https://heinnovate.eu (accessed on 23 July 2019).
- Tierney, P.; Farmer, S.M.; Graen, G.B. An examination of leadership and employee creativity: The relevance of traits and relationships. Pers. Psychol. 1999, 52, 591–620. [Google Scholar] [CrossRef]
- Perri 6. Innovation by non-profit organizations: Policy and research issues. Nonprofit Manag. Leadersh. 1993, 3, 397–414. [Google Scholar] [CrossRef]
- Liao, S.H.; Wu, C.C. System perspective of knowledge management, organizational learning, and organizational innovation. Exp. Syst. Appl. 2010, 37, 1096–1103. [Google Scholar] [CrossRef]
- Afuah, A. Innovation Management. Strategies, Implementation and Profits; Oxford University Press, Inc.: New York, NY, USA, 1998. [Google Scholar]
- Richter, D.; Loendorf, W. Faculty with Industrial Experience Bring A Real World Perspective to Engineering Education. In Proceedings of the ASEE Annual Conference, Honolulu, HI, USA, 24–27 June 2007. [Google Scholar]
- Rowold, J. Multifactor Leadership Questionnaire: Psychometric Properties of the German Translation by Jens Rowold; Mind Garden: Redwood City, CA, USA, 2005. [Google Scholar]
- Cohen, R.; Swerdlik, M. Psychological Testing and Assessment; McGraw-Hill Higher Education: Boston, MA, USA, 2010. [Google Scholar]
- Nunnally, J.; Bernstein, L. Psychometric Theory; McGraw-Hill Higher, Inc.: New York, NY, USA, 1994. [Google Scholar]
- Walker, C.O.; Greene, B.A.; Mansell, R.A. Identification with academics, intrinsic/extrinsic motivation, and self-efficacy as predictors of cognitive engagement. Learn. Individ. Differ. 2006, 16, 1–12. [Google Scholar] [CrossRef]
- Eagly, A.H.; Johannesen-Schmidt, M.C.; Van Engen, M.L. Transformational, Transactional, and Laissez-Faire Leadership Styles: A Meta-Analysis Comparing Women and Men. Psychol. Bull. 2003, 129, 569–591. [Google Scholar] [CrossRef]
- Eagly, A.H.; Karau, S.J. Role congruity theory of prejudice toward female leaders. Psychol. Rev. 2002, 109, 573–598. [Google Scholar] [CrossRef]
- Webster, M., Jr.; Foschi, M. (Eds.) Overview of Status Generalization. In Status Generalization: New Theory and Research; Stanford University Press: Stanford, CA, USA, 1988; pp. 1–20. [Google Scholar]
- Foschi, M. Double Standards for Competence: Theory and Research. Annu Rev. Sociol. 2000, 16, 21–42. [Google Scholar] [CrossRef]
- Biernat, M.; Fuegen, K. Shifting Standards and the Evaluation of Competence: Complexity in Gender-Based Judgment and Decision Making. J. Soc. Issues 2002, 57, 707–724. [Google Scholar] [CrossRef]
- Hofstede, G. National Cultures in Four Dimensions: A ResearchBased Theory of Cultural Differences among Nations. Int. Stud. Manag. Organ. 1983, 13, 46–74. [Google Scholar] [CrossRef]
- Crist, J.T. A Fever of Research: Scientific Journal Article Production and the Emergence of a National Research System in Qatar, 1980–2011. In The Century of Science (International Perspectives on Education and Society); Emerald Publishing Limited: Bingley, UK, 2017; Volume 33, pp. 227–248. [Google Scholar]
- Al-Husseini, S.; Elbeltagi, I. Transformational leadership and innovation: A comparison study between Iraq’s public and private higher education. Stud. High. Educ. 2016, 41, 159–181. [Google Scholar] [CrossRef]
- Astin, A.W.; Astin, H.S. Leadership Reconsidered: Engaging Higher Education in Social Change; W.K. Kellogg Foundation: Battle Creek, MI, USA, 2000. [Google Scholar]
- Jung, D.I.; Chow, C.; Wu, A. The Role of transformational leadership in enhancing organizational innovation: Hypotheses and some preliminary findings. Leadersh. Q. 2003, 14, 525–544. [Google Scholar] [CrossRef]
- Jung, D.; Wu, A.; Chow, C.W. Towards understanding the direct and indirect effects of CEOs’ transformational leadership on firm innovation. Leadersh. Q. 2008, 19, 582–594. [Google Scholar] [CrossRef]
- Gumusluoglu, L.; Ilsev, A. Transformational leadership, creativity, and organization innovation. J. Bus. Res. 2009, 62, 461–473. [Google Scholar] [CrossRef]
- García-Morales, V.J.; Jiménez-Barrionuevo, M.M.; Gutierrez-Gutierrez, L.J. Transformational leadership influence on organizational performance through organizational learning and innovation. J. Bus. Res. 2012, 65, 1040–1050. [Google Scholar] [CrossRef]
- Brandis, B. Transformational Leadership in Higher Education: From Politics to Porcelain. Master’s Thesis, University of Northern Iowa, Cedar Falls, IA, USA, 2003. [Google Scholar]
- Di Fabio, A. The psychology of sustainability and sustainable development for well-being in organizations. Front. Psychol. 2017, 8, 1534. [Google Scholar] [CrossRef]
- Di Fabio, A. Positive healthy organizations: Promoting well-being, meaningfulness, and sustainability in organizations. Front. Psychol. 2017, 8, 1938. [Google Scholar] [CrossRef]
- Kim, W.; Khan, G.F.; Wood, J.; Mahmood, M.T. Employee Engagement for Sustainable Organizations: Keyword Analysis Using Social Network Analysis and Burst Detection Approach. Sustainability 2016, 8, 631. [Google Scholar] [CrossRef]
- Spreitzer, G.; Porath, C.L.; Gibson, C.B. Toward human sustainability: How to enable more thriving at work. Organ. Dyn. 2012, 41, 155–162. [Google Scholar] [CrossRef]
- Oldham, G.R.; Cummings, A. Employee creativity: Personal and contextual factors at work. Acad. Manag. J. 1996, 39, 607–634. [Google Scholar]
- Scott, S.G.; Bruce, R.A. Determinants of innovative behavior: A path model of individual innovation in the workplace. Acad. Manag. J. 1994, 37, 580–607. [Google Scholar]
- Allen, K. Working toward transformational leadership in higher education. Campus 1996, 1, 11–15. [Google Scholar] [CrossRef]


| Type | Indicator | Unit |
|---|---|---|
| Input | Pupil/teacher ratio | % |
| Total R&D headcount | Number | |
| Process | Continuous skills development | Number of courses, conferences (per) faculty (per) year |
| Reward system | Yes/No | |
| Uni/Gov/Industry collaboration | Number of workshops, seminarsgrants/funds ($) | |
| Output | Number of graduates in science and engineering | Number of students (per) year |
| Number of patents | Number of patents (per) year | |
| Number of scientific and technical published articles | Number of publications (per) year | |
| H-index | |Number| | |
| Number of start-ups | Number of start-ups (per) year (or every 3–5 years) |
| Output Indicators | Data Resources |
|---|---|
| Technical publications: journals, conference papers, books, book chapters | Google scholar profile Scopus Personal pages |
| H-index | Scopus and Google scholar |
| Patents | Justia, personal page, google scholar profile |
| N = 42 | M | SD | α |
|---|---|---|---|
| Transformational leadership: | |||
| II (A) | 2.137 | 1 | 0.844 |
| II (B) | 2.446 | 0.708 | 0.782 |
| IM | 2.792 | 0.751 | 0.632 |
| IS | 1.500 | 1.010 | 0.810 |
| IC | 1.256 | 0.868 | 0.839 |
| Transactional Leadership: | |||
| CR | 1.821 | 1.056 | 0.867 |
| MBE (A) | 1.542 | 0.508 | 0.378 |
| Passive Leadership: | |||
| MBE (P) | 1.274 | 0.884 | 0.369 |
| LF | 1.196 | 0.716 | 0.655 |
| Leadership outcomes | |||
| EE | 1.492 | 1.194 | 0.857 |
| EF | 1.833 | 1.168 | 0.859 |
| SAT | 1.679 | 1.188 | 0.877 |
| N = 23 Branch Campus Non-Public University Outside US | N = 19 Main Campus Public University in US | |||||
|---|---|---|---|---|---|---|
| M | SD | α | M | SD | α | |
| Transformational leadership: | ||||||
| II (A) | 2.283 | 1.156 | 0.851 | 1.961 | 0.774 | 0.858 |
| II (B) | 2.630 | 0.698 | 0.756 | 2.224 | 0.671 | 0.786 |
| IM | 2.837 | 0.782 | 0.555 | 2.737 | 0.729 | 0.757 |
| IS | 1.707 | 1.022 | 0.845 | 1.250 | 0.965 | 0.73 |
| IC | 1.543 | 0.835 | 0.821 | 0.908 | 0.796 | 0.858 |
| Transactional Leadership: | ||||||
| CR | 2.120 | 1.079 | 0.863 | 1.461 | 0.933 | 0.860 |
| MBE (A) | 1.576 | 0.535 | 0.234 | 1.500 | 0.486 | 0.578 |
| Passive Leadership: | ||||||
| MBE (P) | 1.065 | 0.755 | 0.416 | 1.526 | 0.982 | 0.237 |
| LF | 1.044 | 0.745 | 0.684 | 1.382 | 0.653 | 0.556 |
| Leadership outcomes | ||||||
| EE | 1.739 | 1.142 | 0.893 | 1.193 | 1.218 | 0.799 |
| EF | 1.98 | 1.259 | 0.881 | 1.658 | 1.055 | 0.832 |
| SAT | 2.022 | 1.239 | 0.891 | 1.263 | 1.005 | 0.850 |
| BC | ||||||||||||
|---|---|---|---|---|---|---|---|---|---|---|---|---|
| N = 23 | Transformational | Transactional | Passive | Leadership Outcomes | ||||||||
| %tile | II (A) | II (B) | IM | IS | IC | CR | MBE (A) | MBE (P) | LF | EE | EF | SAT |
| 5 | 0.10 | 1.10 | 0.00 | 0.05 | 0.10 | 0.00 | 0.05 | 0.00 | ||||
| 10 | 0.60 | 1.60 | 0.10 | 0.35 | 0.60 | 0.00 | 0.25 | 0.00 | ||||
| 20 | 1.00 | 1.95 | 0.70 | 0.70 | 1.25 | 0.33 | 0.50 | 0.90 | ||||
| 30 | 1.40 | 2.10 | 1.00 | 1.00 | 1.25 | 1.00 | 0.75 | 1.00 | ||||
| 40 | 2.25 | 2.65 | 1.50 | 1.25 | 1.65 | 1.20 | 1.60 | 1.80 | ||||
| 50 | 2.25 | 3.00 | 1.75 | 1.50 | 2.00 | 2.00 | 2.75 | 2.00 | ||||
| 60 | 2.85 | 3.00 | 2.10 | 2.00 | 2.60 | 2.33 | 2.75 | 3.00 | ||||
| 70 | 3.00 | 3.00 | 2.45 | 2.20 | 3.00 | 2.60 | 3.00 | 3.00 | ||||
| 80 | 3.30 | 3.25 | 2.75 | 2.30 | 3.30 | 3.00 | 3.05 | 3.10 | ||||
| 90 | 3.75 | 3.25 | 2.90 | 2.65 | 3.50 | 3.00 | 3.50 | 3.50 | ||||
| MC | ||||||||||||
|---|---|---|---|---|---|---|---|---|---|---|---|---|
| N = 19 | Transformational | Transactional | Passive | Leadership Outcomes | ||||||||
| %tile | II (A) | II (B) | IM | IS | IC | CR | MBE (A) | MBE (P) | LF | EE | EF | SAT |
| 5 | 0.75 | 1.25 | 1.25 | 0.00 | 0.00 | 0.00 | 0.00 | 0.00 | 0.00 | |||
| 10 | 1.00 | 1.50 | 1.75 | 0.25 | 0.00 | 0.25 | 0.00 | 0.25 | 0.00 | |||
| 20 | 1.25 | 1.75 | 2.25 | 0.25 | 0.00 | 0.50 | 0.00 | 0.75 | 0.00 | |||
| 30 | 1.50 | 1.75 | 2.50 | 0.50 | 0.50 | 1.25 | 0.33 | 0.75 | 0.50 | |||
| 40 | 1.75 | 1.75 | 2.50 | 1.00 | 0.50 | 1.25 | 0.33 | 1.00 | 1.00 | |||
| 50 | 1.75 | 2.00 | 2.50 | 1.00 | 0.75 | 1.25 | 0.67 | 1.75 | 1.50 | |||
| 60 | 2.00 | 2.25 | 2.75 | 1.00 | 0.75 | 1.50 | 1.00 | 2.25 | 1.50 | |||
| 70 | 2.25 | 2.25 | 3.25 | 2.00 | 1.50 | 1.75 | 2.00 | 2.50 | 1.50 | |||
| 80 | 3.00 | 3.00 | 3.50 | 2.25 | 1.50 | 2.50 | 3.00 | 2.50 | 2.50 | |||
| 90 | 3.25 | 3.25 | 4.00 | 2.75 | 2.25 | 3.00 | 3.00 | 3.00 | 3.00 | |||
| 60th %tile | Transformational | Transactional | Passive | Leadership Outcomes | ||||||||
|---|---|---|---|---|---|---|---|---|---|---|---|---|
| II (A) | II (B) | IM | IS | IC | CR | MBE (A) | MBE (P) | LF | EE | EF | SAT | |
| Norm N = 12,118 | 3.25 | 3.00 | 3.25 | 3.00 | 3.17 | 3.13 | 3.00 | 3.25 | 3.50 | |||
| BC N = 23 | 2.85 | 3.00 | 2.10 | 2.00 | 2.60 | 2.33 | 2.75 | 3.00 | ||||
| MC N = 19 | 2.00 | 2.25 | 2.75 | 1.00 | 0.75 | 1.50 | 1.00 | 2.25 | 1.50 | |||

| Trait/Outcome | BC Distance from Norm | MC Distance from Norm |
|---|---|---|
| II (A) | −0.4 | −1.25 |
| II (B) | 0 | −0.75 |
| IS | −0.9 | −2 |
| IC | −1.17 | −2.42 |
| CR | −0.53 | −1.63 |
| EE | −0.67 | −2 |
| EF | −0.5 | −1 |
| SAT | −0.5 | −2 |
| BC | MC | ||||||
|---|---|---|---|---|---|---|---|
| EE | EF | SAT | EE | EF | SAT | ||
| Transformational | II (A) | 0.752 ** | 0.795 ** | 0.896 ** | 0.622 ** | 0.782 ** | 0.773 ** |
| II (B) | 0.752 ** | 0.788 ** | 0.772 ** | 0.606 ** | 0.805 ** | 0.742 ** | |
| IS | 0.818 ** | 0.799 ** | 0.800 ** | 0.693 ** | 0.682 ** | 0.637 ** | |
| IC | 0.724 ** | 0.661 ** | 0.692 ** | 0.802 ** | 0.800 ** | 0.848 ** | |
| Transactional | CR | 0.752 ** | 0.759 ** | 0.827 ** | 0.785 ** | 0.801 ** | 0.804 ** |
| BC | MC | ||||||||
|---|---|---|---|---|---|---|---|---|---|
| Culture | Diverse Learning | Incentives and Rewards | System Satisfaction | Culture | Diverse Learning | Incentives and Rewards | System Satisfaction | ||
| Transformational | II (A) | 0.734 ** | 0.695 ** | 0.631 ** | 0.759 ** | 0.801 ** | 0.504 * | 0.692 ** | 0.665 ** |
| II (B) | 0.530 ** | 0.644 ** | 0.670 ** | 0.553 ** | 0.784 *** | 0.553 * | 0.624 ** | 0.618 ** | |
| IS | 0.592 ** | 0.777 ** | 0.766 ** | 0.691 ** | 0.778 ** | 0.602 ** | 0.642 ** | 0.612 ** | |
| IC | 0.487 * | 0.638 ** | 0.590 ** | 0.477 * | 0.672 ** | 0.585 ** | 0.762 ** | 0.805 ** | |
| Transactional | CR | 0.744 ** | 0.730 ** | 0.634 ** | 0.784 ** | 0.769 ** | 0.604 ** | 0.814 ** | 0.835 ** |
| BC | MC | ||||||||||
|---|---|---|---|---|---|---|---|---|---|---|---|
| Innovation Driver | Solving Complex Problems | Producing New Ideas | Analytical Thinking | Internal Motivation Level | Innovation Driver | Solving Complex Problems | Producing New Ideas | Analytical Thinking | Internal Motivation Level | ||
| Transformational | II (A) | −0.215 | 0.100 | 0.181 | 0.114 | 0.588 ** | −0.258 | 0.217 | 0.310 | 0.367 | 0.126 |
| II (B) | −0.145 | 0.037 | 0.156 | 0.143 | 0.422 * | −0.299 | 0.172 | 0.290 | 0.235 | 0.062 | |
| IS | 0.074 | 0.129 | 0.192 | 0.278 | 0.437 * | −0.373 | 0.180 | 0.191 | 0.173 | 0.077 | |
| IC | −0.005 | −0.028 | 0.121 | 0.116 | 0.394 | −0.357 | −0.148 | −0.078 | 0.065 | −0.238 | |
| Transactional | CR | −0.089 | 0.089 | 0.202 | 0.125 | 0.522 * | −0.427 | 0.053 | 0.150 | 0.217 | −0.068 |
© 2019 by the authors. Licensee MDPI, Basel, Switzerland. This article is an open access article distributed under the terms and conditions of the Creative Commons Attribution (CC BY) license (http://creativecommons.org/licenses/by/4.0/).
Share and Cite
Al-Mansoori, R.S.; Koç, M. Transformational Leadership, Systems, and Intrinsic Motivation Impacts on Innovation in Higher Education Institutes: Faculty Perspectives in Engineering Colleges. Sustainability 2019, 11, 4072. https://doi.org/10.3390/su11154072
Al-Mansoori RS, Koç M. Transformational Leadership, Systems, and Intrinsic Motivation Impacts on Innovation in Higher Education Institutes: Faculty Perspectives in Engineering Colleges. Sustainability. 2019; 11(15):4072. https://doi.org/10.3390/su11154072
Chicago/Turabian StyleAl-Mansoori, Reem S., and Muammer Koç. 2019. "Transformational Leadership, Systems, and Intrinsic Motivation Impacts on Innovation in Higher Education Institutes: Faculty Perspectives in Engineering Colleges" Sustainability 11, no. 15: 4072. https://doi.org/10.3390/su11154072