Measuring Multi-Scale Urban Forest Carbon Flux Dynamics Using an Integrated Eddy Covariance Technique
by
 ,
,
Kaidi Zhang
1,2,†, 
Yuan Gong
3,†,
Francisco J. Escobedo
4,
Rosvel Bracho
5,
Xinzhong Zhang
1,2 and
Min Zhao
2,* 1
School of Environmental and Geographical Sciences, Shanghai Normal University, Shanghai 200234, China
2
Research Center of Urban Ecology and Environment, Shanghai Normal University, Shanghai 200234, China
3
College of Biology and the Environment, Nanjing Forestry University, Nanjing 210037, China
4
Functional and Ecosystem Ecology Unit (EFE), Biology Program, Faculty of Natural Sciences and Mathematics, Universidad del Rosario, Bogotá D.C. 111221492, Colombia
5
School of Forest Resources and Conservation, University of Florida, Gainesville, FL 32611, USA
*
Author to whom correspondence should be addressed.
†
These authors contributed equally to this work.
Sustainability 2019, 11(16), 4335; https://doi.org/10.3390/su11164335
Submission received: 14 July 2019
/
Revised: 4 August 2019
/
Accepted: 4 August 2019
/
Published: 11 August 2019
(This article belongs to the Special Issue Low Energy Architecture and Low Carbon Cities: Exploring Links, Scales, and Environmental Impacts)
Abstract
:The multi-scale carbon-carbon dioxide (C-CO2) dynamics of subtropical urban forests and other green and grey infrastructure types were explored in an urbanized campus near Shanghai, China. We integrated eddy covariance (EC) C-CO2 flux measurements and the Agroscope Reckenholz-Tänikon footprint tool to analyze C-CO2 dynamics at the landscape-scale as well as in local-scale urban forest patches during one year. The approach measured the C-CO2 flux from different contributing areas depending on wind directions and atmospheric stability. Although the study landscape was a net carbon source (2.98 Mg C ha−1 yr−1), we found the mean CO2 flux in urban forest patches was −1.32 μmol m−2s−1, indicating that these patches function as a carbon sink with an annual carbon balance of −5.00 Mg C ha−1. These results indicate that urban forest patches and vegetation (i.e., green infrastructure) composition can be designed to maximize the sequestration of CO2. This novel integrated modeling approach can be used to facilitate the study of the multi-scale effects of urban forests and green infrastructure on CO2 and to establish low-carbon emitting planning and planting designs in the subtropics.
1. Introduction
Urban areas are a complex matrix of different land covers, primarily including green infrastructure (GI; e.g., urban forests and other vegetation patches) and grey infrastructure (e.g., buildings, roads, and impervious). This matrix affects greenhouse gas (GHG) dynamics due to the combination of fossil fuel emissions from transportation and industrial activities and carbon-carbon dioxide (C-CO2) sequestration by urban forests and other areas of natural and semi-natural vegetation, wetlands and rivers [1]. As such, there is increasing research on urban C-CO2 dynamics and the use of urban forests as a nature-based solution across many cities of the world [2,3,4].
However, multi-scale modeling of urban C-CO2 dynamics for different urban land covers, including urban and peri-urban forests in developing countries, is complex due to: Landscape heterogeneity, socioeconomic factors, emission sources, seasonality, wind direction-speed, and atmospheric stability [4,5]. Thus, many studies on the role of vegetation on C have used indirect methods such as allometric biomass equations and tree inventory data to assess C stocks and CO2 sequestration in urban areas [6,7]. Other empirical approaches, such as urban metabolism [8] and direct measurements using eddy covariance (EC) flux observation systems [9], are also being used to assess these urban C-CO2 dynamics. However, of these methods, EC allows for integrated measurements of C-CO2 fluxes between the surface and the atmosphere within a contribution area to measured C fluxes, known as the footprint, which consists of sources and sinks [9,10,11]. These contribution areas are generally landscape-scale segments or portions within the study footprint [12]. As such, the C-CO2 dynamics of smaller localized patches and areas within the footprint are much more difficult to model [4,10].
But, the available ART Footprint Tool (Agroscope Reckenholz-Tänikon; ART hereafter), based on the Kormann and Meixner model, is a relatively accessible approach for modeling source-sink heterogeneity and the partial flux contribution of specific local-scale areas inside a footprint [13]. Although little used in cities, it can potentially quantify how local-scale urban forest or other GI patches offset CO2; a topic that is increasingly important to researchers and decision-makers globally. Such research using direct measurements of C-CO2 flux source-sink characteristics and their use as a nature-based solution in subtropical urban forests in low-middle income countries is scarce [2,3,9].
Therefore, the aim of this short communication is to explore a novel approach for estimating the landscape and local-scale C-CO2 flux dynamics of subtropical urban forests in an urbanizing area near subtropical Shanghai, China. Our specific objectives were two-fold. First, we quantified the overall CO2 flux variation in an urbanized landscape and its different land covers. Second, we then explored the local-scale C-CO2 flux dynamics of the specific urban forest, mixed, and grey infrastructure patches. We did so by combining Geographical Information Systems, direct annual EC measurements of C-CO2 fluxes with the ART contribution area model. We then compared the C dynamics of urban forests with other areas of green-grey infrastructure [13].
As we will point out in the methods, the below approach requires advanced expertise, state of the art equipment, and data to implement. In particular, the long-term datasets required include canopy height and fine-scale meteorological and environment measurements, as well as spatial land use cover boundaries. Similarly, these local-scale flux source area assessments need CO2 flux partitioning in different time series for the different land-use types. As such all these requirements are needed to make the below flux calculations and spatial assessments. That said, the novel, integrated, multi-scale techniques explored here could provide an improved approach to better understand, plan, manage, and design urban forests as essential components of urban nature-based solutions.
2. Materials and Methods
The 456-hectare study area, or landscape, is located at the Fengxian University Campus, approximately 40 km south of central Shanghai, China, in a coastal plain with a subtropical monsoon climate. Southeast winds dominate during the summer and northwest winds in the winter. The annual average temperature is 16 °C, the mean minimum and maximum temperatures are 4 °C in January and 33 °C in July–August, respectively [14,15]. The mean annual precipitation is 1200 mm and occurs mostly in the summer. Seasonality, as used in this study, is defined as follows, where Spring is the 1st of March–31st May, Summer is the 1st of June–31st August, Autumn is the 1st of September–30th November, while Winter is the 1st of December–28th February.
The grey infrastructure land use/covers (LULCs; e.g., building, roads, impervious) accounted for 39.25% of the study landscape. The buildings alone accounted for 24.31% of the total area and had an average height of 10 m. The GI or vegetation-dominated LULCs accounted for 53.2% of the study area, and the remaining was mixed and water bodies. Vegetation is characterized by a subtropical evergreen broad-leaved forest tree types dominated by Cinnamomum camphora with a canopy height of 8 m and other common herbaceous species such as Acorus calamus L., Phragmites australis, and Ophiopogon japonicus.
The EC system used for this short communication consisted of a three-dimensional ultrasonic anemometer (Windmaster, Gill, UK), and infrared gas analyzer (Li-7500, Licor, Lincoln, NE, USA), mounted on 20 m tall antenna tower in the center of the study area. High-frequency data was collected at 10 Hz on a CR3000 datalogger (Campbell Scientific Instruments, Logan, UT, USA) from April 2015 to March 2016. Carbon dioxide fluxes were calculated in 30 min intervals using EddyPro 5.1.1 software (Li-COR, Lincoln, NE, USA), which applied a coordinate rotation to adjust for local wind streamline and corrects for: The frequency response losses, spectral attenuation, and density fluctuations due to changes in air temperature and air moisture content.
The estimated fluxes were filtered following quality control indicators generated by the processing software (0-1-2; where “0” indicates best to “2”, the poorest quality data) and the steady-state and developed turbulent conditions tests [16]. The fluxes were also eliminated under raining conditions or when less than 90% of the high-frequency data was collected in the 30 min intervals. Sixty-six percent of data remained after this filtering protocol was applied [17]. Atmospheric stability was defined according to Obukhov’s stability lengths (L), where L < 0 represent unstable and L > 0 represent stable atmospheric stability, respectively [13,18]. Temporal gaps in the fluxes, usually less than 2 consecutive hours, were filled using the diurnal variation method (MDV) by interpolating the average value of the data generated at the same time in a cycle of 7 days for daytime and 14 days for night van ’t Hoff model time [18,19,20]. For longer periods, the Landsberg model was used for daytime and CO2 fluxes were related to photosynthetically active radiation, while the van ’t Hoff model, which relates fluxes to soil temperature, was used for nighttime gap-filling [19,20]. The MDV method was used for all data gap filling procedures when estimating CO2 fluxes of both the footprint and different GI areas within the study area. Negative CO2 flux values indicate CO2 uptake.
To attribute the CO2 fluxes to their sources within the study landscape, we first estimated the characteristics and range of flux sources in the entire contributing area, or footprint, located on the urbanized campus [21,22]. The footprint had a radius of 500 m relative to the EC tower. We used the Hsieh model, based on the Lagrangian stochastic model and dimensional analysis, as it is suitable for long-term time series and requires few parameters, including: The observing height (m), zero-plane displacement value (m) and aerodynamic roughness length (m) [22]. Although the Flux—Source Area Model (FSAM) is also used for these types of analyses, it is much more complex and is not suitable for long-term flux footprint calculations [23,24].
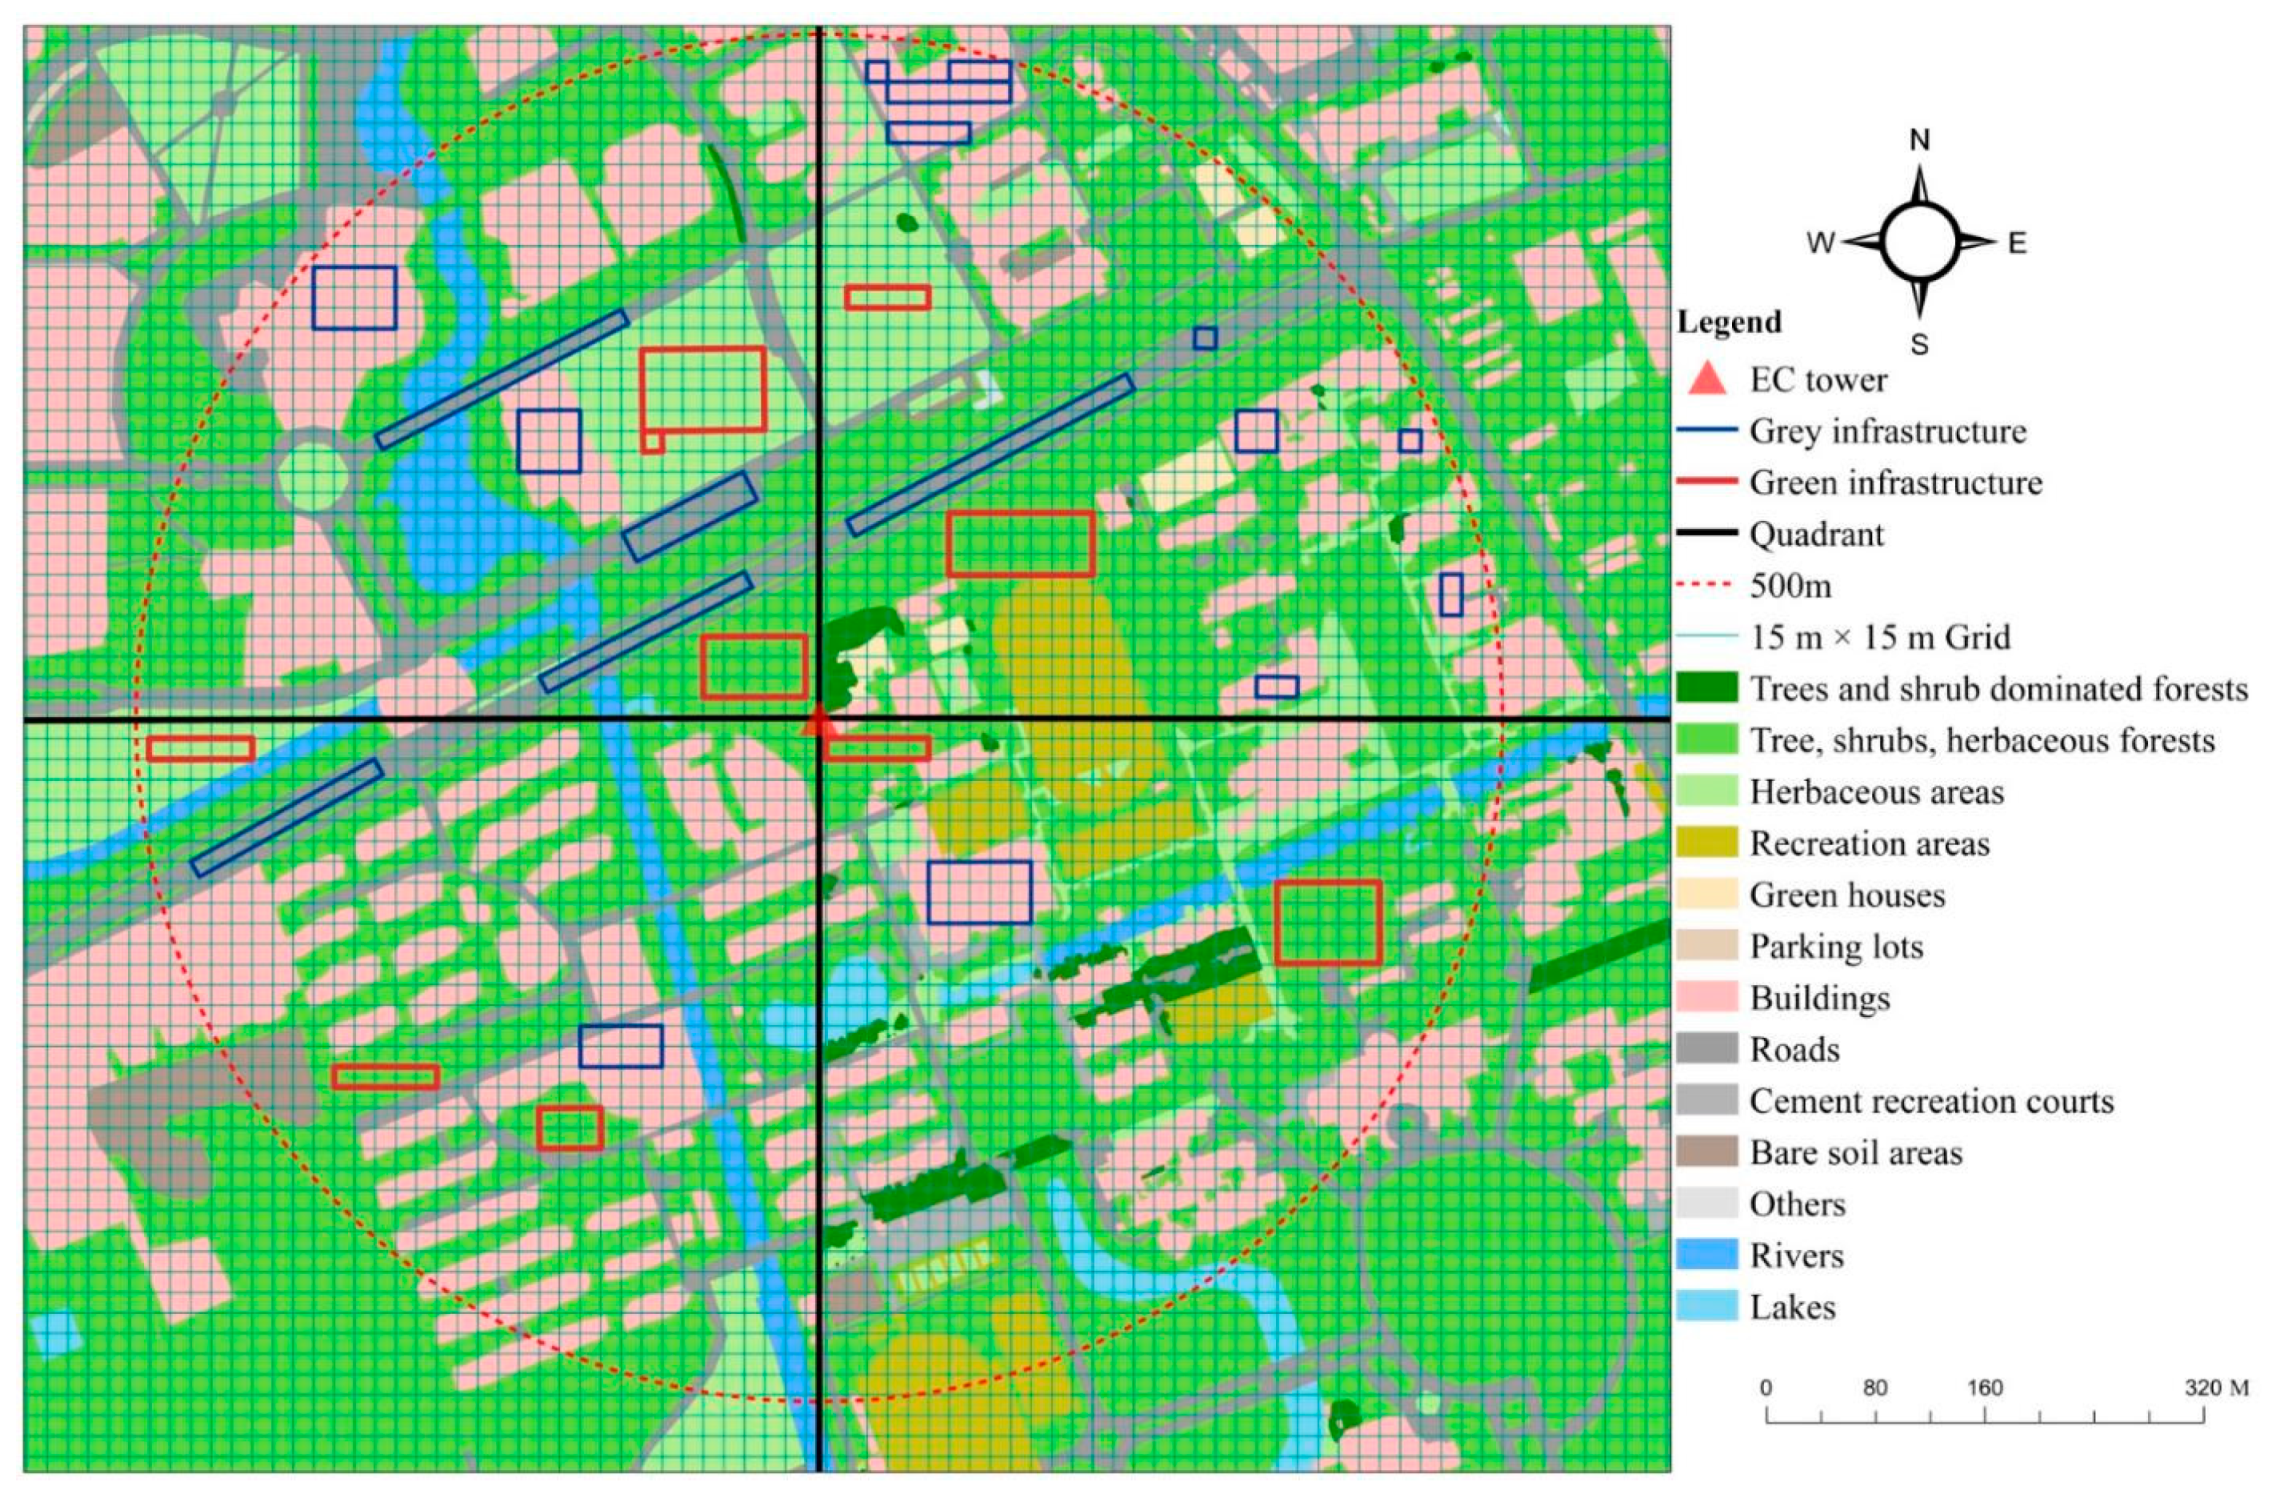
Second, we estimated the flux contribution of 3 specific local-scale urban forest (i.e., tree dominated GI), mixed, and grey infrastructure patches to the total measured fluxes in the footprint using ART. We identified and selected the 3 specific patches using the following approach. A 15 × 15 m grid was initially established inside the footprint to spatially segregate the different LULCs. Then, 200 of these cells were grouped into either green or grey infrastructure types based on their LULCs. Afterward, the selected grey and green infrastructure cells were grouped into 26 different polygons that best represented the green and grey infrastructure patches across the 4 footprint quadrants (Figure 1). All polygons were summed producing the contribution of grey and GI to total measured fluxes and total fluxes from each quadrant [12]. The footprint function was then combined with the LULC data and the footprint contribution was calculated for 3 selected polygons that best represented the 3 different patch types (i.e., urban forest, mixed, and grey infrastructure) [12,13].
3. Results
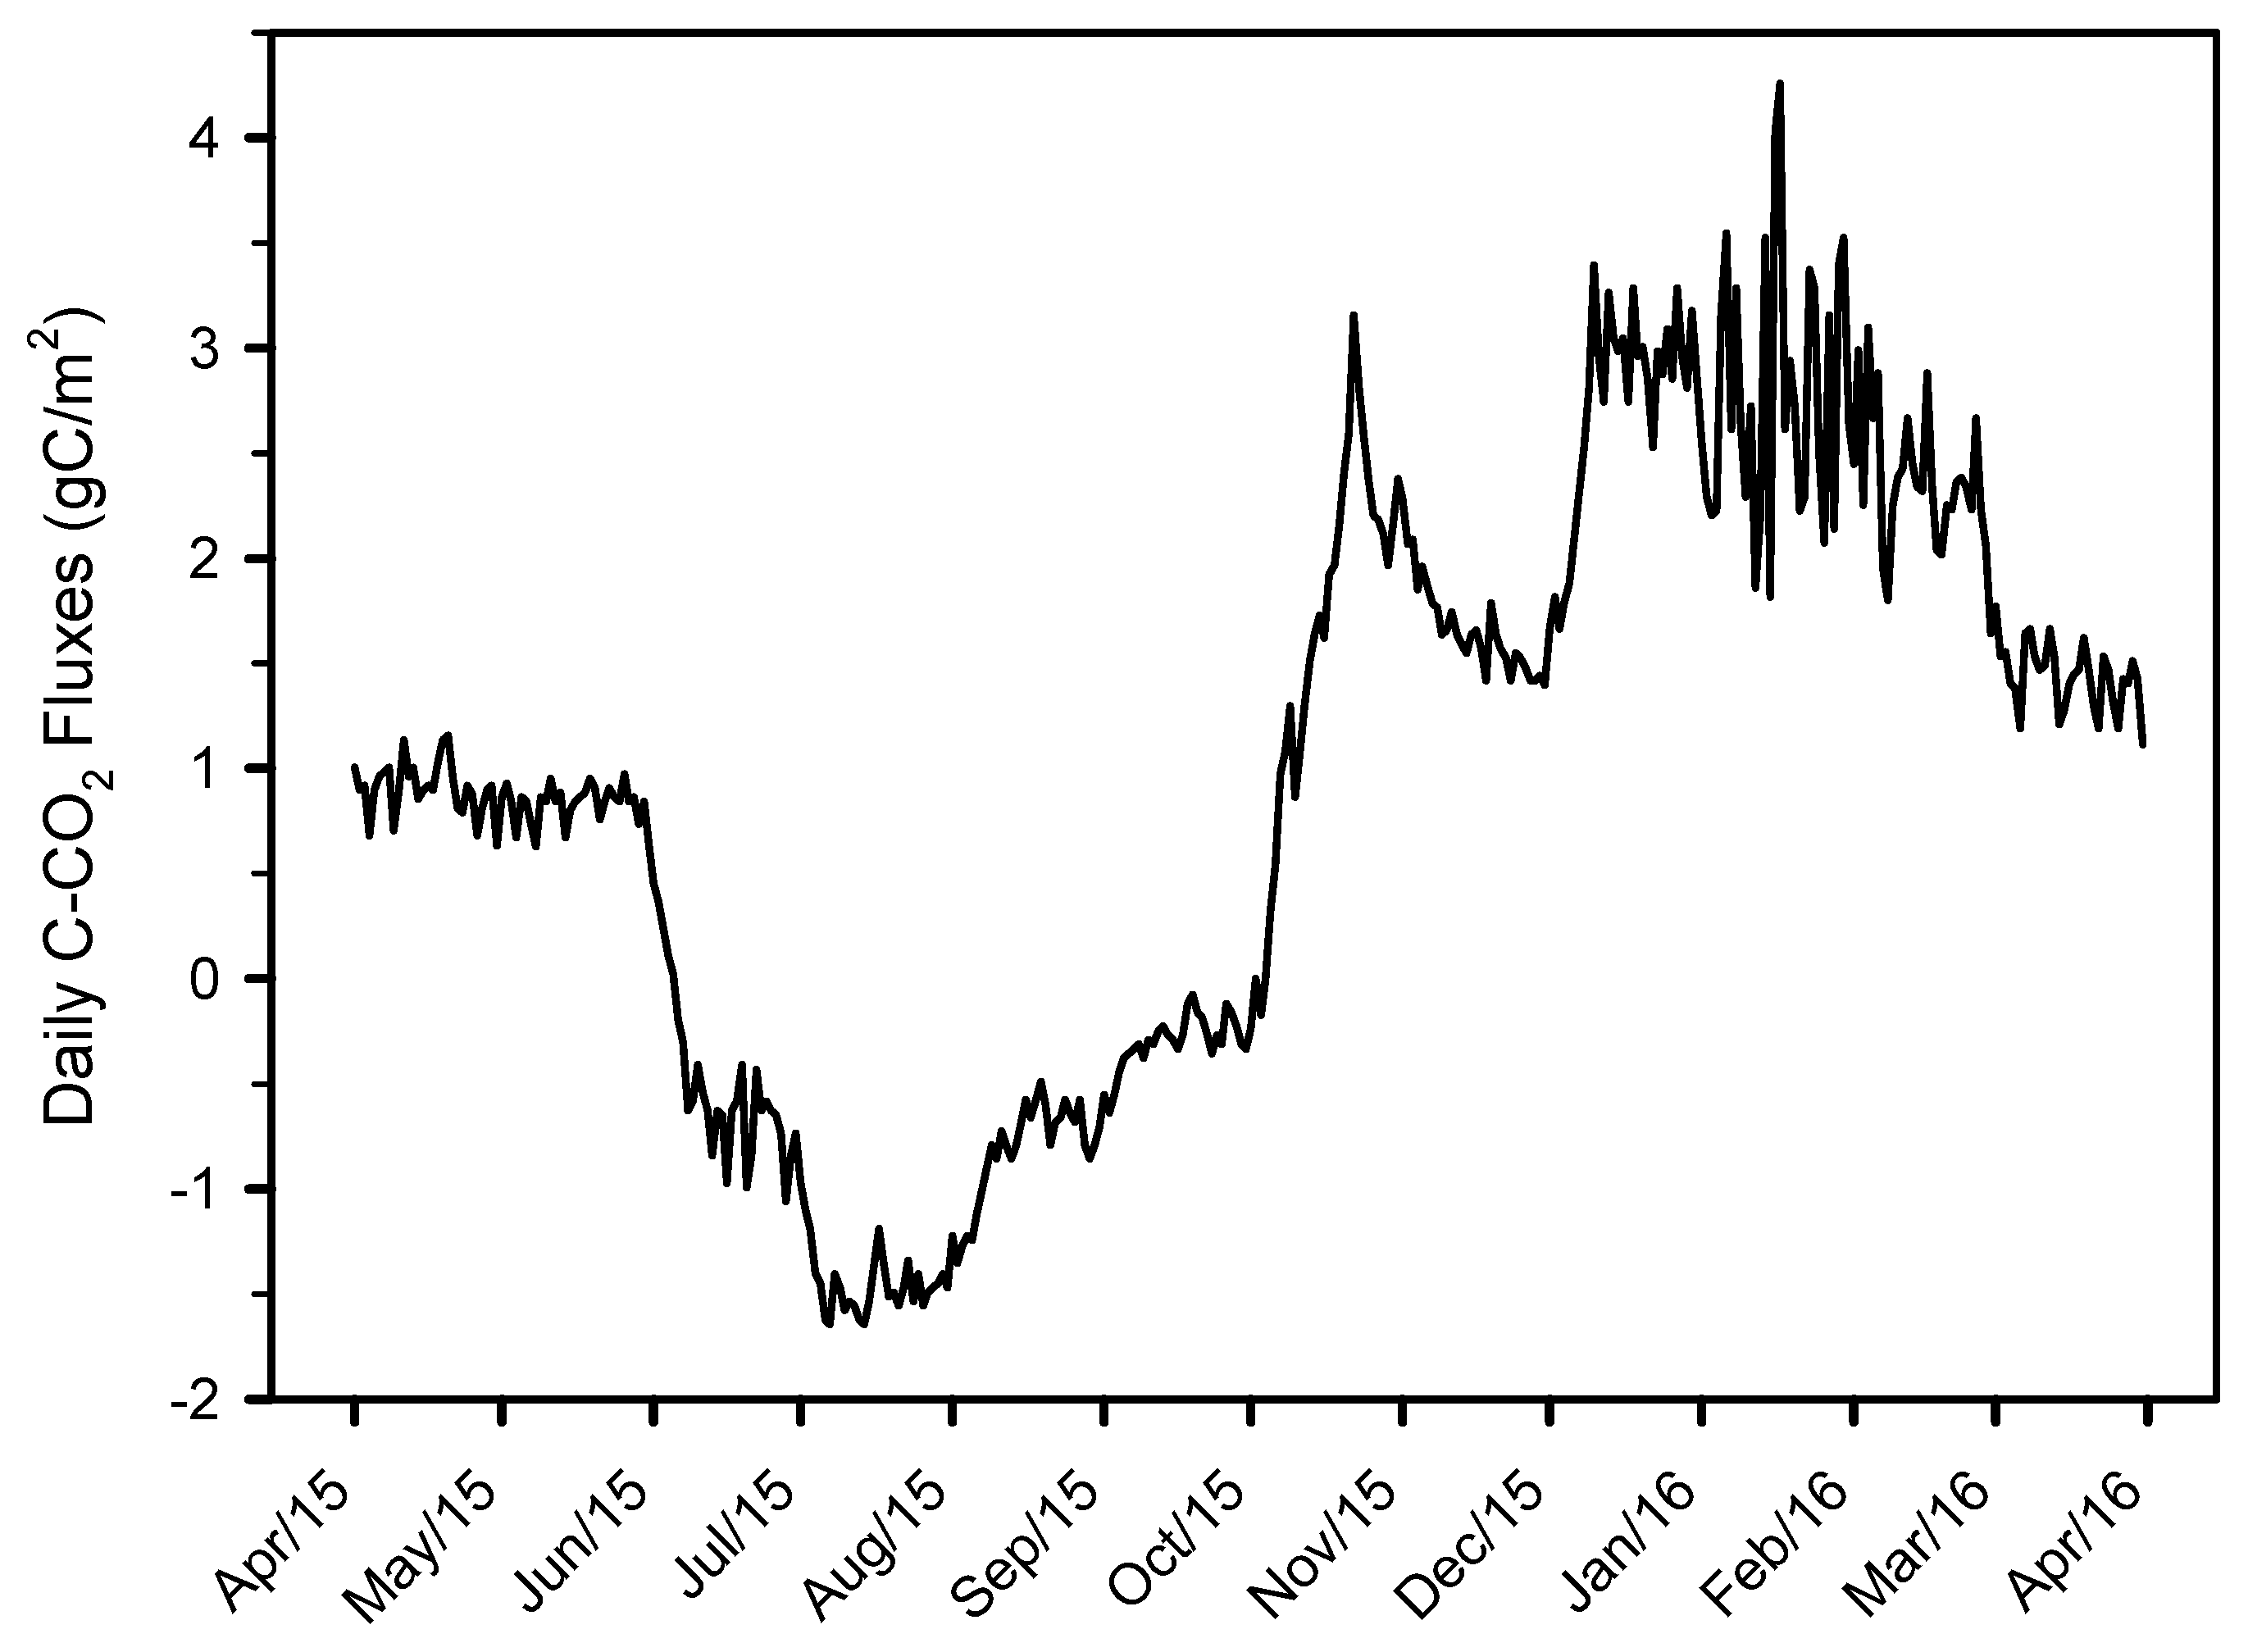
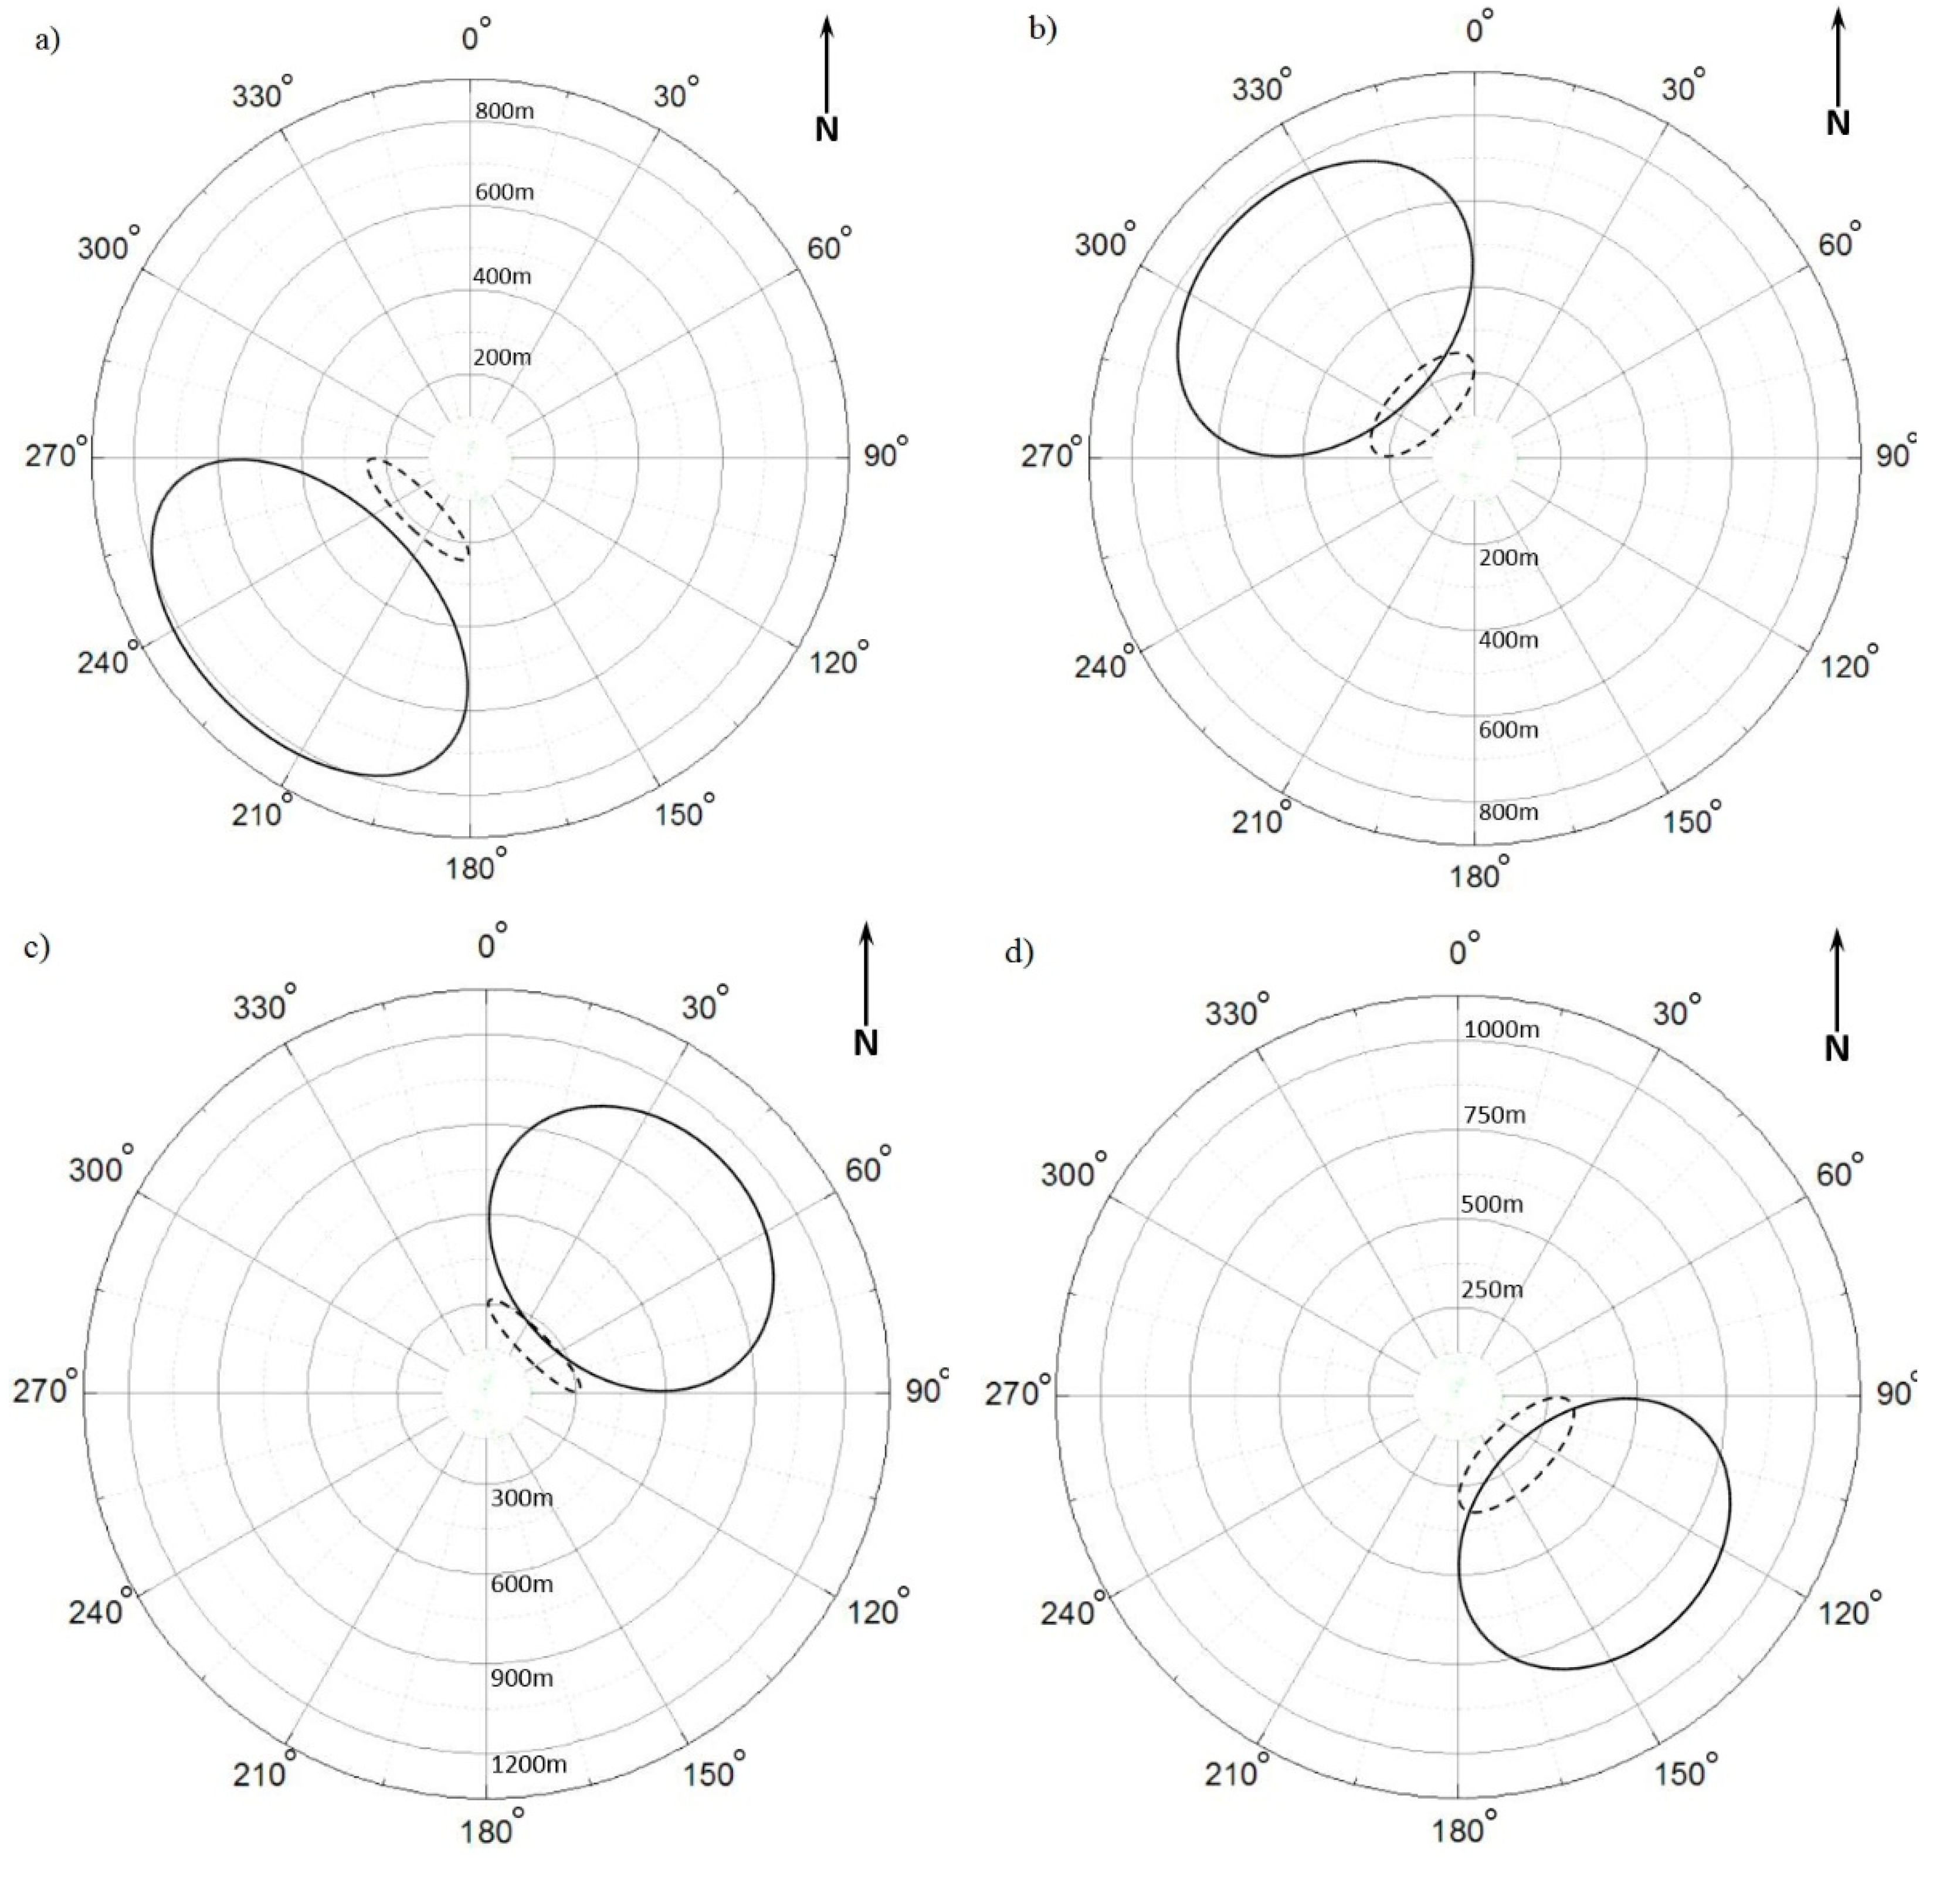
Ranges of prevailing seasonal wind direction and the percent of total frequency were estimated (Appendix A) and then the Hsieh footprint model was used to calculate the range of 90% of flux contribution area to the measured C-CO2 flux according to the prevailing wind direction. The flux contribution area length for non-prevailing winds under stable atmospheric conditions was 260–810 m during the spring. When the atmosphere was unstable, the length of the flux contribution area was 121–220 m. The flux contribution areas for seasonal prevailing winds under stable and unstable atmospheric conditions are shown in Appendix A. As expected, all seasons exhibited a pattern of increased flux contribution areas as the atmospheric stability improved. The total daily C-CO2 for the study is shown in Figure 2.
The total C-CO2 balance in the study landscape was 2.98, with the northeast quadrant contributing 1.22, followed by the southwest with 0.78 and southeast and northwest quadrants contributing 0.47 and 0.51 Mg C ha−1 yr−1, respectively. The sum of carbon emissions per quadrant accounts for 88% of the observed values in the total footprint.
The grey and GI areas were then selected throughout the footprint and we combined this EC data to characterize seasonal C-CO2 fluxes (Figure 2) [12]. Overall, the annual carbon budget for GI areas was −5.00 Mg C ha−1 and the seasonal carbon budget in the spring, summer, autumn, and winter were: −1.52, −2.76, −1.02, and 0.30 Mg C ha−1 yr−1, respectively. The annual average CO2 flux for GI was −1.32 μmol m−2s−1. The annual carbon budget for the grey infrastructure areas was 8.17 Mg C/ha, and there were no obvious seasonal changes. The peak CO2 flux values were within the range of 5–8 μmol m−2s−1. The CO2 flux peak value decreased due to the lower traffic flow and reduced human activities at night. The annual average CO2 flux for the grey infrastructure types was 2.16 μmol m−2s−1.
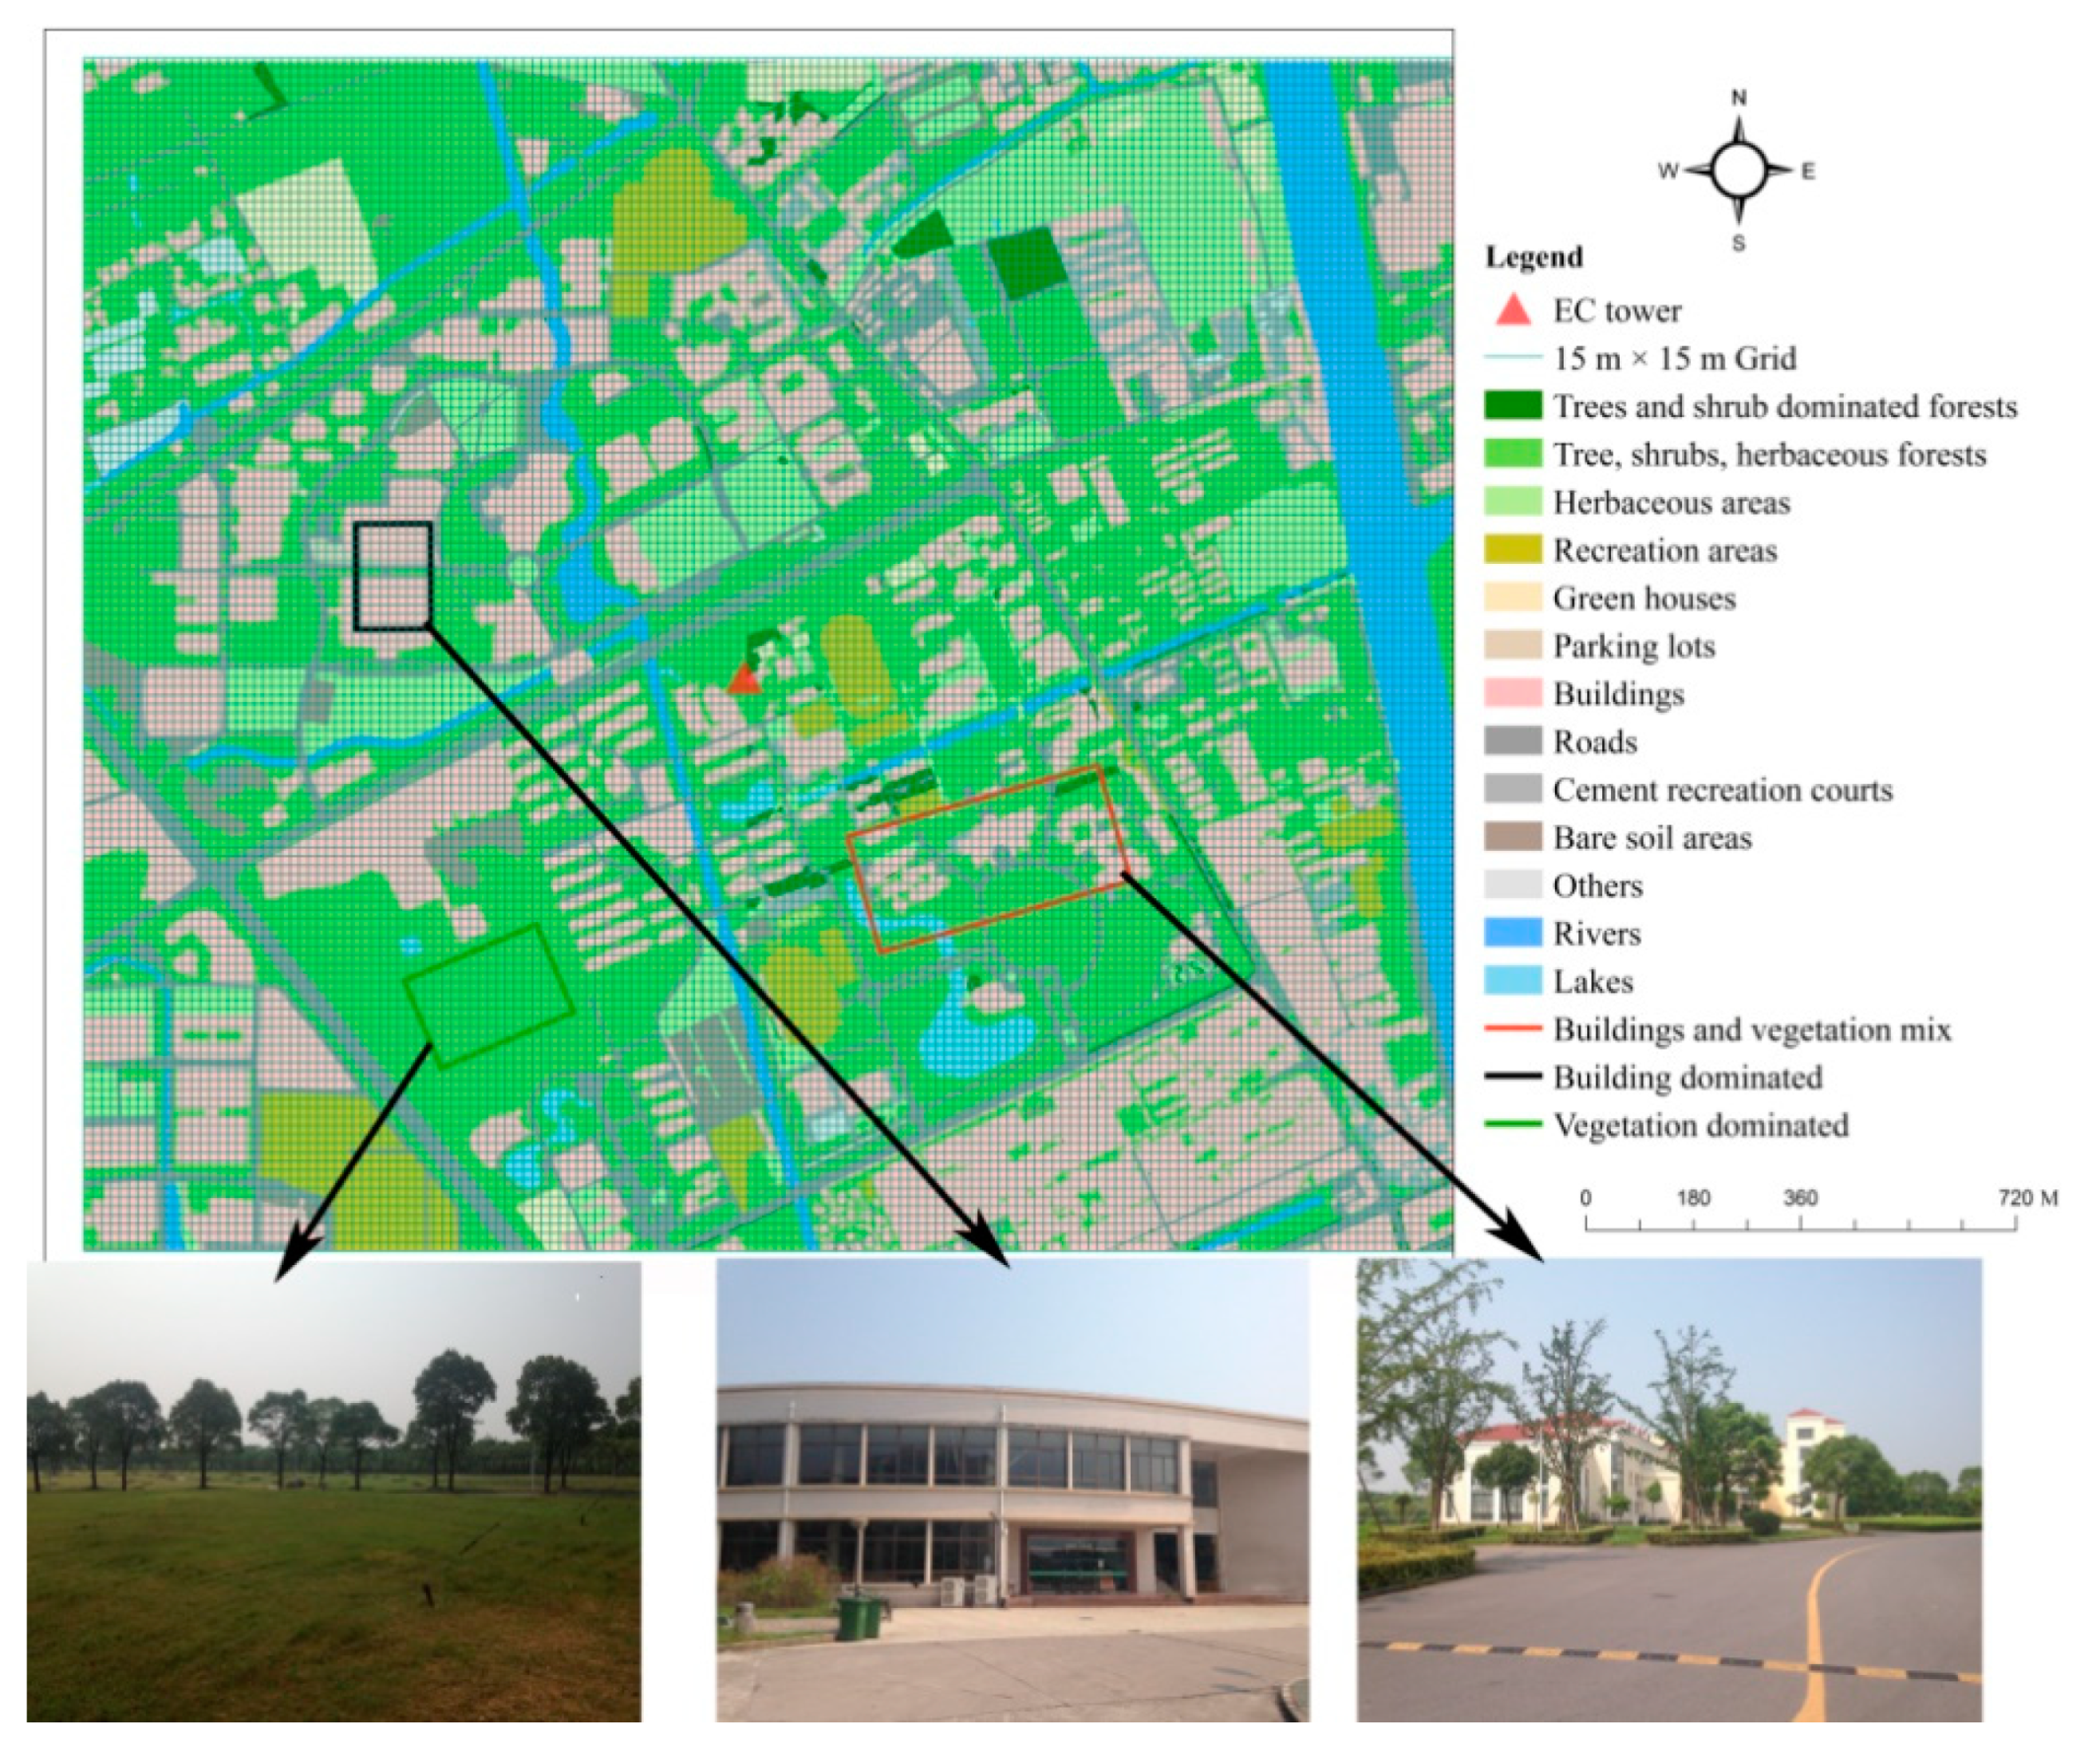
Parsing out the C-CO2 flux of exclusively treed patches versus other areas of mixed vegetation is not possible as conventional EC studies the sum of all vegetation, soils, water, and other attributes in a given area [12]. Thus, hereafter we refer to patches of grey infrastructure and urban forests, or tree-dominated GI. Accordingly, we used three specific patches in the footprint of approximately 400 m2 to represent: Urban forests, a mix of buildings and GI, and building-dominated grey infrastructure (Figure 3). An ideal annual average value was estimated according to the CO2 flux in the three patches (Equation (1)) [18,23,25]. The Fic is the ideal value (Annual average, μmol m−2 s−1), AGreen is the tree-dominated GI/urban forest area (ha), AGrey is the area of the grey infrastructure (ha), and Atest is the study area (ha). The calculated annual average value is the calculated ART Footprint Tool CO2 flux of the study area. The ideal and calculated values for urban forests, grey infrastructure, and mixed were −1.32 and −1.11, 2.16, and 2.48 and mixed were 0.42 and 0.95 μmol m−2s−1, respectively. By comparing the differences between the ideal and the calculated values, we determined the accuracy of the CO2 fluxes for the different patches.
The difference between the ideal and calculated value for the buildings plus GI patch was 0.53 μmol m−2s−1 and differed greatly, relative to the difference between the ideal and calculated value for the vegetation and buildings. The difference of 0.53 μmol m−2s−1 was within the acceptable error range, relative to the predicted CO2 flux values [13].
4. Discussion and Conclusions
Our measured C-CO2 fluxes were similar to other studies, despite the climatic and GI compositional differences [11]. Vesala et al. [12] found that vegetation in an area in Helsinki, Finland, had a C-CO2 flux of less than 5 μmol m−2s–1. A CO2 flux study in the nearby Chongming Island wetlands found that the distribution range under stable atmospheric conditions can reach 378 m [20,26]. The maximum winter CO2 flux in Shenyang China can be 84 μmol m−2s−1 [25], which, noticeably, is different from our grey infrastructure peak value and likely due to greater industrial and heating activities in cooler, northern, inland temperate China. Outside China, EC CO2 fluxes for other cities are reported in Ward et al. [11].
In terms of the CO2 flux contribution for different urban forest-GI types at the landscape scale, we found that the most notable difference was between herbaceous-woody and building-road LULCs; a finding similar to Yao et al., who identified forest cover in the Shanghai, China area as being a driver of C stocks [6]. The contribution of other LULC types in terms of CO2 flux contribution was, however, lower as observed in other studies [5]. Thus, our results show the cumulative influence of these urban forests and other green infrastructure can have on CO2 flux, as opposed to grey infrastructure, on the overall CO2 flux contribution area [2,4,10].
We do note that the main limitation of this short communication is that we used one year of data and we did not analyze water and bare soil LULC types. These areas of “blue and brown” infrastructures are common in urban areas and will likely influence the C-CO2 balance in the study area. But, our short communication presents an approach for future research, such as understanding how water bodies, wetlands, and urban development and construction activities affect the C flux of urban ecosystems and in improving the ART footprint tool functionality to better analyze urban ecosystems. Future studies can use the approach presented here and multiple years of data to better characterize the CO2 budget for other GI types, such as areas planted with native versus non-native vegetation and other high versus low maintenance urban vegetation types. In particular, characterizing their seasonal and annual budgets across time and space could lead to better estimates of their true CO2 offsetting potential.
Multi-scale studies combining geospatial, EC CO2 flux data, and footprint/contribution area models are not common for subtropical, coastal, cities in low-middle income countries. Thus, this short communication demonstrates how long-term, local-scale data, and the ART tool can provide a more accessible and novel approach for modeling urban forest C-CO2 dynamics and heterogeneity in cities. Such information can help us better urban plan, design, and justify the use of urban forests as integral components of nature-based solutions, which are becoming popular in many cities. The research approach presented in the paper can be used to quantify the role of low-carbon cities and local-scale effects of regulating greenhouse gas emissions. This study in subtropical China can also provide a baseline and approach for carbon flux research of the urban environment in other cities in the tropics and subtropics.
Author Contributions
Conceptualization, K.Z., Y.G. and M.Z.; methodology, K.Z. and Y.G.; software, K.Z. and Y.G.; validation, K.Z., Y.G. and M.Z.; formal analysis, Y.G.; investigation, K.Z. and Y.G.; resources, F.E.; data curation, K.Z., Y.G. and X.Z.; writing—original draft preparation, K.Z. and Y.G.; writing—review and editing, F.E., R.B. and M.Z.; visualization, Y.G.; supervision, M.Z.; project administration, M.Z.; funding acquisition, M.Z.
Funding
This research was funded by the National Natural Science Foundation of China, grant number 31100354 and The APC was funded by National Natural Science Foundation of China.
Acknowledgments
This research was funded by the National Natural Science Foundation of China (No. 31100354). We thank Jiemin Wang from the Northwest Institute of Eco-Environment and Resources, Chinese Academy of Sciences for the guidance on the use of footprint models.
Conflicts of Interest
The authors declare no conflict of interest.
Appendix A
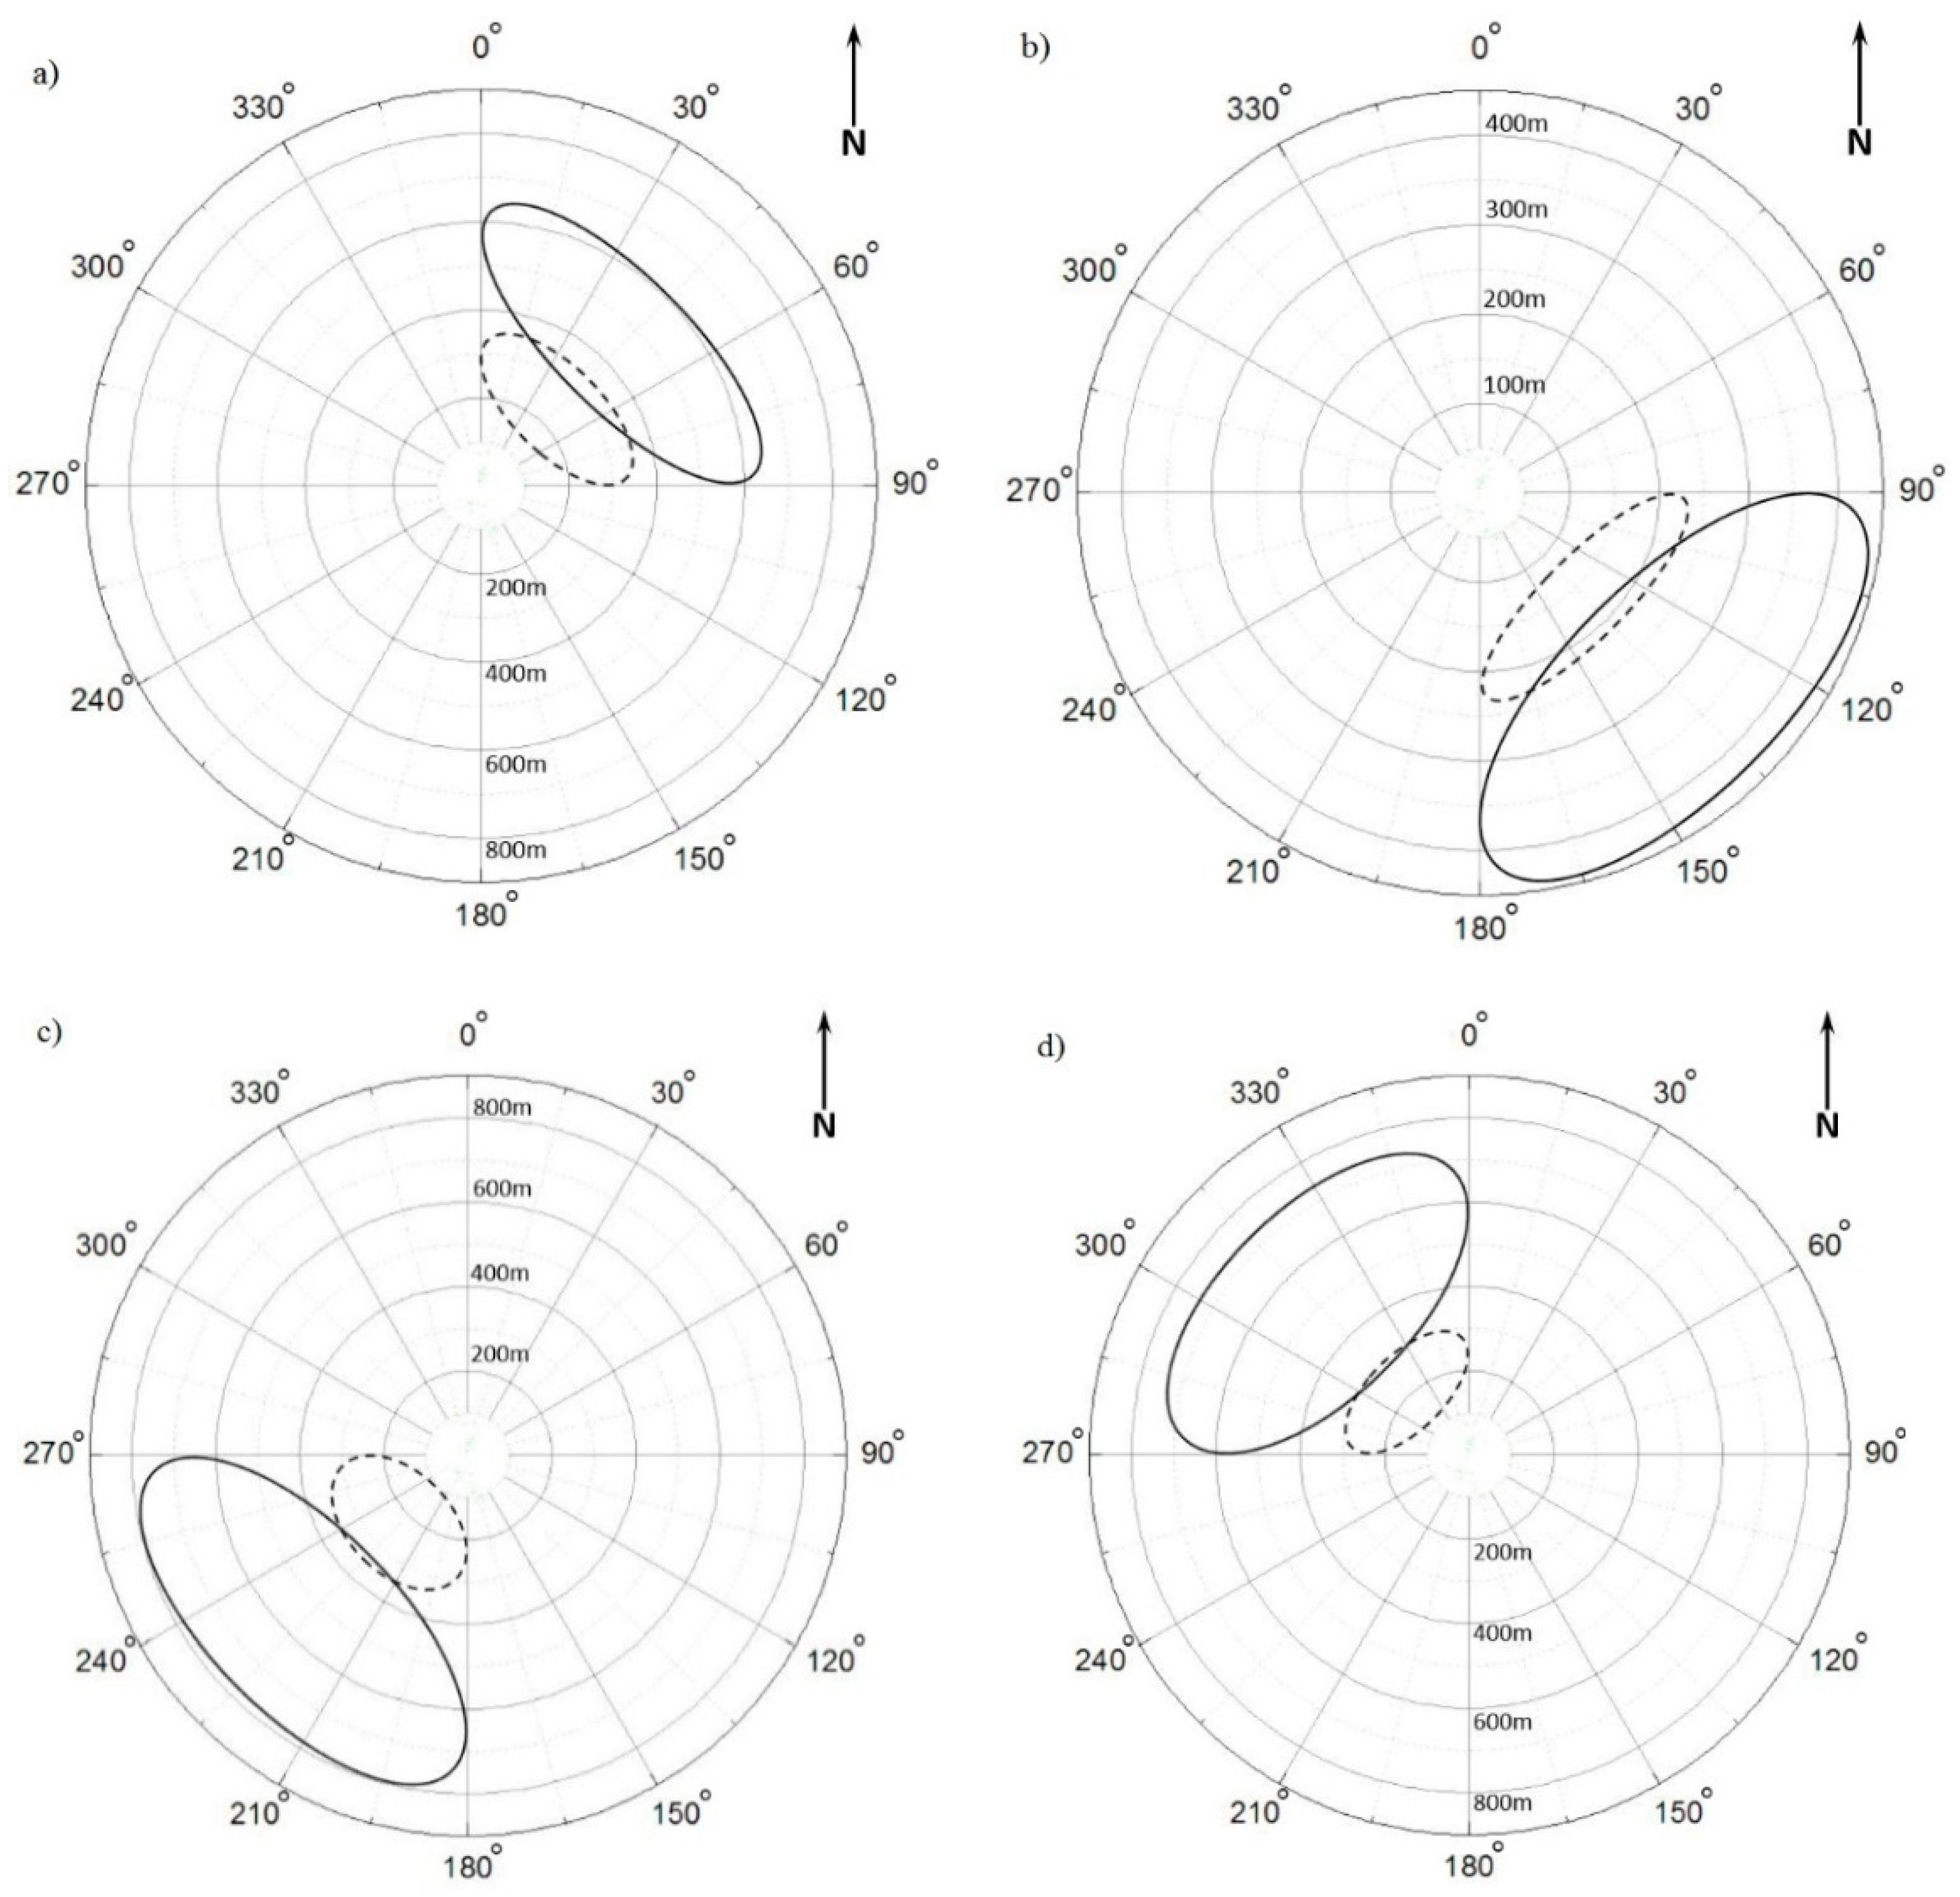
Figure A1.
The farthest point distribution of 90% contribution area for dominate wind directions for different seasons in the Shanghai Fengxian University Campus. (a) Spring; (b) summer; (c) autumn; (d) winter. Solid lines represent stable, dotted line represents unstable atmospheric conditions.
Figure A1.
The farthest point distribution of 90% contribution area for dominate wind directions for different seasons in the Shanghai Fengxian University Campus. (a) Spring; (b) summer; (c) autumn; (d) winter. Solid lines represent stable, dotted line represents unstable atmospheric conditions.

Figure A2.
The Farthest point distribution of 90% contribution area for non-dominant wind directions during four different seasons in the Shanghai Fengxian University Campus. (a) Spring; (b) summer; (c) autumn; (d) winter. Circular shapes with solid lines represent stable, while dotted line represents unstable, atmospheric conditions.

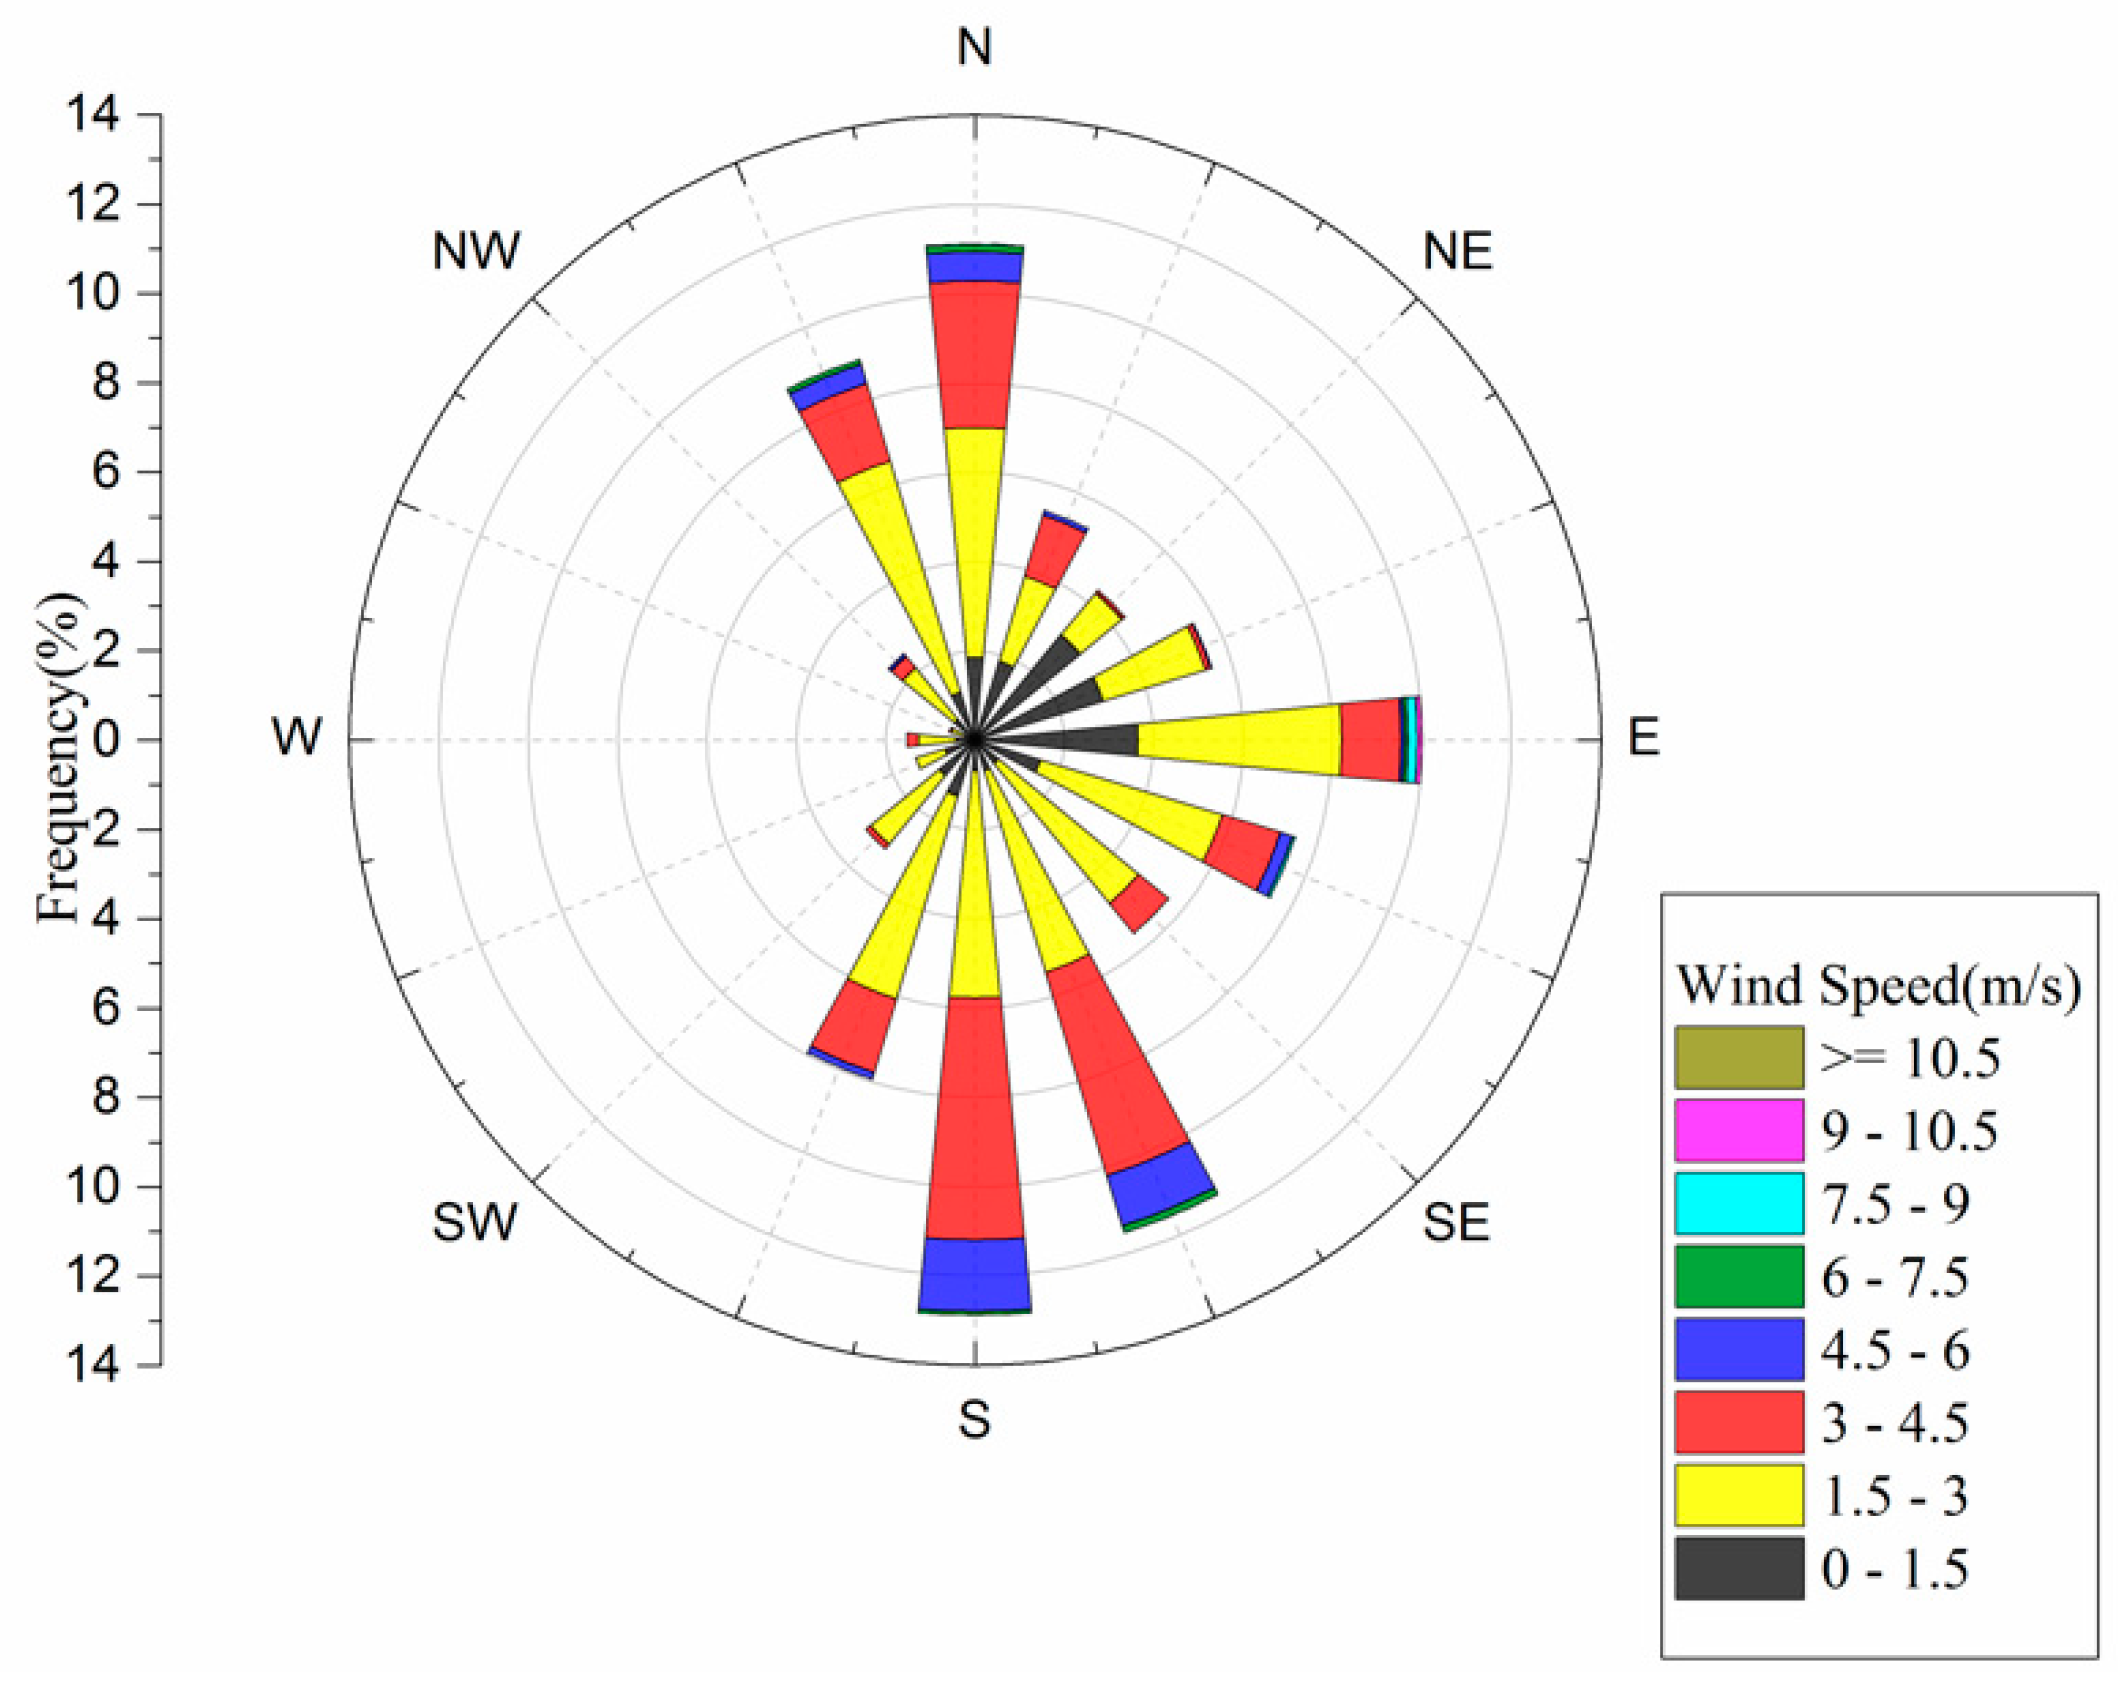
Figure A3.
Wind rose for the Shanghai Fengxian University Campus study landscape from April 2015 to March 2016.
Figure A3.
Wind rose for the Shanghai Fengxian University Campus study landscape from April 2015 to March 2016.

References
- Xie, J.; Jia, X.; He, G.; Zhou, C.; Yu, H.; Wu, Y.; Bourque, C.P.A.; Liu, H.; Zha, T. Environmental control over seasonal variation in carbon fluxes of an urban temperate forest ecosystem. Landsc. Urban Plan. 2015, 142, 63–70. [Google Scholar] [CrossRef]
- Briber, B.M.; Hutyra, L.R.; Dunn, A.L.; Raciti, S.M.; Munger, J.W. Variations in atmospheric CO2 mixing ratios across a Boston, MA urban to rural gradient. Land 2013, 2, 304–327. [Google Scholar] [CrossRef]
- Escobedo, F.J.; Giannico, V.; Jim, C.Y.; Sanesi, G.; Lafortezza, R. Urban Forests, Ecosystem Services, Green Infrastructure and Nature-Based Solutions: Nexus or Evolving Metaphors. Urban For. Urban Green. 2019, 37, 3–12. [Google Scholar] [CrossRef]
- Guidolotti, G.; Calfapietra, C.; Pallozzi, E.; De Simoni, G.; Esposito, R.; Mattioni, M.; Nicolini, G.; Matteucci, G.; Brugnoli, E. Promoting the potential of flux-measuring stations in urban parks: An innovative case study in Naples, Italy. Agric. For. Meteorol. 2017, 233, 153–162. [Google Scholar] [CrossRef]
- Gioli, B.; Gualtieri, G.; Busillo, C.; Calastrini, F.; Zaldei, A.; Toscano, P. Improving high resolution emission inventories with local proxies and urban eddy covariance flux measurements. Atmos. Environ. 2015, 115, 246–256. [Google Scholar] [CrossRef]
- Yao, X.; Zhao, M.; Escobedo, F.J. What causal drivers influence carbon storage in Shanghai, China’s Urban and Peri-Urban Forests. Sustainability 2017, 9, 577. [Google Scholar] [CrossRef]
- Zhao, M.; Kong, Z.H.; Escobedo, F.J.; Gao, J. Impacts of urban forests on offsetting carbon emissions from industrial energy use in Hangzhou, China. J. Environ. Manag. 2010, 91, 807–813. [Google Scholar] [CrossRef] [PubMed]
- Barles, S. Urban metabolism of Paris and its region. J. Ind. Ecol. 2009, 13, 898–913. [Google Scholar] [CrossRef]
- Velasco, E.; Perrusquia, R.; Jiménez, E.; Hernández, F.; Camacho, P.; Rodríguez, S.; Retama, A.; Molina, L.T. Sources and sinks of carbon dioxide in a neighborhood of Mexico City. Atmos. Environ. 2014, 97, 226–238. [Google Scholar] [CrossRef]
- Awal, M.A.; Ohta, T.; Matsumoto, K.; Toba, T.; Daikoku, K.; Hattori, S.; Hiyama, T.; Park, H. Comparing the carbon sequestration capacity of temperate deciduous forests between urban and rural landscapes in central Japan. Urban For. Urban Green. 2010, 9, 261–270. [Google Scholar] [CrossRef]
- Ward, H.C.; Kotthaus, S.; Grimmond, C.S.B.; Bjorkegren, A.; Wilkinson, M.; Morrison, W.T.J.; Evans, J.G.; Morison, J.I.L.; Iamarino, M. Effects of urban density on carbon dioxide exchanges: Observations of dense urban, suburban and woodland areas of southern England. Environ. Pollut. 2015, 198, 186–200. [Google Scholar] [CrossRef] [PubMed] [Green Version]
- Vesala, T.; Järvi, L.; Launiainen, S.; Sogachev, A.; Rannik, Ü.; Mammarella, I.; Siivola, E.; Keronen, P.; Rinne, J.; Riikonen, A.; et al. Surface–atmosphere interactions over complex urban terrain in Helsinki, Finland. Tellus Ser. B-Chem. Phys. Meteorol. 2008, 60, 188–199. [Google Scholar] [CrossRef]
- Neftel, A.; Spirig, C.; Ammann, C. Application and test of a simple tool for operational footprint evaluations. Environ. Pollut. 2008, 152, 644–652. [Google Scholar] [CrossRef] [PubMed]
- Gong, Y.; Zhao, M.; Yao, X.; Guo, Z.J.; He, Y.; Zhang, L.P. Analysis and comparison of carbon flux contribution zones in urban ecological system based on Hsieh and Kljun models. J. Environ. Eng. Technol. 2017, 7, 225–231. (In Chinese) [Google Scholar]
- Gong, Y.; Guo, Z.J.; Zhang, K.D.; Xu, L.; Wei, Y.Y.; Zhao, M. Impact of vegetation on CO2 flux of a subtropical urban ecosystem. Acta Ecol. Sin. 2019, 39, 530–541. [Google Scholar]
- Mauder, M.; Foken, T. Documentation and instruction manual of the eddy covariance software package TK2. Univ. Bayreuth Abt. Mikrometeorologie 2004, 26, 1614–8916. [Google Scholar]
- Finkelstein, P.L.; Sims, P.F. Sampling error in eddy correlation flux measurements. J. Geophys. Res. Atmos. 2001, 106, 3503–3509. [Google Scholar] [CrossRef]
- Gong, Y. A Study on Spatial Differentiation of Carbon Flux Based on Footprint Model A Case Study of Fengxian University City in Shanghai. Master Dissertation, Shanghai Normal University, Shanghai, China, 2017. (In Chinese). [Google Scholar]
- Falge, E.; Baldocchi, D.; Olson, R.; Anthoni, P.; Aubinet, M.; Bernhofer, C.; Granier, A. Gap filling strategies for defensible annual sums of net ecosystem exchange. Agric. For. Meteorol. 2001, 107, 43–69. [Google Scholar] [CrossRef] [Green Version]
- Gu, Y.J.; Gao, Y.; Guo, H.Q.; Zhao, B. Footprint Analysis for carbon flux in the wetland ecosystem of Chongming Dongtan. J. Fudan Univ. 2008, 47, 374–379. (In Chinese) [Google Scholar]
- Liu, Y.J.; Hu, F.; Cheng, X.L.; Song, Z.P. Distribution of the source area and footprint of Beijing. Chin. J. Atmos. Sci. 2014, 38, 1044–1054. (In Chinese) [Google Scholar]
- Hsieh, C.I.; Katul, G.; Chi, T.W. An approximate analytical model for footprint estimation of scalar fluxes in thermally stratified atmospheric flows. Adv. Water Resour. 2000, 23, 765–772. [Google Scholar] [CrossRef]
- Guo, Z.J. Carbon Footprint Flux Analysis of Urban Underlying Surface: A Case Study of Fengxian University City in Shanghai. Master Dissertation, Shanghai Normal University, Shanghai, China, 2018. (In Chinese). [Google Scholar]
- Guo, Z.J.; Gong, Y.; Zhang, K.D.; Zhang, L.P.; He, Y.; Xu, L.; Zhao, M. CO2 flux footprints of impervious layer on complex land surface: A case study at the Fengxian College Park, Shanghai. Acta Sci. Circumstantiae 2018, 38, 772–779. (In Chinese) [Google Scholar]
- Jia, Q.Y.; Zhou, G.S.; Wang, Y. Footprint characteristics of CO2 flux over the urban district of Shenyang. Acta Sci. Circumstantiae 2010, 30, 1682–1687. (In Chinese) [Google Scholar]
- Wang, J.T.; Zhou, J.H.; Ou, Q.; Zhong, Q.C.; Wang, K.Y. CO2 flux footprint analysis of coastal polder wetlands in Dongtan of Chongming. J. Ecol. Rural Environ. 2014, 30, 588–594. (In Chinese) [Google Scholar]
Figure 1.
The eddy covariance footprint’s grid, quadrants, and 26 polygons representing green (vegetation dominated cells) and grey infrastructure (building and impervious dominated cells) patches in the university campus study landscape near Shanghai, China.
Figure 1.
The eddy covariance footprint’s grid, quadrants, and 26 polygons representing green (vegetation dominated cells) and grey infrastructure (building and impervious dominated cells) patches in the university campus study landscape near Shanghai, China.

Figure 2.
Daily C-CO2 fluxes (gC m−2 day−1) for the university campus study footprint near Shanghai, China from 1st April 2015 to 31st March 2016.
Figure 2.
Daily C-CO2 fluxes (gC m−2 day−1) for the university campus study footprint near Shanghai, China from 1st April 2015 to 31st March 2016.

Figure 3.
Selected local-scale patches in the study landscape. From left to right are: Urban forests (100% trees and grass), grey infrastructure (100% building impervious), and a mixed patch (50% grey infrastructure, 50% green infrastructure).
Figure 3.
Selected local-scale patches in the study landscape. From left to right are: Urban forests (100% trees and grass), grey infrastructure (100% building impervious), and a mixed patch (50% grey infrastructure, 50% green infrastructure).

© 2019 by the authors. Licensee MDPI, Basel, Switzerland. This article is an open access article distributed under the terms and conditions of the Creative Commons Attribution (CC BY) license (http://creativecommons.org/licenses/by/4.0/).
Share and Cite
MDPI and ACS Style
Zhang, K.; Gong, Y.; Escobedo, F.J.; Bracho, R.; Zhang, X.; Zhao, M. Measuring Multi-Scale Urban Forest Carbon Flux Dynamics Using an Integrated Eddy Covariance Technique. Sustainability 2019, 11, 4335. https://doi.org/10.3390/su11164335
AMA Style
Zhang K, Gong Y, Escobedo FJ, Bracho R, Zhang X, Zhao M. Measuring Multi-Scale Urban Forest Carbon Flux Dynamics Using an Integrated Eddy Covariance Technique. Sustainability. 2019; 11(16):4335. https://doi.org/10.3390/su11164335
Chicago/Turabian StyleZhang, Kaidi, Yuan Gong, Francisco J. Escobedo, Rosvel Bracho, Xinzhong Zhang, and Min Zhao. 2019. "Measuring Multi-Scale Urban Forest Carbon Flux Dynamics Using an Integrated Eddy Covariance Technique" Sustainability 11, no. 16: 4335. https://doi.org/10.3390/su11164335
Note that from the first issue of 2016, this journal uses article numbers instead of page numbers. See further details here.