Market-Based Instruments for Managing Hazardous Chemicals: A Review of the Literature and Future Research Agenda


1
Gothenburg Centre for Sustainable Development, University of Gothenburg, Box 170, 40530 Gothenburg, Sweden
2
Tropical Agricultural Research and Higher Education Center (CATIE), Cartago, Turrialba 30501, Costa Rica
*
Author to whom correspondence should be addressed.
Sustainability 2019, 11(16), 4344; https://doi.org/10.3390/su11164344
Submission received: 28 June 2019
/
Revised: 6 August 2019
/
Accepted: 7 August 2019
/
Published: 11 August 2019
(This article belongs to the Special Issue Economics of Environmental Taxes and Green Tax Reforms)
Abstract
:We take stock of the lessons learned from using market-based instruments in chemicals management and discuss the potential for increased use of risk-based taxation in the management of pesticides and other hazardous chemicals. Many chemical substances cause significant diffuse emissions when emitted over wide areas at individually low concentrations. These emissions are typically very difficult and costly to control. The targeted chemical may exist in many products as well as in a wide variety of end uses. However, the current regulatory instruments used are primarily bans or quantitative restrictions, which are applied to individual chemicals and for very specific uses. Policy makers in the area of chemicals management have focused almost solely on chemicals with a very steep marginal damage cost curve, leading to low use of price regulations. The growing concerns about cumulative effects and combination effects from low dose exposure from multiple chemicals can motivate a broader use of market-based instruments in chemicals management.
1. Introduction
Policy instrument choice in the area of chemicals is surrounded by uncertainties in terms of the damage costs from chemical production and consumption as well as the abatement or substitution costs of replacing chemicals of concern. In a seminal paper, Weitzman shows that the assumptions made under uncertainty about the marginal damage costs and marginal abatement costs are fundamental to the choice of policy instrument [1]. When there are reasons to assume that the marginal damage cost rises sharply with use, for example due to threshold effects, and the marginal cost of abatement is comparatively low, then a quantitative restriction is generally more efficient than a price-type instrument. When there are reasons to assume that the marginal damage cost is not rising sharply with use but the marginal abatement cost is high, a tax or other price-type instrument is usually more efficient than a quantitative instrument.
Chemicals policy has traditionally focused on reducing the risk from chemicals where damage costs are known to be high, such as lead and PCB (polychlorinated biphenyls). Hence, quantitative restrictions through bans and permits have been the most common policy instruments in chemicals management. There is growing concern about the combined effect on health and ecosystems from low-dose exposure to multiple chemicals, as the production of synthetic chemicals have grown very rapidly during last decades [2]. Only a fraction of the more than 140,000 industrial chemicals that have been synthesized since 1950 have undergone rigorous testing for safety or toxicity [3]. Recent studies indicate that chemical pollution carries larger health and environmental costs than previously documented [3,4] . Indicative examples include substantial health and environmental costs associated with the diffuse and widespread pollution from PFAS (per- and polyfluoroalkyl substances) [5] and large costs linked to the effects of endocrine disrupting substances on male reproductive health and other health endpoints [6,7,8].
A focus on reducing the pressure from not only substances of very high concern but also from broader groups of chemicals and chemical products could motivate a larger use of market-based instruments in chemicals management [9]. Developments in this direction include taxation of pesticides in several European countries [10] and taxation of flame retardants in electronic products, chlorinated solvents and products containing phthalates and PVC (Polyvinyl chloride) in Scandinavia [11,12]. The Swedish government has also announced that a tax on hazardous chemicals in clothes and shoes will be implemented.
The two main arguments in favor of market-based instruments is that they can be more cost-effective in reducing use, and better at promoting innovation than bans, use restrictions and technology standards [13,14]. These command and control policies typically allow for very little flexibility in the means of achieving specific targets. As a result, all firms need to meet the same target, irrespective of how costly the change is. However, the cost for complying with a ban or use restriction often differs between companies, due to, for example, differences in production processes and sunk costs from technology investments. Ignoring these differences in costs for substituting hazardous chemicals between firms reduces cost-effectiveness.
By making the use of a certain chemical more costly, market-based instruments—in contrast with standards and permits—provide a continuous incentive for substitution with less hazardous alternatives. Companies have an incentive to substitute the targeted chemical as long as their marginal cost of substitution is lower than the cost of using the targeted chemical. By allowing firms with different substitution costs to reduce use at different scales, market-based instruments can incentivize a cost-effective reduction in the use of the targeted chemical. Moreover, by increasing the cost of using a specific chemical, taxes and charges can also spur innovation and search for new alternatives to the relatively more expensive input. Ideally, market-based instruments should target groups of substances with similar chemical structure in order to avoid regretful substitution where companies shift to using a close substitute with similar properties as the targeted chemical.
While market-based instruments have some merits, there are many situations where their use is less appropriate. For example when the health or environmental damages increase steeply due to increased exposure to a hazardous chemical, where effects are location-specific, and where threshold effects, i.e., an abrupt spike in the damage function after a given threshold, are likely. In such situations, bans and use restrictions are more appropriate [1,15].
The design of policy instruments has different levels of technical complications at different stages of the life cycle of chemicals—i.e. the design of chemicals and chemical products, their use as input into the production of goods and services, as part of a finished good or service, and as waste. From an economic efficiency point-of-view, it is desirable to target policy instruments towards specific environment or health damages as closely as possible. Formally, an optimal (green) tax should be set such that the marginal damage is equal to the marginal benefit of using the chemical. However, information on the relation between the given chemical and its damage function in the different stages of the chemical life-cycle is costly to obtain. Besides uncertainties regarding the hazard profiles of chemicals there are often also large uncertainties regarding the damage costs from different use and exposure scenarios. In some cases, the main damage stems from point sources, such as industrial plants for production or recycling. In other cases, the damage costs arise from diffuse sources when millions of consumers use products containing chemicals. There may also be large spatial variations in damage costs from for example the use of fertilizers and pesticides [12]. It can therefore be complicated to develop differentiated taxes based on specific damage estimates for different uses. Alternatively an input tax can lower the overall use of a specific chemical and can be easier to administrate as the number and diversity of producers is far more limited than at later stages. However, an input tax may risk unduly restricting less harmful applications of the targeted chemical [16]. In practice there are many context-specific factors—such as information constraints, administrative costs, distributional effects, and political economy pressures—that determine which policy instruments are most effective and feasible to implement.
In this paper we take stock of the extent and lessons-learned from using market-based instruments for chemicals management, we outline key considerations policy makers face when designing policy instruments for chemicals management and identify an agenda for further research. We discuss the effectiveness, benefits and challenges of market-based instruments within the broader array of possible policy instruments in the particular context of chemical management. While there are several reviews of the use of market-based instruments for environmental management in general, e.g., references [13,14,17,18,19], there are relatively few studies reviewing the use of market-based instruments for chemicals management [10,12,16,20,21,22].
The next section describes the methodology used in our review of the use of market-based instruments for chemicals management. Section 3 presents the results of the review. In the concluding section, we discuss our results and outline some opportunities for further research.
2. Materials and Methods
A review of the scientific literature was conducted in the following steps. First, a literature search was performed in the database Econlit using a set of 32 keywords combinations (see Appendix A). Then, 324 hits in the time period 2007–2017 were evaluated for their relevance using pre-defined quality criteria. As we found a relatively limited number of relevant articles in Econlit, additional literature was identified by including literature citing the original hits and by searching additional scientific data-bases. Gray literature was retrieved from web searches as well as through contacts with experts (see acknowledgements).
We reviewed the OECD database on policy instruments for the environment [23] using a selection of relevant instruments from the environmental domains “land contamination”, “ozone layer protection” and “waste management” for 107 countries (OECD countries and additional countries). The results are summarized in Appendix B.
Despite our efforts, this review should not be seen as an exhaustive account of all cases of market-based instruments used for chemicals management. It rather illustrates some of the applications as well as considerations policy makers face in policy instrument design. It should also be noted that the review of the effectiveness of market-based instruments in chemicals management is hampered by an unfortunate lack of formal evaluations of effectiveness found in the existing literature. The review focuses on market-based instruments targeting chemicals manufactured for commercial use and does not cover instruments targeting chemicals created as by-products during production or use, such as carbon dioxide and, nitrogen dioxide. The review does not cover petrochemicals. An additional caveat is that this review focuses on market-based instruments which generate incentives through affecting the relative price of chemicals and chemical products. Other instruments, which can create incentives for behavioral change, such as nudges, information campaigns or labeling systems are not covered.
3. Experiences from Using Market-Based Instruments in Chemicals Management
3.1. Limited but Increasing Use of Market-Based Instruments for Managing Hazardous Chemicals
A typology of market-based instruments used in chemicals management and examples of applications found in the review are displayed in Table 1.
Figure 1 reports the number of applications of market-based instruments in chemicals management found in the analysis of the The Organisation for Economic Co-operation and Development (OECD) data base Policy Instruments for the Environment (see also Appendix B). With 45 and 50 applications, respectively, taxes and fees are the most commonly used market based instruments. There were 15 cases where deposit-refund systems were used and tradable permit systems were used in chemicals management in only three cases.
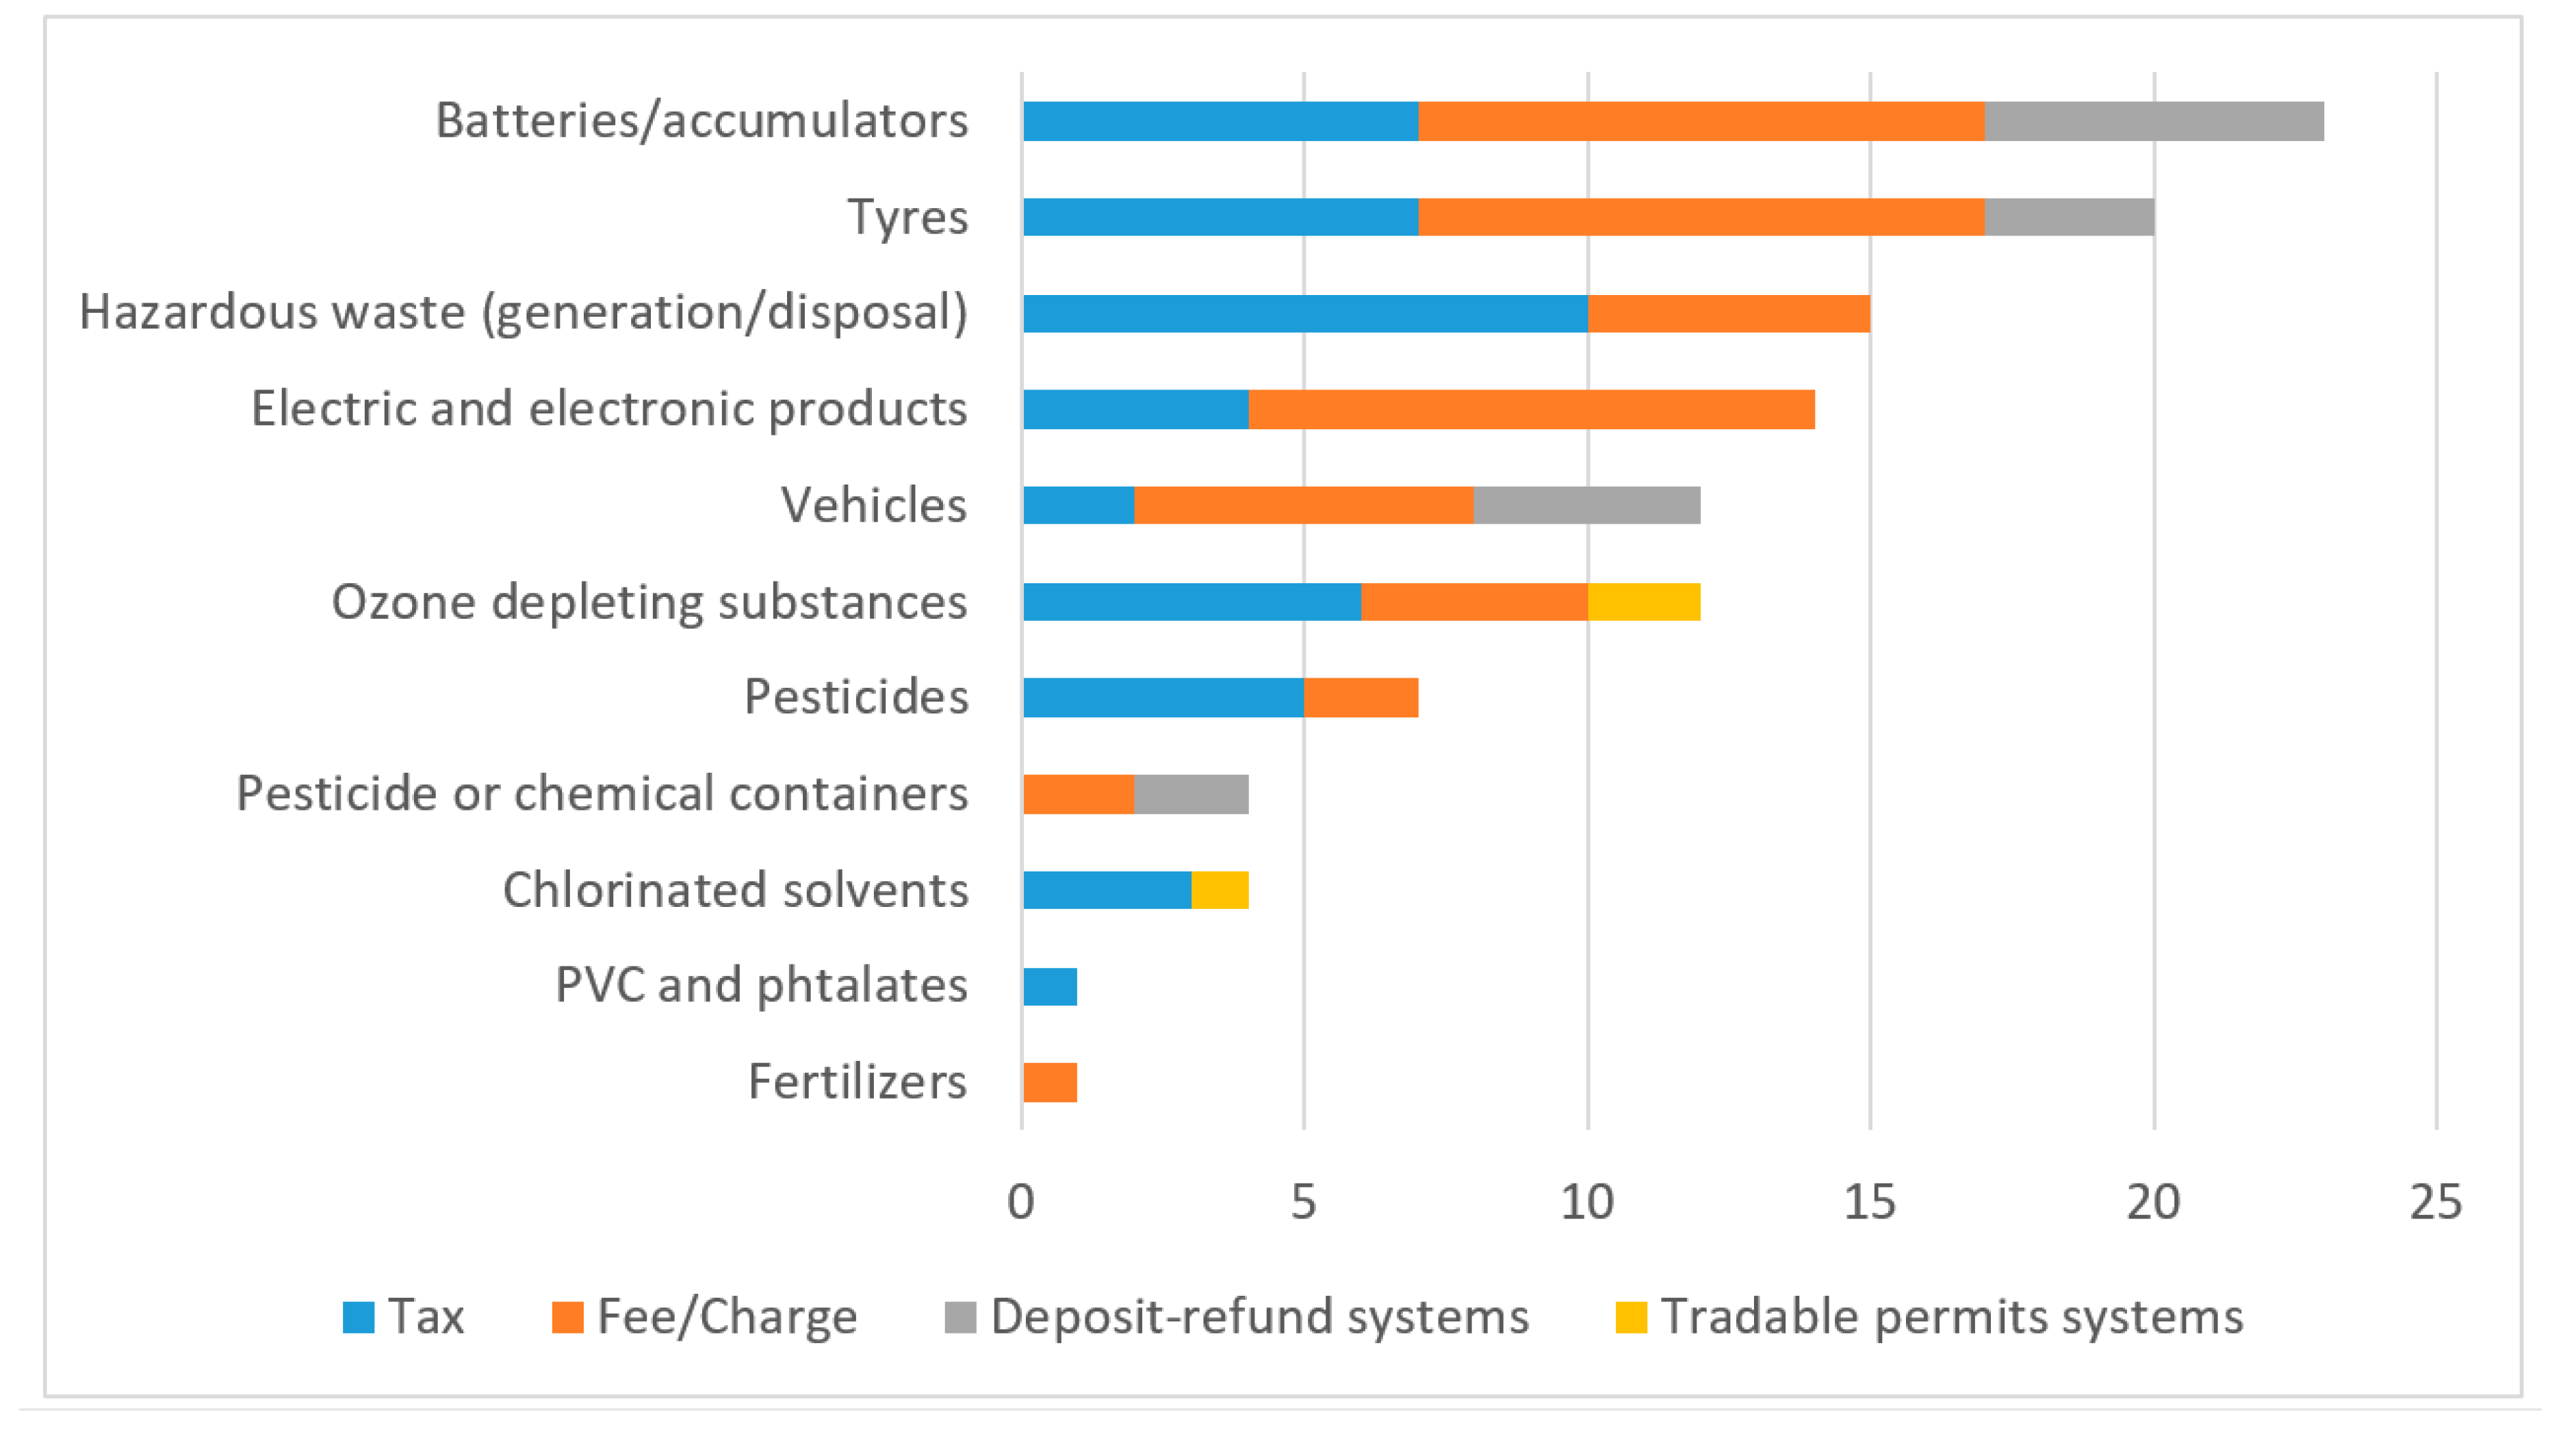
Figure 2 reports the number of countries that use the different instruments in relation to specific subject areas.
The most frequent use of market-based instruments is for hazardous waste management. Taxes, fees and charges and to some extent also deposit-refund systems are frequently applied for products such as tyres, batteries, accumulators, electrical and electronic products, vehicles, and other aspects of hazardous waste management. A few countries also use charges or deposit-refund systems for containers made for pesticides and other chemicals. The use of market-based instruments for other aspects of chemicals management is less frequent. Taxes and charges are imposed on pesticides, fertilizers, ozone-depleting substances and chlorinated solvents. Tradable permit systems are found for ozone-depleting substances and chlorinated solvents. While it is likely that some uses of market-based instruments for chemicals management are not included in the figures, and that some of the instruments included are no longer active, the information indicates that the use of market-based instruments for chemicals management is relatively limited, not least in comparison with other policy areas.
Market-based instruments have been applied at different stages of the lifecycle of chemicals and products. For example, US producers and manufacturers of chemicals were involved in tradable permit schemes intended to incentivize refineries to phase out lead in petrol during 1982–1987, and in the phasing out of ozone depleting substances in the early 1990s [17]. The Norwegian tax on trichloroethylene and perchloroethylene introduced in 2000 is an example where the inputs to the metal manufacturing industry and dry-cleaning facilities have been targeted [25]. The taxes on phthalates and PVC in Denmark [31] and on flame-retardants in electronic products in Sweden are example of taxes targeting consumer products but where it is the agent importing or selling the product who pays the tax [32]. Taxes or fees on the disposal of hazardous waste in landfills are common examples of market-based instruments targeting the disposal stage in the lifecycle of chemicals.
3.2. Taxes on Inputs to Prodution
3.2.1. Taxes on Chlorinated Solvents
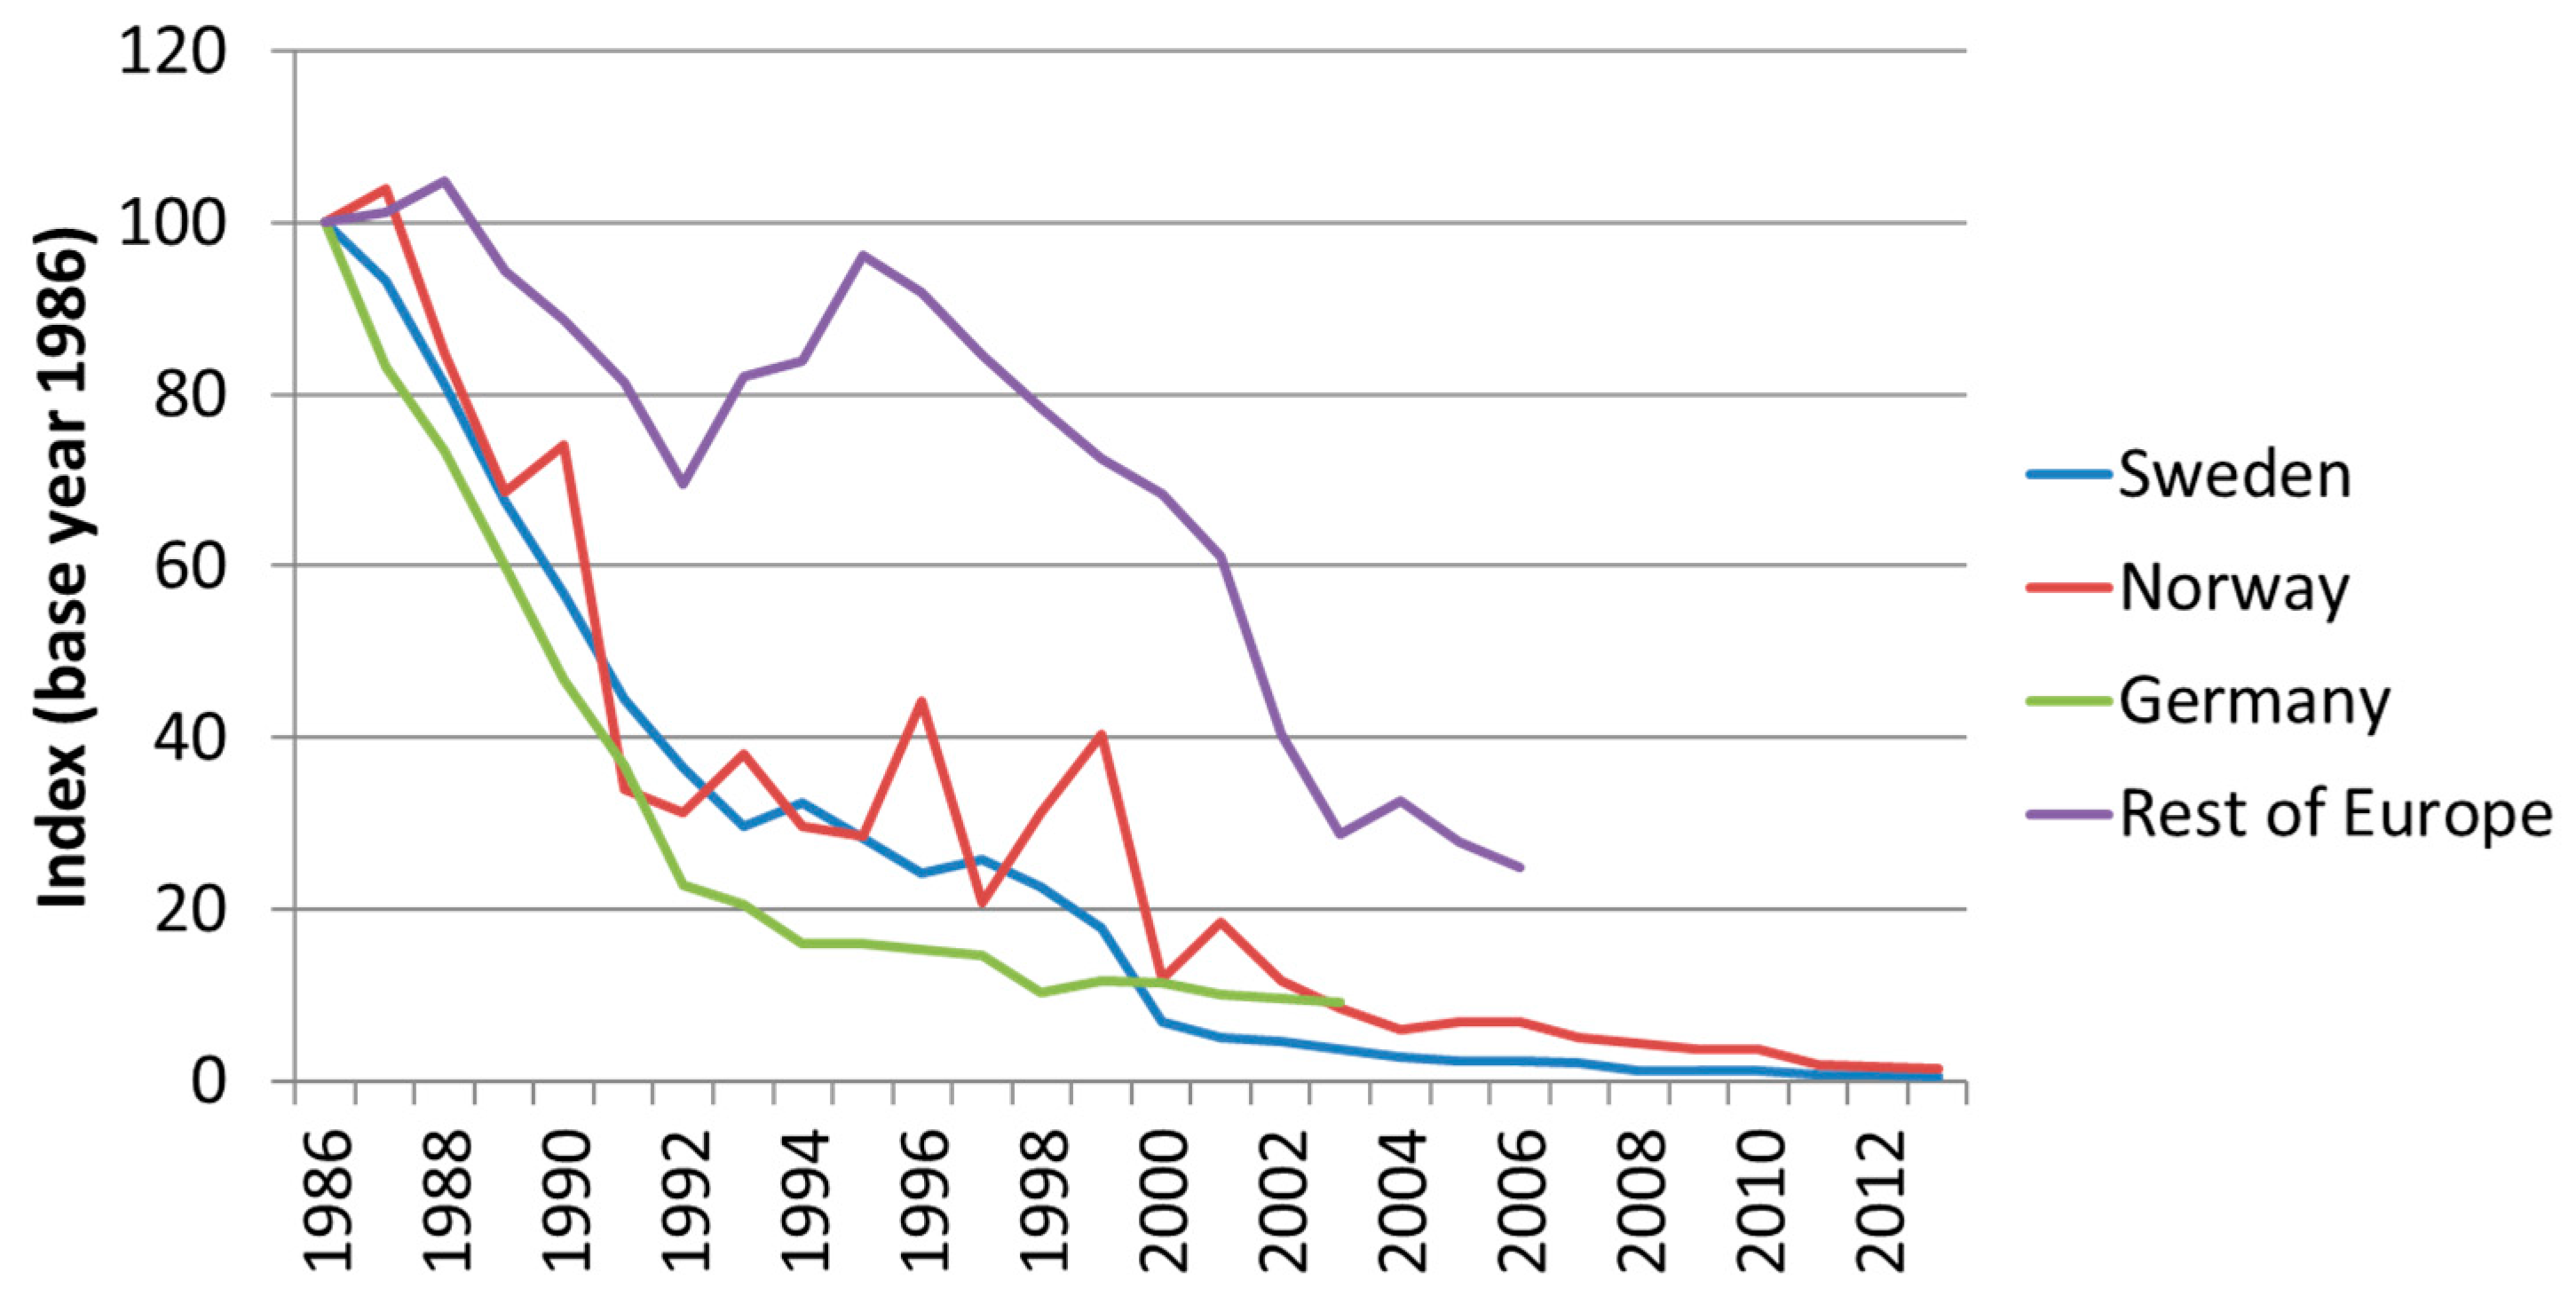
In year 2000, Norway introduced a tax on Trichloroethylene (TCE) and perchloroethylene (PER), of 50 NOK per kilo (~5 EUR). About 40% of the tax was returned when disposing waste containing either of the two substances [18]. The tax led to a rapid reduction in the use of the two solvents. The effectiveness of the tax can be compared with that of the ban on TCE in Sweden that came into force in 1996 and the tough emission standards for equipment using chlorinated solvents for metal degreasing introduced in Germany in the early 1990s [25]. Figure 3 plots the phase-out rates in the three countries compared with the rest of Europe. A reduction in the use of TCE took place already before the introduction of these policy instruments. During the second half of the 1980s, larger industries in several countries were faced with emission standards and tighter exposure limits which commonly led to the adoption of closed systems with carbon filters, which implied quite a drastic reduction in use of TCE for metal degreasing [25].
The use of TCE has decreased more rapidly in Sweden, Norway and Germany—the countries that actively tried to reduce the use and exposure of TCE—compared with the less-stricter policies of the majority of other European countries, where emissions have declined only very gradually. Comparing the use in Sweden and Norway, we find that a ban is not necessarily more effective than market-based instruments in quickly reducing use and emissions. The difficulties that Swedish authorities encountered in enforcing the ban led to a continued use of TCE in Sweden many years after the ban entered into force in 1996. The Norwegian tax is likely to have been the instrument that was easiest to administer. The tough German regulations of emissions may have been the most effective in addressing exposure to TCE in the short run [25,33].
3.2.2. Taxes on Agrochemicals
Pesticides (such as herbicides, insecticides, fungicides and rodenticides) and chemical fertilizers play a critical role in increasing agricultural productivity. However, their use can have severe negative health and environmental effects, but show high variability in time and space. With few exceptions, agrochemical pollution originates from non-point sources, from multiple agents, that are very difficult (or very expensive) to monitor. Hence, controlling agricultural non-point source pollution poses many challenges to the design of policy instruments and market-based instruments typically form part of broader policy packages [35,36].
Several European countries, including Austria, Belgium, Finland, Denmark, Norway and Sweden, have applied input taxes on fertilizers based on the weight of nitrogen and phosphorus. Sweden has also taxed cadmium by the gram in fertilizer. In contrast, the Netherlands previously had a tax scheme that targeted expected emissions with a tax on soil phosphorous and nitrogen surplus, based on thresholds and a block rate structure [24].
However, many countries have abolished their fertilizer taxation schemes. The Dutch system was abolished in 2006 after a court ruling that it violated certain aspects of the EU Nitrate directive [24]. Austria and Finland removed their fertilizer taxes, arguing that they had a negative impact on agricultural sector competitiveness after they joined the EU in 1994. Sweden kept these types of taxes until 2010 when they were removed to improve the competitiveness of the Swedish agricultural sector. Since the price elasticity of the demand for fertilizers is generally low, high taxes are needed to induce a substantial reduction in demand. Fertilizer taxes have also been criticized for their low effectiveness in actually reducing water pollution. Regulatory limits on nitrogen fertilizers may be more effective [36].
Pesticide taxes have commonly been based on per unit taxes for all pesticides, leading to the same tax rate on products differing in relative toxicity. In some cases, taxes have been charged as a percentage of the price of the pesticide. However, this has the effect that a major user of pesticides pays a lower tax per unit of pesticide than smaller users [36].
Several countries, including Denmark, Norway, France, and Mexico, have recently begun to use risk-differentiated taxation of pesticides to incentivize farmers to use less hazardous pesticides. In Norway, a new taxation scheme for pesticides was introduced in 1999. Instead of the former ad valorem tax, pesticides were classified in different risk categories with higher taxation in the higher risk categories. The tax is estimated using two rates: A base rate and an additional rate. For the base rate, pesticides are classified using seven categories and the tax baseline was initially set at 25 NOK/hectare (around 3 EUR), which is then multiplied by a factor associated with the category of each pesticide (between 0.5 and 150). The additional rate is estimated according to the maximum recommended dose for the main crop in the field.
Figure 4 indicates that a shift towards using more of the relatively less hazardous pesticides has taken place after Norway introduced the differentiated pesticide taxation [37]. However, the tax has only led to a slight reduction in overall pesticide use. Later assessments have shown reductions in both violations of maximum allowed water nutrient levels and the number of detected residues, but it is not clear whether the tax caused this reduction [10].
A drawback with classifying pesticides into distinct risk categories is that pesticides with similar levels of environmental and health risks may differ substantially in the tax rate applied. If one pesticide is in the top of its risk category and another is in the bottom of the next higher risk category, then the difference in the tax rate between the two pesticides may be greater than motivated by their difference in risk. In 2013, Denmark adopted an alternative pesticide taxation where the tax level of each approved pesticide is calculated based on its human health risks and environmental characteristics. Instead of distinct risk categories, the tax level is based on an environmental load index ranging from 0 to 40. The heterogeneity in tax levels is high, ranging from €0.57/ha to €25.5/ha. The new pesticide taxation scheme was projected to play a major role in achieving the Danish government objective of reducing the total amount of pesticides applied by 40% from 2013 to 2015 . Preliminary evaluations indicate that this objective has been fulfilled [38].
Experiences from France show that the use of risk-based taxation of pesticides is not always effective. In 2008, a tax on diffuse pollution from agriculture was levied on the sale of pesticides, with the rate varying according to substance toxicity. However, tax rates of 5%–6% of the sale price of most pesticides were too low to reduce the demand for pesticides and to reach the goal of a 50% reduction by 2018. Instead, the use of pesticides increased by 25% from 2008 to 2014 [27].
3.3. Taxes and Charges on Chemicals in Consumer Products
3.3.1. Tax on Products Containing Phthalates or PVC in Denmark
Following a growing concern about the risk of cumulative exposure to hazardous chemicals in consumer goods, Denmark introduced a tax on products containing phthalates and PVC in 2000. The tax rate was approximately 0.3 euro cents per kilogram of PVC and 0.9 euro cents per kilogram of phthalates, with some variation depending on the product. The effects of the tax are uncertain. One early assessment points to a 15% decrease in the use of phthalates from 2002 to 2004 [31]. It cannot be ruled out that technological advancements would have reduced the use of phthalates and PVC anyway, especially since the tax rate is considered to have been relatively low [39]. The effect of the tax levelled off as the tax level did not change or was inflation-adjusted since its introduction and as European regulations of phthalates were introduced. The Danish government decided to abolish the tax from 1 January 2019, as it was no longer considered to have any significant effect on health or the environment when many of the taxed phthalates had been regulated within the European Union. Moreover, the tax has been criticized for not differentiating between phthalates with different hazard profiles, which gives the industry no incentives to change to less hazardous phthalates [40].
3.3.2. Tax on Flame Retardants in Electrical and Electronic Products and Hazardous Chemicals in Clothes and Shoes in Sweden
Sweden introduced a tax on certain chemicals in electrical and electronic products in 2017. The aim was to incentivize the substitution of hazardous flame retardants with less hazardous alternatives. Producers and importers of these products pay an excise duty of around 0.8 EUR per kilogram for kitchen appliances and 12 EUR per kilogram for other electronic products. There is a maximum charge of 32 EUR per item. If producers and importers can prove that the electronic products do not contain additive compounds of bromine, chlorine or phosphorus, they can get a 50% tax deduction. If they can also show that the products do not contain reactive added bromine or chlorine compounds, they are entitled to a 75% tax deduction. Since the tax recently came into force, it has not yet been evaluated. However, it has been criticized by industry for not being based on a comprehensive risk assessment and for being administratively burdensome. In addition, the tax is also imposed on phosphorus flame retardants, i.e., a common alternative to the more hazardous bromine and chlorine compounds, which has raised concern that the phasing out of bromine and chlorine compounds may be delayed [41]. Moreover, as retailers not registered in Sweden are not subject to the tax, there is also a concern that the tax may be in conflict with European Union rules for state aid [32]. As part of a green tax reform in Sweden, the government have decided to also implement a tax on chemicals in clothes and shoes.
3.4. Tradable Permits in Chemicals Management
3.4.1. The Use of Tradable Permits and Taxes to Phase out Lead in Petrol in the U.S.
Different policy instruments have been used to phase out lead in petrol. The United States, the first country in the world to begin the phasing out lead, did so by using a tradable permit system [30]. The tradable permit system offered a flexible system for refineries to invest in the required technology for producing unleaded petrol, thereby reducing the risk that the legislation would be delayed by being challenged in court, a common procedure in the US [13]. The system reduced the phase-out time of lead in petrol by at least five years, from 1979 to 1988, and is estimated to have been highly cost effective, saving hundreds of millions of dollar compared with the use of a command-and-control policy [30].
As a comparison, many European countries used a system with a higher tax on leaded than unleaded petrol to phase out leaded petrol. Sweden phased out leaded petrol from 1987 to 1994 by gradually decreasing the lead content allowed and gradually increasing the tax difference between leaded and unleaded petrol [42]. Initially, the tax difference was not enough to compensate for the investment cost and difference in production costs of leaded and unleaded petrol, but along with a further increased tax on leaded petrol and the compulsory introduction of catalytic converters in new cars from 1988, lead in petrol was eventually phased out.
3.4.2. Tradable Emission Quotas for Regulating Nitrogen Pollution from Agriculture in New Zealand
The creation of a permit market is potentially a powerful policy instrument to control agricultural pollution. A review of worldwide water quality markets found that most water quality markets seek to control point source pollution [43]. Sometimes these markets allow point source polluters to offset their emissions by buying pollution credits from the agricultural sector. In these cases, farmers can certify their production process and generate pollution credits that can be sold to point source polluting parties.
Lake Taupo in New Zealand provides an interesting case where a water quality market was created to reduce non-point source pollution from agricultural activities. Since 2010, the Waikato regional government has established a limit for environmental nitrogen levels, aiming at a 20% reduction by 2020. An Environmental Protection Fund has also been created. It uses public funds to gradually acquire (and retire) emission rights and finance environmental protection initiatives. Explicit rights have been assigned to producers based on their performance in previous years to allow them to generate a certain pollution load. Thus, those who need to increase their nitrogen emissions beyond their allotted quota need to buy quotas from other producers. Emissions are calculated according to the Nitrogen Management Plan presented by each producer, and rights are assigned based on average nitrogen losses from 2000 to 2005. This has been a point of contention among stakeholders, because forest landowners who wish to convert their land to productive activities first have to purchase permits, while those who are already in the system receive them as a matter of course. From 2009 to June 2014, 23 transfers of emission rights to the Environmental Protection Fund had been carried out, for a total of around 150 tonnes of nitrogen. This is a considerable number of transactions, which indicates some success of the scheme. By 2015, the stated goal of reducing nitrogen discharges by 170 tonnes, or 20% of manageable nitrogen emissions, had been met three years ahead of time. However, it is not possible to evaluate the instrument’s capacity to improve water quality, because water permanence periods in Lake Taupo and nutrient permanence periods in underground aquifers are much longer than the time span of this instrument’s implementation [44].
Other examples of instruments targeting agricultural non-point source pollution, including manure production permits in the Netherlands and pasture irrigation districts in California, have been working in the same direction. Manure production permits in the Netherlands, an indirect way of accounting for emissions, were used in 1994–1997, allowing for the transfer of manure production permits instead of emissions.
3.5. Subsidies and Subsidy Removals
A subsidy is the mirror image of a tax. It can provide incentives to increase the use of alternatives to hazardous chemicals. Subsidies can take many different forms, including direct payments, tax reductions or exemptions and favorable loans. Subsidies do not fulfil the polluter pays principle and involve an opportunity cost of public funds. Moreover, once introduced, reducing or removing subsidies is often difficult since they encourage the formation of lobbies made up of beneficiaries striving to protect the subsidies. They can also lead to rebound effects, as a result of attracting more suppliers to the industry. However, subsidies tend to be popular and may be feasible from a practical standpoint when it is difficult to implement other policy instruments [13].
The OECD Policy Instruments for the Environment database [23] contains many entries for ‘environmentally-motivated subsidies’ that can have an indirect effect on the use of chemicals. Examples include tax exemptions for pollution or hazardous waste control, subsidies for energy savings and subsidies for clean-ups of contaminated sites. In the US, several states subsidise the removal of lead paint from private properties. In for example Massachusetts, a tax credit is available for property owners who have paid for deleading. This subsidy is estimated to cost about $2.5 million annually in forgone tax revenue [28].
Input subsidies universally applied to farmers to promote better practices or decrease polluting inputs are not a common practice. The Republic of Korea is one of few cases where organic fertilizers are subsidized. Moreover, Denmark and Norway offer tax exonerations to farmers able to prove they fulfil specific fertilizer and pesticide management requirements. For example, farmers in Norway producing close to polluted river streams can apply for a subsidy to apply lower doses of Phosphorus, depending on soil type and status.
Many countries provide substantial agrochemical subsidies in order to promote agricultural production and increase food security. However, these subsidies can have severe negative environmental effects and imply a high fiscal burden. These ‘perverse subsidies’ are also common in many other policy fields why ‘subsidy removal’ can be classified as a policy instrument in itself [13].
The nature of the environmental effects of agrochemical subsidies depends on site-specific agri-environmental conditions and how the subsidy programme is designed. This makes a general environmental assessment of the benefits of agricultural subsidy removal difficult. The fertilizer subsidy programme in India is briefly described in Section 3.5.1.
3.5.1. The Fertilizer Subsidy Programme in India
To incentivize agricultural production, the central government in India subsidises the use of chemical fertilizers. This subsidy has played an important role in increasing grain production in India. However, the cost for the government of keeping fertilizer prices below the market price has increased drastically since the introduction of the subsidy programme in the late 1970s. In 2015 the cost of fertilizer subsidization was estimated at approximately US $12 billion [45]. There is limited evidence concerning the environmental effects of the programme. There is evidence that the programme has led to imbalanced use of nutrients by farmers through keeping the price of urea (an inexpensive form of nitrogen fertilizer) at a very low level. Excessive and imbalanced use of nutrients has contributed to soil degradation and water pollution [45]. A key challenge in reforming the programme is that the subsidies provide important benefits to many farmers with low income [46]. In 2018, the Indian government reformed the subsidy programme to prevent overuse of fertilizers and to reduce costs.
3.6. Charges and Deposit-Refund Instruments for Hazardous Waste Management
Market-based instruments have become a common strategy to encourage and finance proper hazardous waste management, mostly in high income countries but also with increasing frequency in low- and middle income countries. The market-based instruments used mainly consist of taxes or fees on the disposal of hazardous waste in landfills together with taxes or fees producers or consumers have to pay for products containing hazardous substances. In some cases, taxes or fees on a product are combined with a refund to the consumer upon disposal of the product. High-income countries have systems for managing most products containing hazardous substances while in low- and middle-income countries, hazardous waste management is, to a large extent, carried out by actors in the informal sector, who only collect products that contain materials with economic value.
Charges and deposit refund systems are frequently applied in the management of hazardous wastes, such as batteries, end of life vehicles and waste electrical and electronic equipment (WEEE). These instruments can both incentivize a reduced use of for example batteries containing hazardous chemicals and finance systems for collection and processing of hazardous waste.
3.6.1. Recycling Fees
Recycling fees are common in many high income countries as a way to finance the collection and processing of hazardous compounds such as batteries, WEEE, end of life vehicles (ELV) and scrap tyres. For example, in Switzerland and California, the producer charges the consumer an advance recycling fee, which is then paid to an organization that handles the collection and recycling of the waste [47].
Typically these fees form an integrated part of Extended Producer Responsibility (EPR) systems, holding the producer responsible for the entire life cycle of a product [26,47,48]. In addition to financing waste management, the idea with EPR is to give the producer an incentive to reduce the waste generated and to improve the product design to facilitate recycling and resource recovery. However, these EPR systems for hazardous waste do often not include a consumer refund upon product disposal but instead rely on consumers’ awareness of the importance of proper disposal. Consumer behavior is also strongly linked to the availability and accessibility of collection sites [49,50,51], implying that an information-based incentive for disposal works better in countries with a developed waste management system.
Many low- and middle-income countries have severe problems with environmental pollution in connection to hazardous waste management. Dismantling and recycling are mainly performed by an uncontrolled informal sector using crude methods that pollute the environment and affect the health of the workers. In the last decade, several low- and middle-income countries have introduced legislation for hazardous waste management by learning from the EPR system implemented in many high-income countries.
Both China and India have introduced EPR systems for WEEE management [51,52]. In China, the economic policy instrument is based on a government-controlled WEEE recycling fund introduced in 2012, providing financial support to formal recyclers to enable them to compete with the informal sector, which makes a larger profit by not following environmental regulations [51,53]. The subsidies to formal recyclers have been effective and by 2015, 109 licensed enterprises were available all over China and the informal sector covered by the subsidy had been largely reduced [53]. In India, the E-waste Management and Handling Rules were introduced in 2011, using the EPR system to require the producers to set up a system for WEEE collection and only dispose of the collected WEEE to recycling units certified by the Pollution Control Board [52]. Although the rules resulted in the registration of 178 formal recycling units, 95% of the WEEE in India was still recycled by the informal sector. A difference between the Chinese and Indian systems is that the recycling fund in China is controlled by the government. This fund likely helped China to establish a more functioning infrastructure for waste management compared with India. However, the e-waste rules in India were updated in 2016 with clearer responsibilities and a demand for the producers to implement a deposit refund system to promote collection [54].
3.6.2. Deposit-Refund and Refund Systems
Deposit-refund and refund systems are market-based instruments that give consumers an incentive for correct disposal of their hazardous waste. In traditional deposit-refund systems, consumers pay a deposit on top of the price of a new product and then receive a refund when turning in the end-of-life or consumed product. This system is for example widely used in the beverage industry as an incentive for consumers to return empty cans and bottles. In hazardous waste management, deposit-refund schemes have mainly been used for ELV and lead acid batteries. The Nordic countries Denmark, Norway, and Iceland all have deposit-refund schemes in place for ELV [18], but it is difficult to conclude the effectiveness of these schemes as the recovery rate of ELV is high in all European countries (in 2014, the average European recovery rate was 91% [55]. From 1975 to 2007, Sweden also had a deposit-refund system for ELVs, and compared with the UK, which lacks such a scheme, the Swedish system was highly effective during the investigated period from 1990 to 2005 [56].
Lead acid batteries commonly used in motor vehicles are collected within deposit-refund schemes in most states in the US. The customer pays a deposit of approximately $10 for a new battery and the fee is paid back to the customer if they return a spent battery. These programmes have increased the recovery rate of lead acid batteries in the US from 86 to 97% [29].
Refund systems are commonly used in hazardous waste management in low- and middle-income countries for hazardous waste with significant economic value. Waste is considered more valuable in these countries than in high-income countries [57], due to the availability of cheap labor and crude recycling methods with low human and environmental protection. To encourage consumers to dispose of their hazardous waste to the controlled formal sector, a refund is paid to the consumer, often along with subsidies to formal enterprises to enable them to perform the more costly dismantling and recycling in line with regulations for human and environmental protection.
To promote recovery and recycling of ELV within the formal sector in China, the government introduced a policy in 1995 that pays a scrapping compensation of approximately US$160 to consumers that dispose of their ELV within the formal sector [57]. In addition, command and control are used in the form of occasional controls and information campaigns. However, these instruments have failed to reduce the informal recycling of ELV as the informal sector still pays ten times more for a scrap vehicle.
Battery collection and recycling is poorly developed in both China and India [58,59,60,61]. China uses the command and control principle for lead acid batteries by only allowing recycling by certified enterprises, while no regulation is available to encourage collection and recycling of household batteries. Despite the fact that the regulation requires recycling of lead acid batteries by formal recyclers, 30%–40% of the spent batteries of this type are still handled by the informal sector. Combing regulation with economic policy instruments, as is done for WEEE, has been suggested as a strategy to reduce the informal sector handling of lead acid batteries. Similar to China, Indian battery management rules introduced in 2011 only cover lead acid batteries. The system resembles the e-waste rules in India and relies on the EPR principle. Similar to the e-waste rules, it has succeeded in establishing a formal sector for recycling, but has failed to significantly shift recycling from the informal to the formal sector [58,59,60,61].
There may be a scope for increasing the use of refund systems also in high-income countries, for example to increase the collection of hazardous waste products stored in homes. A survey in Finland reveals that consumers store unused mobile phones because they do not consider them to be end-of life products, instead they just see them as end-of-use products. However, it also revealed that a small refund of less than US $6 would provide a large enough incentive for them to turn in their mobile phones to the collection system [62].
3.7. Fiscal Revenue Generation from Market Based-Instruments
Fiscal revenue generated from environmentally related taxation constituted an average of around 2% of gross domestic product (GDP) and around 5% of total tax revenues in OECD countries in 2008. More than 95% of these revenues stemmed from taxation of energy products, motor vehicles and transports. The revenue generation from other environmental taxes, such as taxes on agrochemicals, batteries and waste, was very limited [63]. A similar situation was found in the Nordic countries in more recent years [64].
Earmarking the revenue generated from chemical taxes is sometimes suggested in order to increase the political acceptance when introducing new taxes or as a way of financing chemical management activities [12]. However, public financial management principles caution against earmarking, since it makes the tax system less flexible. Moreover, since the level of revenues from a particular tax is unlikely to match the level of spending in a particular policy area, earmarking can result in both under- and over-funding [63].
In practice, a variety of earmarking and compensatory measures are common [12]. For example, the revised pesticide taxation in Denmark in 2013 was accompanied with a reduced property tax on agricultural land to compensate farmers, and tax revenues were used to support organic farming and for administrative services. Revenues from pesticide taxation in Denmark were estimated to amount to about 88 million EUR in 2013 (or 0.23% of the state budget). As provided by the Danish financial management legislation, these tax revenues first flow into the state treasury and are then returned for agricultural and environmental purposes [10].
4. Discussion
Based on a review of published and gray literature and an analysis of the OECD database on Policy Instruments for the Environment [23] we analyze experiences and lessons-learned from using market-based instruments for managing hazardous chemicals. In comparison with other environmental policy areas, we find a relatively limited use of market-based instruments for chemicals management. As chemical policy has targeted the prevention of health and environmental damage from a limited number of highly hazardous chemicals, bans and use restrictions have been the most frequently used policy instruments. Price-type instruments give the regulator less certainty about effects on the quantity used of a specific substance, and are therefore less appropriate for addressing chemicals of very high concern. Nevertheless, in some cases, taxes and other market-based instruments have provided important complements to bans and use restrictions, also in relation to very hazardous substances such as lead. A growing interest in using market-based instruments in chemicals management is indicated by increasing use of taxes on pesticides in several European countries and on hazardous chemicals in consumer products as well as the use of taxes and charges in hazardous waste management. A focus on reducing the pressure from not only substances of very high concern but also from broader groups of hazardous chemicals and chemical products is likely to generate increased interest in the use of market-based instruments. The repeated calls to speed up innovation in order create chemicals that are ‘safe by design’ may also generate an interest in an increased use of market-based instruments. By changing the relative prices in favor of less hazardous chemicals, chemical taxation or other market-based instruments can change the rate of return of investments in favor of alternative technology. In addition, governments can generate additional incentives for research and innovation for example by providing tax credits for expenses related to research and development or by providing favorable treatment of capital or labor expenses. This would also address the market failure related to imperfect information and knowledge spill-overs, which tend to result in a sub-optimal level of innovation [65].
The review provides some evidence that risk-based taxation—which links taxation more closely to external effects—can be effective in reducing the environmental and health effects from pesticides. In contrast, non-differentiated taxation, e.g., ad-valorem or per unit taxes, of pesticides can have unintended consequences as quantity reductions can be achieved through substitution with more toxic products [66]. Closer proportionality of taxes in relation to environmental and health risks may also increase the likelihood that a tax will be perceived as fair. Thus, risk-based taxation may not only enhance the economic desirability of taxes but may also increase their political legitimacy [24]. However, risk-based taxation is administratively more burdensome than per unit taxation for both regulators and industry. Hence, balancing the benefits of a targeted approach against its transaction costs is a key dilemma in policy instrument design [67]. While taxing actors early in the chemical life cycle in some cases can be reasonably cost-effective second-best measures [12], regulatory design needs to carefully consider the technical and political complications associated to the distribution of regulatory costs and benefits resulting from targeting actors at different stages of the chemical life cycle [68].
The introduction of market-based instruments for managing hazardous chemicals is often met with resistance by interest groups that will face higher taxes or no longer benefit from a subsidy as a result of the instrument in question. For example, the Swedish tax on fertilizers was removed following protests from farmers that the tax would hurt their ability to compete with other European farmers. However, protests from interest groups are also common when other policy instruments to regulate chemicals are introduced.
If taxes on pesticides and chemical fertilizer lead to large differences in prices between countries, they can provide incentives for illegal trade. However, countries like Sweden and Denmark who have applied this type of taxes, are assessed to have the lowest levels of illegal pesticides in the European Union [69]. This indicates that tax induced price differences on agrochemicals do not necessarily lead to illegal trade if adequate control measures are in place.
Certain amounts of policy consensus and institutional enforcement capacity are required to implement policy instruments that increase social welfare. This is a generally valid assertion, regardless of the choice of quantitative or price based policy instruments. Instruments should preferably be designed together with relevant stakeholders and then be gradually implemented. Consultation and monitoring of the reactions of stakeholders to a new incentive is important in order to avoid undesired side effects and to ensure that the incentives operate at the right level. How information about a policy change is communicated and how revenues are used is often critical to successful implementation.
It is important to have an adaptive capacity to re-design an instrument during the initial stages. Several schemes, mostly regarding fertilizers, have failed due to strong lobbying against them by the respective sector. It is key that, for example, farmers understand the relationship between their actions, the state of the environment and the policy goals to which the introduction of a tax or other market-based instruments should contribute. This implies a need to work together with relevant stakeholders to build agreements and share information during instrument design and implementation.
The review indicates a relatively limited use of market-based instruments for chemicals management in low- and middle-income countries. A pertinent question is whether this is due to a lack of specific institutional capacities that are only available in high-income countries? In general, the capacity to generate fiscal revenue is restrained in low-income countries, which tend to have a large informal economy and a relatively large share of agriculture in total output. This makes income taxes play a relatively less important role for revenue generation. Instead indirect taxes, such as foreign trade taxes, excise taxes on e.g., alcohol, tobacco and fuel and value-added taxes, play a relatively more important role, compared with in high-income countries [70,71]. In principle, taxation of chemicals should therefore not be more difficult than taxing income in many low-income countries. However, a limited general capacity to assess when and how to use market-based instruments and to implement such instruments in practice may contribute to the low use of them.
Our review further indicates that the effectiveness of market-based instruments is linked to other institutional factors. In the area of hazardous waste management, effectiveness is associated with the level of awareness among citizens about the importance of correct disposal and the accessibility of collection and recycling stations [49,50]. For example, the hazardous waste management system in Canada is assessed to be more efficient than in many states in the US, due to a well-developed system for waste collection along with a long tradition of the public separating different waste streams [48]. Similarly, the Nordic countries have more efficient systems for hazardous waste management than some other European countries due to higher levels of consumer awareness and extensive waste management systems already being in place [18].
Our review also points to important knowledge gaps regarding the use of market-based instruments for chemicals management. We identify the following opportunities for further research:
Evaluate the effectiveness of policy instruments for chemical management in different sectors and contexts. There is a lack of good evaluations of the effectiveness of different instrument uses. This is unfortunate since the performance of different policy instruments for chemical management is dependent on context specific factors such as price elasticities, national and international market structures, availability of substitutes and the exposure characteristics for the targeted chemicals. There is also a need for enhanced knowledge about what type of institutional and political economy factors that are critical during instrument design and implementation.
Evaluate the effects of agricultural policies and other policies generating perverse incentives for increased use of hazardous chemicals. Reducing subsidies for fossil fuels has been identified as a cost effective instrument to reduce green-house gas emissions. Similarly, addressing subsidies which incentivize an increased use of agrochemicals and other hazardous chemicals, is relevant for improved chemicals management. However, more research about the extent of such subsidies as well as their effects on environmental resources, health and income distribution is needed.
Study the use of risk-based taxation of hazardous chemicals. Our review indicates that risk-based taxation—which links taxation more closely to specific environment and health risks—can be effective in reducing the environmental and health effects from pesticides. It is likely that instruments that require actual emission measurements will become more popular in the future, thanks to information technology that reduce monitoring costs. However, more knowledge about exposure-damage relationships is needed in order to properly design such instruments. Experimentation and learning about the effectiveness of such taxation schemes is warranted.
Evaluate experiences from taxation of chemicals in groups. Denmark and Sweden have implemented taxation of phthalates in PVC and flame retardants in electronic products. While there are some indications of a lack of precision and high administrative costs associated with these taxes, there is a lack of formal evaluations. These initiatives may provide important lessons for future policy instrument design and should be studied further.
Study institutional reforms which can incentivize sound chemicals management by making producers bear the full environmental and health costs during the product life cycle. The establishment of systems with Extended Producer Responsibility seem to have succeeded in shifting the cost of waste management from authorities to producers in many countries. Requirements on information disclosure or legal obligations about liability for firms to prevent and remedy environmental damages—for example obligations to be insured or to build up funds for clean-up or waste management—are other examples of institutional reforms, which can generate incentives in line with the polluter pays principle. These types of institutional reforms merit further attention by researchers as they may provide important compliments to both price- and quantity-type policy instruments in generating incentives for sound chemicals management.
Author Contributions
D.S. conceptualized and wrote the article with substantial input from F.A. D.S. conducted the review of the OECD database and the literature review. Both authors reviewed and approved the final manuscript.
Funding
This research was funded by UN Environment as input to the Global Chemicals Outlook II report; the Swedish research council FORMAS (Project No 2016-01238, project DECRA: Developing Comparative Risk Assessment into a useful tool for substituting hazardous chemicals) and the Centre for Future chemical Risk Assessment and Management strategies at the University of Gothenburg (www.FRAM.gu.se).
Acknowledgments
Valuable input and comments from the following persons are gratefully acknowledged: Researchers within the Environment for Development Initiative: Xiaobing Zang, Renmin University, China; Utkarsh Kumar, Indian Statistical Institute, India; Matías Pagio, Tropical Agricultural Research and Higher Education Center (CATIE), Costa Rica; Razack Lokina, University of Dar es Salaam, Tanzania; Jane Turpie, University of Cape Town, South Africa; Thomas Sterner and Jessica Coria, University of Gothenburg, Sweden; Staff at Gothenburg Centre for Sustainable Development: Olof Drakenberg, Maria Göthberg and Lina Lindahl, University of Gothenburg, Sweden; Christoph Rheinberger, the European Chemicals Agency, Finland; and Joy Aeree Kim, Achim Halpaap, and Jost Dittkrist, UN Environment, Switzerland.
Conflicts of Interest
The authors declare no conflict of interest. The funder had no role in the design of the study; in the collection, analyses, or interpretation of data; in the writing of the manuscript, or in the decision to publish the results.
Appendix A
Literature Search in Econlit. Keywords Combinations Selected (Number of Hits)
- chemic * AND tax * (NOT “taxa”)
- chemic * AND fee
- chemic * AND subsid *
- “chemical pollution” AND tax *
- “chemical pollution” AND fee
- “chemical pollution” AND subsid *
- Pestic * AND tax *
- Pestic * AND fee
- Pestic * AND subsid *
- Fertiliz * AND tax * (NOT “taxa”)
- Fertiliz * AND fee
- Fertiliz * AND subsid *
- Fertiliz * AND tax * (NOT “taxa”)
- Fertiliz * AND fee
- Fertiliz * AND subsid *
- Lead AND tax * and “heavy metals”
- Lead AND fee and “heavy metals”
- Lead AND subsid * and “heavy metals”
- Cadmium AND tax *
- Cadmium AND fee
- Cadmium AND subsid *
- Mercury AND tax *
- Mercury AND fee
- Mercury AND subsid *
- batter * AND tax *
- batter * AND fee
- batter * AND subsid *
- batter * AND refund
- plastic bag * AND tax *
- plastic bag * AND fee
- plastic bag * AND subsid *
- plastic bag * AND refund
Appendix B

Table A1.
Information on the use of Market-Based Instruments for Chemicals Management in the OECD Policy Instruments for the Environment Database.
Table A1.
Information on the use of Market-Based Instruments for Chemicals Management in the OECD Policy Instruments for the Environment Database.
| Chemical/Product | Number of Countries | Countries with the Specific Market-Based Instrument | |||
|---|---|---|---|---|---|
| Tax | Fee/Charge | Deposit-Refund Systems | Tradable Permit Systems | ||
| Pesticides | 7 | Denmark, Italy, Norway, Sweden, US | Bulgaria, Canada | ||
| Fertilisers | 1 | Bulgaria | |||
| Ozone depleting substances | 10 | Australia, Czech Republic, Denmark, Spain, US | FYR of Macedonia, Latvia, Montenegro, Serbia | Canada 1, US 2 | |
| Chlorinated solvents | 4 | Denmark, Norway, US | Canada 3 | ||
| Polyvinylcloride and phthalates | 1 | Denmark | |||
| Pesticide or chemical containers | 4 | Canada, Korea | Poland, US | ||
| Tyres a | 15 | Canada, Denmark, Finland, Hungary, Slovenia, South Africa, US | Bulgaria, Canada, Croatia, FYR of Macedonia, Latvia, Lithuania, Malta, Poland, Portugal, US | Canada, Denmark, US | |
| Batteries/accumulators a | 17 | Canada, Denmark, Hungary, Iceland, Liechtenstein, Sweden, US | Austria, Bulgaria, Denmark, FYR of Macedonia, Italy, Korea, Lithuania, Poland, Portugal, Switzerland | Canada, Denmark, Lithuania, Mexico, Poland, US | |
| Electrical and electronic products a | 13 | Canada, Denmark, Hungary, Slovenia | Canada, China, FYR of Macedonia, Korea, Liechtenstein, Lithuania, Malta, Poland, Portugal, Switzerland | ||
| Vehicles a | 10 | Slovenia, Russia | Bulgaria, Czech Republic, Croatia, Finland, Switzerland | Denmark, Finland, Norway, Sweden | |
| Hazardous waste (generation/disposal) | 15 | Belgium, Brazil, Czech Republic, Estonia, Hungary, Iceland, Poland, Portugal, Spain, US | Croatia, Denmark, Germany, Montenegro, Serbia | ||
Notes: Data retrieved from the OECD Policy Instruments for the Environment database. The database has been developed in co-operation with experts at the European Environment Agency and other government agencies who report information about different policy instruments to the OECD. It covers six groups of environmentally relevant economic policies in OECD and other countries (107 countries in total), but the data is more complete for the OECD countries. It only includes currently active policies although it is unclear how frequently the database is updated. The table contains data for four types of economic instruments (subsidies and voluntary approaches are not included) from the environmental domains land contamination, ozone layer protection and waste management in the database. Countries consisting of multiple states are listed if the policy is present in at least one of the states. Differences between the content of the table and the information in the text in this report are possible since the text is also based on available literature and since all the information in the database may not have been updated. a Economic policy targeting either the new or the discarded product; 1 HCFCs allowance system introduced in 1990. 2 Tradable permit system for ozone-depleting substances introduced in 1989. 3 Allowance system for TCE (Trichloroethylene) and PERC (Tetrachloroethylene) introduced in 2001.
References
- Weitzman, M.L. Prices vs quantities. Rev. Econ. Stud. 1974, 41, 477–491. [Google Scholar] [CrossRef]
- Bernhardt, E.S.; Rosi, E.J.; Gessner, M.O. Synthetic chemicals as agents of global change. Front. Ecol. Environ. 2017, 15, 84–90. [Google Scholar] [CrossRef]
- Landrigan, P.J.; Fuller, R.; Acosta, N.J.R.; Adeyi, O.; Arnold, R.; Basu, N.; Baldé, A.B.; Bertollini, R.; Bose, O.; Richard, B.S.; et al. The Lancet Commission on pollution and health. Lancet 2018, 391, 462–512. [Google Scholar] [CrossRef] [Green Version]
- Grandjean, P.; Bellanger, M. Calculation of the disease burden associated with environmental chemical exposures: Application of toxicological information in health economic estimation. Environ. Health 2017, 16, 123. [Google Scholar] [CrossRef] [PubMed]
- Goldenman, G.; Fernandes, M.; Holland, M.; Tugran, T.; Nordin, A.; Schoumacher, C.; McNeill, A. The Cost of Inaction: A Socioeconomic Analysis of Environmental and Health Impacts Linked to Exposure to PFAS; Nordisk Ministerråd: Copenhagen, Denmark, 2019. [Google Scholar]
- Olsson, M. The Cost of Inaction: A Socioeconomic Analysis of Costs Linked to Effects of Endocrine Disrupting Substances on Male Reproductive Health; Nordic Council of Ministers: Copenhagen, Denmark, 2014. [Google Scholar]
- Trasande, L.; Zoeller, R.T.; Hass, U.; Kortenkamp, A.; Grandjean, P.; Myers, J.P.; DiGangi, J.; Bellanger, M.; Hauser, R.; Legler, J.; et al. Estimating burden and disease costs of exposure to endocrine-disrupting chemicals in the European Union. J. Clin. Endocrinol. Metabol. 2015, 100, 1245–1255. [Google Scholar] [CrossRef] [PubMed]
- Bellanger, T.M.; Demeneix, T.B.; Grandjean, T.P.; Zoeller, T.R.; Trasande, T.L. Neurobehavioral Deficits, Diseases, and Associated Costs of Exposure to Endocrine-Disrupting Chemicals in the European Union. J. Clin. Endocrinol. Metabol. 2015, 100, 1256–1266. [Google Scholar] [CrossRef] [PubMed] [Green Version]
- Sadler, T. Regulating chemical emissions with risk-based environmental taxation. Int. Adv. Econom. Res. 2000, 6, 287–305. [Google Scholar] [CrossRef]
- Böcker, T.; Finger, R. European Pesticide Tax Schemes in Comparison: An Analysis of Experiences and Developments. Sustainability 2016, 8, 378. [Google Scholar] [CrossRef]
- UN Environment. Global Chemicals Outlook II-From Legacies to Innovative Solutions: Implementing the 2030 Agenda for Sustainable Development; UN Environment: Geneva, Switzerland, 2019. [Google Scholar]
- Söderholm, P. Economic Instruments in Chemicals Policy: Past Experiences and Prospects for Future Use; Nordic Council of Ministers: Copenhagen, Denmark, 2009. [Google Scholar]
- Sterner, T.; Coria, J. Policy Instruments for Environmental and Natural Resource Management, 2nd ed.; RFF Press: Washington, DC, USA, 2012. [Google Scholar]
- Stavins, R.N. Experience with Market-Based Environmental Policy Instruments; Elsevier: Washington, DC, USA, 2001; pp. 355–435. [Google Scholar]
- Baumol, W.J.; Oates, W.E. The Theory of Environmental Policy, 2nd ed.; Oates, W.E., Bawa, V.S., Bradford, D.F., Eds.; Cambridge University Press: Cambridge, UK, 1988. [Google Scholar]
- Macauley, M.K.; Bowes, M.D.; Palmer, K.L. Using Economic Incentives to Regulate Toxic Subst; Future, R.F., Ed.; Resources for the Future: New York, NY, USA, 1992. [Google Scholar]
- Harrington, W.; Morgenstern, R.; Sterner, T. Choosing Environmental Policy, Comparing Instruments and Outcomes in the United States and Europe; RFF press: Washington, DC, USA, 2004. [Google Scholar]
- Bragadóttir, H.; Danielsson, C.v.U.; Magnusson, R.; Seppänen, S.; Stefansdotter, A.; Sundén, D. The Use of Economic Instruments: In Nordic Environmental Policy 2010–2013; Nordisk Ministerråd: Copenhagen, Denmark, 2014; p. 207. [Google Scholar]
- OECD. Environmentally Related Taxes in OECD Countries; Humana Press: Totowa, NJ, USA, 2001. [Google Scholar]
- Swedish Chemicals Agency. Kan Ekonomiska Styrmedel Bidra till en Giftfri Miljö? (Can Economic Policy Instruments Contribute to a Non-Toxic Environment?); Rapport 7/07; KEMI: Stockholm, Sweden, 2007. [Google Scholar]
- Swedish Chemicals Agency. Internationell Förekomst av Ekonomiska Styrmedel på Kemikalieområdet (Economic Policy Instruments in the Area of Chemicals Management in the International Arena); PM 1/11; KEMI: Stockholm, Sweden, 2011. [Google Scholar]
- Swedish Chemicals Agency. När Kan Ekonomiska Styrmedel Komplettera Regleringar Inom Kemikalieområdet? (When Can Economic Instruments Complement Regulations in the Area of Chemicals Management?); Rapport nr 1/13; KEMI: Stockholm, Sweden, 2013. [Google Scholar]
- OECD. Database on Policy Instruments for the Environment. Available online: https://pinedatabase.oecd.org/ (accessed on 11 March 2018).
- Söderholm, P.; Christiernsson, A. Policy effectiveness and acceptance in the taxation of environmentally damaging chemical compounds. Environ. Sci. Policy 2008, 11, 240–252. [Google Scholar] [CrossRef]
- Slunge, D.; Sterner, T. Implementation of Policy Instruments for Chlorinated Solvents: A Comparison of Design Standards, Bans, and Taxes to Phase Out Trichloroethylene. Eur. Environ. 2001, 11, 281–296. [Google Scholar] [CrossRef]
- Gupt, Y.; Sahay, S. Review of extended producer responsibility: A case study approach. Waste Manag. Res. 2015, 33, 595–611. [Google Scholar] [CrossRef]
- OECD. The Political Economy of Biodiversity Policy Reform; Cambridge University Press: Cambridge, UK, 2017. [Google Scholar]
- Massachusetts Budget and Policy Center. Available online: http://children.massbudget.org/tax-break-removal-lead-paint (accessed on 4 December 2018).
- Walls, M. Deposit-Refund Systems in Practice and Theory; Resources for the Future: Washington, DC, USA, 2011; pp. 11–47. [Google Scholar]
- Newell, R.G.; Rogers, K. The U.S. Experience with the Phasedown of Lead in Gasoline; Resources for the Future: Washinton, DC, USA, 2003. [Google Scholar]
- Government of Denmark. Ftalater—reguleringsmæssig status, ftalatafgiftens effekter og overvejelser om differentieret afgift (Phthalates—Regulatory Status, Effects of the Fee on Phthalates and Considerations about a Differentiated Charge); Miljø-og Planlægningsudvalget: Copenhagen, Denmark, 2006; p. 343.
- Rendahl, P. Kemikalieskatt i Sverige? Till Vilket Eller Vilka Ändamål? (Chemical Tax in Sweden? For Which Purpose?); Juristförlaget i Lund: Lund, Sweden, 2017. [Google Scholar]
- Sterner, T. Trichloroethylene in Europe: Ban Versus Tax. 2004. Available online: https://www.taylorfrancis.com/books/e/9781936331468/chapters/10.4324/9781936331468-16 (accessed on 9 August 2019).
- SPIN database. Database on the Use of Substances in Products in the Nordic Countries. Available online: http://spin2000.net/ (accessed on 4 December 2018).
- Shortle, J.S.; Ribaudo, M.; Horan, R.D.; Blandford, D. Reforming agricultural nonpoint pollution policy in an increasingly budget-constrained environment. Environ. Sci. Technol. 2012, 46, 1316. [Google Scholar] [CrossRef]
- OECD. Water Quality and Agriculture: Meeting the Policy Challenge; OECD Publishing: Paris, France, 2012. [Google Scholar]
- Kjäll, K. Hur väl fungerar miljöskatter inom kemikalieområdet? Effekter av miljöskatter på växtskydd och klorerade lösningsmedel i Sverige, Danmark, Norge och Frankrike; KEMI: Stockholm, Sweden, 2012. [Google Scholar]
- Ørum, J.E.; Kudsk, P.; Jørgensen, L.N.; Paaske, K. Behandlingshyppighed og Pesticidbelastning for Solgte Pesticider 2007–2015; University of Copenhagen: Copenhagen, Denmark, 2017. [Google Scholar]
- Government of Sweden. Kemikalieskatt-Skatt på Vissa Konsumentvaror Som Innehåller Kemikalier (Chemical Tax-Tax on Certain Consumer Products Containing Chemicals); Government of Sweden: Stockhgolm, Sweden, 2015.
- Stringer, L. Denmark to scrap tax on PVC and phthalates Chemical Watch Global Risk & Regulation news. 2017. Available online: https://chemicalwatch.com/61121/denmark-to-scrap-tax-on-pvc-and-phthalates. (accessed on 8 October 2018).
- Stringer, L. Sweden’s chemicals tax heavily flawed, say electronics organisations Chemical Watch Global Risk and Regulation news. 2017. Available online: https://chemicalwatch.com/60745/swedens-chemicals-tax-heavily-flawed-say-electronics-organisations. (accessed on 8 October 2018).
- Hammar, H.; Löfgren, Å.; Sterner, T. Political Economy Obstacles to Fuel Taxation. Energy J. 2004, 25, 1–17. [Google Scholar] [CrossRef]
- Greenhalgh, S.; Selman, M. Comparing Water Quality Trading Programs: What Lessons Are There To Learn? J. Reg. Anal. Policy 2012, 42, 104–125. [Google Scholar]
- OECD. The Lake Taupo Nitrogen Market in New Zealand: A Review for Policy Makers; OECD Publishing: Paris, France, 2015. [Google Scholar]
- Gulati, A.; Banerjee, P. Rationalising Fertiliser Subsidy in India: Key Issues and Policy Options. Available online: https://www.econstor.eu/handle/10419/176325 (accessed on 8 August 2019).
- Praveen, K.V. Evolution and Emerging Issues in Fertilizer Policies in India. Econ. Aff. 2014, 59, 163–173. [Google Scholar] [CrossRef]
- Wang, H.D.; Gu, Y.F.; Li, L.Q.; Liu, T.L.; Wu, Y.F.; Zuo, T.Y. Operating models and development trends in the extended producer responsibility system for waste electrical and electronic equipment. Res. Conserv. Recycl. 2017, 127, 159–167. [Google Scholar] [CrossRef]
- Turner, J.M.; Nugent, L.M. Charging up Battery Recycling Policies Extended Producer Responsibility for Single-Use Batteries in the European Union, Canada, and the United States. J. Ind. Ecol. 2016, 20, 1148–1158. [Google Scholar] [CrossRef]
- Favot, M.; Grassetti, L. E-waste collection in Italy: Results from an exploratory analysis. Waste Manag. 2017, 67, 222–231. [Google Scholar] [CrossRef]
- Lim-Wavde, K.; Kauffman, R.J.; Dawson, G.S. Household informedness and policy analytics for the collection and recycling of household hazardous waste in California. Res. Conserv. Recycl. 2017, 120, 88–107. [Google Scholar] [CrossRef]
- Gu, Y.F.; Wu, Y.F.; Xu, M.; Wang, H.D.; Zuo, T.Y. To realize better extended producer responsibility: Redesign of WEEE fund mode in China. J. Clean Prod. 2017, 164, 347–356. [Google Scholar] [CrossRef]
- Awasthi, A.K.; Li, J.H. Management of electrical and electronic waste: A comparative evaluation of China and India. Renew. Sustain. Energy Rev. 2017, 76, 434–447. [Google Scholar] [CrossRef]
- Zeng, X.L.; Duan, H.B.; Wang, F.; Li, J.H. Examining environmental management of e-waste: China’s experience and lessons. Renew. Sustain. Energy Rev. 2017, 72, 1076–1082. [Google Scholar] [CrossRef]
- Pathak, P.; Srivastava, R.R. Assessment of legislation and practices for the sustainable management of waste electrical and electronic equipment in India. Renew. Sustain. Energy Rev. 2017, 78, 220–232. [Google Scholar] [CrossRef]
- Eurostat. End-of-Life Vehicle Statistics; Eurostat: Luxembourg City, Luxembourg, 2016. [Google Scholar]
- Manomaivibool, P. Network management and environmental effectiveness: The management of end-of-life vehicles in the United Kingdom and in Sweden. J. Clean Prod. 2008, 16, 2006–2017. [Google Scholar] [CrossRef]
- Hu, S.H.; Wen, Z.G. Why does the informal sector of end-of-life vehicle treatment thrive? A case study of China and lessons for developing countries in motorization process. Resour. Conserv. Recycl. 2015, 95, 91–99. [Google Scholar] [CrossRef]
- Sun, M.X.; Yang, X.C.; Huisingh, D.; Wang, R.Q.; Wang, Y.T. Consumer behavior and perspectives concerning spent household battery collection and recycling in China: A case study. J. Clean Prod. 2015, 107, 775–785. [Google Scholar] [CrossRef]
- Sun, Z.; Cao, H.B.; Zhang, X.H.; Lin, X.; Zheng, W.W.; Cao, G.Q.; Sun, Y.; Zhang, Y. Spent lead-acid battery recycling in China - A review and sustainable analyses on mass flow of lead. Waste Manag. 2017, 64, 190–201. [Google Scholar] [CrossRef]
- Gu, F.; Guo, J.F.; Yao, X.; Summers, P.A.; Widijatmoko, S.D.; Hall, P. An investigation of the current status of recycling spent lithium-ion batteries from consumer electronics in China. J. Clean Prod. 2017, 161, 765–780. [Google Scholar] [CrossRef]
- Gupt, Y. Economic Instruments and the Efficient Recycling of Batteries in Delhi and the National Capital Region of India. Environ. Dev. Econ. 2014, 20, 236–258. [Google Scholar] [CrossRef]
- Yla-Mella, J.; Keiski, R.L.; Pongracz, E. Electronic waste recovery in Finland: Consumers’ perceptions towards recycling and re-use of mobile phones. Waste Manag. 2015, 45, 374–384. [Google Scholar] [CrossRef]
- OECD. Taxation, Innovation and the Environment; OECD: Paris, France, 2010. [Google Scholar]
- Svenningsen, L.S.; Sørensen, M.M.; Hansen, L.L.; Hansen, T.; Schou, J.; Øyvind, L. Policy Brief: The~Use of Economic Instruments in Nordic Environmental Policy 1990–2017; Nordic Council of Ministers: Stockholm, Sweden, 2018. [Google Scholar]
- Jaffe, A.B.; Newell, R.G.; Stavins, R.N. A tale of two market failures: Technology and environmental policy. Ecol. Econ. 2005, 54, 164–174. [Google Scholar] [CrossRef] [Green Version]
- Finger, R.; Möhring, N.; Dalhaus, T.; Böcker, T. Revisiting Pesticide Taxation Schemes. Ecol. Econ. 2017, 134, 263–266. [Google Scholar] [CrossRef]
- Vatn, A. Input versus emission taxes: Environmental taxes in a mass balance and transaction costs perspective. Land Econ. 1998, 74, 514–525. [Google Scholar] [CrossRef]
- Coria, J. The Economics of Toxic Substance Control and the REACH Directive. Review of Environmental Economics and Policy, Forthcoming. 2019.
- European Commission; DG Health and Food Safety. Ad-Hoc Study on the Trade of Illegal and Counterfeit Pesticides in the EU. Consultancy Report. 2015. Available online: https://ec.europa.eu/food/sites/food/files/plant/docs/pesticides_ppp_illegal-ppps-study.pdf (accessed on 6 August 2019).
- Di John, J. The Political Economy of Taxation and Tax Reform in Developing Countries; Helsinki: United nations university: World Institute for Development Economics Research UNU-WIDER: Helsinki, Finland, 2006. [Google Scholar]
- Slunge, D.; Sterner, T. Environmental Fiscal Reform in East and Southern Africa and its Effects on Income Distribution. Rivista Di Politica Economica 2009, 12. [Google Scholar] [CrossRef]
Figure 1.
Number of applications of market-based instruments in chemicals management. Source: Authors, based on the OECD database on Policy Instruments for the Environment [23].
Figure 1.
Number of applications of market-based instruments in chemicals management. Source: Authors, based on the OECD database on Policy Instruments for the Environment [23].

Figure 2.
Number of countries using market-based instruments in chemicals management. Source: Authors, based on the OECD database on Policy Instruments for the Environment [23]. See Section 3.3 regarding the use of subsidies in relation to chemicals management.
Figure 2.
Number of countries using market-based instruments in chemicals management. Source: Authors, based on the OECD database on Policy Instruments for the Environment [23]. See Section 3.3 regarding the use of subsidies in relation to chemicals management.

Figure 3.
Rates of reduction of trichloroethylene (TCE) in Europe. Source: Author, based on Sterner [33] and the SPIN database on the use of substances in products in the Nordic countries [34]. Data on sold quantities of TCE in Europe is not publicly available after 2006.

Figure 4.
Effects of differentiated taxation on sold quantities of pesticides in Norway. Notes: A new taxation scheme for pesticides was introduced in 1999. Pesticides were divided into 7 categories based on their health and environmental risks, with higher taxation of products in higher risk categories. Classes 6 and 7 concern non-professional use and are not shown in the figure. The figure indicates that a shift towards using more of the relatively less hazardous pesticides (Class 1) has taken place. The tax rate was adjusted in 2000 and 2005. Source: adapted from Kjäll (2012) [37].

Table 1.
Typology of market-based instruments and examples of applications in chemicals management.
| Policy Instrument | Description | Example of Application |
|---|---|---|
| Tax | By increasing the price of using a chemical, a tax incentivizes decreased use. Taxes are levied by the state, with proceeds going to the general budget. The level should reflect the damages caused by the production, use and disposal of the chemical, which in the absence of the tax would not be reflected in the market price of the input or final product. | Pesticides [10], inorganic fertilizers [24], chlorinated solvents [25]. |
| Charge/Fee | Similar to a tax but revenues are typically earmarked. The level of a fee should reflect the cost of providing a specific service—such as processing hazardous waste. | Hazardous waste [13], pesticide or chemical containers [23], tyres [26], batteries [26]. |
| Subsidy | A subsidy is the mirror image of a tax. It can provide incentives to increase the use of alternative chemicals that are less hazardous. In particular, authorities may want to subsidise learning and technology development. | Subsidies for organic farming [27], lead paint removal [28]. |
| Subsidy removal | In many cases, subsidies are introduced to deal with distributional concerns, yet may result in unsound practices from a health or environmental perspective. Hence, subsidy removal is considered a policy instrument in its own right. | Removal of subsidies for the use of chemical fertilisers or pesticides [27]. |
| Deposit-Refund | A surcharge is paid when purchasing potentially polluting products. A refund is received when returning the product to an approved centre for recycling or disposal. | Pesticide or chemical containers [23], batteries and tyres [29]. |
| Tradable permits | An overall level of ‘allowable’ pollution is established and allocated among firms in the form of permits. These permits can be traded on a market at market prices | Lead in petrol (trade among refineries) [30], ozone-depleting substances (trade among producers and importers) [17]. |
© 2019 by the authors. Licensee MDPI, Basel, Switzerland. This article is an open access article distributed under the terms and conditions of the Creative Commons Attribution (CC BY) license (http://creativecommons.org/licenses/by/4.0/).
Share and Cite
MDPI and ACS Style
Slunge, D.; Alpizar, F. Market-Based Instruments for Managing Hazardous Chemicals: A Review of the Literature and Future Research Agenda. Sustainability 2019, 11, 4344. https://doi.org/10.3390/su11164344
AMA Style
Slunge D, Alpizar F. Market-Based Instruments for Managing Hazardous Chemicals: A Review of the Literature and Future Research Agenda. Sustainability. 2019; 11(16):4344. https://doi.org/10.3390/su11164344
Chicago/Turabian StyleSlunge, Daniel, and Francisco Alpizar. 2019. "Market-Based Instruments for Managing Hazardous Chemicals: A Review of the Literature and Future Research Agenda" Sustainability 11, no. 16: 4344. https://doi.org/10.3390/su11164344
Note that from the first issue of 2016, this journal uses article numbers instead of page numbers. See further details here.