Performance Measurement for Sustainability: Does Firm Ownership Matter


1
Department of Accounting and Finance, University of Antwerpen, Prinsstraat 13, 2000 Antwerpen, Belgium
2
Department of Accounting and Auditing, Can Tho University, 30/4 Street, Ninh Kieu, Can Tho 94000, Vietnam
*
Authors to whom correspondence should be addressed.
Sustainability 2019, 11(16), 4436; https://doi.org/10.3390/su11164436
Submission received: 19 July 2019
/
Revised: 12 August 2019
/
Accepted: 13 August 2019
/
Published: 16 August 2019
(This article belongs to the Special Issue Entrepreneurship, Finance and Sustainability)
Abstract
:Based on contingency and agency insights, this study examines the influence of ownership characteristics on performance measurement systems (PMSs) and outcome-based compensation systems driven by differences in organizational goals and objectives between state-owned enterprises (SOEs) and non-state-owned enterprises (non-SOEs) in Vietnam. The influence of ownership characteristics on the design of PMSs received little attention from researchers so far. Moreover, the few studies that are available so far only examined the relationship between firm ownership characteristics and the presence and use of economic performance indicators and economic outcome-based compensation in firms. In this study, the scope of PMSs is broader, and sustainability indicators focusing on community programs, ethical behavior, and government regulation are included in addition to economic based indicators. Analyzing survey data with the use of partial least squares (PLS) structural equation modeling (SEM), we find that the higher the share of the government in an organization’s capital is, the significantly more governmental duty indicators and significantly fewer ethical indicators and economic indicators are included in the PMS and outcome-based compensation systems. The inclusion of community indicators is not associated with firm ownership characteristics. Meanwhile, non-SOEs include significantly more economic value indicators, but no societal measures, like ethical, community-oriented, and governmental duty indicators.
1. Introduction
Performance measurement systems (PMSs) are a vital part of an organization’s processes since they include “systems, rules, practices, values, and other activities”, which are meant to support decision-making, as well as direct staff’s behavior and decisions consistent with the objectives and strategies of the organization [1,2,3,4]. In order to enforce the guidance of PMS, outcome-based compensation systems are often coupled to these PMSs by linking the same performance indicators included in the PMS to bonuses to be obtained by managers and employees. Therefore, PMSs and outcome-based compensation systems are important mechanisms to run a company in alignment with the goals and objectives specified for a company. These mechanisms help to guide managers’ and employees’ behavior and motivate them to pursue these goals. Including indicators with respect to corporate social sustainability in PMSs and outcome-based compensation is a mechanism to instigate managers and employees to act in a sustainable way (i.e., ethical and community-oriented). Therefore, it is useful to know whether these indicators are included in the PMSs and outcome-based reward systems of companies and whether or not this inclusion depends on the ownership characteristics of the company.
With respect to PMSs and outcome-based compensation, there is no “one size fits all” approach. Differences in the design and use of PMSs were traditionally studied through a contingency theory lens. Contingency studies identify contextual variables (contingency variables) that influence the design and use of PMSs and outcome-based compensation. So far, PMS studies examined the influence of technology, environmental uncertainty, size, organizational structure, strategy, culture, and other organizational or managerial characteristics (e.g., leadership style) on the design and use of PMSs [2,5,6,7].
The extant research, so far, only paid very limited attention to ownership characteristics as being a possible contingent variable to explain differences in the design and use of PMSs. Prior studies that focused on the relationship between ownership characteristics and the design and use of PMSs included only one type of ownership characteristic as a research variable in the research design (e.g., family vs. non-family firms) (see References [8,9]).These studies did not compare differences across ownership characteristics in a single country, except for a few studies investigating the design and use of PMSs in subsidiaries of multinational organizations [10,11,12,13,14,15]. Recent calls were made in the literature to study the influence of family ownership on the design and use of management control systems (MCSs) [16,17,18,19,20]. However, in most economies and especially emerging economies, different types of firm ownership are found beyond private family ownership. In a number of emerging economies, state ownership is still very much present. Therefore, we broaden this call for research on the influence of ownership characteristics on PMSs to examine the influence of the relationship between ownership differences spanning from 100% state ownership to 100% private ownership and PMSs and the linked outcome-based compensation systems. Whereas the few available studies investigating firm ownership influence on PMSs focused only on the presence of economic indicators in PMS, we focus on broad-scope PMSs, which include sustainable and societal indicators in addition to economic indicators. In order to study the relationship between ownership characteristics and the design of PMSs, we focus on broad-scope PMSs including economic goals, as well as sustainable and societal goals.
Despite the lack of empirical research attention with respect to the relationship between ownership characteristics and the design of PMSs and outcome-based reward systems, agency theory suggests an association between ownership structure and the design and use of PMSs. According to agency theory, PMSs are a useful mechanism to align the interests of owners and managers [21,22]. Owners have goals and objectives which can be conflicting with manager’s interests. Agency theory argues that the adoption of management controls including PMSs and reward systems can be seen as a mechanism which mitigates the agency problem caused by differences in the alignment between the objectives of owners and managers in a firm [21,22]. In order to limit self-serving behaviors or self-interests of managers and to align managers’ goals with organizational goals and owner’s objectives, the adoption of controls such as performance evaluation, performance measurement, monitoring systems, budgeting systems, compensation, and reward systems was suggested [23,24,25,26]. Therefore, according to agency theory, there is an explicit link between the owners’ goals and objectives and the design and use of a firm’s PMSs and compensation systems [25].
Combining agency insights with a contingency lens, this study sheds more light on the relationship between ownership characteristics and the design of PMSs and outcome-based compensation systems. The study was conducted in an emerging economy, specifically, in Vietnam, which is in transition from a pure state-controlled economy to a more open one. This leads to the different types of ownership such as state-owned enterprises (SOEs) and non-state-owned enterprises (non-SOEs) found in this country. Therefore, Vietnam is seen as an appropriate environment for our research question. A few studies available on the relationship between ownership characteristics and PMSs and reward systems only focused on the presence of economic indicators (i.e., indicators focusing on firm growth, market position, internal efficiency, and innovation and learning) in the PMSs and outcome-based reward systems of the firms. In this study, we also examine whether ownership characteristics are related to the inclusion of societal indicators (i.e., indicators focusing on ethical behavior, community programs, and government objects) in their PMSs and compensation systems. We include in this study the relationship between ownership characteristics and the design of reward and compensation systems, because Brickley et al. [27] suggested that performance measurement systems and reward systems should be mutually consistent and determined simultaneously.
Our study contributes to the existing literature in several ways. Firstly, this study topic generates additional insights into the PMS literature by examining firm ownership as a contingency variable, which might explain the design of PMSs and reward systems. According to our knowledge, this study is one of the first attempts to research in depth how ownership differences influence PMS design. Second, the results also inform the literature on privatization processes and firm characteristics in emerging economies. Although there are a lot of studies examining factors influencing management controls and PMS design in transition economies such as China (see References [8,10,14]), a focus on Vietnam might provide additional insights since, in China, state involvement in companies is much larger than in Vietnam. In addition, differences in geographic, historic, and economic scale and differences in points of view related to topics such as the environment, social welfare, and the division and decentralization of economic management to cities, provinces, and economic zones create further differences between China and Vietnam [28,29,30]. Thirdly, this study provides insights into whether or not companies in emerging countries include societal indicators in their PMSs and make sustainability goals and corporate social responsibility explicit in their internal systems like PMSs and outcome-based reward systems.
The paper is organized as follows: the next section critically reviews prior studies, presents the theoretical framework, and includes the hypothesis development. The third section describes the research methodology. The fourth section analyzes and discusses the empirical results. Finally, conclusions and limitations of the study are presented.
2. Literature Review
2.1. The Role of Performance Measurement Systems in Organizations
The main purpose of MCSs, including PMSs, is to achieve goal congruence [31]. Anthony and Govindarajan [32] described the role of management control systems including PMSs as “the process by which managers influence other members of the organization to implement the organization’s strategies”. Thus, MCSs are defined as “systems that are used by management to control the activities of an organization” [32].
Somewhat different from Anthony and Govindarajan’s (2007) concept of MCSs including PMSs, Merchant and van der Stede [3] excluded strategic controls and argued that MCSs, including PMSs are more related to guiding employee behavior. Since employees can be considered as organizational actors, MCSs, specifically PMSs, should be designed to guide their behavior congruent with objectives of the organization [33].
Chenhall (2007) introduced the concept of broad-scope PMSs. According to this concept, PMSs provide not only “formal, financially quantifiable information with respect to the financial situation of a company”, but also external information associated with markets, customers, competitors, and other non-financial information. As a consequence, management controls including PMSs can be considered as tools assisting managerial decision-making and instruments helping individuals to align behaviors with goals of the unit or organization. For the alignment of managers’ and employees’ behavior with the goals of the organization, PMSs that measure the performance in line with the goals of the organization and direct and reward behavior consistent with these goals are crucial.
Literally, in the context of a business organization, Neely and Platts [34] defined performance measurement as “a process of quantifying the efficiency and effectiveness of action”. PMSs are mechanisms which not only translate strategic objectives into organizational strategies and implement strategic actions in order to achieve desired outcomes, but also align people’s activities with business strategies and use performance measures including financial, strategic, and operating measures to evaluate the performance achievement [35,36,37,38,39,40,41]. The main focus of these authors’ multi-dimensional frameworks of PMSs consisted of financial and non-financial indicators which measured the business performance of an organization. The focus was on whether economic outcomes are congruent with business strategic goals.
Johnson and Beiman [42], Poister [43], Merchant and van der Stede [3], and Sturesson et al. [44] argued that it is difficult to use economic business performance measurement to measure performance of public or non-profit organizations or state-owned enterprises because of the diversity of their organizational goals assigned by the government. Therefore, Johnson and Beiman [42], Poister [43], and Sturesson et al. [44] adapted and broadened Kaplan and Norton’s [35] balanced scorecard to performance measurement preferences for public or non-profit organizations and SOEs. These frameworks consist of not only the four traditional perspectives, namely, innovation and learning perspective, internal business perspective, customer perspective, and financial perspective, but they also include indicators relating to the government’s expectation of SOEs’ benefaction to the development of country (see References [42,44]). These types of performance measurement also include societal indicators used to evaluate SOEs’ contribution to the society related to social, economic, tax, or environmental aspects, among others, as well as performance indicators focusing on both financial and non-financial indicators which reflect the achievement of business growth such as profits, revenues, expenses, the number of customer complaints, etc. Even though there are different performance measurement frameworks due to different contexts, the main purpose of PMSs is to assist the organization to achieve organizational objectives being aligned with the stakeholders’ expectation, especially the owners’ goals [34,43,45]. Recently, non-SOE companies also included societal sustainability goals among their objectives [46,47,48]. Societal pressure increased over the past years and the question is as to whether or not private companies also include societal and environmental indicators in their PMSs since the public opinion also expects this from non-SOEs’ corporate responsible and sustainable behavior.
2.2. The Role of Outcome-Based Compensation Systems in Organizations
Compensation systems or reward systems can include a base salary, bonuses, and other incentives to guide individuals’ behavior. A firm’s objectives are often included in outcome-based reward systems. Individuals receive a compensation based on firms’ characteristics (i.e., the goals and objectives of the owners) and their contribution to the success of an organization [49,50]. Specifically, individuals and groups are compensated based on the achievement of their goals and activities if they are in alignment with organizational objectives [3,51]. A well-designed incentive system should not only satisfy individuals and groups, but also motivate and enhance their performance [8], and support firm’s objectives [52].
The choice of an appropriate incentive system or compensation or reward system depends on the firm’s objectives [4]. If a company focuses on business strategic goals, performance explained by economic outcomes becomes crucial; thus, economic outcome-based remuneration based on the achievement of economic objectives and pre-specified economic targets is preferable [3,7,50,53,54,55]. However, when an organization also has non-profit or social targets, economic performance targets cannot be the only basic for the design of the incentive systems [3,49,56]; societal indicators need to be included in the reward systems as well. When the achievement of performance targets determines in part the remuneration of managers and employees, then the organization installs outcome-based reward systems.
3. Hypothesis Development
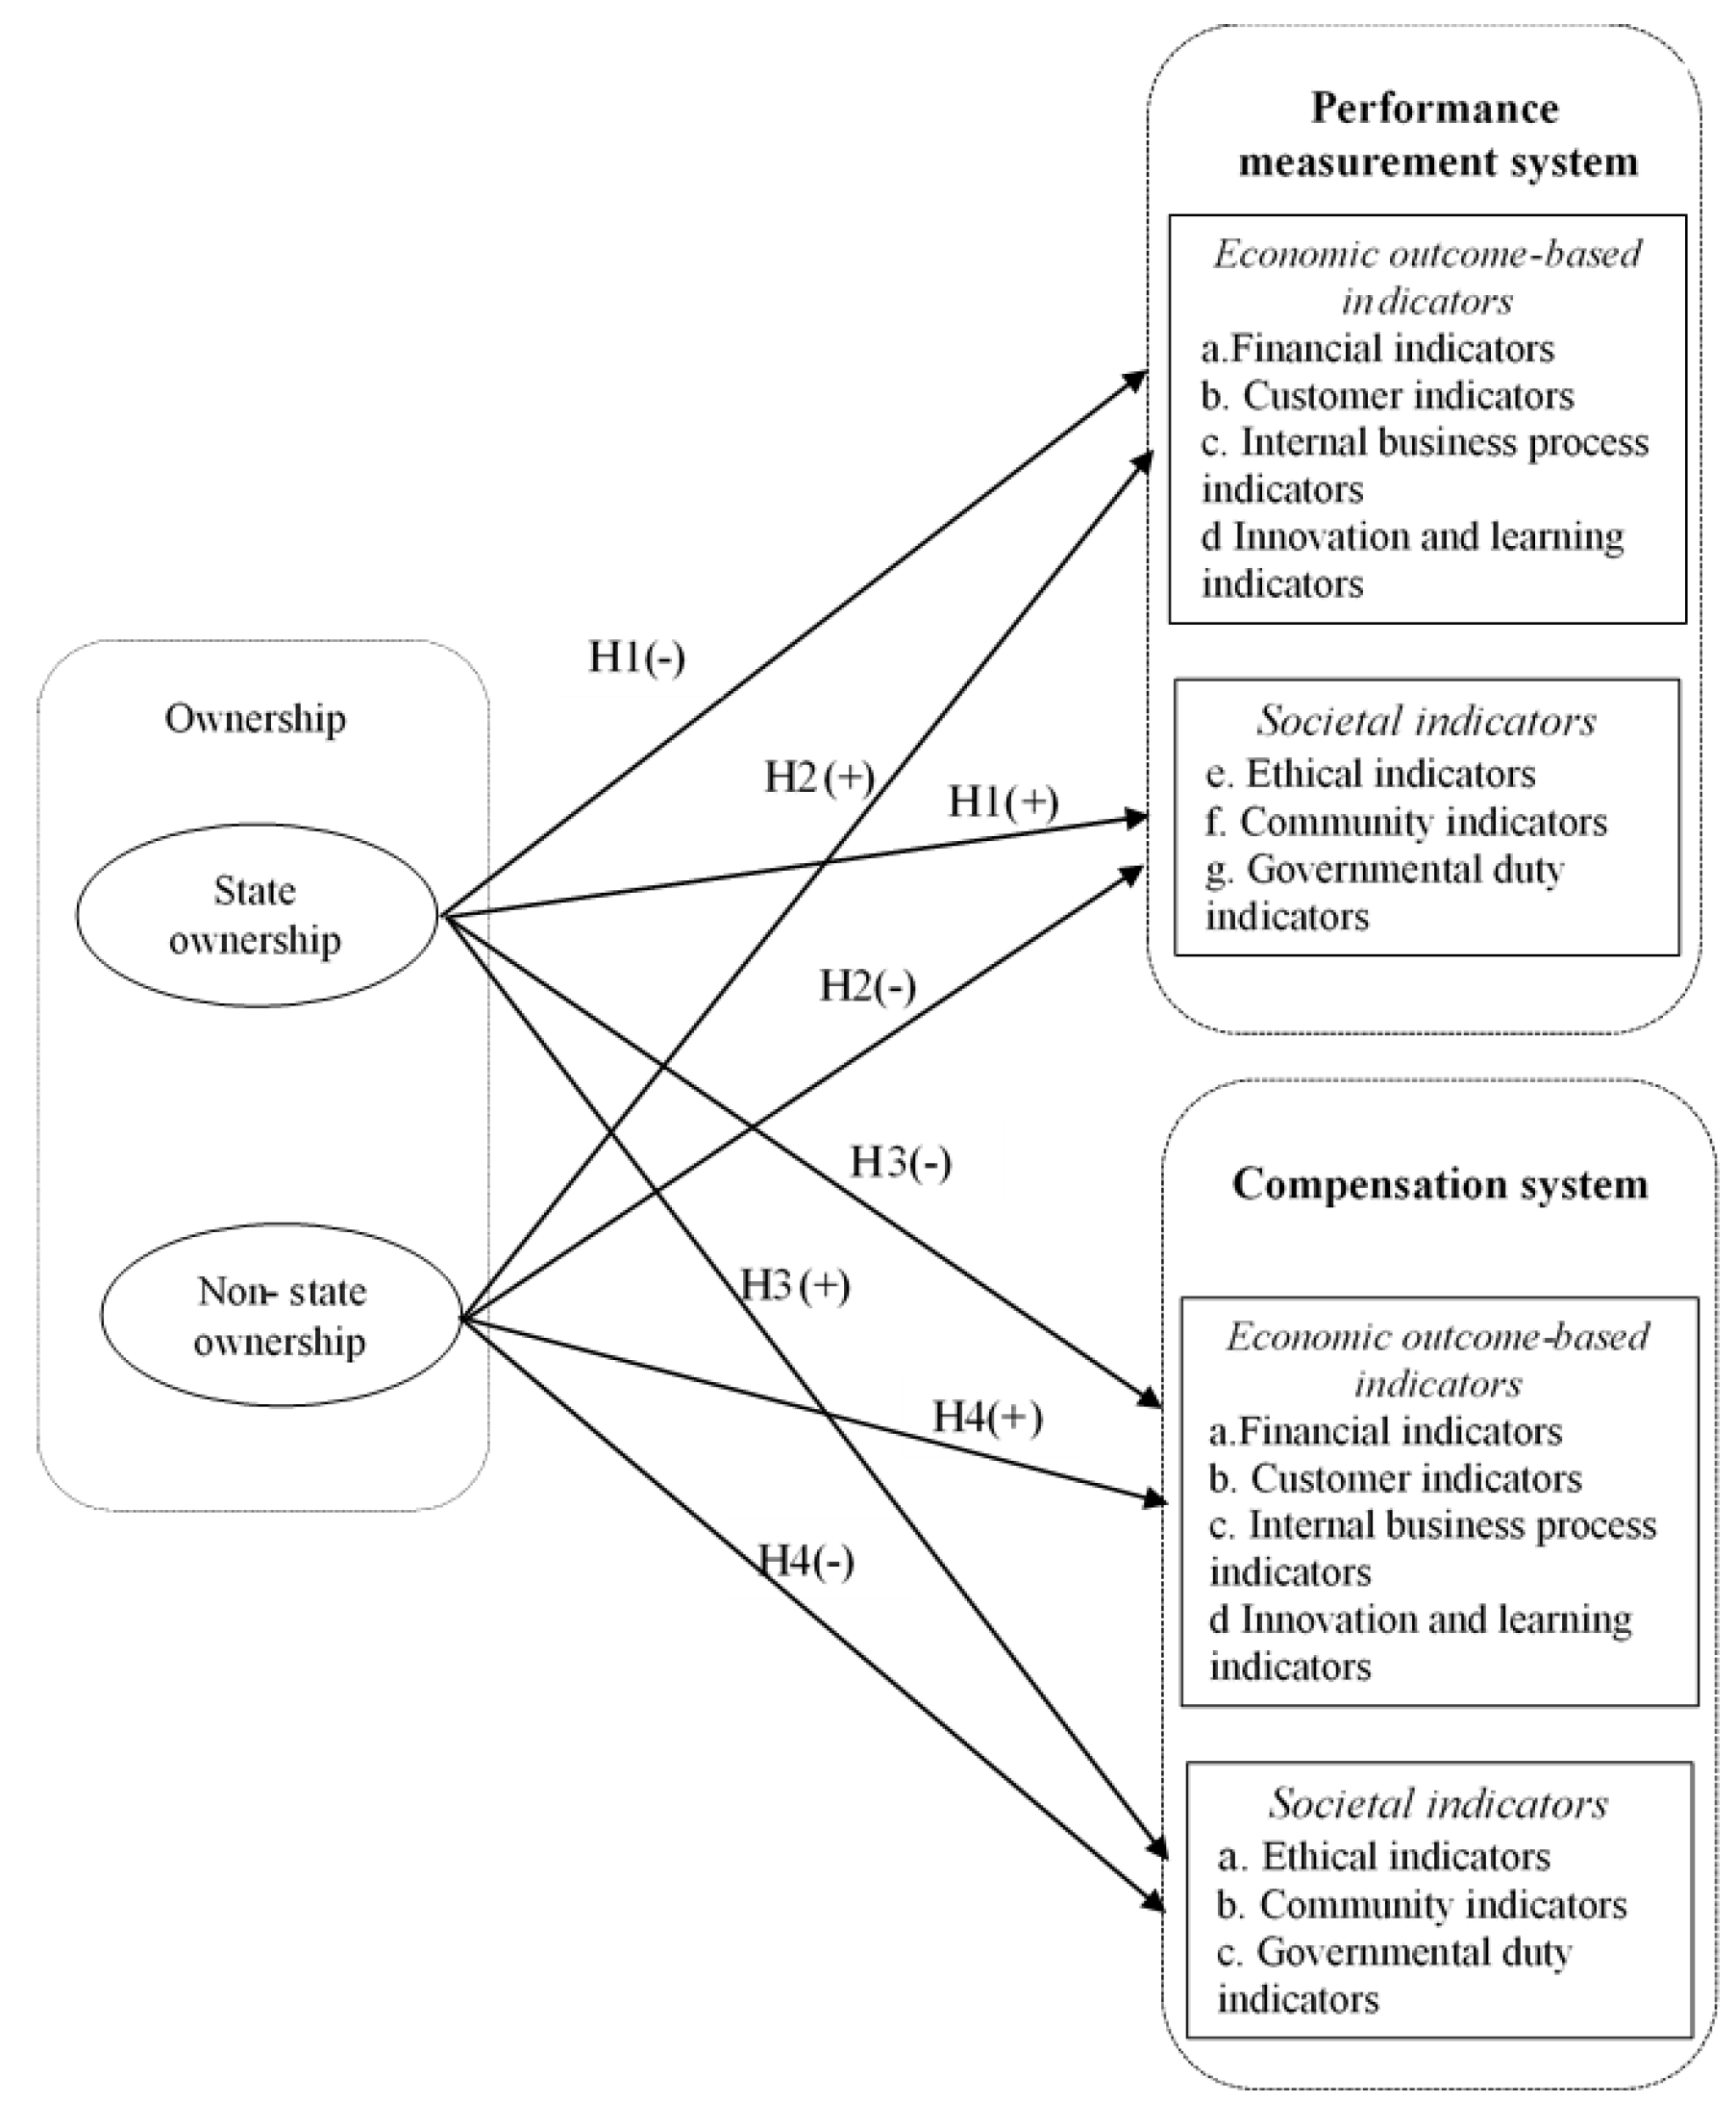
We propose that ownership characteristics (i.e., the owners’ goals and objectives) are related to a company’s design of the PMS and the indicators included in it, as well as the use of outcome-based compensation and reward systems and the indicators used for rewards. Figure 1 presents the theoretical model of the study.
3.1. Ownership Differences and the Impact on the Design of Performance Measurement Systems
According to agency theory, MCSs and, in particular, PMSs and reward systems can be used to direct managements and employee behavior and to align that behavior with company’s objectives. Based on agency theory, we hypothesize that the owners’ goals and objectives are translated into the companies’ PMSs and reward systems. Therefore, we focus on the difference between SOE goals and non-SOE goals.
Vietnamese state-owned enterprises were reformed and restructured toward market forces [57]. As a result, in Vietnam, all organizations being SOEs and non-SOEs directly compete with each other. However, despite the competition of all firms in different industries, SOEs still heavily depend on government decisions, and this dependence influences their daily operations [58]. Thus, SOEs have to achieve economic objectives, as well as social and political objectives assigned by the government, which are determined in the Enterprises Law 1995.
Important goals of state-owned enterprises are ensuring employment, maximizing social welfare, protecting the environment, and pursuing political purposes, which help to balance the whole country’s development [44,58,59,60,61,62]. As a result, SOEs are also held accountable by multiple stakeholders for achievement these goals [59,62]. These types of SOE goals are less quantifiable, more vague, sometimes conflicting with each other, and, therefore, sometimes hard to define [63]. The more indefinite the organizational goals are, the more hybrid the performance measurement is needed [42,44,56,64,65]. Both types of performance indicators, economic indicators and societal indicators, which try to measure the contribution of the SOEs to society are included in the hybrid performance measurement systems of the SOE. The literature on SOE characteristics (see References [42,44,56,59,62,63,66]) revealed that, because SOEs are likely to pay much attention to pursuing social issues, SOE PMSs are expected to include more societal indicators.
By contrast, non-SOEs need to guarantee their own survival and can determine their own objectives [58,61,67]. Therefore, non-SOEs pursue their shareholders’ interests that are mainly economic-based [59,62]. Shareholders want firm survival and growth, as well as profitability. These goals and objectives can be translated into financial and non-financial business or economic performance measures.
Because SOEs have a much wider set of goals or objectives to pursue (societal, political, and economic) in comparison to non-SOEs, we hypothesize the following:
Hypothesis H1 (H1).
The higher the share of the government in the ownership structure of an organization is, the fewer economic value outcome-based indicators (a. financial indicators; b. customer indicators; c. internal business process indicators; d. innovation and learning indicators) and the more societal indicators (e. ethical indicators; f. community indicators; g. governmental duty indicators) will be included in the performance measure system of the organization.
Hypothesis H2 (H2).
The higher the share of non-state owners in the ownership structure in an organization is, the more economic value outcome-based indicators (a. financial indicators; b. customer indicators; c. internal business process indicators; d. innovation and learning indicators) and the fewer societal indicators (e. ethical indicators; f. community indicators; g. governmental indicators) will be included in the performance measurement system of the organization.
3.2. Ownership Differences and the Relationship with the Presence of Outcome-Based Compensation Systems
SOEs are established by the government; hence, a shutdown of an SOE is not driven by market forces, but is a decision of politicians [68]. SOEs’ chief executive officers (CEOs) and managers are aware of the soft budget constraints which SOEs face [63,69,70,71,72]. Moreover, CEOs and managers are appointed by the government, sometimes based on political connections rather than professional ability or leadership styles [58,73]. Since SOEs are directly under direction of state management bodies, according to the Enterprise Law of Vietnam [67], the CEOs and the top management teams run the business along the political goals and care less about the economic targets related to financial performance, customer targets, internal efficiency, and innovation of the SOE [74]. SOE managers are aware that most decisions are interfered with by the government even though, according to laws and decrees, SOEs are said to be autonomous [58,67,73]. SOEs’ results are transferred into the government budget because the government is the ultimate owner of the SOEs [58,68,73]. As a result, the remuneration of SOE CEOs, managers, and employees is not really linked to maximizing profitability and firm value. Moreover, the remuneration in SOEs is determined by a prescribed reward system which tends to focus more on seniority and is not flexible [63,75]. As a result of this low level of flexibility with respect to incentives, in combination with the difficulty of translating societal goals into quantifiable measures, compensation in SOEs are less contingent on performance.
In contrast, non-SOEs are monitored by the market in which efficiency is the most important determinant of their survival. The owners of non-SOEs have a significant influence on determining organizational goals, whereby there is a strong focus on profitability and running the business in an efficient way. In addition, hard budget constraints which non-SOEs are highly confronted with force managers in these enterprises to create an acceptable level of efficiency for facilitating daily activities and enhancing firm survival and growth [68,73]. The threat of being eliminated by the market forces the shareholders to monitor the managers by comparing the organization’s performance with other competitors’ performance [68,73]. The owners evaluate the managers based on their individual performance, as well as on firm performance [68]. Therefore, performance-contingent rewards are determined on the basis of comparison between planned and actual economic targets [76]. If managers operate the business inefficiently, they are replaced [68,73]. Non-SOEs in comparison to SOEs prefer individual performance payment contracts which motivate staff to work hard for maximizing firm values [54,68,73,77]. Therefore, the pursuit of innovation and learning, customer satisfaction, internal efficiency, and profitability are key factors in non-SOEs. According to agency theory, incentive contracts are a mechanism to align the shareholders’ interests with managers’ interests [21,22]; therefore, we hypothesize the following:
Hypothesis H3 (H3).
The higher the share of the government in the ownership structure of an organization is, the fewer economic outcome-based indicators (a. financial indicators; b. customer indicators; c. internal business process indicators; d. innovation and learning indicators) and the more societal indicators (e. ethical indicators; f. community indicators; g. governmental duty indicators) will be included in the compensation systems of an organization.
Hypothesis H4 (H4).
The higher the share of the non-state owners in the ownership structure in an organization is, the more economic outcome-based indicators (a. financial indicators; b. customer indicators; c. internal business process indicators; d. innovation and learning indicators) and the fewer societal indicators (e. ethical indicators; f. community indicators; g. governmental duty indicators) will be included in the compensation systems of an organization.
4. Research Methodology
4.1. Data Collection
To test the hypotheses, we used survey data. The population of companies targeted for the study was determined based on the annual business surveys of the Vietnamese General Statistics Office (VGSO) in 2017. The targeted population needed sufficient variation in the ownership structure of the firms targeted. Therefore, to examine the hypotheses, our target population for this study was medium and large SOEs and non-SOEs. Decree 59/2009/ND-CP issued by the Vietnamese government on 30 June 2009 determines the size of enterprises based on two criteria: (i) the size of capital, and (ii) the number of employees. We defined medium and large firms based on the Small and Medium Enterprise Law 2017 of Vietnam. Thus, medium-sized firms in agriculture, forestry, fishing, construction, and other industries had total assets between 20 and 100 million Vietnamese dong (VND) or a number of employees ranging between 100 and 200. Medium commercial and service companies had total assets between 50 and 100 million VND or a number of employees ranging between 50 and 100. Large firms were defined as having total assets or number of employees higher than the maxima for medium-sized firms. Based on the database of VGSO, we selected the medium and large firms with the correspondent criteria in size for each industry as promulgated in the law of Vietnam.
Furthermore, we targeted firms in industries where both SOEs and non-SOEs can directly compete with each other. Thus, we do not include firms in the fields where only SOE companies are allowed to do business. Therefore, the population of this study consisted of medium and large companies in all industries listed in the annual statistics report of Vietnamese enterprises 2017 issued by VGSO, because VSGO does not include in their statistics industries in which only SOEs are allowed to operate. We decided to send the surveys to 2035 randomly selected companies, in which 1331 companies were included where the government holds shares (>0% and ≤100%). The surveys were sent to CEOs, top managers, and members of the departmental management who are in charge of production, accountancy, administration, human resources management, sales, and marketing, and who have sufficient knowledge of the questionnaire content.
For our data collection procedure, we followed the approach of Smith [78] and Dillman [79]. We sent a survey followed by two follow-up reminder surveys with three to four weeks in between in the period March 2019–June 2019. We invited each manager chosen randomly to participate by sending an email. In the email, a link was attached to the web-based questionnaire with an explanation of the purpose of the study and the assurance of confidentiality of the managers’ private information.
The survey included three sections: general information of the respondent, general information of the enterprise, and the design of the performance measurement and reward system. The questionnaire was translated from English into Vietnamese and then translated back into English to avoid the mismatch of received information [80]. To make sure both English and Vietnamese versions of the questionnaire had the same meanings, we sent two versions of the questionnaire to four lecturers and one professor of Can Tho University, who specialize in Accounting, Management Accounting, Management, and Finance. We also sent them to a guest professor of the University of Economics Ho Chi Minh City, who was previously the chief financial officer (CFO) of several big companies in Ho Chi Minh city. After checking the face validity of the items in the English and Vietnamese versions of the questionnaire, we conducted a pre-test involving eight managers (two deputy directors and six chief accountants) who worked for big companies in fishing, gas, manufacturing, and water supply industries without saying this was a pre-test. After receiving their answers, we called them to find out whether they understood all questions and whether they had suggestions for improvement and coherence of the questionnaire. This resulted in a few minor changes which related to the re-ordering of the questions in the group of societal indicators, which would make it easier for the participants to follow.
In total, we received 154 questionnaires, yielding a response rate of 7.57%. Fourteen questionnaires were deleted because some contained substantial patterns of missing data and some respondents chose the same score for all questions. As a result, our final sample for the analyses included 140 observations. Table 1 shows that most respondents were middle managers (74.3%). The firms they worked for operated in a wide range of industries, of which 43.6% belonged to the manufacturing industry. In total, 49.3% of our final sample involved large-sized firms with more than 300 employees.
In addition, we conducted a t-test to investigate the possibility of non-response bias by dividing the respondents into two groups: the early group of respondents and the late group of respondents. The results of this test showed that there were no statistically significant differences in mean, at a 5% significance level (p > 0.05). Therefore, this study was probably not affected by a non-response bias.
4.2. Measurement of Variables
The variables included in our study were based on measurement instruments that were used in published studies in the literature.
Independent main research variables. To examine the influence of ownership characteristics on the design of performance measurement and compensation systems, we measured ownership by the percentage of the ownership of state owners and non-state owners in the organizations’ ownership structures (from 0% to 100%). We followed the classification of enterprises based on VGSO’s definitions of Vietnamese firms.
- (i)
- State-owned enterprises include the following types: (1) enterprises with 100% of state capital operating under the control of the central or local governmental agencies; (2) limited companies under the management of the central or local government; (3) joint stock companies with domestic capital, of which the government shares more than 50% charter capital.
- (ii)
- Non-state-owned enterprises are enterprises set up by domestic capital. The capital may be owned by private shareholders, being one individual or a group of individuals (like a family) or the government when the capital of the government is equal to or less than 50% of the registered capital. There are the following types of non-state enterprises: (1) private enterprises; (2) cooperative name companies; (3) private limited companies; (4) joint stock companies without capital of state; (5) joint stock companies with 50% and less than 50% of charter capital shared by the government.
Dependent variables. To measure the design of the performance measurement systems and outcome-based compensation systems in the different companies, we included a broad set of indicators which measured both economically oriented and societally oriented performance indicators. To capture the economic indicators included in the PMSs and the outcome-based compensation, we used a 21-item scale developed by Hoque and James [81], which incorporates the four perspectives of Kaplan and Norton [35]. These performance indicators included financial and non-financial indicators used to measure the achievement of business goals related to innovation and learning, market position and customer satisfaction, internal business process, and profitability (see Appendix A). To measure the achievement of societal goals or the level of social responsibility of a firm, we used Hopkins’s (2005) social responsibility framework, which consists of 11 items that are congruent with the new framework for SOEs proposed by Sturesson [44]. We also included two indicators that are in line with financial supervision and performance evaluation promulgated by the Vietnamese government [56]. The respondents were asked first of all to indicate the extent to which their firms used these measures in their performance evaluation systems to evaluate a firm’s performance and, secondly, whether these indicators were also used in the outcome-based compensation if a firm had outcome-based compensation. Respondents indicated on a seven-point Likert scale from 1 “not used at all” to 7 “used to a great extent” (see Appendix A).
Control variables. Consistent with prior contingency studies on MCSs including PMSs and reward systems, we included contingent variables revealed by prior studies to significantly influence the design of MCSs as control variables in this study. Chenhall [2] reviewed the primary contextual factors that influenced the design and use of MCSs. Based on Chenhall’s [2] review, this study took strategy, size, firm age, and industry as control variables.
Strategy is defined as “a deliberate conscious set of guidelines” determining decisions about the future of an organization. To measure strategy (Strategy), we obtained the items from Chenhall [82], Chenhall and Langfield-Smith [83], Ittner, Larcker [40], and Bedford and Malmi [65] (see Appendix B). In terms of firm size, we created a dummy variable size (Size), which took a value of one for the group of firms with more than 100 employees, zero otherwise. We also controlled for firm age, which was the number of years that the firm operated in the market. For the industry (Industry), we took manufacturing as the reference category for the analysis. A dummy variable industry (Industry) with a value of one for the manufacturing firms and zero for the non-manufacturing firms was created.
4.3. Method of Analysis
To analyze the data, we conducted partial least squares (PLS) (SmartPLS (version 3.2.8) [84]) analyses. PLS is a non-parametric component-based structural equation modeling (SEM) called “variance-based SEM. PLS is used for estimating complicated constructs and simultaneously investigating complex relationships between a set of independent variables and multiple dependent variables [85,86,87]. Importantly, PLS is also considered as an appropriate option over covariance-based SEM in addressing smaller sample sizes [86,87,88]. Moreover, while covariance-based SEM needs the data to be normally distributed, PLS does not require any strict data distribution assumptions [85,86,88]. In line with Hoozée and Ngo [89], we conducted PLS for data analyses because our sample size only included 140 observations. For a small number of missing cells in the database (78 missing cells out of a total of 13,368 cells = 0.5%), we applied the “mean replacement procedure” to give them the variable’s mean score [90].
In order to avoid common method bias, Podsakoff, Mackenzie [91] introduced two salient remedies: procedure design and statistical controls. In terms of procedure design, the items in this study’s questionnaire were designed in different response formats using different Likert scales, e.g., not used at all/used to a great extent and very low emphasis/very high emphasis. We also executed Harman’s [92] single-factor test to identify whether common method bias was present [91]. This test means that if a single factor accounts for the majority of the covariance among measures, the presence of common method variance is concluded. We specifically performed a principal component analysis on 83 items measuring 15 main variables. The results show that the total variance explained by one single factor was 32.82%, which means that no single factor accounted for the majority of the covariances in dependent and independent variables, revealing that common method bias was not a concern in this study.
Our data were analyzed in two stages. Firstly, we investigated the reliability and validity of the measurements. Secondly, we examined the relationships between the constructs to assess the structural model. Finally, we ran some additional tests added to our main analyses.
5. Results
5.1. The Measurement Models
SmartPLS’s measurement model allowed us to test the reliability and validity of the constructs. We tested the reliability and validity with the use of the following tests: average variance extracted (AVE), cross-loadings, Fornell–Larcker criterion, heterotrait-monotrait ratio of correlations (HTMT) criterion, composite reliability (CR), and Cronbach’s alpha.
The reliability of the individual manifested variable that explains the variance of the individual manifested variable relative to the latent construct was calculated by the standardized outer loading of the manifested variable. The manifested variables with outer loadings of 0.7 or higher than 0.7 are satisfactory [86]. Outer loading values of greater than 0.4 are considered acceptable, and manifested variables with outer loading values of less than 0.4 should be dropped [93]. After the first run of the PLS algorithm, the results showed that the outer loadings for the item PM22_1 ”code of ethics used in PMS” on PM_Ethical were 0.240 and 0.245 where the independent variables were state ownership (State-owned) and non-state ownership (Non-state-owned) in the models, respectively. The outer loadings for the item CO22_1 “Code of ethics used in outcome-based compensation” onto CO_Ethical were 0.321 and 0.355 for the models in which the independent variables were State-owned and Non-state-owned, respectively. This proves that PM22_1 and CO22_1 did not load well on these constructs and, therefore, we deleted those items from the subsequent analyses.
The results of the second run of the PLS algorithm provided the outer loadings and the average variance extracted (AVE). To analyze the convergent validity, we considered the outer loadings and the average variance extracted (AVE) [86]. The results show that all outer loadings were greater than 0.6, confirming the reliability of the individual manifested variables (see Appendix C). AVE is calculated to indicate the average communality for each latent variable in the model. A sufficient degree of the AVE should be above 0.5 since the latent constructs should explain at least 50% of the variance of their respective indicators [86,94]. All AVE values of all constructs were found greater than the threshold value of 0.5 (Table 2 and Table 3). These results confirmed the convergent validity of the measurement models.
Next, we calculated the discriminant validity for evaluating whether all construct measures were relevant to the designated latent constructs and distinct from other constructs by using cross-loadings and the Fornell–Larcker criterion [95]. First, to determine discriminant validity, we used AVE values to calculate the square root of AVE for each latent variable. The rule of thumb is that the square root of AVE of each latent variable should be higher than its correlations with other latent variables. The results show that the square root of AVE for each latent variable in the diagonal cells was greater than any correlation between latent variables, indicating satisfactory discriminant validity [86,94,95] (see Appendix D). Second, the results also show that all item loadings of observed variables were higher on their respective construct than on any other constructs (see Appendix C). We also used the HTMT criterion to detect the discriminant validity. The cut-off value of HTMT ratio should be below 0.9; then, the discriminant validity should be established as suggested by Hesenler, Ringle [96]. All HTMT ratios of all constructs were found to be below 0.9, demonstrating the discriminant validity of our constructs.
To assess the internal consistency of the measurement models, we used the composite reliability (CR) and Cronbach’s alpha for each latent variable. CR is considered as an alternative of Cronbach’s alpha because CR is believed to give a higher level of true reliability. The results demonstrate that CR and Cronbach’s alpha scores of all constructs were higher than the minimum threshold of 0.7 (Table 2 and Table 3) [88].
Consequently, based on the adequate degrees of convergent validity, discriminant validity, and internal consistency, we could confirm that the measurement models of H1, H2, H3, and H4 were acceptable.
5.2. Structural Model
Next, we assessed the results of the structural models for the hypotheses H1, H2, H3, and H4 [86]. Firstly, we checked multi-collinearity between the latent variables using the variance inflation factor (VIF). For a well-fitted model, the inner VIF values should be greater than 4.0 [97]. Some scholars recommended a maximum VIF threshold of 5.0, while others suggested a maximum value of 10 to be acceptable [98,99]. The results show that all inner VIF values were below 4.0, confirming that the multi-collinearity in this study was not a concern. Secondly, we ran bootstrapping analyses based on 5000 replacements, with a bias-corrected and accelerated bootstrap confidence interval and two-tailed tests at a significant level of 0.05, as suggested by Hair Jr., Ringle [87]. This test provided the coefficient of determination (R2), the structural path coefficients (β), and the effect size coefficients (f2), which were used to evaluate the structural models. The predictive relevance of the model (Q2) was also calculated by using blindfolding.
R2 measures the overall size and indicates the percentage of the variance in a dependent variable explained by the model. Chin [94] recommended cut-off values of R2 for endogenous latent variables as follows: 0.67 (substantial), 0.33 (moderate), and 0.19 (weak). The effect size coefficient (f2) measures the degree of the impact of an independent variable on dependent variables. Cohen [100] recommended the threshold values of f2 as 0.02, 0.15, and 0.35 for small effect, medium effect, and large effect, respectively. More importantly, according to Hair et al. [86], when f2 is lower than 0.02, there is no relationship between variables.
5.2.1. Ownership Differences and the Relationship with the Design of Performance Measurement Systems (Hypotheses H1 and H2)
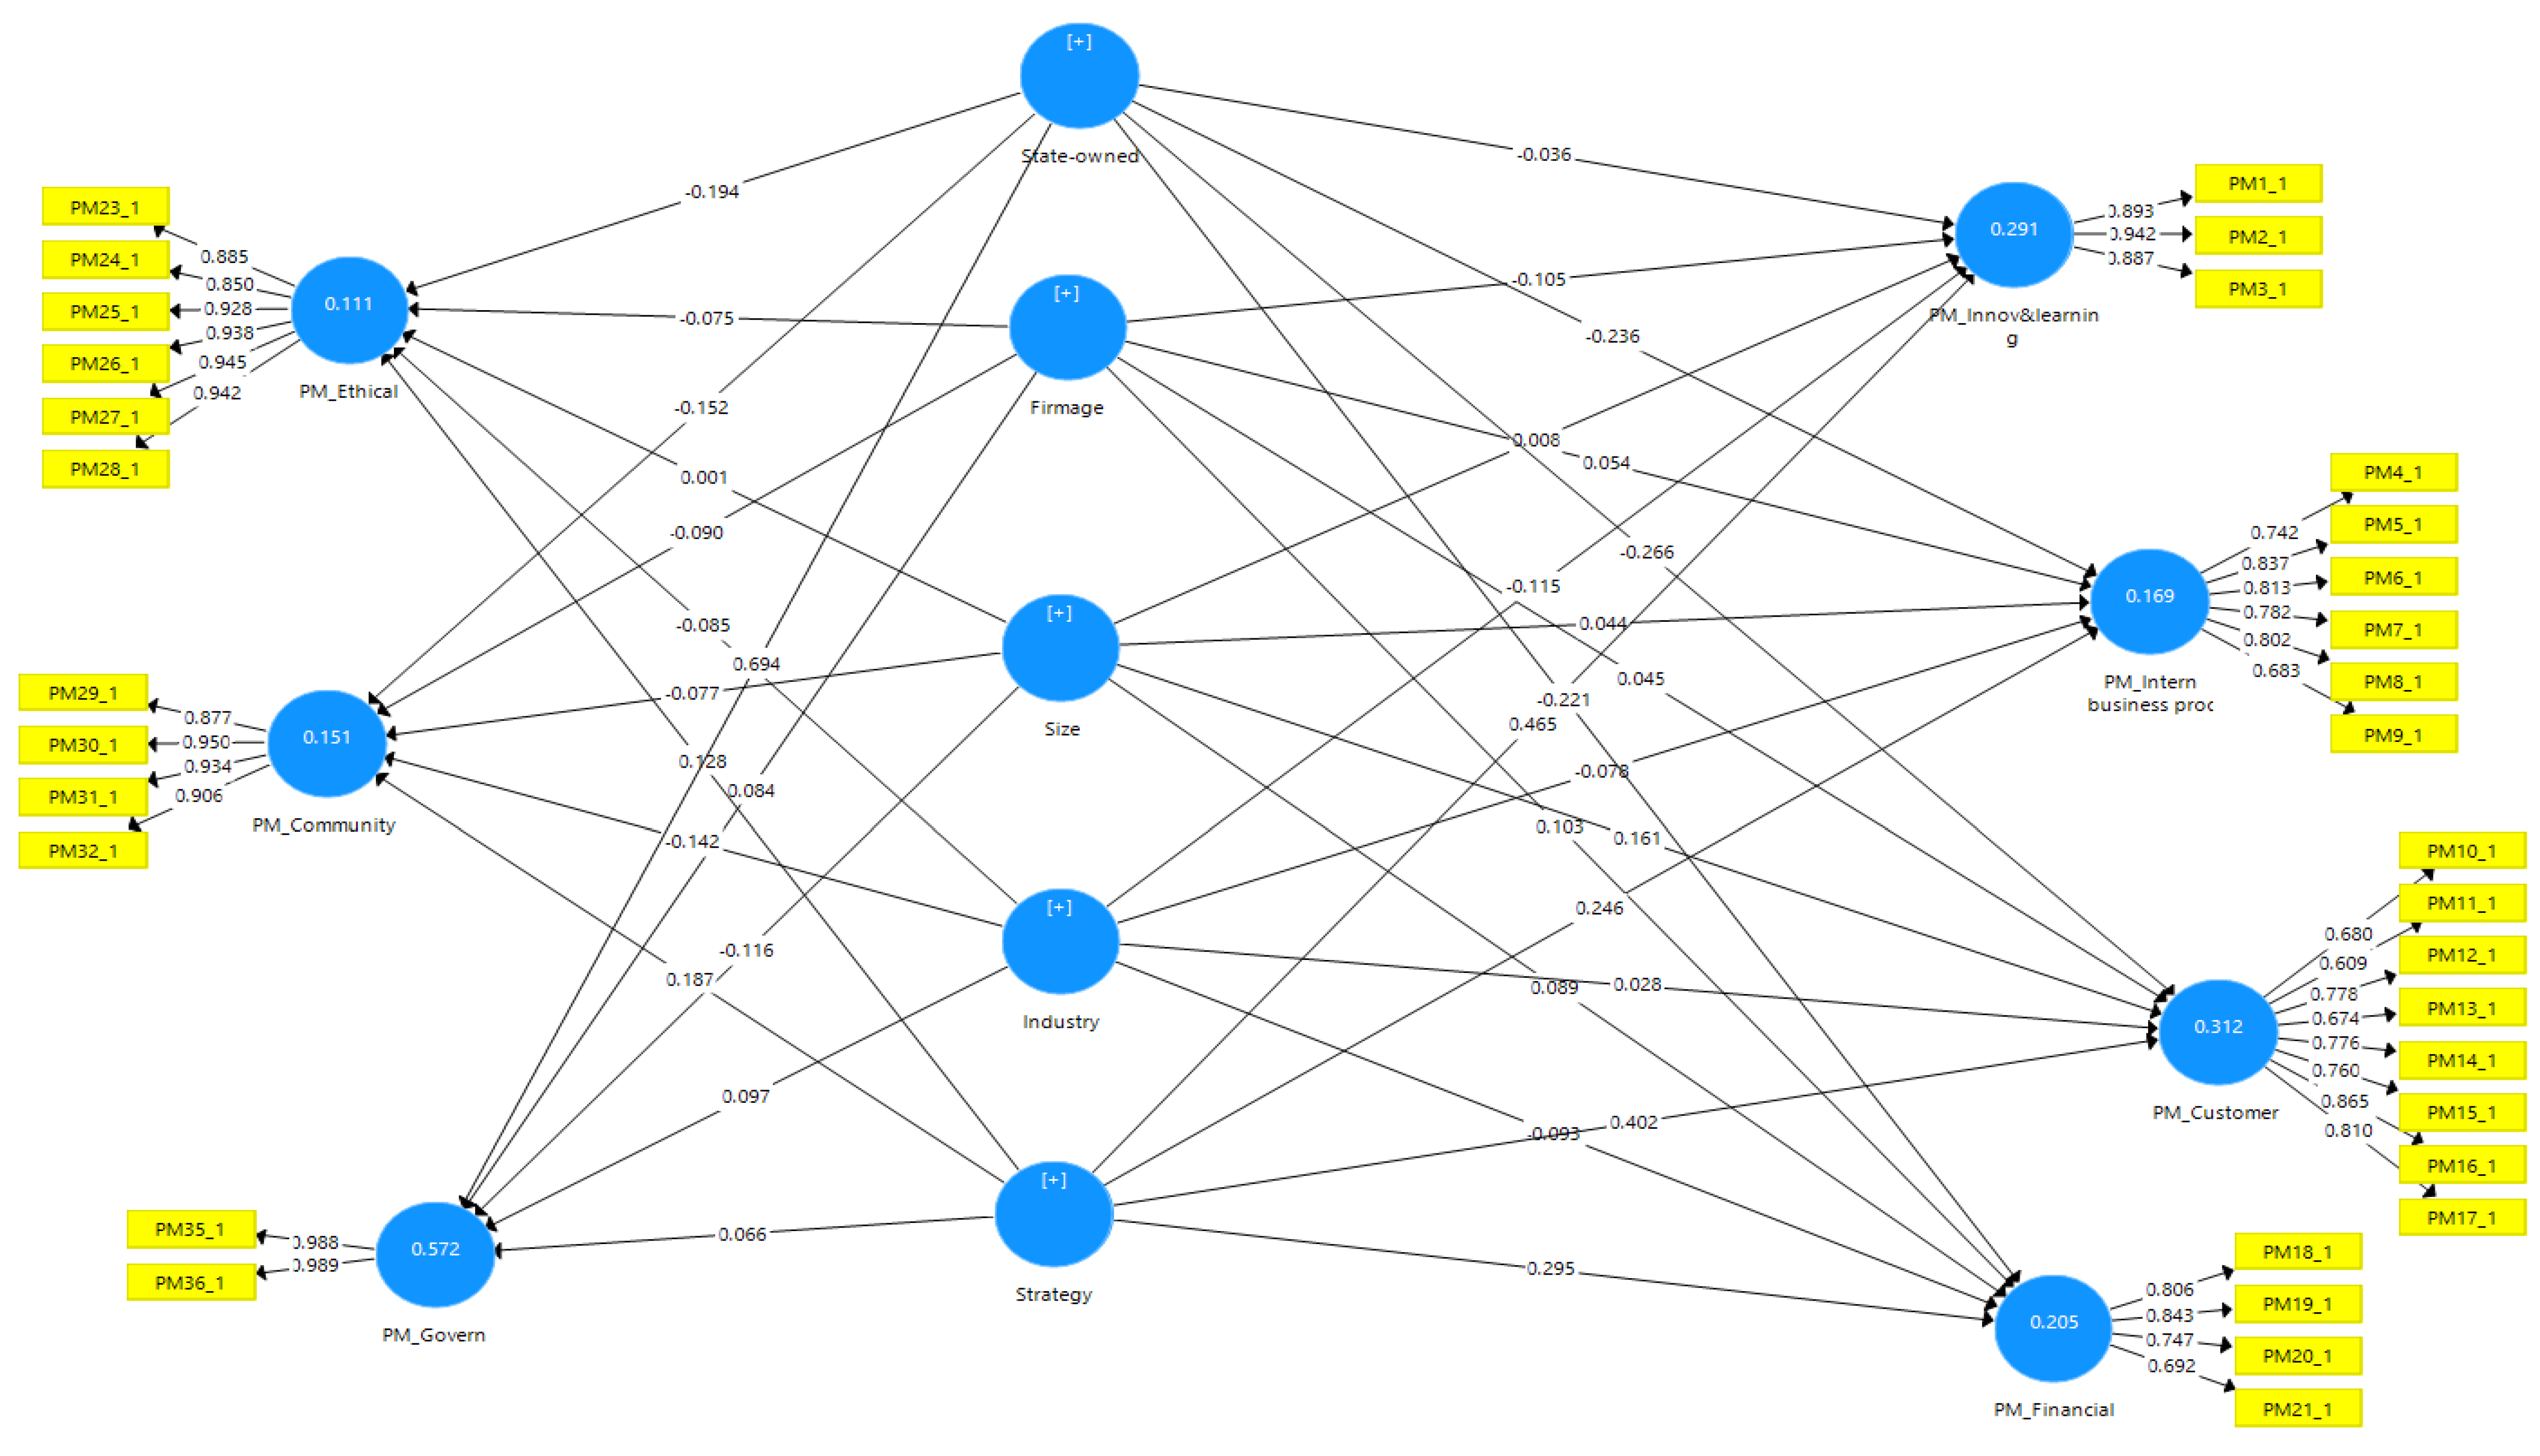
Firstly, we discuss the results with respect to SOEs. Based on the results presented in Table 4, we observed negative significant paths between state ownership (State-owned) and financial indicators (PM_Financial) (β = −0.221, p < 0.05, f2 = 0.044), customer indicators (PM_Customer) (β = −0.266, p < 0.01, f2 = 0.074), and internal business process indicators (PM_Intern buss proc) (β = −0.236, p < 0.01, f2 = 0.048), and no relationship with innovation and learning indicators (PM_Innov&learning). As a result, we support H1a, H1b, and H1c, but reject H1d. These results indicate that when an organization has a higher share of state ownership in the ownership structure, its PMSs focus significantly less on economic value outcome-based indicators. We also found a significant negative relationship between state ownership (State-owned) and ethical indicators (PM_Ethical) with a small effect size (β = −0.194, p < 0.05, f2 = 0.031). Hence, we found no support for H1e. We also did not find any significant association between state ownership (State-owned) and the presence of community indicators (PM_Community) in the SOE PMSs, which implies that H1f is not supported. However, the results show that the path between state ownership (State-owned) and governmental duty indicators (PM_Govern) was positively significant with a strong effect size (β = 0.649, p < 0.01, f2 = 0.813). Therefore, H1g is supported. The findings indicate that the higher the share of the government in the ownership structure of an organization is, the more SOE firms include governmental duty indicators and the less significantly they include ethical indicators in their performance measurement systems, whereas we found insignificant results with respect to community indicators.
We now focus on the results of non-SOEs and their use of performance indicators for performance measurement. Table 4 shows a positive significant path between non-state ownership (Non-state owned) and financial indicators (PM_Financial) with a small effect size (β = 0.230, p < 0.01, f2 = 0.065), leading to support for H2a. Additionally, the path between non-state ownership (Non-state-owned) and customer measures (PM_Customer) was found to be significantly positive with a small effect size (β = 0.160, p < 0.05, f2 = 0.034). Thus, our results support H2b. However, we did not observe any significant association between non-state ownership (Non-state owned) and innovation and internal business process measures (PM_Intern buss proc), and innovation and learning indicators (PM_Innov&learning). As a result, we do not support H2c and H2d. Our results imply that the higher the share of the non-state owners in the ownership structure in an organization is, the more significantly PMSs include financial indicators and customer indicators. With respect to internal business process indicators and innovation and learning indicators, the level of non-state ownership does not make a difference. Additionally, the results show no significant paths between non-state ownership (Non-state owned) and ethical indicators (PM_Ethical), and community indicators (PM_Community). As a result, we do not support H2e and H2f. Nonetheless, a significant negative relationship between non-state ownership (Non-state owned) and governmental duty measures (PM_Govern) was observed with a moderate effect size (β = −0.338, p < 0.01, f2 = 0.165), which was expected since these government goals do not apply to non-SOEs. Hence, our results support H2g. Therefore, as expected, the higher the share of the non-state owners in the ownership structure in an organization is, the fewer governmental duty indicators are included in the PMS of the firm. However, it was noted that the PMS of an organization in which the non-state owners hold a higher share in the ownership structure does not pay more attention to ethical and community perspectives than organizations in which private ownership is less.
5.2.2. Ownership Differences and the Relationship with the Compensation Systems (Hypotheses H3 and H4)
With respect to the compensation systems, focusing on SOEs, the results presented in Table 4 show negative significant paths with small effect sizes between state ownership (State-owned) and financial indicators (CO_Financial) (β = −0.340, p < 0.01, f2 = 0.103), customer indicators (CO_Customer) (β = −0.298, p < 0.01, f2 = 0.089), and internal business process indicators (CO_ Intern buss proc) (β = −0.277, p < 0.01, f2 = 0.068). These results allow us to support H3a, H3b, and H3c. However, we did not find any relationship between state ownership (State-owned) and innovation and learning perspective (CO_Innov&learning). As a consequence, we do not support H3d. The results seem to be in line with our expectations that the higher the share of the government in the ownership structure of an organization is, the less economic outcome-based (a. financial indicators; b. customer indicators; c. internal business process indicators) the compensation is. Moreover, the inclusion of innovation and learning indicators in the compensation systems is not affected by ownership characteristic. Furthermore, we found a significant negative relationship between state ownership (State-owned) and ethical indicators (CO_Ethical) with a small effect size (β = −0.224, p < 0.05, f2 = 0.041). Consequently, H3e is not supported. There was no significant association between state ownership (State-owned) and community measures (CO_Community). Thus, we reject H3f. However, we observed a significant positive path of state ownership (State-owned) and governmental duty indicators (CO_Govern) and their inclusion in outcome-based compensation systems, with a strong effect size (β = 0.654, p < 0.01, f2 = 0.653). These results support H3g. It seems reasonable that, when the share of the government in the ownership structure of an organization is higher, their compensations seem to be based more on governmental duty measures. Surprisingly, the inclusion of ethical and community indicators in the compensation is not influenced by the level of state shareholding in the ownership structure.
In the case of the appearance of non-state shareholders in the ownership structure of an organization, we observed two significant positive paths with small effect sizes between non-state ownership (Non-state owned) and financial indicators (CO_Financial) (β = 0.304, p < 0.01, f2 = 0.110) and customer measures (CO_Customer) (β = 0.172, p < 0.05, f2 = 0.038). Hence, we support H4a and H4b. The relationships between non-state ownership (Non-state owned) and internal business process indicators (CO_Intern buss proc) and innovation and learning measures (CO_Innov&learning) were not significant, leading to a rejection of H4c and H4d. Consequently, our results confirm that the higher the share of the non-state owners in the ownership structure of an organization is, the more financial and customer indicators are included in the outcome-based compensations, whereas the inclusion of internal business process indicators and innovation and learning indicators is not significantly influenced by the ownership structure. Moreover, we did not observe any significant relationships between non-state ownership and ethical indicators nor community indicators. Thus, we reject H4e and H4f. However, we found a negative significant path between non-state ownership (Non-state owned) and governmental duty indicators (CO_Govern), with a moderate effect size (β = −0.340, p < 0.01, f2 = 0.167) which gives support for H4g. As expected, when a higher share of non-state owners in the ownership structure of a firm is present, the compensation systems focus significantly less on governmental duty indicators. We also found that non-SOE ownership is not related to the inclusion of ethical-oriented and community-oriented indicators in the outcome-based compensation.
In addition to β-value, p-value and f2 value, we also examined the predictive validity of the PLS path model by running a Q2 test using blindfolding procedures; moreover, construct cross-validated redundancy was performed as recommended by Tenenhaus et al. [101]. Hair et al. [87] proposed a Q2 value larger than zero for a particular endogenous latent variable indicating the predictive relevance of the conceptual model for this certain variable. Table 5 shows that all Q2 values of all endogenous constructs were larger than zero, indicating sufficient evidence of the predictive relevance of the path models. The R2 value of each endogenous variable is also reported in Table 5.
5.3. Additional Analyses
To check the robustness of our findings, we ran three additional tests. Firstly, we excluded those organizations which had a firm age less than five years. This resulted in a subsample of 135 observations. We re-ran the PLS path models with the subsample of 135 observations. The results from this test were consistent with those in the main analyses. Secondly, we conducted a robustness test on a subsample of 132 observations, whereby we left out eight small-sized firms which had a number of employees no more than 100. The results of this test were not different from those in the main analyses except that the effect sizes were slightly higher. Thirdly, we left out one firm with total assets of less than 20 million VND, resulting in a new subsample of 139. Our main results still remained unchanged. All results of the robustness checks are available from the authors if requested.
6. Conclusions, Limitations, and Future Research
This study aimed to examine the influence of ownership differences (changing from 100% state ownership to 100% non-state ownership) on PMSs and compensation and reward systems, whereby both the presence of economic and societal indicators derived from shareholders’ objectives and goals were included in the study. With a small sample size of 140, we analyzed data by using PLS-SEM. This method is seen as an effective technique for developing, validating, and analyzing complex models with smaller sample sizes. The measurement models revealed that our multi-item constructs were reliable and valid (see Table 2 and Table 3), while the R2 and Q2 values in the structural models were used to confirm the existence of significant paths (see Table 5).
Contrary to our hypotheses, as shown in Table 4 (columns 1–3 and columns 7–9), state ownership is not significantly related to the inclusion of more community indicators in PMSs and outcome-based compensation systems. Additionally, a significant negative relationship between state ownership and ethical indicators was found. The results revealed a positive significant relationship between state ownership and governmental duty indicators. With respect to economic indicators, we found, in support of our hypotheses, negative significant paths between state ownership and economic outcome-based indicators including financial indicators, customer indicators, and internal business process indicators, but no association between state ownership and innovation and learning indicators. This means that organizations with a higher share of government ownership focus their PMSs and their outcome-based compensation systems more on governmental duty indicators, but significantly less on ethical indicators. The presence of community indicators is not influenced by the share of the state. The designs of their PMSs and outcome-based compensation systems also focus less on economic value outcome-based indicators, particularly internal business process indicators, customer indicators, and financial indicators. The inclusion of innovation and learning indicators in SOE PMSs and outcome-based compensation systems is not affected by the presence of state owners in the ownership structure.
These findings can be explained by considering the results in the context of the Vietnamese institutional and regulatory environment. SOEs in Vietnam operate under specific laws and regulations that only apply to SOEs. SOE activities are under control of the government, and SOEs have to report their activities annually to the government. However, since the reporting guidelines of the government for SOEs lack societal measures and economic value-based indicators, SOEs probably pay much less attention to these issues and, therefore, include these indicators much less in their PMSs and compensation systems. Since the privatization program is in progress in Vietnam, the state is still learning from privatization experiences of other countries. The laws, regulations, and guidelines for SOEs are still in the process of adjustment and modification in line with both economic and societal goals. Our results show that, if the Vietnamese government wants SOEs to respect ethical behavior and develop a community attitude, it needs to not only include these elements in the laws, but also to make sure that the law is enforced. Only then will PMSs and compensation systems in SOEs include both economically oriented and societally oriented indicators and instigate managers and employees to act upon them.
Focusing on non-SOEs, as the results show in Table 4 (columns 4–6 and columns 10–12), with respect to economic indicators, the relationship between non-state ownership and the inclusion of financial indicators and customer indicators in PMSs and outcome-based compensation systems is significant. By contrast, the results do not support our hypotheses related to the influence of non-state ownership on the inclusion of internal business process indicators and innovation and learning indicators in both PMSs and compensation systems. The results showed insignificant paths between non-state ownership and internal business indicators, and innovation and learning indicators. In terms of societal indicators, as expected, the association between non-state ownership and governmental duty indicators is significantly negative. However, an influence of non-state ownership on the inclusion of ethical indicators and community indicators in PMS and compensation was not found. This means that the design of their PMSs and outcome-based compensation systems includes more economic outcome-based indicators, specifically financial indicators and customer indicators, and significantly fewer governmental duty indicators. The presence of internal business process indicators, innovation and learning indicators, ethical indicators, and community indicators in PMSs and outcome-based compensation systems is not affected by the level of non-state shareholding in the ownership structure.
Different from SOEs, non-SOEs have to fund themselves, which forces them to include economic outcome-based indicators in their PMSs and outcome-based compensation. Nonetheless, this study partly confirms our expectations that, the higher the share of non-state owners in the ownership structure is, the more the company includes economic outcome-based indicators in their PMSs and compensation systems. This is true for indicators focusing on financial and customer perspectives, but not on internal business process perspectives and innovation and learning perspectives. Societal pressure for ethical and sustainable behavior does not yet convince non-SOEs to include ethical indicators or community-oriented indicators in their PMSs and related reward systems. In the last few decades, more private organizations in developed countries increased their awareness of social and environmental responsibilities for globally sustainable development. They started to embrace these goals in their MCSs, especially in their PMSs and compensation systems, a long time ago. Despite the increasing awareness of corporate social responsibility worldwide, Vietnamese non-SOEs do not follow this trend. Vietnam’s economy just transformed from a centrally planned economy into a market-oriented economy in 1986, leading to a privatization program in the whole country. After years of delays, Vietnam’s privatization plans moved up a gear with a goal of program completion in 2020. Thus, it can be seen that Vietnam is just a young economy compared to other developed countries in the world. Therefore, non-SOEs are at the beginning stage of economic development and competition in global market. Consequently, their focus on ethical and community indicators is not emphasized. In order to stimulate a change here, the public opinion in Vietnam needs to exert more pressure on companies, like the public does in other parts of the world, to propagate companies toward social responsible and sustainable behavior.
In all, these results are partly consistent with our expectations. We expected a diversity of goals related to ensuring employment, maximizing social welfare, protecting the environment, and developing the economy of Vietnam, seen as sustainable development missions of SOEs, which would suggest that Vietnamese SOE performance measurement systems and compensation systems should focus on societal indicators in addition to economic goals [102]. While Chinese SOEs’ awareness of corporate social responsibility (CSR) emerged in recent years by building CSR measurements and disclosing CSR in their annual reports related to the environment, labor practices, contributions to the community, and their political responsibility [103,104,105,106,107], SOEs in Vietnam show a different situation.
The Vietnamese government promulgated and executed may laws, regulations, and guidelines for all enterprises operating in Vietnam, such as the law on environmental protection, the labor law, the law on consumer rights protection, etc. This proves that the Vietnamese government aims to develop the country in a sustainable way. However, our results showed that, in order to pursue corporate sustainable and social behavior, the Vietnamese government needs to also improve its judicial system, which will then lead to stricter enforcement of the regulations. We notice that the current laws are not yet sufficient to stimulate a corporate social responsible attitude of companies in Vietnam.
As with other studies, our study also had some limitations. Firstly, our response rate was quite low, even though the early/late test did not show any issues of non-response bias. However, our sample size is comparable to prior management accounting studies [89,108]. Secondly, the presence of foreign ownership in the ownership structure of an organization might also influence the design of PMSs and compensation systems [10,109,110]. Firth [10] showed that the diffusion of managerial accounting procedures in Chinese joint ventures is influenced by foreign partners. Therefore, it would be interesting to research how foreign ownership influences the design of PMSs and compensation systems in Vietnam.
With these results, we contribute to the literature in three ways. Firstly, we provide evidence that firm ownership is a significant contingent variable explaining the design of PMSs and outcome-based compensation systems in firms. Secondly, we study the relationship between ownership characteristics and PMSs in an emerging economy, which also allows including state-owned firms. Thirdly, we add to the PMS literature by also including indicators focusing on ethical behavior, community attitude, and compliance with government objects.
Author Contributions
T.C.T.L., A.J. and I.P. developed the introduction, literature review, hypothesis development and the survey instrument. T.C.T.L. collected the data with the survey instrument in Vietnam and ran the analyses. A.J. and I.P. provided advice on the analyses section. T.C.T.L., A.J. and I.P. wrote together the results, discussion and conclusion.
Funding
This research received no external funding.
Conflicts of Interest
The author declare that we have no conflict of interest.
Appendix A. Measurements of the Constructs

| Main Constructs | Indicators | Codes | |
|---|---|---|---|
| PMS | Compensation Systems | ||
| Economic value-based indicators | |||
| Innovation and learning perspective PM_Innov&learning CO_Innov&learning | 1. Number of new product launches | PM1_1 | CO1_1 |
| 2. Number of new patterns | PM2_1 | CO2_1 | |
| 3. Time to market new products | PM3_1 | CO3_1 | |
| Internal business perspective PM_Intern buss proc CO_Intern buss proc | 4. Labor efficiency variance | PM4_1 | CO4_1 |
| 5. Rate of material scrap loss | PM5_1 | CO5_1 | |
| 6. Material efficiency variance | PM6_1 | CO6_1 | |
| 7. Manufacturing lead time | PM7_1 | CO7_1 | |
| 8. Ratio of good output to total output | PM8_1 | CO8_1 | |
| 9. Percent defective products shipped | PM9_1 | CO9_1 | |
| Customer perspective PM_Customer CO_Customer | 10. Survey of customer satisfaction | PM10_1 | CO10_1 |
| 11. Number of customer complaints | PM11_1 | CO11_1 | |
| 12. Market share | PM12_1 | CO12_1 | |
| 13. Percent shipments returned due to poor quality | PM13_1 | CO13_1 | |
| 14. On-time delivery | PM14_1 | CO14_1 | |
| 15. Warranty repair cost | PM15_1 | CO15_1 | |
| 16. Customer response time | PM16_1 | CO16_1 | |
| 17. Cycle time from order to delivery | PM17_1 | CO17_1 | |
| Financial perspective PM_Financial CO_Financial | 18. Operating income | PM18_1 | CO18_1 |
| 19. Sales growth | PM19_1 | CO19_1 | |
| 20. Return on investment | PM20_1 | CO20_1 | |
| 21. Production costs | PM21_1 | CO21_1 | |
| Societal indicators | |||
| Ethical indicators PM_Ethical CO_Ethical | 22. Code of ethics | PM22_1 | CO22_1 |
| 23. The amount of litigation involving corporate lawbreaking | PM23_1 | CO23_1 | |
| 24. The number of fines resulting from illegal activities (e.g., illegally comply with regimes, and policies such as tax, budget remittance, insurance, etc.) 25. Number of managers and employees convicted of illegal activities | PM24_1 | CO24_1 | |
| PM25_1 | CO25_1 | ||
| 26. Number of fines, number of product recalls, pollution performance measured against industry standard (e.g., number of fines, litigation from pollution, toxic waste) | PM26_1 | CO26_1 | |
| 27. Amount of litigation, number of fines from false advertising | PM27_1 | CO27_1 | |
| 28. Number of fines, amount of litigation from public controversy | PM28_1 | CO28_1 | |
| Community indicators PM_Community CO_Community | 29. Number of giving programs for community welfare as % of earnings | PM29_1 | CO29_1 |
| 30. Number of community programs | PM30_1 | CO31_1 | |
| 31. Cost of community programs | PM31_1 | CO32_1 | |
| 32. Outcomes of community programs | PM32_1 | CO33_1 | |
| Governmental duty indicators PM_Govern CO_Govern | 33. Number of completed services or products assigned by government | PM35_1 | CO35_1 |
| 34. Total value of completed services or products assigned by government | PM36_1 | CO36_1 | |
Appendix B. The Measurement of Strategy
Please indicate the emphasis your firm places on the following strategic priorities relative to your competitors. Please rate from 1 = “very low emphasis” to 7 = “very high emphasis”.
| Types of Strategy | Codes |
|---|---|
| Low cost | |
| 1. Low-cost products/services | ST1_1 |
| 2. Low price | ST2-1 |
| Innovation | |
| 3. Being first to market with new products/services | ST4_1 |
| 4. Extensive range of products/services | ST5_1 |
| 5. Rapid volume or product/service mix changes | ST6_1 |
| 6. Experimenting with new products/services | ST7_1 |
| Customer focus | |
| 7. Providing high-quality products/services | ST7_1 |
| 8. Accurately meeting delivery agreement | ST8_1 |
| 9. Providing effective after-sales services and support | ST9_1 |
| 10. Providing fast delivery of products/services | ST10_1 |
| 11. Superior customer services | ST11_1 |
Appendix C. Outer Loadings of the Measurement Models
a Cross-loading of the measurement model of the relationship between SOEs and PMSs.
| Firmage | Industry | PM_ Community | PM_ Customer | PM_ Ethical | PM_ Financial | PM_ Govern | PM_Intern_ Business_Proc | PM_Innov&Learning | Size | State-Owned | Strategy | |
|---|---|---|---|---|---|---|---|---|---|---|---|---|
| PM10_1 | −0.014 | −0.076 | 0.208 | 0.68 | 0.209 | 0.414 | −0.036 | 0.407 | 0.405 | 0.129 | −0.221 | 0.313 |
| PM11_1 | 0.056 | −0.126 | 0.149 | 0.609 | 0.469 | 0.281 | −0.128 | 0.279 | 0.107 | 0.206 | −0.154 | 0.174 |
| PM12_1 | −0.077 | −0.238 | 0.412 | 0.778 | 0.362 | 0.531 | −0.173 | 0.437 | 0.412 | 0.149 | −0.358 | 0.482 |
| PM13_1 | −0.069 | −0.146 | 0.188 | 0.674 | 0.481 | 0.408 | −0.109 | 0.409 | 0.266 | 0.161 | −0.173 | 0.245 |
| PM14_1 | −0.047 | −0.071 | 0.335 | 0.776 | 0.27 | 0.493 | −0.063 | 0.504 | 0.273 | 0.175 | −0.288 | 0.324 |
| PM15_1 | −0.149 | −0.037 | 0.375 | 0.76 | 0.344 | 0.344 | −0.038 | 0.468 | 0.423 | 0.08 | −0.224 | 0.383 |
| PM16_1 | 0.006 | −0.028 | 0.297 | 0.865 | 0.224 | 0.383 | −0.158 | 0.461 | 0.408 | 0.258 | −0.267 | 0.404 |
| PM17_1 | −0.073 | −0.031 | 0.341 | 0.81 | 0.293 | 0.404 | −0.176 | 0.597 | 0.443 | 0.098 | −0.331 | 0.418 |
| PM18_1 | −0.001 | −0.099 | 0.171 | 0.353 | 0.152 | 0.806 | −0.044 | 0.374 | 0.213 | 0.137 | −0.282 | 0.217 |
| PM19_1 | −0.02 | −0.11 | 0.231 | 0.449 | 0.196 | 0.843 | −0.073 | 0.406 | 0.205 | 0.155 | −0.312 | 0.315 |
| PM1_1 | −0.172 | −0.136 | 0.351 | 0.42 | 0.249 | 0.246 | −0.103 | 0.383 | 0.893 | 0.075 | −0.214 | 0.468 |
| PM20_1 | 0.015 | −0.126 | 0.301 | 0.512 | 0.314 | 0.747 | 0.156 | 0.466 | 0.32 | 0.082 | −0.084 | 0.291 |
| PM21_1 | −0.008 | −0.298 | 0.252 | 0.411 | 0.21 | 0.692 | −0.058 | 0.583 | 0.288 | 0.047 | −0.234 | 0.278 |
| PM23_1 | −0.091 | −0.23 | 0.462 | 0.415 | 0.885 | 0.271 | −0.171 | 0.358 | 0.276 | 0.036 | −0.266 | 0.203 |
| PM24_1 | −0.107 | −0.141 | 0.41 | 0.344 | 0.85 | 0.262 | −0.089 | 0.305 | 0.161 | −0.043 | −0.177 | 0.188 |
| PM25_1 | −0.152 | −0.136 | 0.396 | 0.365 | 0.928 | 0.248 | −0.081 | 0.358 | 0.301 | −0.002 | −0.256 | 0.176 |
| PM26_1 | −0.16 | −0.174 | 0.429 | 0.442 | 0.938 | 0.286 | −0.152 | 0.402 | 0.3 | −0.02 | −0.316 | 0.162 |
| PM27_1 | −0.174 | −0.165 | 0.537 | 0.405 | 0.945 | 0.228 | −0.134 | 0.309 | 0.351 | 0 | −0.254 | 0.201 |
| PM28_1 | −0.216 | −0.183 | 0.545 | 0.355 | 0.942 | 0.219 | −0.184 | 0.352 | 0.355 | −0.019 | −0.291 | 0.203 |
| PM29_1 | −0.131 | −0.229 | 0.877 | 0.333 | 0.464 | 0.268 | −0.133 | 0.289 | 0.367 | −0.09 | −0.275 | 0.187 |
| PM2_1 | −0.184 | −0.22 | 0.417 | 0.424 | 0.311 | 0.295 | −0.137 | 0.494 | 0.942 | −0.015 | −0.222 | 0.448 |
| PM30_1 | −0.248 | −0.214 | 0.95 | 0.328 | 0.465 | 0.267 | −0.112 | 0.273 | 0.408 | −0.102 | −0.278 | 0.23 |
| PM31_1 | −0.155 | −0.224 | 0.934 | 0.376 | 0.497 | 0.254 | −0.096 | 0.315 | 0.464 | −0.065 | −0.245 | 0.23 |
| PM32_1 | −0.202 | −0.208 | 0.906 | 0.439 | 0.445 | 0.327 | −0.082 | 0.379 | 0.499 | −0.047 | −0.27 | 0.288 |
| PM35_1 | 0.273 | 0.375 | −0.103 | −0.133 | −0.137 | −0.018 | 0.988 | −0.077 | −0.124 | −0.092 | 0.715 | −0.146 |
| PM36_1 | 0.259 | 0.387 | −0.123 | −0.169 | −0.161 | −0.027 | 0.989 | −0.086 | −0.122 | −0.07 | 0.747 | −0.182 |
| PM3_1 | −0.215 | −0.186 | 0.52 | 0.448 | 0.319 | 0.343 | −0.1 | 0.582 | 0.887 | 0.009 | −0.232 | 0.469 |
| PM4_1 | −0.038 | −0.109 | 0.261 | 0.357 | 0.216 | 0.421 | 0.051 | 0.742 | 0.485 | 0.041 | −0.187 | 0.191 |
| PM5_1 | −0.031 | −0.213 | 0.339 | 0.412 | 0.322 | 0.535 | −0.08 | 0.837 | 0.523 | 0.04 | −0.241 | 0.216 |
| PM6_1 | −0.013 | −0.182 | 0.376 | 0.477 | 0.253 | 0.544 | 0.03 | 0.813 | 0.485 | 0.007 | −0.202 | 0.232 |
| PM7_1 | −0.036 | −0.116 | 0.146 | 0.499 | 0.261 | 0.461 | −0.016 | 0.782 | 0.398 | 0.103 | −0.228 | 0.272 |
| PM8_1 | −0.046 | −0.161 | 0.221 | 0.485 | 0.25 | 0.445 | −0.154 | 0.802 | 0.363 | 0.086 | −0.319 | 0.332 |
| PM9_1 | −0.114 | −0.145 | 0.281 | 0.558 | 0.47 | 0.366 | −0.159 | 0.683 | 0.296 | 0.065 | −0.277 | 0.195 |
| ST10_1 | −0.042 | −0.1 | 0.237 | 0.552 | 0.152 | 0.297 | −0.134 | 0.391 | 0.415 | 0.114 | −0.265 | 0.798 |
| ST11_1 | −0.183 | −0.132 | 0.272 | 0.456 | 0.168 | 0.318 | −0.273 | 0.233 | 0.432 | 0.164 | −0.303 | 0.796 |
| ST1_1 | −0.126 | −0.049 | 0.122 | 0.294 | 0.148 | 0.241 | 0 | 0.302 | 0.322 | −0.03 | −0.119 | 0.66 |
| ST2_1 | −0.147 | −0.03 | 0.143 | 0.202 | 0.167 | 0.208 | −0.023 | 0.299 | 0.351 | −0.01 | −0.118 | 0.628 |
| ST3_1 | −0.259 | −0.146 | 0.267 | 0.252 | 0.259 | 0.223 | −0.123 | 0.23 | 0.47 | 0.021 | −0.222 | 0.745 |
| ST4_1 | −0.094 | −0.08 | 0.198 | 0.29 | 0.111 | 0.274 | −0.051 | 0.136 | 0.387 | 0.09 | −0.132 | 0.773 |
| ST5_1 | −0.157 | −0.074 | 0.212 | 0.309 | 0.138 | 0.207 | 0.033 | 0.094 | 0.39 | 0.033 | −0.082 | 0.786 |
| ST6_1 | −0.16 | −0.163 | 0.247 | 0.255 | 0.147 | 0.285 | −0.09 | 0.154 | 0.377 | 0.011 | −0.203 | 0.791 |
| ST7_1 | −0.11 | −0.07 | 0.073 | 0.387 | 0.108 | 0.338 | −0.197 | 0.211 | 0.293 | 0.119 | −0.27 | 0.779 |
| ST8_1 | −0.153 | −0.036 | 0.136 | 0.398 | 0.161 | 0.335 | −0.206 | 0.287 | 0.367 | 0.074 | −0.265 | 0.836 |
| ST9_1 | −0.101 | −0.141 | 0.208 | 0.481 | 0.16 | 0.248 | −0.208 | 0.251 | 0.435 | 0.104 | −0.266 | 0.778 |
| firmage | 1 | 0.107 | −0.204 | −0.067 | −0.166 | −0.007 | 0.269 | −0.06 | −0.21 | 0.239 | 0.308 | −0.18 |
| large_size | 0.239 | −0.001 | −0.083 | 0.205 | −0.008 | 0.138 | −0.081 | 0.077 | 0.025 | 1 | 0.012 | 0.091 |
| manufacturing | 0.107 | 1 | −0.238 | −0.128 | −0.189 | −0.21 | 0.385 | −0.2 | −0.199 | −0.001 | 0.414 | −0.125 |
| state_owned | 0.308 | 0.414 | −0.291 | −0.351 | −0.288 | −0.309 | 0.74 | −0.319 | −0.246 | 0.012 | 1 | −0.279 |
b Cross-loadings of the measurement model of the relationship between non-SOEs and PMSs.
| Firmage | Industry | Non-State Owned | PM_ Community | PM_ Customer | PM_ Ethical | PM_ Financial | PM_ Govern | PM_Intern_ Business_Proc | PM_Innov &Learning | Size | Strategy | |
|---|---|---|---|---|---|---|---|---|---|---|---|---|
| PM10_1 | −0.014 | −0.076 | 0.154 | 0.208 | 0.683 | 0.206 | 0.414 | −0.036 | 0.406 | 0.406 | 0.129 | 0.313 |
| PM11_1 | 0.056 | −0.126 | 0.108 | 0.149 | 0.612 | 0.47 | 0.283 | −0.128 | 0.273 | 0.107 | 0.206 | 0.174 |
| PM12_1 | −0.077 | −0.238 | 0.218 | 0.412 | 0.778 | 0.361 | 0.53 | −0.173 | 0.436 | 0.412 | 0.149 | 0.482 |
| PM13_1 | −0.069 | −0.146 | 0.106 | 0.189 | 0.676 | 0.479 | 0.408 | −0.109 | 0.406 | 0.266 | 0.161 | 0.245 |
| PM14_1 | −0.047 | −0.071 | 0.23 | 0.334 | 0.775 | 0.269 | 0.492 | −0.063 | 0.507 | 0.273 | 0.175 | 0.324 |
| PM15_1 | −0.149 | −0.037 | 0.092 | 0.376 | 0.757 | 0.344 | 0.343 | −0.038 | 0.468 | 0.423 | 0.08 | 0.383 |
| PM16_1 | 0.006 | −0.028 | 0.214 | 0.297 | 0.866 | 0.223 | 0.384 | −0.158 | 0.46 | 0.408 | 0.258 | 0.404 |
| PM17_1 | −0.073 | −0.031 | 0.173 | 0.342 | 0.807 | 0.292 | 0.404 | −0.176 | 0.598 | 0.442 | 0.098 | 0.418 |
| PM18_1 | −0.001 | −0.099 | 0.272 | 0.173 | 0.353 | 0.152 | 0.811 | −0.044 | 0.375 | 0.213 | 0.137 | 0.217 |
| PM19_1 | −0.02 | −0.11 | 0.323 | 0.232 | 0.449 | 0.196 | 0.85 | −0.073 | 0.407 | 0.204 | 0.155 | 0.315 |
| PM1_1 | −0.172 | −0.136 | 0.151 | 0.353 | 0.418 | 0.247 | 0.246 | −0.103 | 0.383 | 0.896 | 0.075 | 0.468 |
| PM20_1 | 0.015 | −0.126 | 0.09 | 0.301 | 0.512 | 0.312 | 0.749 | 0.156 | 0.464 | 0.319 | 0.082 | 0.291 |
| PM21_1 | −0.008 | −0.298 | 0.177 | 0.251 | 0.41 | 0.209 | 0.679 | −0.058 | 0.583 | 0.287 | 0.047 | 0.278 |
| PM23_1 | −0.091 | −0.23 | −0.004 | 0.462 | 0.415 | 0.887 | 0.271 | −0.171 | 0.353 | 0.275 | 0.036 | 0.203 |
| PM24_1 | −0.107 | −0.141 | −0.071 | 0.41 | 0.343 | 0.856 | 0.264 | −0.089 | 0.302 | 0.16 | −0.043 | 0.188 |
| PM25_1 | −0.152 | −0.136 | 0.008 | 0.396 | 0.364 | 0.926 | 0.249 | −0.081 | 0.355 | 0.301 | −0.002 | 0.176 |
| PM26_1 | −0.16 | −0.174 | 0.035 | 0.429 | 0.442 | 0.934 | 0.286 | −0.152 | 0.398 | 0.3 | −0.02 | 0.162 |
| PM27_1 | −0.174 | −0.165 | −0.046 | 0.536 | 0.406 | 0.945 | 0.228 | −0.134 | 0.305 | 0.351 | 0 | 0.201 |
| PM28_1 | −0.216 | −0.183 | −0.062 | 0.545 | 0.355 | 0.943 | 0.219 | −0.184 | 0.349 | 0.354 | −0.019 | 0.203 |
| PM29_1 | −0.131 | −0.229 | 0.002 | 0.873 | 0.332 | 0.466 | 0.267 | −0.133 | 0.288 | 0.366 | −0.09 | 0.187 |
| PM2_1 | −0.184 | −0.22 | 0.108 | 0.417 | 0.423 | 0.31 | 0.292 | −0.137 | 0.494 | 0.942 | −0.015 | 0.448 |
| PM30_1 | −0.248 | −0.214 | −0.042 | 0.95 | 0.326 | 0.467 | 0.266 | −0.112 | 0.271 | 0.407 | −0.102 | 0.23 |
| PM31_1 | −0.155 | −0.224 | −0.022 | 0.935 | 0.375 | 0.5 | 0.254 | −0.096 | 0.314 | 0.463 | −0.065 | 0.23 |
| PM32_1 | −0.202 | −0.208 | −0.004 | 0.908 | 0.437 | 0.447 | 0.328 | −0.082 | 0.379 | 0.498 | −0.047 | 0.288 |
| PM35_1 | 0.273 | 0.375 | −0.35 | −0.103 | −0.133 | −0.137 | −0.017 | 0.988 | −0.074 | −0.124 | −0.092 | −0.146 |
| PM36_1 | 0.259 | 0.387 | −0.377 | −0.122 | −0.168 | −0.161 | −0.025 | 0.989 | −0.084 | −0.122 | −0.07 | −0.182 |
| PM3_1 | −0.215 | −0.186 | 0.063 | 0.521 | 0.446 | 0.319 | 0.342 | −0.1 | 0.582 | 0.884 | 0.009 | 0.469 |
| PM4_1 | −0.038 | −0.109 | 0.088 | 0.262 | 0.356 | 0.215 | 0.419 | 0.051 | 0.739 | 0.485 | 0.041 | 0.191 |
| PM5_1 | −0.031 | −0.213 | 0.111 | 0.339 | 0.41 | 0.321 | 0.532 | −0.08 | 0.835 | 0.521 | 0.04 | 0.215 |
| PM6_1 | −0.013 | −0.182 | 0.136 | 0.376 | 0.475 | 0.252 | 0.541 | 0.03 | 0.816 | 0.484 | 0.007 | 0.232 |
| PM7_1 | −0.036 | −0.116 | 0.152 | 0.147 | 0.496 | 0.259 | 0.458 | −0.016 | 0.789 | 0.397 | 0.103 | 0.272 |
| PM8_1 | −0.046 | −0.161 | 0.192 | 0.221 | 0.483 | 0.248 | 0.44 | −0.154 | 0.805 | 0.362 | 0.086 | 0.332 |
| PM9_1 | −0.114 | −0.145 | 0.146 | 0.281 | 0.557 | 0.468 | 0.364 | −0.159 | 0.672 | 0.295 | 0.065 | 0.195 |
| ST10_1 | −0.042 | −0.1 | 0.155 | 0.237 | 0.55 | 0.151 | 0.295 | −0.134 | 0.391 | 0.414 | 0.114 | 0.798 |
| ST11_1 | −0.183 | −0.132 | 0.121 | 0.272 | 0.455 | 0.168 | 0.319 | −0.273 | 0.235 | 0.432 | 0.164 | 0.796 |
| ST1_1 | −0.126 | −0.049 | 0.103 | 0.124 | 0.293 | 0.149 | 0.24 | 0 | 0.304 | 0.323 | −0.03 | 0.66 |
| ST2_1 | −0.147 | −0.03 | 0.108 | 0.144 | 0.201 | 0.167 | 0.206 | −0.023 | 0.3 | 0.351 | −0.01 | 0.628 |
| ST3_1 | −0.259 | −0.146 | 0.018 | 0.268 | 0.25 | 0.261 | 0.223 | −0.123 | 0.23 | 0.47 | 0.021 | 0.745 |
| ST4_1 | −0.094 | −0.08 | 0.031 | 0.198 | 0.289 | 0.114 | 0.276 | −0.051 | 0.136 | 0.388 | 0.09 | 0.773 |
| ST5_1 | −0.157 | −0.074 | 0.001 | 0.212 | 0.308 | 0.14 | 0.209 | 0.033 | 0.096 | 0.39 | 0.033 | 0.786 |
| ST6_1 | −0.16 | −0.163 | 0.056 | 0.248 | 0.253 | 0.15 | 0.285 | −0.09 | 0.155 | 0.376 | 0.011 | 0.792 |
| ST7_1 | −0.11 | −0.07 | 0.209 | 0.074 | 0.386 | 0.107 | 0.339 | −0.197 | 0.21 | 0.294 | 0.119 | 0.779 |
| ST8_1 | −0.153 | −0.036 | 0.166 | 0.137 | 0.396 | 0.161 | 0.334 | −0.206 | 0.288 | 0.367 | 0.074 | 0.836 |
| ST9_1 | −0.101 | −0.141 | 0.164 | 0.209 | 0.481 | 0.16 | 0.247 | −0.208 | 0.251 | 0.436 | 0.104 | 0.778 |
| Non-state-owned | 0.037 | −0.123 | 1 | −0.019 | 0.225 | −0.027 | 0.291 | −0.368 | 0.183 | 0.118 | −0.001 | 0.141 |
| firmage | 1 | 0.107 | 0.037 | −0.205 | −0.066 | −0.166 | −0.007 | 0.269 | −0.059 | −0.21 | 0.239 | −0.18 |
| large_size | 0.239 | −0.001 | −0.001 | −0.082 | 0.208 | −0.008 | 0.139 | −0.081 | 0.077 | 0.025 | 1 | 0.091 |
| manufacturing | 0.107 | 1 | −0.123 | −0.238 | −0.128 | −0.189 | −0.206 | 0.386 | −0.2 | −0.199 | −0.001 | −0.125 |
c Cross-loadings of the measurement model of the relationship between SOEs and compensation systems.
| CO_ Customer | CO_ Financial | CO_Intern_ Business_Proc | CO_ Community | CO_ Ethical | CO_ Govern | CO_Innov &Learning | Firmage | Industry | Size | State-owned | Strategy | |
|---|---|---|---|---|---|---|---|---|---|---|---|---|
| CO10_1 | 0.727 | 0.597 | 0.513 | 0.303 | 0.281 | −0.076 | 0.495 | −0.103 | −0.127 | 0.044 | −0.283 | 0.359 |
| CO11_1 | 0.667 | 0.316 | 0.447 | 0.158 | 0.549 | −0.158 | 0.236 | 0.007 | −0.098 | 0.137 | −0.201 | 0.266 |
| CO12_1 | 0.8 | 0.535 | 0.538 | 0.416 | 0.366 | −0.192 | 0.406 | −0.041 | −0.233 | 0.092 | −0.395 | 0.399 |
| CO13_1 | 0.721 | 0.393 | 0.54 | 0.174 | 0.507 | −0.151 | 0.313 | −0.072 | −0.19 | 0.127 | −0.244 | 0.241 |
| CO14_1 | 0.785 | 0.598 | 0.555 | 0.315 | 0.228 | −0.109 | 0.246 | −0.068 | −0.088 | 0.114 | −0.301 | 0.295 |
| CO15_1 | 0.742 | 0.402 | 0.545 | 0.365 | 0.358 | −0.026 | 0.407 | −0.139 | −0.051 | 0.002 | −0.21 | 0.368 |
| CO16_1 | 0.874 | 0.485 | 0.6 | 0.314 | 0.261 | −0.225 | 0.48 | −0.065 | −0.083 | 0.124 | −0.351 | 0.41 |
| CO17_1 | 0.823 | 0.479 | 0.623 | 0.273 | 0.31 | −0.13 | 0.425 | −0.065 | −0.033 | 0.049 | −0.295 | 0.397 |
| CO18_1 | 0.452 | 0.839 | 0.449 | 0.161 | 0.132 | −0.016 | 0.238 | −0.04 | −0.009 | 0.141 | −0.314 | 0.194 |
| CO19_1 | 0.458 | 0.844 | 0.425 | 0.14 | 0.179 | −0.043 | 0.182 | −0.064 | −0.043 | 0.061 | −0.321 | 0.248 |
| CO1_1 | 0.453 | 0.322 | 0.444 | 0.396 | 0.281 | −0.186 | 0.93 | −0.18 | −0.142 | 0.07 | −0.289 | 0.468 |
| CO20_1 | 0.586 | 0.813 | 0.581 | 0.334 | 0.339 | 0.069 | 0.369 | 0.023 | −0.1 | 0.051 | −0.223 | 0.286 |
| CO21_1 | 0.519 | 0.732 | 0.645 | 0.286 | 0.237 | −0.125 | 0.339 | −0.054 | −0.225 | 0.033 | −0.3 | 0.263 |
| CO23_1 | 0.448 | 0.33 | 0.436 | 0.482 | 0.903 | −0.155 | 0.328 | −0.082 | −0.231 | −0.003 | −0.304 | 0.265 |
| CO24_1 | 0.405 | 0.259 | 0.375 | 0.415 | 0.856 | −0.11 | 0.196 | −0.104 | −0.169 | −0.09 | −0.246 | 0.235 |
| CO25_1 | 0.391 | 0.253 | 0.403 | 0.403 | 0.92 | −0.076 | 0.31 | −0.11 | −0.177 | 0.027 | −0.289 | 0.24 |
| CO26_1 | 0.463 | 0.288 | 0.431 | 0.469 | 0.943 | −0.157 | 0.332 | −0.129 | −0.213 | 0.018 | −0.35 | 0.219 |
| CO27_1 | 0.394 | 0.185 | 0.364 | 0.581 | 0.935 | −0.115 | 0.327 | −0.11 | −0.186 | 0.048 | −0.258 | 0.235 |
| CO28_1 | 0.362 | 0.189 | 0.394 | 0.577 | 0.948 | −0.16 | 0.34 | −0.139 | −0.212 | 0.047 | −0.292 | 0.243 |
| CO29_1 | 0.313 | 0.282 | 0.358 | 0.891 | 0.477 | −0.123 | 0.393 | −0.108 | −0.263 | −0.076 | −0.271 | 0.247 |
| CO2_1 | 0.47 | 0.334 | 0.546 | 0.456 | 0.33 | −0.193 | 0.953 | −0.192 | −0.232 | 0.025 | −0.269 | 0.429 |
| CO30_1 | 0.33 | 0.25 | 0.316 | 0.952 | 0.493 | −0.071 | 0.437 | −0.17 | −0.26 | −0.064 | −0.245 | 0.27 |
| CO31_1 | 0.377 | 0.289 | 0.375 | 0.948 | 0.505 | −0.047 | 0.486 | −0.142 | −0.235 | −0.023 | −0.223 | 0.289 |
| CO32_1 | 0.416 | 0.246 | 0.386 | 0.932 | 0.504 | −0.044 | 0.498 | −0.149 | −0.238 | −0.014 | −0.243 | 0.337 |
| CO35_1 | −0.167 | −0.038 | −0.095 | −0.063 | −0.138 | 0.992 | −0.18 | 0.254 | 0.356 | −0.135 | 0.669 | −0.136 |
| CO36_1 | −0.185 | −0.044 | −0.105 | −0.087 | −0.143 | 0.993 | −0.194 | 0.273 | 0.357 | −0.119 | 0.719 | −0.174 |
| CO3_1 | 0.468 | 0.322 | 0.595 | 0.514 | 0.327 | −0.146 | 0.909 | −0.204 | −0.181 | 0.013 | −0.255 | 0.427 |
| CO4_1 | 0.466 | 0.53 | 0.769 | 0.299 | 0.33 | −0.01 | 0.548 | −0.06 | −0.12 | 0.008 | −0.246 | 0.179 |
| CO5_1 | 0.538 | 0.561 | 0.871 | 0.375 | 0.377 | −0.051 | 0.499 | −0.008 | −0.215 | 0.041 | −0.278 | 0.197 |
| CO6_1 | 0.581 | 0.608 | 0.874 | 0.425 | 0.356 | −0.047 | 0.509 | −0.046 | −0.235 | 0.031 | −0.301 | 0.256 |
| CO7_1 | 0.638 | 0.566 | 0.848 | 0.291 | 0.397 | −0.092 | 0.447 | −0.083 | −0.204 | 0.048 | −0.326 | 0.3 |
| CO8_1 | 0.642 | 0.546 | 0.839 | 0.268 | 0.276 | −0.167 | 0.435 | −0.057 | −0.152 | 0.062 | −0.339 | 0.323 |
| CO9_1 | 0.605 | 0.39 | 0.707 | 0.237 | 0.462 | −0.107 | 0.382 | −0.026 | −0.109 | 0.096 | −0.21 | 0.201 |
| ST10_1 | 0.568 | 0.312 | 0.4 | 0.289 | 0.218 | −0.126 | 0.407 | −0.042 | −0.1 | 0.114 | −0.265 | 0.806 |
| ST11_1 | 0.405 | 0.263 | 0.261 | 0.353 | 0.221 | −0.265 | 0.421 | −0.183 | −0.132 | 0.164 | −0.303 | 0.799 |
| ST1_1 | 0.267 | 0.096 | 0.245 | 0.158 | 0.188 | −0.03 | 0.262 | −0.126 | −0.049 | −0.03 | −0.119 | 0.644 |
| ST2_1 | 0.15 | 0.052 | 0.218 | 0.193 | 0.195 | −0.034 | 0.262 | −0.147 | −0.03 | −0.01 | −0.118 | 0.611 |
| ST3_1 | 0.233 | 0.192 | 0.209 | 0.3 | 0.282 | −0.092 | 0.428 | −0.259 | −0.146 | 0.021 | −0.222 | 0.744 |
| ST4_1 | 0.256 | 0.198 | 0.144 | 0.207 | 0.142 | −0.045 | 0.353 | −0.094 | −0.08 | 0.09 | −0.132 | 0.773 |
| ST5_1 | 0.237 | 0.183 | 0.145 | 0.275 | 0.188 | 0.051 | 0.371 | −0.157 | −0.074 | 0.033 | −0.082 | 0.788 |
| ST6_1 | 0.263 | 0.274 | 0.189 | 0.265 | 0.196 | −0.072 | 0.357 | −0.16 | −0.163 | 0.011 | −0.203 | 0.795 |
| ST7_1 | 0.334 | 0.29 | 0.159 | 0.038 | 0.117 | −0.163 | 0.288 | −0.11 | −0.07 | 0.119 | −0.27 | 0.779 |
| ST8_1 | 0.399 | 0.34 | 0.246 | 0.154 | 0.198 | −0.202 | 0.345 | −0.153 | −0.036 | 0.074 | −0.265 | 0.837 |
| ST9_1 | 0.458 | 0.258 | 0.242 | 0.26 | 0.215 | −0.203 | 0.408 | −0.101 | −0.141 | 0.104 | −0.266 | 0.782 |
| firmage | −0.089 | −0.044 | −0.059 | −0.153 | −0.123 | 0.266 | −0.206 | 1 | 0.107 | 0.239 | 0.308 | −0.178 |
| large_size | 0.111 | 0.087 | 0.057 | −0.047 | 0.01 | −0.128 | 0.039 | 0.239 | −0.001 | 1 | 0.012 | 0.093 |
| manufacturing | −0.15 | −0.123 | −0.215 | −0.268 | −0.217 | 0.359 | −0.198 | 0.107 | 1 | −0.001 | 0.414 | −0.127 |
| state_owned | −0.38 | −0.362 | −0.352 | −0.264 | −0.318 | 0.7 | −0.291 | 0.308 | 0.414 | 0.012 | 1 | −0.282 |
d Cross-loadings of the measurement model of H4.
| CO_ Customer | CO_ Financial | CO_Intern_ Business_Proc | CO_ Cmmunity | CO_ Ethical | CO_ Govern | CO_Innov &Learning | Non-State-Owned | Firmage | Industry | Size | Strategy | |
|---|---|---|---|---|---|---|---|---|---|---|---|---|
| CO10_1 | 0.727 | 0.595 | 0.511 | 0.302 | 0.28 | −0.076 | 0.496 | 0.175 | −0.103 | −0.127 | 0.044 | 0.359 |
| CO11_1 | 0.663 | 0.314 | 0.448 | 0.158 | 0.549 | −0.158 | 0.235 | 0.08 | 0.007 | −0.098 | 0.137 | 0.266 |
| CO12_1 | 0.798 | 0.53 | 0.539 | 0.415 | 0.366 | −0.192 | 0.406 | 0.247 | −0.041 | −0.233 | 0.092 | 0.399 |
| CO13_1 | 0.719 | 0.385 | 0.543 | 0.176 | 0.506 | −0.151 | 0.312 | 0.142 | −0.072 | −0.19 | 0.127 | 0.241 |
| CO14_1 | 0.787 | 0.596 | 0.56 | 0.315 | 0.227 | −0.109 | 0.246 | 0.239 | −0.068 | −0.088 | 0.114 | 0.295 |
| CO15_1 | 0.744 | 0.397 | 0.549 | 0.366 | 0.358 | −0.026 | 0.407 | 0.103 | −0.139 | −0.051 | 0.002 | 0.368 |
| CO16_1 | 0.874 | 0.478 | 0.602 | 0.315 | 0.26 | −0.225 | 0.48 | 0.223 | −0.065 | −0.083 | 0.124 | 0.41 |
| CO17_1 | 0.824 | 0.476 | 0.626 | 0.274 | 0.309 | −0.13 | 0.425 | 0.192 | −0.065 | −0.033 | 0.049 | 0.397 |
| CO18_1 | 0.453 | 0.856 | 0.45 | 0.161 | 0.132 | −0.016 | 0.238 | 0.353 | −0.04 | −0.009 | 0.141 | 0.194 |
| CO19_1 | 0.458 | 0.855 | 0.427 | 0.14 | 0.178 | −0.043 | 0.182 | 0.316 | −0.064 | −0.043 | 0.061 | 0.248 |
| CO1_1 | 0.454 | 0.322 | 0.442 | 0.397 | 0.281 | −0.186 | 0.931 | 0.199 | −0.18 | −0.142 | 0.07 | 0.468 |
| CO20_1 | 0.587 | 0.808 | 0.58 | 0.333 | 0.339 | 0.069 | 0.369 | 0.195 | 0.023 | −0.1 | 0.051 | 0.285 |
| CO21_1 | 0.52 | 0.709 | 0.645 | 0.285 | 0.237 | −0.125 | 0.339 | 0.23 | −0.054 | −0.225 | 0.033 | 0.263 |
| CO23_1 | 0.447 | 0.324 | 0.433 | 0.482 | 0.904 | −0.155 | 0.328 | 0.037 | −0.082 | −0.231 | −0.003 | 0.265 |
| CO24_1 | 0.403 | 0.258 | 0.373 | 0.415 | 0.858 | −0.11 | 0.196 | −0.028 | −0.104 | −0.169 | −0.09 | 0.235 |
| CO25_1 | 0.389 | 0.249 | 0.401 | 0.403 | 0.919 | −0.076 | 0.31 | 0.042 | −0.11 | −0.177 | 0.027 | 0.24 |
| CO26_1 | 0.461 | 0.282 | 0.429 | 0.469 | 0.94 | −0.157 | 0.332 | 0.08 | −0.129 | −0.213 | 0.018 | 0.219 |
| CO27_1 | 0.392 | 0.18 | 0.361 | 0.581 | 0.935 | −0.115 | 0.326 | −0.03 | −0.11 | −0.186 | 0.048 | 0.235 |
| CO28_1 | 0.361 | 0.182 | 0.392 | 0.577 | 0.948 | −0.16 | 0.34 | −0.029 | −0.139 | −0.212 | 0.047 | 0.243 |
| CO29_1 | 0.313 | 0.273 | 0.355 | 0.887 | 0.478 | −0.123 | 0.393 | 0.002 | −0.108 | −0.263 | −0.076 | 0.247 |
| CO2_1 | 0.47 | 0.325 | 0.543 | 0.456 | 0.329 | −0.193 | 0.953 | 0.129 | −0.192 | −0.232 | 0.025 | 0.429 |
| CO30_1 | 0.33 | 0.243 | 0.314 | 0.952 | 0.494 | −0.071 | 0.436 | −0.067 | −0.17 | −0.26 | −0.064 | 0.27 |
| CO31_1 | 0.378 | 0.283 | 0.375 | 0.949 | 0.506 | −0.047 | 0.486 | −0.063 | −0.142 | −0.235 | −0.023 | 0.289 |
| CO32_1 | 0.417 | 0.244 | 0.387 | 0.934 | 0.506 | −0.044 | 0.498 | −0.033 | −0.149 | −0.238 | −0.014 | 0.337 |
| CO35_1 | −0.166 | −0.035 | −0.097 | −0.062 | −0.138 | 0.992 | −0.18 | −0.347 | 0.254 | 0.356 | −0.135 | −0.136 |
| CO36_1 | −0.184 | −0.042 | −0.107 | −0.086 | −0.143 | 0.993 | −0.194 | −0.376 | 0.273 | 0.357 | −0.119 | −0.174 |
| CO3_1 | 0.468 | 0.315 | 0.599 | 0.515 | 0.327 | −0.146 | 0.908 | 0.12 | −0.204 | −0.181 | 0.013 | 0.427 |
| CO4_1 | 0.467 | 0.526 | 0.759 | 0.298 | 0.33 | −0.01 | 0.547 | 0.112 | −0.06 | −0.12 | 0.008 | 0.179 |
| CO5_1 | 0.538 | 0.551 | 0.864 | 0.373 | 0.377 | −0.051 | 0.499 | 0.093 | −0.008 | −0.215 | 0.041 | 0.197 |
| CO6_1 | 0.581 | 0.601 | 0.872 | 0.424 | 0.355 | −0.047 | 0.508 | 0.172 | −0.046 | −0.235 | 0.031 | 0.256 |
| CO7_1 | 0.639 | 0.56 | 0.854 | 0.292 | 0.396 | −0.092 | 0.447 | 0.193 | −0.083 | −0.204 | 0.048 | 0.3 |
| CO8_1 | 0.643 | 0.538 | 0.848 | 0.268 | 0.275 | −0.167 | 0.435 | 0.248 | −0.057 | −0.152 | 0.062 | 0.323 |
| CO9_1 | 0.604 | 0.377 | 0.704 | 0.237 | 0.461 | −0.107 | 0.381 | 0.082 | −0.026 | −0.109 | 0.096 | 0.201 |
| ST10_1 | 0.568 | 0.305 | 0.403 | 0.289 | 0.217 | −0.126 | 0.407 | 0.155 | −0.042 | −0.1 | 0.114 | 0.805 |
| ST11_1 | 0.405 | 0.261 | 0.264 | 0.353 | 0.221 | −0.265 | 0.422 | 0.121 | −0.183 | −0.132 | 0.164 | 0.799 |
| ST1_1 | 0.267 | 0.094 | 0.248 | 0.159 | 0.188 | −0.029 | 0.262 | 0.103 | −0.126 | −0.049 | −0.03 | 0.644 |
| ST2_1 | 0.15 | 0.05 | 0.218 | 0.195 | 0.196 | −0.034 | 0.262 | 0.108 | −0.147 | −0.03 | −0.01 | 0.611 |
| ST3_1 | 0.234 | 0.188 | 0.213 | 0.301 | 0.283 | −0.092 | 0.428 | 0.018 | −0.259 | −0.146 | 0.021 | 0.744 |
| ST4_1 | 0.256 | 0.198 | 0.144 | 0.207 | 0.143 | −0.045 | 0.353 | 0.031 | −0.094 | −0.08 | 0.09 | 0.773 |
| ST5_1 | 0.237 | 0.182 | 0.149 | 0.276 | 0.189 | 0.051 | 0.371 | 0.001 | −0.157 | −0.074 | 0.033 | 0.788 |
| ST6_1 | 0.263 | 0.271 | 0.19 | 0.265 | 0.196 | −0.072 | 0.357 | 0.056 | −0.16 | −0.163 | 0.011 | 0.795 |
| ST7_1 | 0.334 | 0.292 | 0.162 | 0.038 | 0.116 | −0.163 | 0.288 | 0.209 | −0.11 | −0.07 | 0.119 | 0.779 |
| ST8_1 | 0.4 | 0.337 | 0.249 | 0.154 | 0.198 | −0.202 | 0.345 | 0.166 | −0.153 | −0.036 | 0.074 | 0.837 |
| ST9_1 | 0.457 | 0.253 | 0.245 | 0.261 | 0.215 | −0.203 | 0.409 | 0.164 | −0.101 | −0.141 | 0.104 | 0.782 |
| Non−state owned | 0.236 | 0.342 | 0.197 | −0.044 | 0.014 | −0.364 | 0.162 | 1 | 0.037 | −0.123 | −0.001 | 0.14 |
| firmage | −0.089 | −0.044 | −0.06 | −0.154 | −0.122 | 0.266 | −0.206 | 0.037 | 1 | 0.107 | 0.239 | −0.178 |
| large_size | 0.11 | 0.089 | 0.058 | −0.046 | 0.01 | −0.128 | 0.039 | −0.001 | 0.239 | −0.001 | 1 | 0.093 |
| manufacturing | −0.149 | −0.115 | −0.216 | −0.267 | −0.217 | 0.359 | −0.198 | −0.123 | 0.107 | 1 | −0.001 | −0.127 |
Appendix D. Discriminant Validity (Fornell–Larcker Criterion) of the Measurements of the Models
a Discriminant validity (Fornell–Larcker criterion) of the measurements of the relationship between SOEs and PMSs.
| Firmage | Industry | PM_ Community | PM_ Customer | PM_ Ethical | PM_ Financial | PM_ Govern | PM_Intern_ Business_Proc | PM_Innov &Learning | Size | State-Owned | Strategy | |
|---|---|---|---|---|---|---|---|---|---|---|---|---|
| Firmage | 1 | |||||||||||
| Industry | 0.107 | 1 | ||||||||||
| PM_Community | −0.204 | −0.238 | 0.917 | |||||||||
| PM_Customer | −0.067 | −0.128 | 0.403 | 0.748 | ||||||||
| PM_Ethical | −0.166 | −0.189 | 0.509 | 0.424 | 0.916 | |||||||
| PM_Financial | −0.007 | −0.21 | 0.305 | 0.553 | 0.274 | 0.774 | ||||||
| PM_Govern | 0.269 | 0.385 | −0.115 | −0.153 | −0.151 | −0.023 | 0.988 | |||||
| PM_Intern_ business_proc | −0.06 | −0.2 | 0.343 | 0.603 | 0.381 | 0.593 | −0.083 | 0.778 | ||||
| PM_innov&learning | −0.21 | −0.199 | 0.475 | 0.475 | 0.324 | 0.326 | −0.124 | 0.538 | 0.908 | |||
| Size | 0.239 | −0.001 | −0.083 | 0.205 | −0.008 | 0.138 | −0.081 | 0.077 | 0.025 | 1 | ||
| State-owned | 0.308 | 0.414 | −0.291 | −0.351 | −0.288 | −0.309 | 0.74 | −0.319 | −0.246 | 0.012 | 1 | |
| Strategy | −0.18 | −0.125 | 0.257 | 0.479 | 0.206 | 0.358 | −0.166 | 0.316 | 0.509 | 0.091 | −0.279 | 0.763 |
b Discriminant validity (Fornell–Larcker criterion) of the measurement of the relationship between non-SOEs and PMSs.
| Firmage | Industry | Non-State Owned | PM_ Community | PM_ Customer | PM_ Ethical | PM_ Financial | PM_ Govern | PM_Intern_ Business_Proc | PM_Innov &Learning | Size | Strategy | |
|---|---|---|---|---|---|---|---|---|---|---|---|---|
| Firmage | 1 | |||||||||||
| Industry | 0.107 | 1 | ||||||||||
| Non-State-owned | 0.037 | −0.123 | 1 | |||||||||
| PM_Community | −0.205 | −0.238 | −0.019 | 0.917 | ||||||||
| PM_Customer | −0.066 | −0.128 | 0.225 | 0.402 | 0.748 | |||||||
| PM_Ethical | −0.166 | −0.189 | −0.027 | 0.511 | 0.423 | 0.916 | ||||||
| PM_Financial | −0.007 | −0.206 | 0.291 | 0.305 | 0.553 | 0.274 | 0.775 | |||||
| PM_Govern | 0.269 | 0.386 | −0.368 | −0.114 | −0.153 | −0.151 | −0.021 | 0.988 | ||||
| PM_Intern_ business_proc | −0.059 | −0.2 | 0.183 | 0.342 | 0.6 | 0.375 | 0.59 | −0.08 | 0.778 | |||
| PM_innov&learning | −0.21 | −0.199 | 0.118 | 0.475 | 0.473 | 0.322 | 0.324 | −0.124 | 0.537 | 0.908 | ||
| Size | 0.239 | −0.001 | −0.001 | −0.082 | 0.208 | −0.008 | 0.139 | −0.081 | 0.077 | 0.025 | 1 | |
| Strategy | −0.18 | −0.125 | 0.141 | 0.257 | 0.477 | 0.207 | 0.357 | −0.166 | 0.317 | 0.509 | 0.091 | 0.763 |
c Discriminant validity (Fornell–Larcker criterion) of the measurement of the relationship between SOEs and compensation systems.
| CO_ Customer | CO_ Financial | CO_Intern_ Business_Proc | CO_ Community | CO_ Ethical | CO_ Govern | CO_Innov &Learning | Firmage | Industry | Size | State-Owned | Strategy | |
|---|---|---|---|---|---|---|---|---|---|---|---|---|
| CO_Customer | 0.77 | |||||||||||
| CO_Financial | 0.625 | 0.808 | ||||||||||
| CO_Intern_ business_proc | 0.709 | 0.656 | 0.820 | |||||||||
| CO_community | 0.386 | 0.286 | 0.386 | 0.931 | ||||||||
| CO_ethical | 0.448 | 0.275 | 0.438 | 0.532 | 0.918 | |||||||
| CO_govern | −0.178 | −0.042 | −0.101 | −0.076 | −0.142 | 0.992 | ||||||
| CO_innov&learning | 0.498 | 0.35 | 0.568 | 0.488 | 0.335 | −0.189 | 0.931 | |||||
| firmage | −0.089 | −0.044 | −0.059 | −0.153 | −0.123 | 0.266 | −0.206 | 1 | ||||
| industry | −0.15 | −0.123 | −0.215 | −0.268 | −0.217 | 0.359 | −0.198 | 0.107 | 1 | |||
| size | 0.111 | 0.087 | 0.057 | −0.047 | 0.01 | −0.128 | 0.039 | 0.239 | −0.001 | 1 | ||
| State-owned | −0.38 | −0.362 | −0.352 | −0.264 | −0.318 | 0.7 | −0.291 | 0.308 | 0.414 | 0.012 | 1 | |
| strategy | 0.452 | 0.308 | 0.305 | 0.308 | 0.261 | −0.157 | 0.474 | −0.178 | −0.127 | 0.093 | −0.282 | 0.763 |
d Discriminant validity (Fornell–Llarcker criterion) of the measurement of the relationship between non_SOEs and compensation systems.
| CO_ Customer | CO_ Financial | CO_Intern_ Business_Proc | CO_ Community | CO_ Ethical | CO_ Govern | CO_Innov &Learning | Non-State Owned | Firmage | Industry | Size | Strategy | |
|---|---|---|---|---|---|---|---|---|---|---|---|---|
| CO_Customer | 0.77 | |||||||||||
| CO_Financial | 0.621 | 0.809 | ||||||||||
| CO_Intern_ business_proc | 0.712 | 0.647 | 0.819 | |||||||||
| CO_community | 0.388 | 0.279 | 0.384 | 0.931 | ||||||||
| CO_ethical | 0.445 | 0.269 | 0.435 | 0.533 | 0.918 | |||||||
| CO_govern | −0.177 | −0.039 | −0.103 | −0.075 | −0.142 | 0.992 | ||||||
| CO_innov&learning | 0.498 | 0.345 | 0.565 | 0.489 | 0.335 | −0.189 | 0.931 | |||||
| Non-state owned | 0.236 | 0.342 | 0.197 | −0.044 | 0.014 | −0.364 | 0.162 | 1 | ||||
| firmage | −0.089 | −0.044 | −0.06 | −0.154 | −0.122 | 0.266 | −0.206 | 0.037 | 1 | |||
| industry | −0.149 | −0.115 | −0.216 | −0.267 | −0.217 | 0.359 | −0.198 | −0.123 | 0.107 | 1 | ||
| size | 0.11 | 0.089 | 0.058 | −0.046 | 0.01 | −0.128 | 0.039 | −0.001 | 0.239 | −0.001 | 1 | |
| strategy | 0.452 | 0.305 | 0.308 | 0.308 | 0.261 | −0.157 | 0.474 | 0.14 | −0.178 | −0.127 | 0.093 | 0.763 |
Figure A1.
The relationship between state-owned enterprises (SOEs) and performance measurement systems (Hypothesis 1).
Figure A1.
The relationship between state-owned enterprises (SOEs) and performance measurement systems (Hypothesis 1).

Figure A2.
The relationship between non-SOEs and performance measurement systems (Hypothesis 2).

Figure A3.
The relationship between SOEs and compensation systems (Hypothesis 3).

Figure A4.
The relationship between SOEs and compensation systems (Hypothesis 4).

References
- Otley, D.T. The contingency theory of management accounting achievement and prognosis. Account. Organ. Soc. 1980, 5, 413–428. [Google Scholar] [CrossRef]
- Chenhall, R.H. Theorizing contingencies in management control systems research. In Handbook of Management Accounting; Chapman, C.S., Hopwood, A.G., Shields, M.D., Eds.; Elsevier: Amsterdam, The Netherlands, 2007; Volume 1, pp. 163–205. [Google Scholar]
- Merchant, K.; Van der Stede, W.A. Management Control. Systems: Performance Measurement, Evaluation and Incentives; Prentice Hall, Pearson Education Limited: England, UK, 2007. [Google Scholar]
- Malmi, T.; Brown, D.A. Management control system as a package—Opportunities, challenges and research directions. Manag. Account. Res. 2008, 19, 287–300. [Google Scholar] [CrossRef]
- Abernethy, M.A.; Bouwens, J.; Van Lent, L. Leadership and control system design. Manag. Account. Res. 2010, 21, 2–16. [Google Scholar] [CrossRef]
- Jansen, E.P. The Effec of Leadership Style on the Information receivers’ reaction to management accounting change. Manag. Account. Res. 2011, 22, 105–124. [Google Scholar] [CrossRef]
- Nguyen, T.T.; Mia, L.; Winata, L.; Chong, V.K. Effect of transformational-Leadership style and management control system on managerial performance. J. Bus. Res. 2017, 70, 202–213. [Google Scholar] [CrossRef]
- O’Connor, N.G.; Deng, J.; Luo, Y. Political constraints, organization design and performance measurement in China’s State-owned enterprises. Account. Organ. Soc. 2006, 31, 157–177. [Google Scholar] [CrossRef]
- Warfield, T.D.; Wild, J.J.; Wild, K.L. Managerial ownership, accounting choices, and informativeness of earnings. J. Account. Econ. 1995, 20, 61–91. [Google Scholar] [CrossRef]
- Firth, M. The diffusion of managerial accounting procedures in the People’s Republic of China and the influence of foreign partnered joint ventures. Account. Organ. Soc. 1996, 21, 629–654. [Google Scholar] [CrossRef]
- Yan, A.; Gray, B. Antecedents and effects of parent control in international joint ventures. J. Manag. Stud. 2001, 38, 393–416. [Google Scholar] [CrossRef]
- Van der Stede, W.A. The effect of national culture on management control. and incentive system design in multi-business firms: Evidence of intracorporate isomorphism. Eur. Account. Rev. 2003, 12, 263–285. [Google Scholar] [CrossRef]
- Wong, M.C.; Luk, S.T.; Li, S.C. Equity Onwership and Management Control. in Sino-Foreign Joint Venture Hotels. Serv. Ind. J. 2005, 25, 117–133. [Google Scholar] [CrossRef]
- Li, P.; Tang, G. Performance measurement design within its organizational context—Evidence from China. Manag. Account. Res. 2009, 20, 193–207. [Google Scholar] [CrossRef]
- Carker, M.; Siverbo, S. Management control. in public sector joint ventures. Manag. Account. Res. 2011, 22, 330–348. [Google Scholar] [CrossRef]
- Sharma, P. An overview of the field of family business studies: Current status and direction for the future. Fam. Bus. Rev. 2004, 17, 1–36. [Google Scholar] [CrossRef]
- Chu, W. Family ownership and firm performance: Influence of family management, family control, and firm size. Asia Pac. J. Manag. 2011, 28, 833–851. [Google Scholar] [CrossRef]
- Speckbacher, G.; Wentges, P. The impact of family control. on the use of performance measures in strategic target. setting and incentive compensation: A research note. Manag. Account. Res. 2012, 23, 34–46. [Google Scholar] [CrossRef]
- Liang, X.; Wang, L.; Cui, Z. Chinese private firms and internationalization: effects of family involvement in management and family ownership. Fam. Bus. Rev. 2014, 27, 126–141. [Google Scholar] [CrossRef]
- Helsen, Z.; Lybaert, N.; Steijvers, T. Management control. systems in family firms: A review of the literature and directions for the future. J. Econ. Surv. 2017, 31, 410–435. [Google Scholar] [CrossRef]
- Jensen, M.C.; Meckling, W.H. Theory of the firm: managerial behavior, agency costs and ownership structure. J. Financ. Econ. 1976, 3, 305–360. [Google Scholar] [CrossRef]
- Eisenhardt, K.M. Agency theory: An. assessment and review. Acad. Manag. 1989, 14, 57–74. [Google Scholar]
- Baiman, S. Agency research in managerial accounting: A second look. Account. Organ. Soc. 1990, 15, 341–371. [Google Scholar] [CrossRef]
- Bouckva, M. Management accounting and agency theory. Procedia Econ. Financ. 2015, 25, 5–13. [Google Scholar] [CrossRef]
- Lambert, R.A. Agency theory and management accounting. In Handbook of Management Accounting; Chapman, C.S., Hopwood, A.G., Shields, M.D., Eds.; Elsevier: Amsterdam, The Netherlands, 2007; pp. 247–268. [Google Scholar]
- Ronen, J.; Balachandran, K.R. Agency theory: An. approach to incentive problems in management accounting. Asian Rev. Account. 1995, 3, 127–151. [Google Scholar] [CrossRef]
- Brickley, J.A.; Smith, C.W.; Zimmweman, J.L. Management fads and organizational architecture. J. Appl. Corp. Financ. 1997, 10, 23–39. [Google Scholar] [CrossRef]
- Guo, S. Economic transition in china and vietnam: A comparative perspective. Asian Profile 2004, 32, 393–411. [Google Scholar]
- An, D.V.; Duc, L.M. Economic Reforms in China and Vietnam: A Brief. Comparison; Central Institute for Economic Management: Ha Noi, Vietnam, 2007. [Google Scholar]
- Vu, K.M. Economic reform and performance: A comparative study of china and vietnam. China Int. J. 2009, 7, 189–226. [Google Scholar] [CrossRef]
- Flamholtz, E.; Das, T.; Tsui, A. Toward an integrative framework of organizational control. Account. Organ. Soc. 1985, 10, 35–50. [Google Scholar] [CrossRef]
- Anthony, R.; Govindarajan, V. Managemnent Control. Systems, 12th ed.; McGraw Hill: New York, NY, USA, 2007. [Google Scholar]
- Abernethy, M.A.; Chua, W. Field Study of control system "redesign": the impact of institutional process. on strategic choice. Contemp. Account. Res. 1996, 13, 569–606. [Google Scholar] [CrossRef]
- Neely, A.; Grefory, M.; Platts, K. Performance measurement system design: A literature review and research agenda. Int. J. Oper. Prod. Manag. 2005, 25, 1228–1263. [Google Scholar] [CrossRef]
- Kaplan, R.S.; Norton, D.P. The balanced scorecard: Measure that drive performance. Harv. Bus. Rev. 1992, 70, 172–180. [Google Scholar]
- Atkinson, A.A.; Waterhouse, J.H.; Wells, R.B. A Stakeholder Approach to Strategic Performance Measurement. Sloan Manag. Rev. 1997, 38, 25–37. [Google Scholar]
- Bititci, U.S.; Carrie, A.S.; Mcdevitt, L. Integrated performance measurement systems: A development guide. Int. J. Oper. Prod. Manag. 1997, 17, 522–534. [Google Scholar] [CrossRef]
- Atkinson, A.A. Strategic performance measurement and incentive compensation. Eur. Manag. J. 1998, 16, 552–561. [Google Scholar] [CrossRef]
- Gates, S. Aligning Strategic Performance Measures and Results; The Conference Board: New York, NY, USA, 1999. [Google Scholar]
- Ittner, C.D.; Larcker, D.F.; Randall, T. Performance implications of strategic performance measurement in financial services firms. Account. Organ. Soc. 2003, 28, 715–741. [Google Scholar] [CrossRef] [Green Version]
- Maisel, L.S. Performance Measurement Practices Survey Results; American Institute of Certified Public Accountants: Ewing, NJ, USA, 2001. [Google Scholar]
- Johnson, C.C.; Beiman, I. Balanced Scorecard: for State-Owned Enterprises: Driving Performance and Corporate Governance; Asian Development Bank: Mandaluyong, The Philippines, 2007. [Google Scholar]
- Poister, T.H. Measuring Performance in Public and Nonprofit Organizations; Jossey Bass: San Francisco, CA, USA; John Wiley & Sons, Inc.: Hoboken, NJ, USA, 2003. [Google Scholar]
- Sturesson, J.; McIntyre, S.; Jones, N.C. State-Owned Enterprises: Catalysts for Public Value Creation. 2015. Available online: https://www.pwc.com/gx/en/psrc/publications/assets/pwc-state-owned-enterprise-psrc.pdf (accessed on 28 April 2015).
- Neely, A.; Bourne, M.; Kennerley, M. Performance measurement system design: Developing and testing a process-based approach. Int. J. Oper. Prod. Manag. 2000, 20, 1119–1145. [Google Scholar] [CrossRef]
- Caputo, F.; Veltri, S.; Ventureli, A. Sustainability strategy and management control systems in family firms. Evidence from a case study. Sustainability 2017, 9, 977. [Google Scholar] [CrossRef]
- Hosoda, M. Management control. systems and corporate social responsibility: Perspectives from a japanese small company. Corp. Gov. Int. J. Bus. Soc. 2018, 18, 68–80. [Google Scholar] [CrossRef]
- Husgafvel, R.; Pajunen, N.; Virtanen, K.; Paavola, I.L.; Päällysaho, M.; Inkinen, V.; Ekroos, A.; Dahl, O.; Heiskanen, K. Social sustainability performance indicators-experiences from process industry. Int. J. Sustain. Eng. 2015, 8, 14–25. [Google Scholar] [CrossRef]
- Senger, J. Designing a Non-for-Profit Compensation System; John Wiley & Sons, Inc.: Hoboken, NJ, USA, 2005. [Google Scholar]
- Milkovich, G.T.; Newan, J.M.; Gerhart, B. Compensation, 11th ed.; McGraw-Hill Education: New York, NY, USA, 2013. [Google Scholar]
- Booner, S.E.; Sprinkle, G.B. The effects of monetary incentives on effort and task performance: theories, evidence, and a framework for research. Account. Organ. Soc. 2002, 27, 303–345. [Google Scholar] [CrossRef]
- Packwood, E.C. Using variable pay programs to support. organization goals. In The Compensation Handbook-A State-Of-The-Art Guide to Compensation Strategy and Design, 5th ed.; Berger, L.A., Berger, D.R., Eds.; The McGraw-Hill Companies, Inc.: New York, NY, USA, 2008. [Google Scholar]
- Shiels, M.; Young, S.M. Antecedents and consequences of participative budegeting: Evidence on the effects of asymetrical information. J. Manag. Account. Res. 1993, 5, 265–280. [Google Scholar]
- Chow, C.W.; Shields, M.D.; Wu, A. The importance of national culture in the design of and preference for management controls for multi-national operations. Account. Organ. Soc. 1999, 24, 441–461. [Google Scholar] [CrossRef] [Green Version]
- O’Connor, A. Private Equity Compensation and Incentives; O’Connor, A., Private Equity International (PEI), Eds.; Hobbs the Printers: London, UK, 2012; p. 324. [Google Scholar]
- OECD. State-Owned Enterprises in Asia: National Practices for Performance Evaluation and Management; OECD: Paris, France, 2016. [Google Scholar]
- Phan, V.T.; Nguyen, V.T. Problems and prospects of state enterprise reform, 1996–2000. In State-owned Enterprises Reform in Vietnam: Lessons from Asia; Yuen, N.C., Freeman, N.J., Frank, H., Eds.; Institute of Southeast Asian Studies: Singapore, 1996; pp. 3–18. [Google Scholar]
- Nguyen, T.H. Strategic Management in Vietnam State-Owned Enterprises (SOEs). Int. J. Bus. Manag. 2016, 11, 197–204. [Google Scholar]
- Boyne, G.A. Public and private management: What’s the difference? J. Manag. Stud. 2002, 39, 97–122. [Google Scholar] [CrossRef]
- Nguyen, T.V. Managing change in vietnamese state-owned enterprises: What is the best strategy? Hum. Resour. Manag. Rev. 2003, 13, 423–438. [Google Scholar] [CrossRef]
- Painter, M. The politics of economic restructuring in vietnam: The case of state-owned enterprises "reform". Contemp. Southeast. Asia 2003, 25, 20–43. [Google Scholar] [CrossRef]
- Helden, J.V.; Reichard, C. Commonalities and differences in public and private sector performance management practices: A literature review. In Performance Measurement and Management Control: Contemporary Issues (Studies in Managerial and Financial Accounting); Marc, J., Verbeeten, E.F., Sally, K., Widener, S.K., Eds.; Emerald Group Publishing Limited: Bingely, UK, 2016; Volume 31, pp. 309–351. [Google Scholar]
- Nguyen, L.D. Organizational characteristics and employee overall satisfaction: A comparison of state-owned and non state-owned enterprises in vietnam. South. East. Asian J. Manag. 2011, 5, 135–158. [Google Scholar] [CrossRef]
- O’Connor, N.G.; Chow, C.W.; Wu, A. The adoption of western management accounting/controls in china’s state-owned enterprises during economic transition. Account. Organ. Soc. 2004, 29, 349–375. [Google Scholar] [CrossRef]
- Bedford, D.S.; Malmi, T. Configurations of control: An. exploratory analysis. Manag. Account. Res. 2015, 27, 2–26. [Google Scholar] [CrossRef]
- Thomsen, S.; Pedersen, T. Ownership structure and economic performance in the largest European companies. Strateg. Manag. J. 2000, 21, 689–705. [Google Scholar] [CrossRef]
- Lan, M.T. Public management and strategic management in vietnam state-owned enterprises (SOEs). Int. Bus. Res. 2016, 9, 58–65. [Google Scholar] [CrossRef]
- Goldeng, E.; Grünfeld, L.A.; Benito, G.R.G. The performance differential between private and state owned enterprises: The roles of ownership, management and market structure. J. Manag. Stud. 2008, 45, 1244–1273. [Google Scholar] [CrossRef]
- Kornai, J.; Maskin, E.; Roland, G. Understanding the soft budget constraint. J. Econ. Lit. 2003, 41, 1095–1136. [Google Scholar] [CrossRef]
- Kornai, J. The soft budget constraint: An introductory study to volume iv of the life’s work series. Acta Oecon. 2014, 41, 25–79. [Google Scholar] [CrossRef]
- Nhiem, P.T.; Harvie, C.; Hoa, T.V. Vietnam’s Economic Transition: Policies, Issues and Prospects; The ICFAI Univeristy Press: Dehradun, Uttarakhand, India, 2006. [Google Scholar]
- Tran, N.M.; Nonneman, W.; Jorissen, A. Privatization of vietnamese firms and its effects on firms performance. Asian Econ. Financ. Rev. 2015, 5, 202–217. [Google Scholar] [CrossRef]
- Kokko, A.; Sjoholm, F. Some alternative scenarios for the role of the state in Vietnam. Pac. Rev. 2000, 13, 257–277. [Google Scholar] [CrossRef]
- Nartisa, I.; Putans, R.; Muravska, T. Strategic planning and management in public and private sector organizations in Europe: Comparative analysis and opportunities for improvement. Eur. Integr. Stud. 2012, 6, 240–248. [Google Scholar]
- Baldwin, J.N. Public versus private: Not that different, not that consequential. Public Pers. Manag. 1987, 16, 181–193. [Google Scholar] [CrossRef]
- Waller, W.; Chow, C. Self-selection and effort effects of standard-based employment contracts: A framework and some empirical evidence. Account. Rev. 1985, 60, 458–476. [Google Scholar]
- Banker, R.D.; Lee, S.; Potter, G.S. A field study of the impact of a performance-based incentive plan. J. Account. Econ. 1996, 21, 195–226. [Google Scholar] [CrossRef] [Green Version]
- Smith, M. Research Methods in Accounting; SAGE Publications Ltd.: London, UK, 2003. [Google Scholar]
- Dillman, D.A. Mail and Internet Surveys: The Tailored Design Method, 2nd ed.; Wiley, P., Ed.; John Wiley & Sons: Hoboken, NJ, USA, 2007. [Google Scholar]
- Brislin, R.W. Back-translation for cross-cultural research. J. Cross Cult. Psychol. 1970, 1, 185–216. [Google Scholar] [CrossRef]
- Hoque, Z.; James, W. Linking balanced scorecard measures to size and market factors: Impact on organizational performance. J. Manag. Account. Res. 2000, 12, 1–17. [Google Scholar] [CrossRef]
- Chenhall, R.H. Integrative strategic performance measurement systems, strategic alignment of manufacturing, learning and strategic outcomes: An exploratory study. Account. Organ. Soc. 2005, 30, 395–422. [Google Scholar] [CrossRef]
- Chenhall, R.H.; Langfield-Smith, K. The relationship between strategic priorities, management techniques and management accounting: An empirical investigation using a system approach. Account. Organ. Soc. 1998, 23, 243–264. [Google Scholar] [CrossRef]
- Ringle, C.M.; Wende, S.; Becker, J. SmartPLS 3.2.8. 2018. Available online: https://www.smartpls.com (accessed on 14 May 2019).
- Nitzl, C. The use of partial least square structural equation modelling (pls-sem) in management accounting research: directions for future theory development. J. Account. Lit. 2016, 37, 19–35. [Google Scholar] [CrossRef]
- Hair, J.R.; Joseph, F.; Hult, G.T.M.; Ringle, C.; Sarstedt, M. A Primer on Partial Least Squares Structual Equation Modeling (PLS-SEM), 2nd ed.; SAGE Publication: Thousand Oaks, CA, USA, 2013. [Google Scholar]
- Hair, J.F.; Ringle, C.M.; Sarstedt, M. PLS-SEM: Indeed a silver bullet. J. Mark. Theory Pract. 2011, 19, 139–151. [Google Scholar] [CrossRef]
- Hair, J.R.; Joseph, F.; Sarstedt, M.; Ringle, C.M.; Gudergan, S.P. Advanced Issues in Partial Least Squares Equation Modeling; SAGE Publications, Inc.: Thousand Oaks, CA, USA, 2017. [Google Scholar]
- Hoozée, S.; Ngo, Q.H. The impact of managers’ participation in costing system design on their perceived contributions to process improvement. Eur. Account. Rev. 2017, 27, 747–770. [Google Scholar] [CrossRef]
- Parwoll, M.; Wagner, R. The Impact of MissingVvalues on PLS Model Fit. In Challenges at the Interface of Data Analysis, Computer Science, and Optimization; Gaul, W., Geyer-Schulz, A., Schmidt-Thieme, B., Kunze, J., Eds.; Springer: Berlin, Germany, 2012; pp. 537–544. [Google Scholar]
- Podsakoff, P.M.; Mackenzie, S.B.; Podsakoff, N.P. Sources of method bias in social science research and recommendations on how to control it. Annu. Rev. Psychol. 2012, 63, 539–569. [Google Scholar] [CrossRef]
- Harman, H.H. Modern Factor Analysis; The University of Chicago Press: Chicago, IL, USA, 1967. [Google Scholar]
- Hulland, J. Use of partial least squares (PLS) in strategic management research: A review of four recent studies. Strateg. Manag. J. 1999, 20, 195–204. [Google Scholar] [CrossRef]
- Chin, W.W. The partial least squares approach to structural equation modeling. In Modern Methods for Business Research; Marcoulides, G.A., Ed.; Lawrence Erlbaum Associates: Mahwah, NJ, USA, 1998; pp. 295–336. [Google Scholar]
- Fornerll, C.; Larcker, D.F. Structural equation models with unobservable variables and measurement error: algebra and statistics. J. Mark. Res. 1981, 18, 382–388. [Google Scholar] [CrossRef]
- Hesenler, J.; Ringle, C.M.; Sarstedt, M. A new criterion for assessing discriminant validity in variance-based structural equation modeling. J. Acad. Mark. Sci. 2015, 43, 115–135. [Google Scholar]
- Pan, Y.; Jackson, R.T. Ethnic difference in the relationship between acute inflammation and serum ferritin in us adult males. Epidemiol. Infect. 2008, 136, 421–431. [Google Scholar] [CrossRef] [PubMed]
- Hair, J.F.; Black, W.C.; Babin, B.J.; Anderson, R.E. Multivariate Data Analysis, 7th ed.; Pearson Education: Harlow, UK, 2014. [Google Scholar]
- Rogerson, P.A. Statistical Methods for Geography; Sage: London, UK, 2001. [Google Scholar]
- Cohen, J. Statistical Power Analysis for the Behavioral Sciences; Lawrence Erlbaum Associates: New York, NY, USA, 1988. [Google Scholar]
- Tenenhaus, M.; Vinzi, V.E.; Chatelin, Y.M.; Lauro, C. PLS path modeling. Comput. Stat. Data 2005, 48, 159–205. [Google Scholar] [CrossRef]
- Dyllick, T.; Hockerts, K. Beyond the business case for corporate sustainability. Bus. Strategy Environ. 2002, 11, 130–141. [Google Scholar] [CrossRef]
- Guo, M.; Hu, Y.; Zhang, Y.; Tian, F. State-Owned Shareholding and CSR: Do Multiple Financing Methods Matter?—Evidence from China. Sustainability 2019, 11, 1292. [Google Scholar] [CrossRef]
- Zhu, Q.; Liu, J.; Lai, K.H. Corporate social responsibility practices and performance improvement among chinese national state-owned enterprises. Int. J. Prod. Econ. 2016, 17, 417–426. [Google Scholar] [CrossRef]
- Yu, Y.; Choi, Y.; Zhang, N. Strategic corporate sustainability performance of chinesestate-owned listed firms: A meta-frontier generalizeddirectional distance function approach. Soc. Sci. J. 2015, 52, 300–310. [Google Scholar] [CrossRef]
- Xu, S.; Liu, D.; Huang, J. Corporate social responsibility, the cost of equity capital and ownership structure: an. analysis of Chinese listed firms. Aust. J. Manag. 2015, 40, 245–276. [Google Scholar] [CrossRef]
- Kuo, L.; Yeh, C.C.; Yu, H.C. Disclosure of corporate social responsibility and environmental management: Evidence from China. Corp. Soc. Responsib. Environ. Manag. 2012, 19, 273–287. [Google Scholar] [CrossRef]
- Van der Stede, W.A.; Young, S.M.; Chen, C.X. Assessing the quality of evidence in empirical management accounting research: The case of survey studies. Account. Organ. Soc. 2005, 30, 655–684. [Google Scholar] [CrossRef]
- DiMaggio, P.J.; Powell, W.W. The iron cage revisited: Instutional isomorphism and collective rationally in organizational fields. Am. Sociol. Rev. 1983, 48, 147–160. [Google Scholar] [CrossRef]
- Yan, A.; Gray, B. Bargaining power, management control., and performance in united states-China joint ventures: A comparative case study. Acad. Manag. J. 1994, 37, 1487–1517. [Google Scholar]
Figure 1.
Theoretical framework.

Table 1.
Descriptive information. VND—Vietnamese dong; CEO—chief executive officer.
| Panel A: Companies’ Background | |
|---|---|
| Firm age | |
| Mean | 27.53 years |
| Max | 110 years |
| Min | 3 years |
| Assets (million VND) | |
| ≤20 | 0.7% |
| 20–50 | 14.3% |
| 50–100 | 10.7% |
| >100 | 74.3% |
| Firm size (the number of employees) | |
| <50 | 0% |
| 50–100 | 5.7% |
| 100–200 | 27.1% |
| 200–300 | 17.9% |
| >300 | 49.3% |
| Sector | |
| Agriculture, forestry, and fishing | 7.1% |
| Mining and quarrying | 2.9% |
| Manufacturing | 43.6% |
| Electricity, gas, steam, and air conditioning supply | 5.0% |
| Water supply; sewerage, waste management, and remediation activities | 7.9% |
| Construction | 7.1% |
| Wholesale and retail trade; repair of motor vehicles and motorcycles | 3.6% |
| Transportation and storage | 12.1% |
| Accommodation and food service activities | 1.4% |
| Information and communication | 4.3% |
| Real estate activities | 0.7% |
| Administration and support service activities | 3.6% |
| Arts, entertainment, and recreation | 0.7% |
| Has there been a change in ownership since the establishment of the firm? | |
| Yes | 57.9% |
| No | 42.1% |
| Panel B: Respondent position | |
| CEOs | 12.9% |
| Top managers | 12.9% |
| Middle managers | 74.3% |
Table 2.
Construct reliability and validity of the measurement models of the relationships between state ownership and non-state ownership and performance measurement systems (PMSs). SOE—state-owned enterprise; non-SOE—non-state-owned enterprise; CR—composite reliability; AVE—average variance extracted.
| SOE PMSs | Non-SOE PMSs | |||||
|---|---|---|---|---|---|---|
| Cronbach’s Alpha | CR | AVE | Cronbach’s Alpha | CR | AVE | |
| Firm age | 1.000 | 1.000 | 1.000 | 1.000 | 1.000 | 1.000 |
| Industry | 1.000 | 1.000 | 1.000 | 1.000 | 1.000 | 1.000 |
| PM_Community | 0.937 | 0.955 | 0.841 | 0.937 | 0.955 | 0.841 |
| PM_Customer | 0.887 | 0.910 | 0.560 | 0.887 | 0.910 | 0.560 |
| PM_Ethical | 0.961 | 0.969 | 0.838 | 0.961 | 0.969 | 0.838 |
| PM_Financial | 0.777 | 0.856 | 0.599 | 0.777 | 0.857 | 0.601 |
| PM_Govern | 0.976 | 0.988 | 0.976 | 0.976 | 0.988 | 0.976 |
| PM_Innov&learning | 0.893 | 0.933 | 0.824 | 0.893 | 0.934 | 0.824 |
| PM_Intern business proc | 0.870 | 0.902 | 0.606 | 0.870 | 0.902 | 0.605 |
| Size | 1.000 | 1.000 | 1.000 | 1.000 | 1.000 | 1.000 |
| State-owned | 1.000 | 1.000 | 1.000 | |||
| Non-state-owned | 1.000 | 1.000 | 1.000 | |||
| Strategy | 0.928 | 0.938 | 0.582 | 0.928 | 0.938 | 0.582 |
Table 3.
Construct reliability and validity of the measurement models of the relationships between state ownership and non-state ownership and compensation systems.
Table 3.
Construct reliability and validity of the measurement models of the relationships between state ownership and non-state ownership and compensation systems.
| SOE Compensations | Non-SOE Compensations | |||||
|---|---|---|---|---|---|---|
| Cronbach’s Alpha | CR | AVE | Cronbach’s Alpha | CR | AVE | |
| CO_Community | 0.948 | 0.963 | 0.867 | 0.948 | 0.963 | 0.866 |
| CO_Customer | 0.901 | 0.920 | 0.592 | 0.901 | 0.920 | 0.592 |
| CO_Ethical | 0.962 | 0.970 | 0.843 | 0.962 | 0.970 | 0.843 |
| CO_Financial | 0.822 | 0.883 | 0.653 | 0.822 | 0.883 | 0.655 |
| CO_Govern | 0.984 | 0.992 | 0.985 | 0.984 | 0.992 | 0.985 |
| CO_Innov&learning | 0.923 | 0.951 | 0.867 | 0.923 | 0.951 | 0.867 |
| CO_Intern buss proc | 0.902 | 0.925 | 0.672 | 0.902 | 0.924 | 0.671 |
| Firm age | 1.000 | 1.000 | 1.000 | 1.000 | 1.000 | 1.000 |
| Industry | 1.000 | 1.000 | 1.000 | 1.000 | 1.000 | 1.000 |
| Size | 1.000 | 1.000 | 1.000 | 1.000 | 1.000 | 1.000 |
| State-owned | 1.000 | 1.000 | 1.000 | |||
| Non-state-owned | 1.000 | 1.000 | 1.000 | |||
| Strategy | 0.928 | 0.938 | 0.582 | 0.928 | 0.938 | 0.582 |
Table 4.
Path coefficients, p-values, and f2 values.
| Construct | Performance Measurement Systems | Outcome-Based Compensation Systems | ||||||||||
|---|---|---|---|---|---|---|---|---|---|---|---|---|
| SOEs | Non-SOEs | SOEs | Non-SOEs | |||||||||
| β | p | f2 | B | p | f2 | β | p | f2 | β | p | f2 | |
| Financial | −0.221 | 0.027 | 0.044 | 0.230 | 0.006 | 0.065 | −0.340 | 0.000 | 0.103 | 0.304 | 0.000 | 0.110 |
| Customer | −0.266 | 0.000 | 0.074 | 0.160 | 0.037 | 0.034 | −0.298 | 0.000 | 0.089 | 0.172 | 0.039 | 0.038 |
| Intern buss proc | −0.236 | 0.003 | 0.048 | 0.126 | 0.144 | 0.018 | −0.277 | 0.001 | 0.068 | 0.140 | 0.112 | 0.022 |
| Innov & learning | −0.036 | 0.661 | 0.001 | 0.042 | 0.546 | 0.002 | −0.108 | 0.202 | 0.012 | 0.093 | 0.201 | 0.011 |
| Ethical | −0.194 | 0.039 | 0.031 | −0.067 | 0.430 | 0.005 | −0.221 | 0.018 | 0.041 | −0.039 | 0.664 | 0.002 |
| Community | −0.152 | 0.097 | 0.02 | −0.071 | 0.359 | 0.006 | −0.101 | 0.280 | 0.009 | −0.112 | 0.161 | 0.014 |
| Govern | 0.694 | 0.000 | 0.813 | −0.338 | 0.000 | 0.165 | 0.654 | 0.000 | 0.653 | −0.340 | 0.000 | 0.167 |
Note: the bold figures indicate statistically significant results.
Table 5.
R2 and Q2 values.
| Construct | Performance Measurement Systems | Outcome-Based Compensation Systems | ||||||
|---|---|---|---|---|---|---|---|---|
| State-Owned | Non-State Owned | State-Owned | Non-State Owned | |||||
| R2 | Q2 | R2 | Q2 | R2 | Q2 | R2 | Q2 | |
| Financial | 0.205 | 0.100 | 0.219 | 0.100 | 0.189 | 0.101 | 0.191 | 0.101 |
| Customer | 0.312 | 0.137 | 0.285 | 0.137 | 0.282 | 0.135 | 0.246 | 0.135 |
| Intern buss proc | 0.169 | 0.084 | 0.144 | 0.084 | 0.181 | 0.099 | 0.146 | 0.099 |
| Innov & learning | 0.291 | 0.214 | 0.291 | 0.214 | 0.266 | 0.204 | 0.266 | 0.204 |
| Ethical | 0.111 | 0.068 | 0.088 | 0.068 | 0.141 | 0.095 | 0.108 | 0.095 |
| Community | 0.151 | 0.109 | 0.139 | 0.109 | 0.164 | 0.122 | 0.169 | 0.122 |
| Govern | 0.572 | 0.515 | 0.334 | 0.515 | 0.528 | 0.477 | 0.330 | 0.477 |
© 2019 by the authors. Licensee MDPI, Basel, Switzerland. This article is an open access article distributed under the terms and conditions of the Creative Commons Attribution (CC BY) license (http://creativecommons.org/licenses/by/4.0/).
Share and Cite
MDPI and ACS Style
Luong, T.C.T.; Jorissen, A.; Paeleman, I. Performance Measurement for Sustainability: Does Firm Ownership Matter. Sustainability 2019, 11, 4436. https://doi.org/10.3390/su11164436
AMA Style
Luong TCT, Jorissen A, Paeleman I. Performance Measurement for Sustainability: Does Firm Ownership Matter. Sustainability. 2019; 11(16):4436. https://doi.org/10.3390/su11164436
Chicago/Turabian StyleLuong, Thi Cam Tu, Ann Jorissen, and Ine Paeleman. 2019. "Performance Measurement for Sustainability: Does Firm Ownership Matter" Sustainability 11, no. 16: 4436. https://doi.org/10.3390/su11164436
Note that from the first issue of 2016, this journal uses article numbers instead of page numbers. See further details here.