In Which Time Slots Can People Save Power? An Analysis Using a Japanese Survey on Time Use

1
The Japan Institute for Labour Policy and Training 4-8-23, Kamishakujii, Nerimaku, Tokyo 177-8502, Japan
2
Faculty of Social Sciences, Waseda University 1-6-1, Nishiwaseda Shinjyuku, Tokyo 169-8050, Japan
*
Author to whom correspondence should be addressed.
Sustainability 2019, 11(16), 4444; https://doi.org/10.3390/su11164444
Submission received: 10 June 2019
/
Revised: 7 August 2019
/
Accepted: 13 August 2019
/
Published: 16 August 2019
(This article belongs to the Special Issue Innovation by Linking through Life Cycle Thinking: Practices and Challenges from EcoBalance)
Abstract
:Residential demand-side management (DSM) of electricity has been gaining attention as a way to reduce energy consumption at home and as a way of maximizing the utilization of fluctuating solar power generation. To promote the smooth introduction of DSM into homes, power usage trends according to the time of the day should be examined for individuals in relation to their lifestyles. The analyses of power usage trends can identify the types of home appliances that should be utilized differently in order to increase energy efficiency. Such analyses can also predict the individual behavioral changes that should result in home appliances being used in the time slots in which solar power is more conveniently available. The purpose of this research was to estimate and observe the amount of power saving potential for each daily time slot with respect to an individual’s particular attributes, and to derive the power saving potential of the whole country by accumulating these data on individuals. This was achieved by using the Survey on Time Use and Leisure Activities (STULA) and Energy-Saving Performance Catalog (ESPC) in Japan. According to the results of our estimation, a meaningful power saving potential is sufficient to address a power supply shortage after a disaster such as an earthquake. It is possible to save power by replacing existing home appliances with more energy efficient ones, by making environmentally conscious choices when using home appliances, and by discontinuing the use of home appliances during electricity shortages within the community as a whole. Using the estimated power saving potentials, we examined the effects of two DSMs: (1) adjusting the time for which home appliances are used; and (2) aggregating the power demand of households with different attributes. The results showed that these DSMs would contribute to a more stable power system operation. Future research might address the rapid penetration of community energy management systems and demand response systems.
1. Introduction
The “Long-term Energy Supply and Demand Outlook (2015)” summarized by the Ministry of Economy, Trade, and Industry (METI), Japan, set targets for 2030 as follows. Energy conservation will be carried out thoroughly so that energy demand will be reduced by 13% against no measures (business as usual) and by setting the renewable energy ratio in the total power supply to 22–24%. The carbon dioxide emissions from energy consumption will be reduced by 21.9% compared with the total emissions of 2013. On the other hand, in Japan, final energy consumption has decreased by 8.4% in the manufacturing sectors from fiscal year (FY) 1990 to FY 2017, while it increased by 20.1% in the household sector. In FY 2017, 19.4% of Japan’s total energy consumption was consumed by households. As far as electricity is concerned, the proportion was 28.4% of the whole [1]. Future energy conservation measures will need to focus on the household sector. In Japan, 94% of renewable energy equipment newly introduced after the start of the feed-in tariff system in 2012 involves residential/non-residential solar power generation [2]. The power supply configuration of renewable energy is biased toward solar power generation. As a result, power control of solar power was implemented a total of 26 times in FY 2018 in the Kyushu area, where there is a large installation of solar power generation (Ministry of Economy, Trade and Industry (METI), Japan, the 21st Power System Working Group handouts (in Japanese), available at: https://www.meti.go.jp/shingikai/enecho/shoene_shinene/shin_energy/keito_wg/021.html). In Japan, destabilization of the power system due to effects from the increasing solar power supply is becoming a problem.
Based on this background, residential demand-side management (DSM) of electricity has been drawing attention as a way to reduce energy consumption at home and maximize the utilization of fluctuating solar power generation [3]. DSM helps individuals save energy. Changes in the temporal pattern of electricity consumption through DSM further helps movement towards the use of renewable energy and reduces the dependence on fossil fuels. If we decide to use home appliances during the daytime, when a larger amount of solar power can be used, we can exploit solar power more efficiently. Increasing the presence of DSM in homes is desirable; however, variations have been found in the rates of participation in residential areas, and many factors influence participation related decisions [4]. To promote the smooth introduction of DSM into homes, power usage trends according to the time of day should be examined for individuals in relation to their lifestyles. The analyses of power usage trends could identify the types of home appliances that must be utilized differently in order to increase energy efficiency. Such analyses could also predict the individual behavioral changes that would result in home appliances being used in time slots in which solar power is more conveniently available.
The purpose of this research was to estimate and observe the amount of electricity saving potential for each daily time slot of individuals with various attributes, and to derive the power saving potential of the whole country by accumulating these data on individuals. This was done using the Survey on Time Use and Leisure Activities (STULA), compiled in 2011 by the Ministry of Internal Affairs and Communications (MIC), Japan. By doing this, we were able to clarify what kind of people could save electricity at what times and in what ways, and how much electricity could be saved at maximum. We believe that an elucidation of the structure of the residential electricity saving potential is necessary to determine the most effective institutional design of DSM. It should make possible suggestions on how to induce energy conservation behavior using a price mechanism and how to issue highly reliable DR (demand response: a mechanism by which consumers are encouraged to change their power consumption patterns in response to a certain incentive). For example, in a household where family members tend to spend their time away more often than not, there is little scope for saving electricity. The DR issued for such a home may be ineffective. In addition, the DR issued for a time slot in which electricity which could be saved is not used, is also ineffective. People can turn off the vacuum cleaner, but cannot unplug the refrigerator, even though a DR is issued and economic benefits can be obtained from saving electricity. The DR should be institutionally designed for those who can use it effectively, and for the time slots in which it can be used effectively. The purpose of this research was to find such people and time slots.
In Section 2 of this paper, we review previous studies that discussed the relationship between residents’ lifestyles and power saving behavior. In Section 3, we describe the data used and how to calculate the power saving potential by (daily) time slots for individuals with specific attributes. In Section 4, we present the estimation results and facts observed about the distribution of power saving potential by time slot. We discuss in Section 5, the extracted suggestions for an effective institutional design of DSM based on our findings. Finally, conclusions are presented in Section 6.
2. Literature Review
In this section, we survey prior research that analyzed the relationships between the energy saving behaviors of people and their lifestyles at home. Berry [4] advocated for market penetration of DSM programs, and Zhu et al. [5] investigated price and income elasticity of electric power by meta-analysis and studied the factors affecting them. As a result, they pointed out a variety of factors, such as consumer and community characteristics, affecting residential electricity demand. Mizutani et al. [6] argued that consumer reactions to DR have a psychological reference price effect. The reference price effect is a concept used in marketing theory and refers to the psychological influence from a reference price when consumers buy things at actual prices. Innocent and Francois-Lecomte [7] argued that the factors driving consumer energy-saving behavior were about well-being, not about cost or environmental consciousness. Loi and Ng [8] measured the price and income elasticity of residential electricity demand in Singapore. They argued that an understanding of the underlying socioeconomic factors is important for responding to possible rebound effects. As discussed above, in the latest research, attention was directed to psychological and socio-economic factors, rather than ordinary economic variables such as price and income, for their effects on consumer electricity demand behavior.
Wang et al. [9] investigated social psychology factors affecting residential energy saving behaviors in China, and showed that the saving behavior was motivated by “altruism”. Wallis et al. [10] revealed that social demographic factors influence residential power consumption based on differences in resident purchasing behavior, according to a survey in Germany. They point out that grasping the behavioral information of residents is important for predicting electricity demand. Based on structural equation modeling using survey data in 10 EU countries, Thøgersen [11] showed that environmental and frugal self-identities led to energy saving attitudes or intentions, but did not lead to actual energy saving behaviors. Yu and Guo [12] used a survey result in China to divide residential energy consumption into minimum necessary and consumption slack. They said that consumption slack leads to a reduction in power consumption and that information feedback and social demographic characteristics affect that reduction. Bedir and Kara [13] argue that the power consumption of information, communication, and entertainment (ICE) appliances is increasing, so that the demand for electricity has been greatly influenced by the behavior of residents. Using a web survey in Japan, Fujimi et al. [14] pointed out that the customs and lifestyles of residents changed as a result of major disaster and their behavior became energy-saving. These previous studies pointed out that there is an important relationship between the electricity demand and the behavioral patterns of residents. Moreover, some researchers pointed out that social demographic factors and psychological factors of residents influence the behavioral patterns. However, the relationship between these factors and energy saving behaviors they cause is not clear. These studies were based on limited samples, which in turn limited their value for deriving general trends for society as a whole. To capture the general trends of society as a whole, it is better to use national social statistics.
The consumer purchasing behavior for energy-saving equipment was analyzed by Baldini et al. [15] using survey data from the Danish Energy Agency, and by Trotta [16] using survey data from the UK. In addition to demographic factors, these studies address, as factors that affect peoples’ purchasing behavior, their ordinary behavioral variables or psychological factors. Shigetomi et al. [17] characterized CO2 emission patterns for each region using only variables accessible from the national survey, such as household information and consumption composition ratios by energy type. They compared the results among regions and considered the implications for energy conservation policies. Ding et al. [18] analyzed the effects that predictable change in the ratio of consumer-goods composition has on CO2 emissions, using a Chinese input–output table. They analyzed changes in CO2 emissions that were brought about through the supply chain of each consumption good. Research using social statistics makes it possible to show the trends of society as a whole, but it is difficult in those analyses, to consider specific differences in lifestyle between individuals (such as differences in usage of daily hours between individuals).
Several recent studies refer to technology as a means to bring about energy saving. Zhang et al. [19] showed that the improvement of the quality of energy saving products greatly influences energy conservation in Chinese households. Wittenberg and Matthies [20] investigated how best to use solar panels in German households and pointed out that energy conservation technologies must be linked to environmentally conscious behavior of the residents. Elsharkawy and Rutherford [21] also noted that as a lesson from housing policy in the UK, resident awareness is necessary for the introduction of new devices to be effective. They pointed out that it is important to provide residents with information on how best to use the new devices. Thøgersen [22] and Axsen et al. [23] pointed out that the difference in people’s lifestyles influences their acceptance and behavior regarding energy-saving technologies. Perez-Gracia et al. [24] noted that it is important to introduce technologies that match climate or building conditions. These papers showed that energy saving could not always be achieved just because energy saving technology was introduced, and that it was achieved only when people were able to use the new technology successfully. It is important to know how people use home appliances.
There have been studies that determined the energy conservation of residents by monitoring, from an engineering point of view, the trends of household electricity demand [25,26]. There has also been research that analyzes the relationship between family composition and the lifestyles of residents and the trends of their electricity consumption [27,28]. For the purpose of optimizing electricity use at home, Arcos-Vargas et al. [29] examined the introduction of the latest energy management equipment, such as storage batteries. In order to specify the method for saving energy or the power saving technology to be introduced, it is indispensable to observe household electricity consumption patterns in detail for each time period. However, because such trends in the data of household electricity demand are closely related to the privacy of individuals (and their activities), there are limits on the disclosure of such data. The above preceding research has been carried out based on limited samples. To obtain conclusions that can be generalized, such research will have to be deepened.
The STULAs are social statistics that are used to investigate how people use their living time for the purpose of clarifying the actual reality of Japanese social life. The STULA has a more than adequate sample size. With the STULA, we can learn how people use their time in fifteen-minute intervals. Based on data recording how people use time, and based on the technical information of energy-saving home appliances found in the Energy-Saving Performance Catalog (ESPC), we calculated in detail how much electricity saving potential people have in each time slot. To accumulate these results, we estimated the total energy saving potential of people by classification of their demographic characteristics. By analyzing the electricity saving potential estimated by the above method, it is possible to reveal its implications for the design of a system such as DSM; designs constructed using DSM can induce energy saving behavior more effectively and enable the use of renewable energy more conveniently.
Table 1 summarizes this section. Our study supplements existing literature by quantitatively examining Japanese lifestyles in relation to time usage, and the technical conditions of energy-saving home appliances in detail. The novel approach of our study is seen in the development and implementation of a method for calculating household power saving potential on a national scale. It is expected that the results will indicate the general trends of society as a whole.
3. Data and Method
3.1. Overview
Figure 1 illustrates our procedure for estimating energy saving potential by (daily) time slot in Japan. STULA divides a day into 96 parts every fifteen minutes and shows what an individual was doing in each time period. Based on this data, we calculated the behavior probability by type of behavior every fifteen minutes. Several types of behavior involve the use of home appliances. When an individual performs that type of behavior, changing the usage of home appliances may save power. We will refer to electricity that can be saved in this way as the “power saving potential”. We aggregated the power saving potential estimated by individual attributes with the potential per household by type of household. We further weighted the potential of each household type based on household type distribution, and estimated the national-level saving potential.
3.2. Behavior Probability for Individuals
We used the results from Questionnaire B of STULA. In that survey, we could see what an individual was doing every fifteen minutes during the day. We could also see whether the individual was at home during that time. Using the survey results, we first calculated behavior probabilities and home probabilities for 108 behavior types in each fifteen minutes for each individual attribute. Here, the behavior probability for a behavior type in a certain fifteen minutes was the proportion of those who perform that behavior in that 15 min period. The home probability represents the proportion of those who perform that behavior at home. Individuals were classified into fifteen attributes that combined age, gender, and occupation/without occupation.
We denote the behavior probability at which an individual with attribute j takes action i in time slot t as , and the home probability at which an individual with attribute j takes action i at home in time slot t as .
3.3. Power Saving Potential per Household
We defined the behavior probability and the home probability of a household with attribute m by averaging corresponding individual behavior probabilities and the home probabilities in the previous section. The household attributes encompass the following nine types: couple (young), couple (old), couple & child, couple & child & elderly, single parent & child, single (young/male), single (young/female), single (old/male), and single (old/female).
We estimated the amount of power saving by a household with attribute m, taking the power saving action related to home appliance l in time slot t by the following equation.
Here, represents unit power saving per fifteen minutes for home appliance l belonging to Category A or B or C, as shown in Table 2. Each unit power saving was set for each of the three power saving methods (replacement of, devising how environmentally conscious to be in terms of use, and discontinuing home appliances). In this case, indicates the probability that an individual with attribute j is sleeping in time slot t, and is the value of the person who sleeps at the lowest probability in time slot t out of of individuals belonging to a family with attribute m.
The unit power saving per fifteen minutes in Table 2 is the value estimated based on the ESPC 2016 winter version [30]. ESPC [30], as shown in the Appendix A Table A1, reports the power saving potential of one year when using home appliances, and the total working time per year (minutes) of home appliances were assumed to calculate them. Here, has a value for each of the categories: replacement of, devising how environmentally conscious it is in terms of use, and discontinuing home appliances. The unit power savings in Table 2 are calculated under the assumptions in the Appendix A Table A1.
3.4. Aggregated Power Saving Potential by Household Attributes
Finally, we multiplied the amount of power saving per household calculated by Equation (1), by the number of households as per the census, and calculated the aggregated electricity saving potential amount for each household type as follows:
where indicates the amount of power saving by households of type M in the census, taking power saving behaviors related to home appliance l in time slot t. By summing up for all l, Equation (3) estimates the total power savings in time slot t by households of type M.
Here, the classification of type M is single household (less than 65), single household (over 65), couple, couple & child, single parent & child, and three generation household. Furthermore, by summing up for all t, Equation (4) estimates the total power savings all day for all households of type M.
Equations (2)–(4) are calculated separately for the categories: replacement of, devising how environmentally conscious to be in terms of use, and discontinuing home appliances.
4. Results: Power Saving Potential Curve
Here, we present the calculated power saving potentials determined using the methods described in Section 3. These results correspond to a situation where the entire relevant population is supposed to take measures for replacing home appliances, and knows how to be environmentally conscious when using them and discontinuing them. Our calculations show the maximum possible values, not the mean values. However, we believe that it is important to know quantitatively how much power saving potential exists in the whole country by performing calculations using Japan-wide social statistics. Furthermore, for future DSM program planning, it is important to know in detail which attributes of a household can provide the most power saving potential, and which changes in home appliance usage (including time of use) can provide power saving potential.
Table 3 shows the electricity saving potential during the day, which was obtained by adding Equation (3) for all t and the potential obtained by adding the equation from the time interval including the hours from 09:00 to 15:00. The time slots from 09:00 to 15:00 is when the spot price of electric power on the Japan Electric Power Exchange (JEPX) is relatively high and in which power tends to be insufficient. During these time slots, the DR may be invoked, meaning that consumers change their pattern of electricity consumption so as to suppress the use of power in response to the payment of incentives, and people may gain financial benefit from saving power. From 09:00 to 15:00, when the spot price of electric power is high, it is expected that people will receive a large reward by cooperating in electricity saving efforts.
According to Table 3, for example, in the summer, the power saving potential achievable by all households by devising how environmentally conscious to be when using home appliances is 295.5 GWh per day, among which the power saving potential from 09:00 to 15:00 is 68.6 GWh. In September 2018, in Hokkaido, the northern island of Japan, power stations failed due to a large-scale earthquake, and power outages occurred throughout the region. After that, the power failure was resolved little by little, but a power supply shortage continued for a while. According to the report, the power supply shortage amount was 0.8 GW. In Table 3, the total amount of electricity saving by devising how environmentally conscious to be when using home appliances for six hours from 09:00 to 15:00 is 68.6 GWh, of which the contribution of Hokkaido, estimated from the population ratio, may be 0.53 GW per hour (=68.6 × 0.046/6, Here, 0.046 is the ratio of the number of households in Hokkaido to that in the whole country in 2015: the year of the latest available census). This is 66.3% of the shortage of electricity supply that occurred in Hokkaido immediately after the earthquake. Therefore, the power saving potential shown in Table 3 is considered to have an important meaning as a measure for avoiding power supply shortages in emergencies.
According to Table 3, while households of “couple & child” account for about 27% of the total households, their contribution to total power saving potential is 37–40%. For the time slots from 09:00 to 15:00, their contribution is 43–55%. It is important to develop power saving programs that are convenient for households of a “couple & child”. In winter, because more home appliances are assumed to be used, the power saving potential is about 1.1 to 1.8 times higher than for summer. Of the power saving potential all day, 22% occurs in the time slots from 09:00 to 15:00. The power saving potential by discontinuing the use of home appliances is the largest.
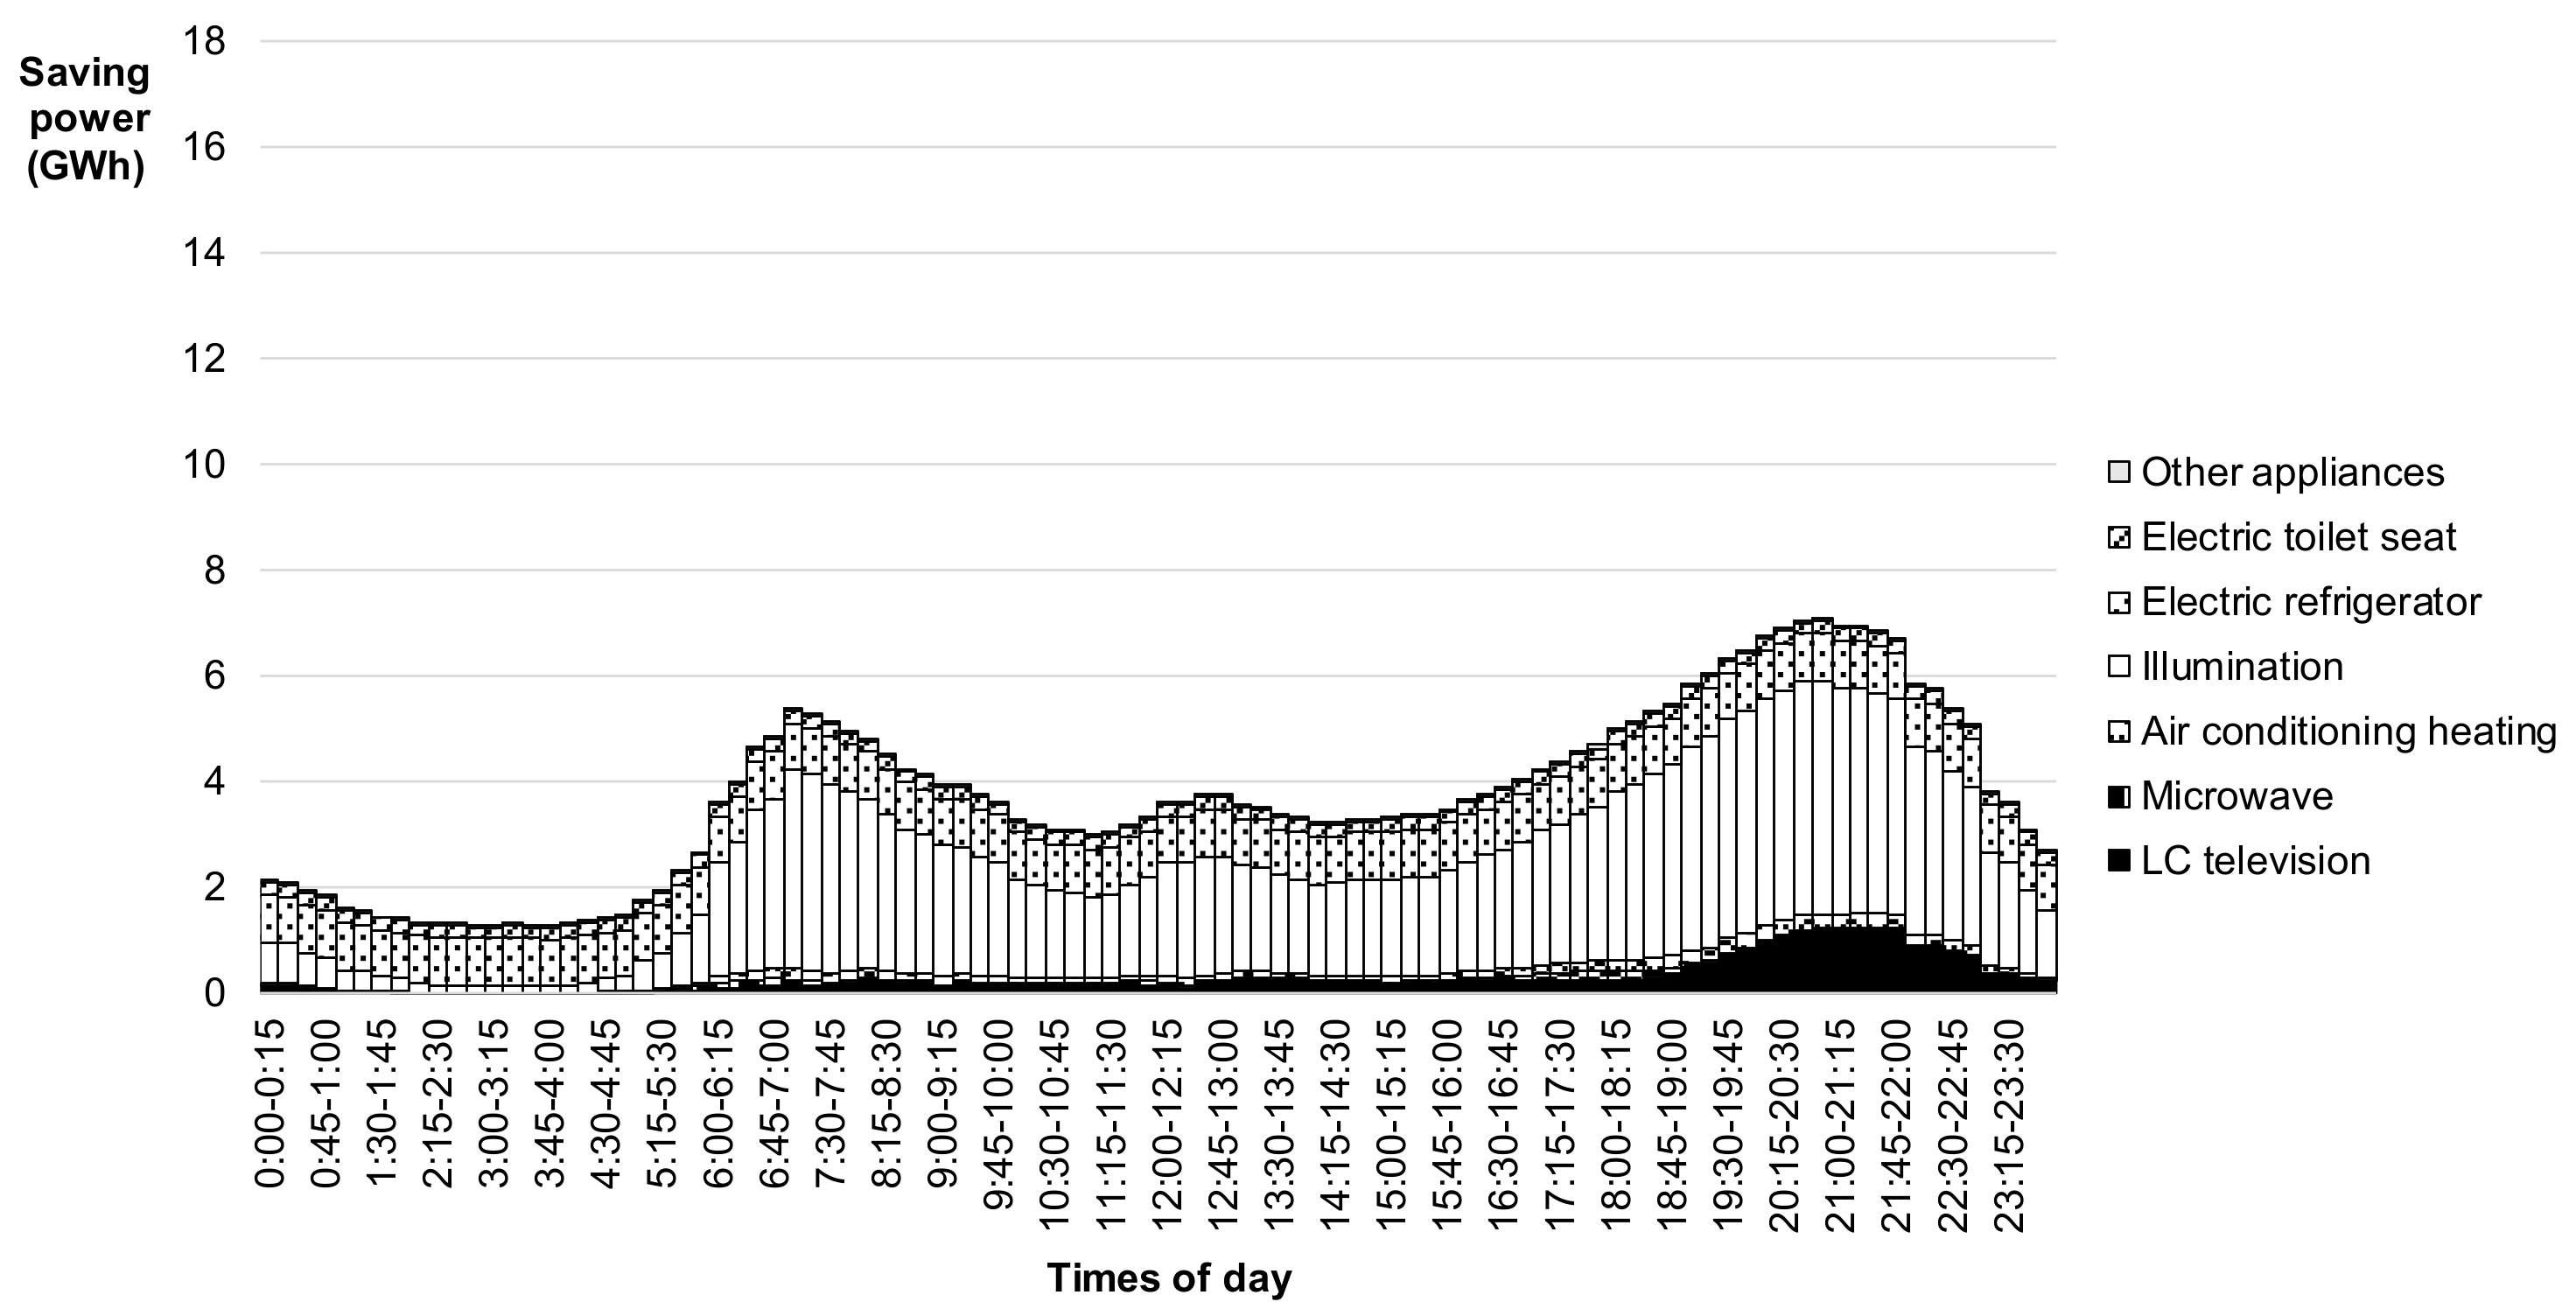
Figure 2, Figure 3 and Figure 4 are “power saving potential curves” showing the transition of power saving potential by time slot calculated from Equation (2). The Figures are shown for winter, and show the power saving potential when households replace, devise how environmentally conscious to be in terms of use, or discontinue use of home appliances in each time slot. According to Figure 2, replacing the illumination from incandescent lamps with LEDs has the greatest effect among power savings caused by the replacement of home appliances. Power savings due to the replacement of a refrigerator has a big effect in time periods with low power consumption, such as near dawn. In the time from 19:00 to 23:00, the effect of replacing a LC television is also great.
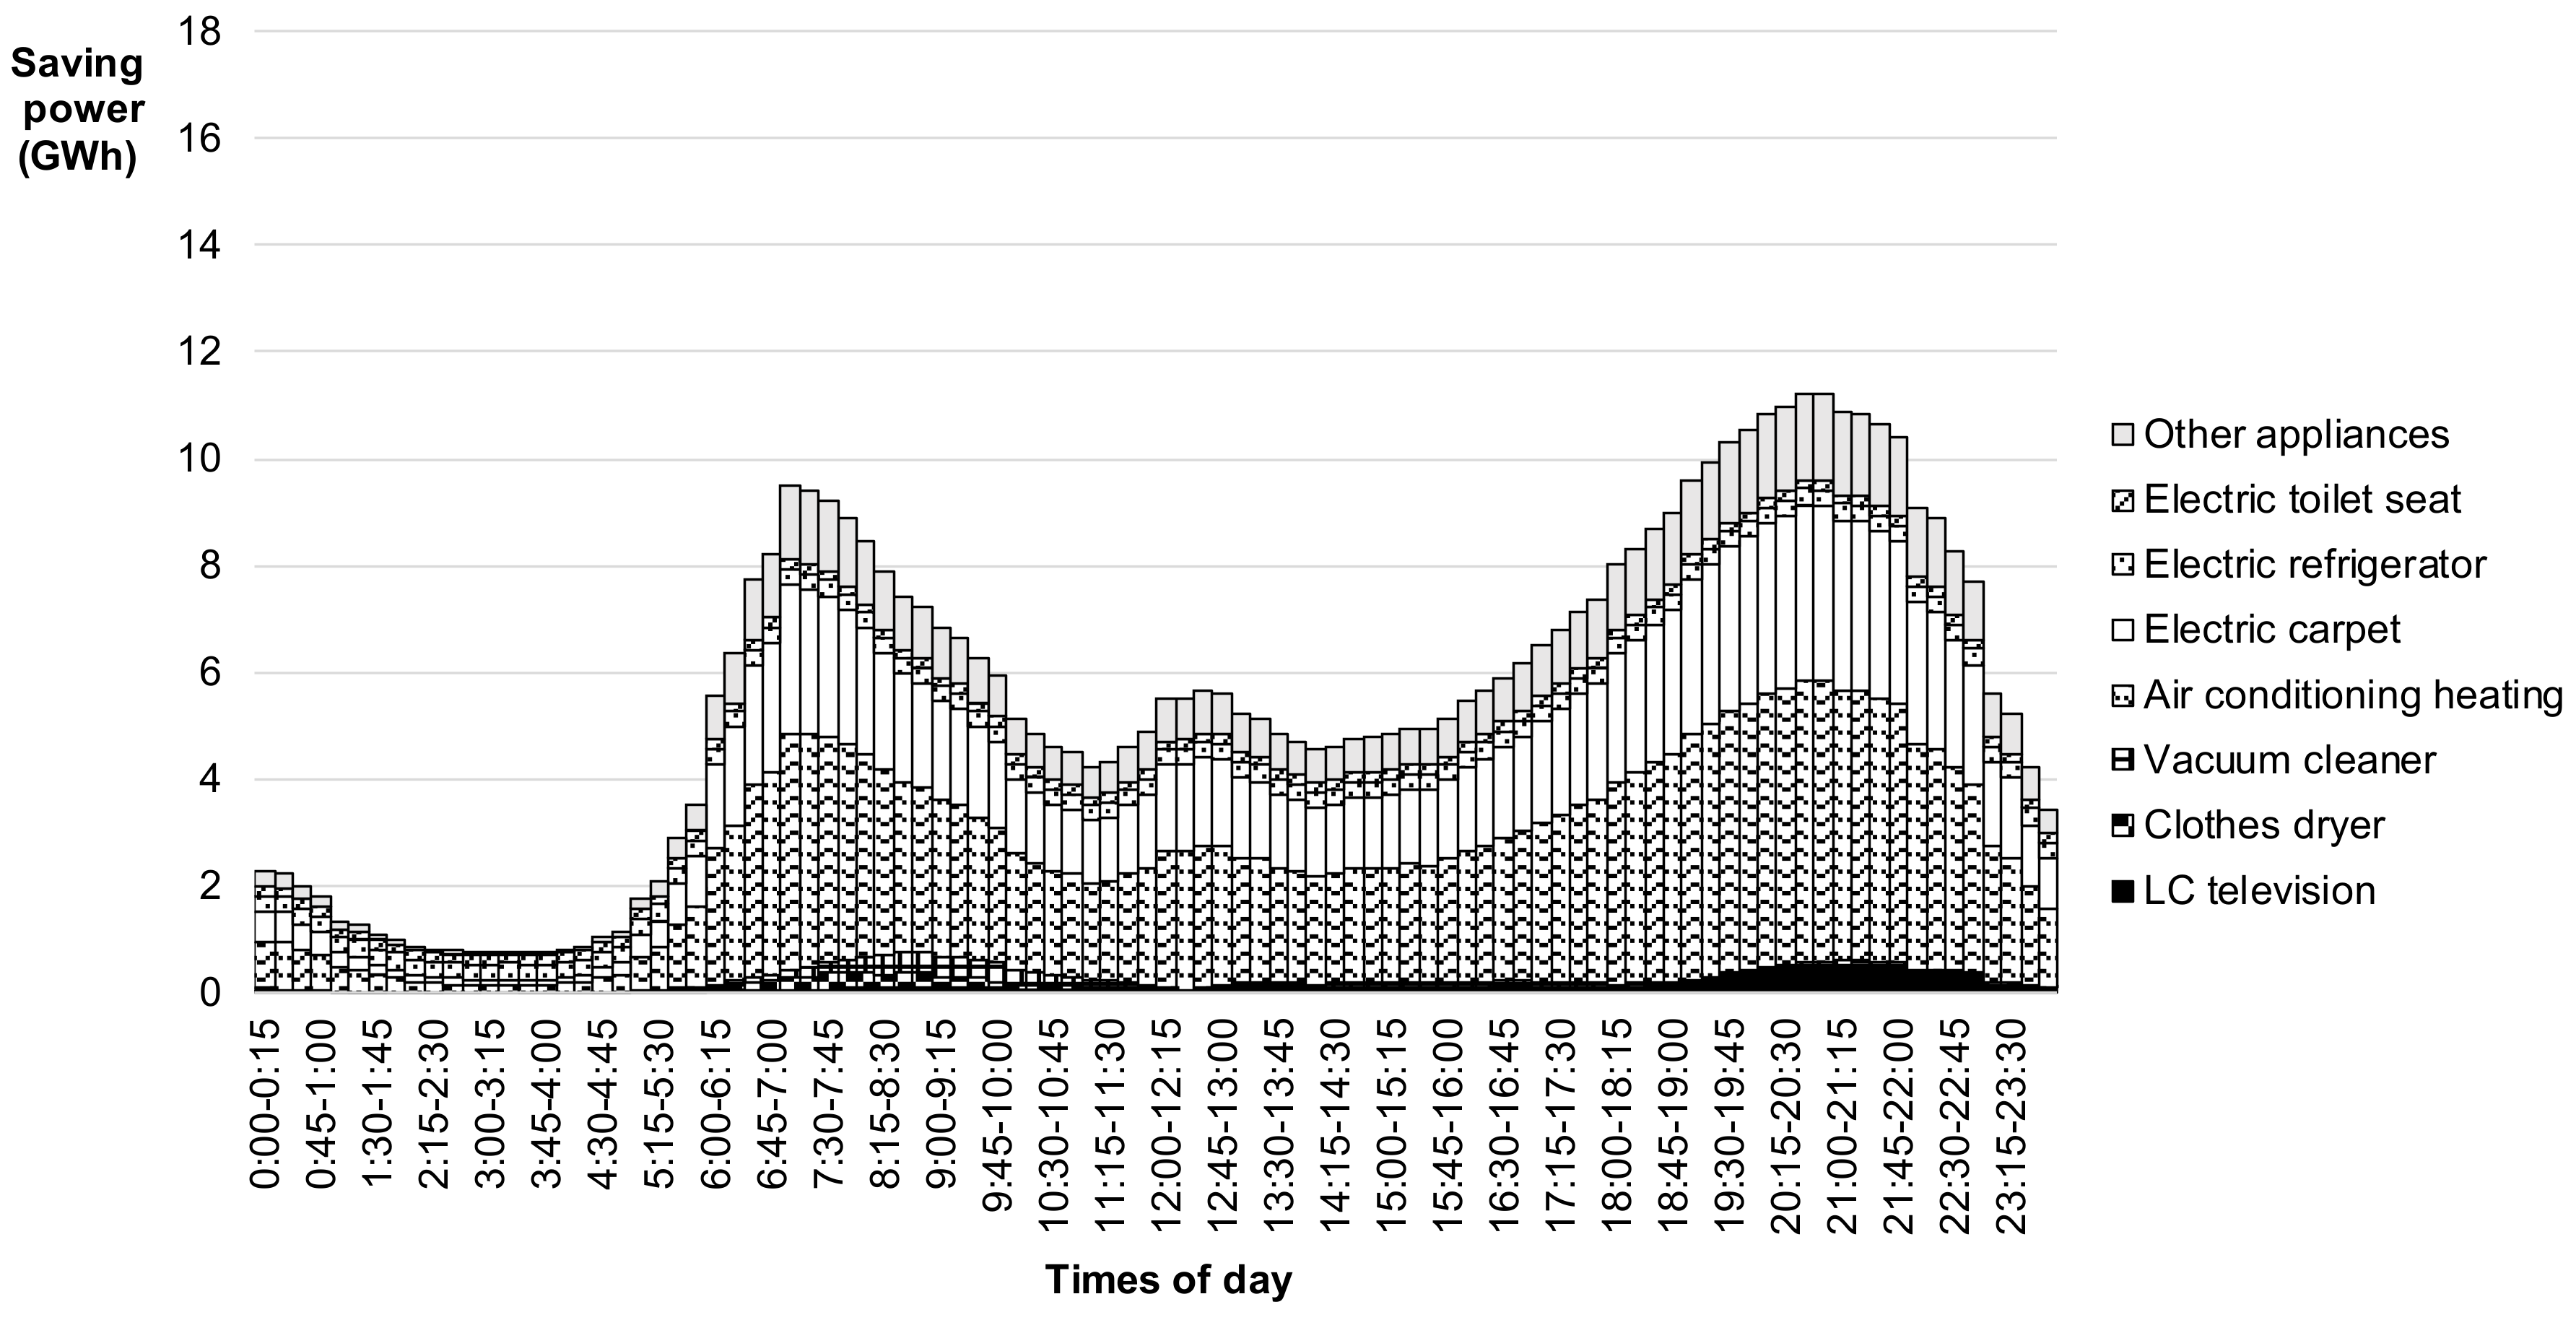
According to Figure 3, in the power saving brought about by devising how environmentally conscious to be when using home appliances, the change in usage of heating devices such as air conditioners has the greatest influence. In Figure 3, vacuum cleaners, washing machines, and clothes dryers are effective from 07:00 to 10:00, and LC television is effective from 19:00 to 23:00.
As shown in Figure 4, the power saving effect by discontinuing the use of home appliances, particularly the use of heating devices such as air conditioners, is the largest. The time at which the power saving potential becomes particularly large is twice a day (around 07:00 and 18:00). At those times, not using microwave ovens brings about a large power saving effect. Between 07:00 and 10:00, not using vacuum cleaners also produces a significant power saving effect. It should be noted that Figure 4 shows the power saving potential due to discontinuing the use of household appliances and also shows the potential power consumption by using them. Because the assumption that everyone discontinues all use of home appliances is not realistic, it is impossible to achieve the total amount of power saving potential shown in Figure 4. However, people who think that it is unnecessary to use home appliances at a certain time period could stop using them, or they could stop using useless home appliances, so that a part of the potential shown in Figure 4 may be achieved. In addition, referring to Figure 4, people can stop using home appliances during times when social power consumption is high, and can move the use of home appliances to times when social power consumption is low.
Figure 5 shows the contribution ratio of each home appliance to each power saving potential for households with different attributes. In a household with any of the attributes specified, home appliances with large electricity saving potentials include illumination equipment and refrigerators (for replacement), and heating equipment (for devising and discontinuing use). These home appliances are those that are assumed to be in operation all day, or during times other than sleeping. In households with few family members, these home appliances have a high share of the power saving effect. On the other hand, in households with a large number of family members, the influence of home appliances used in response to individual behavior (group A appliances in Table 1 such as LC televisions and microwave ovens) is increased.
From the above results, we were able to clarify the distribution of power saving potential of households on a national scale in Japan. In addition, we confirm that the total household power saving potential is on a scale that is sufficiently useful in the event of emergencies such as a disaster. Therefore, it is desirable to develop power saving measures that target households with specific attributes, certain time slots, and home appliances that have a particularly large energy saving potential.
5. Examination of the Effects of Two DSMs
We estimated the power saving potential existing in society by accumulating information in detail from data on how individuals use their living time and data showing the performance of average home appliances. In this section, we will examine the effect of two DSMs using estimated results. One DSM approach is to move use time of home appliances. According to Figure 2, Figure 3 and Figure 4, which show the temporal distribution of power saving potential, the power saving potential is concentrated in the morning and evening. The potential in the time slots from 09:00 to 15:00, when the electric spot price is high, is relatively small. If people shift the use time of home appliances slightly and the power saving potential in the time slots from 09:00 to 15:00 increases, social energy efficiency will improve.
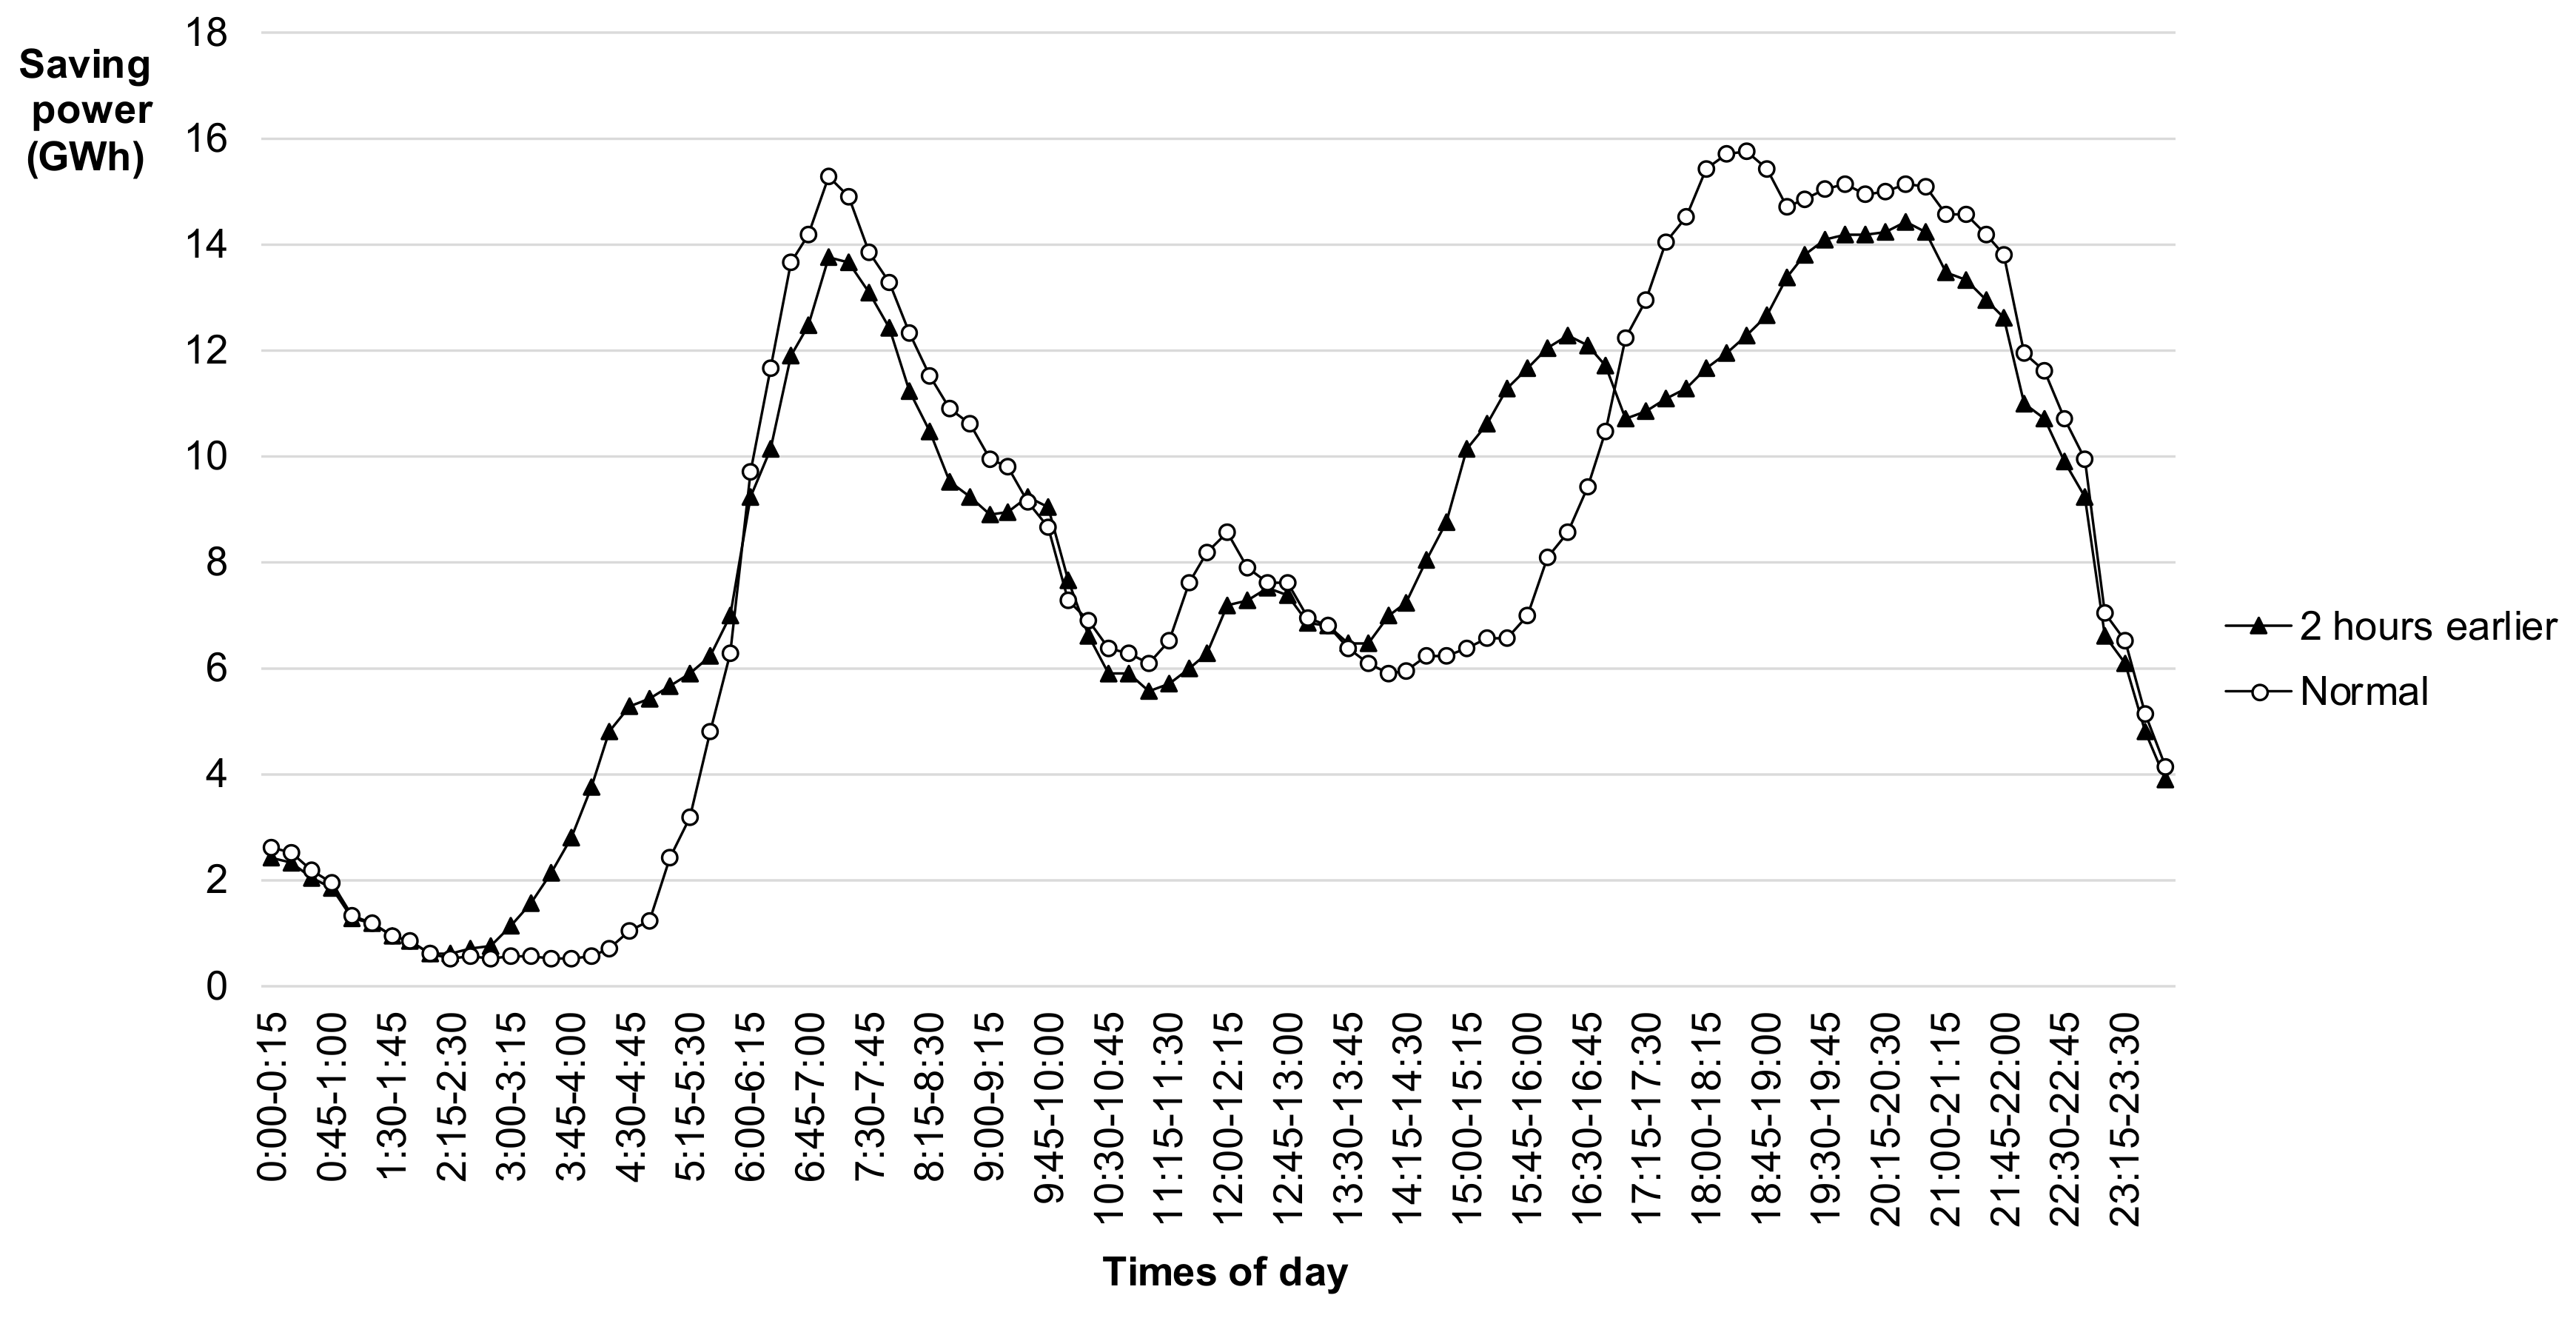
We examined the effect when Group A appliances (home appliances used according to specific behaviors) in Table 1 are used two hours earlier than the current situation. Figure 6 shows the maximum power saving potential caused by discontinuing the use of home appliances in winter, when Group A home appliances are used two hours earlier than the current situation. In Figure 6, it is assumed that the home appliances of Categories B and C are used in the same manner as the current situation. We also displayed the current power saving potential in Figure 6. When Group A appliances are used two hours earlier, the power saving potential increases by 1.3% (2.3 GWh) between 09:00 and 15:00. Moreover, it was found that the difference between the maximum and the minimum value among power saving potentials at each point in the day is reduced by 9.6% by changing the use time of home appliances. This indicates that changing the time of use of home appliances increases the power saving potential in time slots when the electric spot price is high. This change stabilizes the fluctuation of the power saving potential of the day. Changing the time of use of this home appliance turned out to be effective, because it increased the power saving potential in the time period required and flattened the power saving potential between time slots.
Another DSM is to aggregate the power demand of households with different attributes. By aggregating power demand in a residential area as a whole, power consumption of the area is stabilized, for each time slot, by offsetting power consumption of households with low electricity consumption and households with high electricity consumption. A community energy management system (CEMS) is a technology for improving the energy efficiency of a community by simultaneously managing the energy use of homes in that community. In Japan, this technology has been introduced in several communities and social experiments are being conducted to verify the effect [31]. Therefore, we examined a scenario in which CEMS is widespread in the future.
Figure 7 shows how much the power saving potential during a certain time period increases or decreases when the power saving potential in the immediately preceding time slot is set to ‘1′. Figure 7 shows the period from 15:30 to 19:30, where the rate of increase of the power saving potential relative to the immediately preceding time slot is particularly high. For an efficient power supply, it is considered that a sudden change in the power saving potential between time periods is undesirable. According to Figure 7, in single households (less than 65), single parent & child households, and three generations households, there are particularly severe fluctuations in power saving potential between time periods. On the other hand, in single households (over 65) and couple & child households, the change between periods is relatively small. The red dotted line shown in Figure 7 shows the average magnitude of fluctuation for each time period. This line is considered to indicate the situation where a CEMS is realized in each community and the fluctuations of the power saving potential between households offset each other. For example, with the introduction of the CEMS, it is anticipated that the major fluctuation at 17:30–17:45 will be relaxed by 33.1% in single parent and child households.
In Japan, from 2011 to 2015, the Ministry of Economy, Trade and Industry (METI) led a next-generation energy and social system demonstration project, and the effects of DR and CEMS implementation were verified in four large cities (Ministry of Economy, Trade and Industry (METI), Japan, the 18th Next Generation Energy and Social Systems Council -handouts (in Japanese). Available at: https://www.meti.go.jp/committee/summary/0004633/018_haifu.html). While these research results have greatly contributed to the collection of engineering information necessary for the smooth operation of the systems, research on their social effects has not progressed significantly. Ida et al. [32] focused on researching people’s responses to DR, but their findings were limited to the evaluation of the results of the demonstration area. In contrast, we examine the implementation effects of DR and CEMS by analyzing social statistics for the whole country. We highlight that our study calculates the potential values, and not the actual values after consideration of the implementation rate. Through our study, however, it has become clear that CEMS and DR are expected to have sufficient potential; thus, we would like to develop future research for the rapid penetration of these systems.
6. Discussion
In this study, we attempted to estimate the power saving potential curve by time slot of day based on the STULA data compiled by the MIC. The STULA reports how individuals with various attributes spend each fifteen-minute period. In addition, the ESPC compiled by the ANRE estimates the power saving effects when people replace their home appliances with the newest models, devise how environmentally conscious to be when using their home appliances, or discontinue their use. First, we used the STULA data to calculate the probability that individuals with each attribute would perform each type of behavior during each fifteen-minute period (1). Next, according to the assumptions given in the ESPC, we calculated the amount of electricity savings per fifteen-minute (power saving intensity) unit that should be achievable when using a home appliance (2). Then, the probability calculated from (1) was multiplied by the corresponding power saving intensity unit of (2), and the power saving potential, for each fifteen-minute period, of individuals with each attribute was calculated. In addition, we summed up the power saving potentials of different individuals according to the type of household.
By drawing the power saving potential curve by time of day in this manner, we were able to visualize the types of households with high power saving potential for each fifteen-minute period. Moreover, by summing the obtained results with all households over time, we estimated the electricity saving potential of households throughout the country. The value of the power saving potential estimated by accumulating detailed behavioral data of people, as described above, can be expected to have high accuracy.
The followings points can be taken from the results of the power saving potential curve:
- ✓
- A meaningful power saving potential, sufficient to address a power supply shortage of the same magnitude as that of the power plant failure following the September 2018 earthquake, was confirmed for the Hokkaido region of Japan.
- ✓
- Because households of a couple and child have the greatest power saving potential among the various household attributes, it will be important to prepare power saving programs according to time of use of these households.
- ✓
- It is possible to save power by replacing existing home appliances with more energy efficient ones, and in particular, by replacing illumination equipment with LEDs.
- ✓
- In households with low electricity consumption, the power saving effect by replacing refrigerators is relatively large.
- ✓
- It is effective to make environmentally conscious choices when using home appliances. In particular, a significant power saving effect can be achieved by setting an optimal temperature when using an air conditioner.
- ✓
- It is effective to discontinue the use of home appliances during periods of electricity shortage within the community as a whole. Turning off the air conditioner during such times is most effective. Furthermore, during meal time slots, the effect of refraining from using a microwave is also large.
Using the estimation results, we examined the effect of two DSMs: moving the time of use of home appliances and aggregating the power demand of households with different attributes using CEMS. The results showed that these DSMs stabilized the power saving potential curve and alleviated large changes in the power saving potential between time periods. Therefore, these DSMs would contribute to the stabilization of the power system’s operation. We confirmed the comprehensive effect of such DSMs by using detailed estimated results of the power saving potential from the accumulated behavioral data of people.
The limitations of this research are as follows. First, in this study, we calculated the maximum power savings under the assumption that everyone who had a power saving opportunity, saved electricity. We are going to conduct a questionnaire survey on what percent of people who have power saving opportunities in each time period actually respond to power saving at a certain electricity price. Second, we demonstrated the maximum effect when assuming that everyone responds to DSM. People will face some inconvenience when they are asked to shift the timing of use of home appliances by two hours. We will investigate how large the paid incentives need to be in order for people to accept that inconvenience. If those findings are added to the detailed power saving estimation of this research, the structure of the power saving potential for the whole country will become clearer. This will lead to a more effective power saving program in the future.
Despite these limitations, this study could find the national tendency of the power saving potential via analyses using large-scale national survey data. Currently, DSM is drawing attention for its ability to induce the effective use of renewable energy. We found that certain household attributes might be able to better contribute to DSM if a specific home appliance is used in a specific way during the time slots in which DSM is required.
7. Concluding Remarks
In this research, using an official Japanese survey on time use, we estimated the amount of power saving potential for each daily time slot for individuals with various attributes, and derived the power saving potential of the whole country by accumulating these data. According to the results of our estimation, a meaningful power saving potential is sufficient to address a power supply shortage after a disaster such as an earthquake. It is possible to save power by replacing existing home appliances with more energy efficient ones, by making environmentally conscious choices while using home appliances, and by discontinuing the use of home appliances during periods of electricity shortage within the community as a whole. Through the use of estimated power saving potentials, we examined the effect of two DSMs: (1) adjusting the time when home appliances are used, and (2) aggregating the power demand of households with different attributes. The results showed that these DSMs would contribute to more stable power system operation.
This study is an initial approach to examining the social utility of DSM.
Author Contributions
Conceptualization, S.N. and A.W.; methodology, S.N. and A.W.; software, S.N.; formal analysis, S.N. and A.W.; resources, S.N. and A.W.; data curation, S.N.; writing—original draft preparation, A.W.; writing—review and editing, S.N. and A.W.; visualization, S.N. and A.W.; project administration, A.W.; funding acquisition, A.W.
Funding
This study was conducted with the assistance of a MEXT Grant-in-Aid for Scientific Research (Project number 15KT0121, 16K12663), a Waseda University Grant for Special Research Projects (Project number: 2019C-308), and the Environment Research and Technology Development Fund (2-1707) of the Environmental Restoration and Conservation Agency and MOE.
Conflicts of Interest
The authors declare no conflict of interest.
Appendix A

Table A1.
Power saving potentials reported in ESPC 2016 winter version.
| Power Saving Potential (kWh/Year) | Total Working Time Per Year (minutes) | Assumptions on Calculation of Power Saving | Assumptions about Usage Time | ||
|---|---|---|---|---|---|
| Replacement | |||||
| A | LC television | 108.0 | 98,550 | Replacement from 2006 to 2015 product | 4.5 h/day × 365 days |
| Rice cooker | 9.4 | 23,400 | Replacement from 2010 product to 2015 product | 1 h/times × 390 times | |
| Microwave | 2.4 | 2639.5 | Replacement from 2010 product to 2015 product | from manufacturer catalog | |
| B | Air conditioner | 66.0 | 303,480 | Replacement from 2006 to 2015 product | Cooling period 6/2–9/21 (112 days), Heating period 11/28–4/14 (169 days), 6:00–24:00 |
| Illumination | 810.0 | 120,450 | Replace 54 W incandescent bulb with 9 W LED lamp. Assuming that the size of the main living room is 18 tatami mats. Since the LED illumination for 18 tatami mats is 81 w, the power saving amount is multiplied by nine | 5.5 h/day × 365 days | |
| C | Electric refrigerator | 508.1 | 525,600 | Replacement from 2005 to 2015 product | 24 h × 365 days |
| Electric toilet seat | 186.7 | 525,600 | Replacement from 2006 to 2015 product | 24 h × 365 days | |
| How environmentally conscious to be in terms of use | |||||
| A | LC television | 27.1 | 97,200 | Adjust the screen brightness of TV from “maximum” to “medium” | 4.5 h × 360 days |
| 16.8 | 97,200 | Reduce useless viewing | 4.5 h × 360 days | ||
| Rice cooker | 45.8 | 153,300 | Stop warming for 7 h a day | 7 h × 365 days | |
| Laptop PC | 1.5 | 10,140 | Switch the power option from “system standby” to “turn off monitor power”. | 3.25 h × 52 weeks | |
| 5.5 | 10,140 | Reduce useless using | 3.25 h × 52 weeks | ||
| Washing machine | 5.9 | 13,140 | Comparison between using 80% of rated capacity once every two days and using 40% of capacity daily | 36 min/day × 365 days from the catalog of a manufacturer | |
| Clothes dryer | 42.0 | 29,200 | Comparison between using 80% of rated capacity once every two days and using 40% of capacity daily | 160 min/two days × 365 days from catalog of a manufacturer | |
| 394.6 | 29,200 | Comparison between cases of auxiliary drying after natural drying for 8 h and drying with only dryer. Used once every two days. | 160 min/two days × 365 days from catalog of a manufacturer | ||
| Vacuum cleaner | 1.6 | 2190 | Comparison between when the pack is full of garbage and when it is unused | 6 min/day × 365 days from catalog of a manufacturer | |
| 5.5 | 2190 | Reduce useless using | 6 min/day × 365 days from catalog of a manufacturer | ||
| B | Air conditioner | 30.2 | 60,480 | When the outside air temperature is 31 °C and the air-conditioning set temperature is changed from 27 °C to 28 °C. | 9 h/day × Cooling period 112 days |
| 18.8 | 60,480 | Reduce useless using (Setting temperature 28 °C) | 9 h/day × Cooling period 112 days | ||
| 53.1 | 91,260 | When the outside air temperature is 6 °C and the heating set temperature is changed from 21 °C to 20 °C. | 9 h/day × Heating period 169 days | ||
| 40.7 | 91,260 | Reduce useless using (Setting temperature 20 °C) | 9 h/day × Heating period 169 days | ||
| 32.0 | 16,860 | Comparison between case of clogged filter and case of cleaned filter | 1 h/day × (Cooling and heating period 112 + 169 days) | ||
| Illumination | 29.6 | 120,450 | Reduce useless lighting time of 9 W LED lamp. Assumed that the size of the main living room is 18 mats. Since the LED illumination for 18 tatami mats is 81 w, the assumed power saving amount is multiplied by 9 | 5.5 h /day | |
| Electric carpet | 186.0 | 50,700 | For three tatami mats, when the temperature setting is changed from “strong” to “medium” | 5 h/day × Heating period 169 days | |
| 89.9 | 50,700 | When changing from 3 tatami carpet to 2 tatami carpet | 5 h/day × Heating period 169 days | ||
| C | Electric kotatsu | 49.0 | 50,700 | When setting temperature is changed from “strong” to “medium” | 5 h/day × Heating period 169 days |
| 32.5 | 50,700 | Comparison between case of using only Kotatsu futon and case of using upper cover and mattress in addition to kotatsu futon | 5 h/day × Heating period 169 days | ||
| Electronic pot | 107.5 | 131,400 | Comparison between cases when kept warm for 6 h and when reboiled without keeping warm | 6 h/day × 365 days | |
| Electric refrigerator | 43.8 | 525,600 | Comparison between case of filling objects thoroughly and case of putting them halfway | 24 h × 365 days | |
| 10.4 | 525,600 | When opening/closing frequency is reduced | 24 h × 365 days | ||
| 6.1 | 525,600 | When opening time of the door is shortened | 24 h × 365 days | ||
| 61.7 | 525,600 | When setting temperature is changed from “strong” to “medium” | 24 h × 365 days | ||
| 45.1 | 525,600 | Comparison between the case where both sides are surrounded by walls and the case where there is no wall on one side | 24 h × 365 days | ||
| Electric toilet seat | 34.9 | 525,600 | Comparison between when the lid is closed and when it is left open | 24 h × 365 days | |
| 26.4 | 525,600 | When the set temperature of the toilet seat is lowered from “medium” to “weak” | 24 h × Heating period 169 days | ||
| 13.8 | 525,600 | When the temperature setting of washing water is lowered from “medium” to “weak” | 24 h × 365 days | ||
| 68.0 | 525,600 | When using the power saving function | 24 h × 365 days | ||
| Discontinued | |||||
| A | LC television | 16.8 | 21,900 | Based on estimation in case of 1 h discontinuation | 1 h × 365 days |
| Rice cooker | 61.6 | 23,400 | Based on estimation in case of 1 h discontinuation | 1 h × 390 times | |
| Microwave | 66.8 | 2639.5 | Data from “Usage of microwave oven” | From “Usage of microwave oven” | |
| Laptop PC | 5.5 | 21,900 | 1 h × 365 days | ||
| Washing machine | Data from catalog of a manufacturer | ||||
| Clothes dryer | Data from catalog of a manufacturer | ||||
| Vacuum cleaner | 5.5 | 365 | Based on estimation in case of 1 min discontinuation | 1 min × 365 days | |
| Dishwasher-dryer | 525.2 | 61,320 | Based on the data when the use of the assumed time period is stopped | 84 min/time × two times/day × 365 days from catalog of a manufacturer | |
| B | Air conditioner cooling | 18.8 | 6720 | Based on estimation in case of 1 h discontinuation | 1 h/day × Cooling period 112 days |
| Air conditioning heating | 40.7 | 10,140 | Based on estimation in case of 1 h discontinuation | 1 h/day × Heating period 169 days | |
| Illumination | 29.6 | 21,900 | Based on estimation in case of 1 h discontinuation of 9 W LED lamp. Assumed that the size of the main living room is 18 mats. Since the LED illumination for 18 tatami mats is 81 W, the assumed power saving amount is multiplied by 9. | 1 h × 365 days | |
| Electric carpet | Data from catalog of a manufacturer | ||||
| Electric kotatsu | Data from catalog of a manufacturer | ||||
| Electronic pot | 200.0 | 503,700 | Data from catalog of a manufacturer | Based on Japan Electrical Manufacturers Association’s assumption | |
| C | Electric toilet seat | 87.0 | 525,600 | Based on the data when the use of the assumed time period is stopped | 24 h × 365 days |
Unless otherwise noted, the source of the data is ANRE “Energy-saving performance catalog 2016 winter version [30].”
References
- Agency for Natural Resources and Energy (ANRE), Japan. Comprehensive Energy Statistics, 2017. Available online: http://www.enecho.meti.go.jp/statistics/total_energy/results.html#headline1 (accessed on 1 December 2018).
- Agency for Natural Resources and Energy (ANRE), Japan. Feed-in Tariff System Information Publication Website, 2018. Available online: https://www.fit-portal.go.jp/PublicInfoSummary (accessed on 1 December 2018). (In Japanese)
- Ishii, H.; Hirohashi, W.; Mitsuoka, M.; Hayashi, Y. Demand Side Response/Home Energy Management. Smart Grid Handbook; Wiley Online Library: Hoboken, NJ, USA, 2016. [Google Scholar] [CrossRef]
- Berry, L. A review of the market penetration of US residential and commercial demand-side management programmes. Energy Policy 1993, 21, 53–67. [Google Scholar] [CrossRef]
- Zhu, X.; Li, L.; Zhou, K.; Zhang, X.; Yang, S. A meta-analysis on the price elasticity and income elasticity of residential electricity demand. J. Clean. Prod 2018, 201, 169–177. [Google Scholar] [CrossRef]
- Mizutani, F.; Tanaka, T.; Nakamura, E. The effect of demand response on electricity consumption under the existence of the reference price effect: Evidence from a dynamic pricing experiment in Japan. Electr. J 2018, 31, 16–22. [Google Scholar] [CrossRef]
- Innocent, M.; Francois-Lecompte, A. The values of electricity saving for consumers. Energy Policy 2018, 123, 136–146. [Google Scholar] [CrossRef]
- Loi, T.S.A.; Ng, J.L. Analysing households’ responsiveness towards socio-economic determinants of residential electricity consumption in Singapore. Energy Policy 2018, 112, 415–426. [Google Scholar] [CrossRef]
- Wang, B.; Wang, X.; Guo, D.; Zhang, B.; Wang, Z. Analysis of factors influencing residents’ habitual energy-saving behaviour based on NAM and TPB models: Egoism or altruism? Energy Policy 2018, 116, 68–77. [Google Scholar] [CrossRef]
- Wallis, H.; Nachreiner, M.; Matthies, E. Adolescents and electricity consumption; Investigating sociodemographic, economic, and behavioural influences on electricity consumption in households. Energy Policy 2016, 94, 224–234. [Google Scholar] [CrossRef]
- Thøgersen, J. Frugal or green? Basic drivers of energy saving in European households. J. Clean. Prod. 2018, 197, 1521–1530. [Google Scholar] [CrossRef]
- Yu, Y.; Guo, J. Identifying electricity-saving potential in rural China: Empirical evidence from a household survey. Energ. Policy 2016, 94, 1–9. [Google Scholar] [CrossRef]
- Bedir, M.; Kara, E.C. Behavioral patterns and profiles of electricity consumption in Dutch dwellings. Energy Build. 2017, 150, 339–352. [Google Scholar] [CrossRef]
- Fujimi, T.; Kajitani, Y.; Chang, S.E. Effective and persistent changes in household energy-saving behaviors: Evidence from post-tsunami Japan. Appl. Energy 2016, 167, 93–106. [Google Scholar] [CrossRef]
- Baldini, M.; Trivella, A.; Wente, J.W. The impact of socioeconomic and behavioural factors for purchasing energy efficient household appliances: A case study for Denmark. Energy Policy 2018, 120, 503–513. [Google Scholar] [CrossRef]
- Trotta, G. Factors affecting energy-saving behaviours and energy efficiency investments in British households. Energy Policy 2018, 114, 529–539. [Google Scholar] [CrossRef]
- Shigetomi, Y.; Matsumoto, K.; Ogawa, Y.; Shiraki, H.; Ehara, T. Driving forces underlying sub-national carbon dioxide emissions within the household sector and implications for the Paris Agreement targets in Japan. Appl. Energy 2018, 228, 2321–2332. [Google Scholar] [CrossRef]
- Ding, Q.; Cai, W.; Wang, C.; Sanwal, M. The relationships between household consumption activities and energy consumption in China? An input-output analysis from the lifestyle perspective. Appl. Energy 2017, 207, 520–532. [Google Scholar] [CrossRef]
- Zhang, C.; Yu, B.; Wang, J.; Wei, Y. Impact factors of household energy-saving behavior: An empirical study of Shandong Province in China. J. Clean. Prod. 2018, 185, 285–298. [Google Scholar] [CrossRef]
- Wittenberg, I.; Matthies, E. Solar policy and practice in Germany: How do residential households with solar panels use electricity? Energy Res. Soc. Sci. 2016, 21, 199–211. [Google Scholar] [CrossRef]
- Elsharkawy, H.; Rutherford, P. Energy-efficient retrofit of social housing in the UK: Lessons learned from a Community Energy Saving Programme (CESP) in Nottingham. Energy Build. 2018, 172, 295–306. [Google Scholar] [CrossRef]
- Thøgersen, J. Housing-related lifestyle and energy saving: A multi-level approach. Energy Policy 2017, 102, 73–87. [Google Scholar] [CrossRef]
- Axsen, J.; Cairns, J.; Dusyk, N.; Goldberg, S. What drives the Pioneers? Applying lifestyle theory to early electric vehicle buyers in Canada. Energy Res. Soc. Sci. 2018, 44, 17–30. [Google Scholar] [CrossRef]
- Perez-Garcia, A.; Guardiola, A.P.; Gomez-Martinez, F.; Guardiola-Villora, A. Energy-saving potential of large housing stocks of listed buildings, case study: l’Eixample of Valencia. Sustain. Cities Soc. 2018, 42, 59–81. [Google Scholar] [CrossRef]
- Ashouri, M.; Haghighat, F.; Fung, B.C.M.; Lazrak, A.; Yoshino, H. Development of building energy saving advisory: A data mining approach. Energy Build. 2018, 172, 139–151. [Google Scholar] [CrossRef]
- Guo, Z.; Zhou, K.; Zhang, X.; Yang, S.; Shao, Z. Data mining based framework for exploring household electricity consumption patterns: A case study in China context. J. Clean. Prod. 2018, 195, 773–785. [Google Scholar] [CrossRef]
- Sun, L.; Zhou, K.; Yang, S. Regional difference of household electricity consumption: An empirical study of Jiangsu, China. J. Clean. Prod. 2018, 171, 1415–1428. [Google Scholar] [CrossRef]
- Ozawa, A.; Kudoh, Y.; Yoshida, Y. A new method for household energy use modeling: A questionnaire-based approach. Energy Build. 2018, 162, 32–41. [Google Scholar] [CrossRef]
- Arcos-Vargas, A.; Lugo, D.; Nunez, F. Residential peak electricity management. A storage and control systems application taking advantages of smart meters. Int. J. Electr. Power. 2018, 102, 110–121. [Google Scholar] [CrossRef]
- Agency for Natural Resources and Energy (ANRE). Energy-Saving Performance Catalog 2016 Winter Version 2016. Available online: http://www.enecho.meti.go.jp/category/saving_and_new/saving/general/more/pdf/winter2016.pdf (accessed on 1 December 2018). (In Japanese)
- Agency for Natural Resources and Energy (ANRE). Smart Community Case Examples 2017. Available online: http://www.meti.go.jp/press/2017/06/20170623002/20170623002-1.pdf (accessed on 1 December 2018). (In Japanese)
- Ito, K.; Ida, T.; Tanaka, M. Moral suasion and economic incentives: Field experimental evidence from energy demand. Am. Econ. J Econ. Policy 2018, 10, 240–267. [Google Scholar] [CrossRef]
Figure 1.
Flowchart illustrating the interconnection between the STULA (Survey on Time Use and Leisure Activities, Japan) and the ESPC (Energy-Saving Performance Catalog).
Figure 1.
Flowchart illustrating the interconnection between the STULA (Survey on Time Use and Leisure Activities, Japan) and the ESPC (Energy-Saving Performance Catalog).
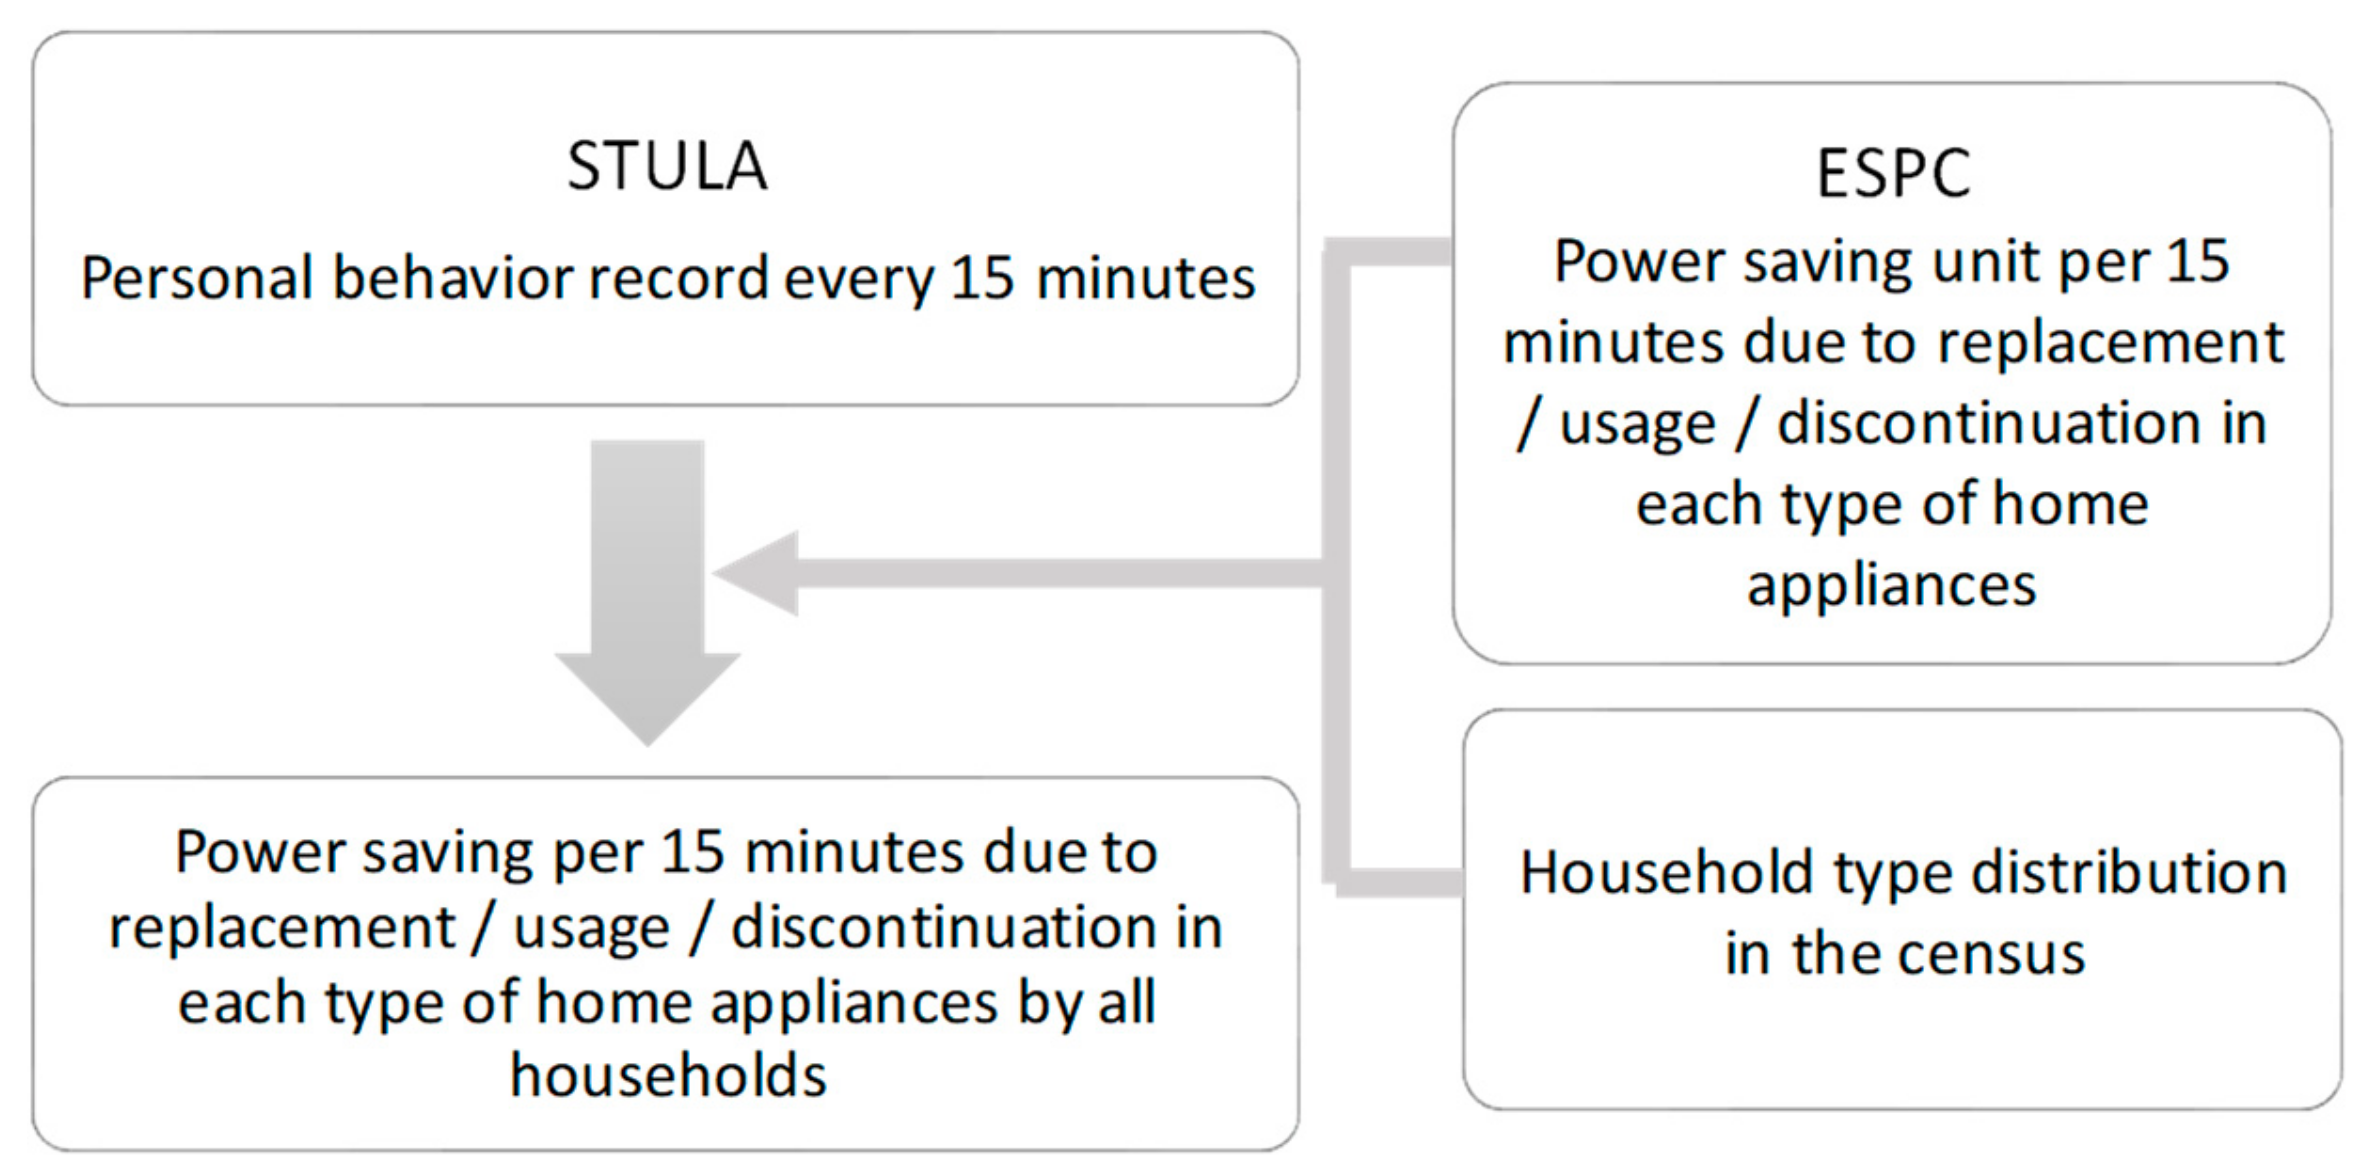
Figure 2.
Power saving potential curve (winter, replacement).

Figure 3.
Power saving potential curve (winter, how environmentally conscious to be in terms of use).
Figure 3.
Power saving potential curve (winter, how environmentally conscious to be in terms of use).

Figure 4.
Power saving potential curve (winter, discontinuing).

Figure 5.
Contribution ratios of each home appliance to power saving potential (winter).

Figure 6.
Effect of using home appliances of Category A 2 h earlier (winter, discontinuing).

Figure 7.
Index of change in power saving potential by time slot (15:30–19:30, winter, discontinuing).
Figure 7.
Index of change in power saving potential by time slot (15:30–19:30, winter, discontinuing).

Table 1.
Summary of the relationship between power saving behavior and people’s lifestyles.
| Data Used | Differences in Lifestyle are Considered As: | ||
|---|---|---|---|
| Previous studies | Survey data with a limited sample size | between | Behavioral patterns of residents |
| Social demographic factors | |||
| Psychological factors | |||
| in the use of home appliances | |||
| Social statistics with a large sample size | between | socio-economic attributes | |
| demographic attributes | |||
| Our study | STULA 1 with ESPC 2 | between | Behavioral patterns of residents |
| Psychological factors | |||
| Socio-economic attributes | |||
| Demographic attributes. | |||
| in the use of home appliances | |||
1 STULA (Survey on Time Use and Leisure Activities, Japan). 2 ESPC (Energy-Saving Performance Catalog).
Table 2.
Power saving per fifteen minutes (kWh/15 min).
| Types of Home Appliances | RPLC 1 | HOWTO 1 | DISC 1 | S/W 2 | When to Use 3 | |
|---|---|---|---|---|---|---|
| A | Liquid crystal (LC) television | 0.0164 | 0.0068 | 0.0115 | S & W | Watching TV |
| Rice cooker | 0.0060 | 0.0045 | 0.0395 | S & W | Preparing meals | |
| Microwave | 0.0136 | 0 | 0.3796 | S & W | Preparing meals | |
| Laptop personal computer (PC) | 0 | 0.0103 | 0.0038 | S & W | Use of computer | |
| Washing machine | 0 | 0.0067 | 0.0270 | S & W | Washing | |
| Clothes dryer | 0 | 0.2243 | 0.1924 | S & W | Washing | |
| Vacuum cleaner | 0 | 0.0479 | 0.2240 | S & W | Sweeping | |
| Dishwasher-dryer | 0 | 0 | 0.1285 | S & W | Cleaning up after meals | |
| B | Air conditioner cooling | 0.0010 | 0.0406 | 0.0419 | S | Not sleeping |
| Air conditioning heating | 0.0022 | 0.0438 | 0.0603 | W | ||
| Illumination | 0.1009 | 0.0037 | 0.0203 | S & W | ||
| Electric carpet | 0 | 0.0816 | 0.0854 | W | ||
| Electric kotatsu | 0 | 0.0241 | 0.0324 | W | ||
| Electronic pot | 0 | 0.0123 | 0.0060 | W | ||
| C | Electric refrigerator | 0.0145 | 0.0048 | 0 | S & W | All times |
| Electric toilet seat | 0.0053 | 0.0041 | 0.0025 | S & W | ||
1 RPLC: Replacement, HOWTO: How environmentally conscious it is in terms of use, DISC: Discontinuation. 2 S and W indicate that the home appliance operates in summer or winter, respectively. 3 Category A appliances were assumed to be used when people conducted the behavior shown here. Category B appliances were assumed be used except for when people were sleeping. Category C appliances were assumed to be used at all times.
Table 3.
Power saving potential of the whole country (GWh).
| Summer | Winter | ||||||
|---|---|---|---|---|---|---|---|
| RPLC | HOWTO | DISC | RPLC | HOWTO | DISC | ||
| All day | Single household (less than 65) | 45.8 | 35.5 | 39.9 | 51.6 | 65.2 | 80.5 |
| Single household (over 65) | 33.8 | 29.1 | 33.7 | 37.1 | 53.7 | 68.6 | |
| Couple | 71.9 | 63.3 | 93.5 | 78.0 | 114.5 | 166.3 | |
| Couple & child | 122.4 | 118.6 | 195.7 | 131.5 | 215.6 | 335.5 | |
| Single parent & child | 26.1 | 22.6 | 35.2 | 28.7 | 41.2 | 61.3 | |
| Three generations household | 27.9 | 26.4 | 46.5 | 29.9 | 47.6 | 77.0 | |
| 09:00–15:00 | Single household (less than 65) | 5.7 | 2.5 | 1.3 | 7.0 | 4.3 | 3.1 |
| Single household (over 65) | 7.4 | 6.3 | 7.3 | 8.2 | 11.6 | 14.7 | |
| Couple | 17.4 | 15.5 | 22.3 | 18.9 | 27.8 | 39.8 | |
| Couple & child | 33.2 | 34.7 | 52.8 | 35.6 | 62.9 | 93.7 | |
| Single parent & child | 3.0 | 1.9 | 1.9 | 3.6 | 3.2 | 3.6 | |
| Three generations household | 7.5 | 7.6 | 11.2 | 8.1 | 14.0 | 20.4 | |
| All day total | 327.9 | 295.5 | 444.5 | 356.8 | 537.7 | 789.2 | |
| 09:00–15:00 Total | 74.2 | 68.6 | 96.9 | 81.3 | 123.8 | 175.2 |
RPLC: Replacement, HOWTO: How environmentally conscious to be in terms of use, DISC: Discontinuation.
© 2019 by the authors. Licensee MDPI, Basel, Switzerland. This article is an open access article distributed under the terms and conditions of the Creative Commons Attribution (CC BY) license (http://creativecommons.org/licenses/by/4.0/).
Share and Cite
MDPI and ACS Style
Nakano, S.; Washizu, A. In Which Time Slots Can People Save Power? An Analysis Using a Japanese Survey on Time Use. Sustainability 2019, 11, 4444. https://doi.org/10.3390/su11164444
AMA Style
Nakano S, Washizu A. In Which Time Slots Can People Save Power? An Analysis Using a Japanese Survey on Time Use. Sustainability. 2019; 11(16):4444. https://doi.org/10.3390/su11164444
Chicago/Turabian StyleNakano, Satoshi, and Ayu Washizu. 2019. "In Which Time Slots Can People Save Power? An Analysis Using a Japanese Survey on Time Use" Sustainability 11, no. 16: 4444. https://doi.org/10.3390/su11164444
Note that from the first issue of 2016, this journal uses article numbers instead of page numbers. See further details here.