Article

Issues and Impacts of the Apricot Value Chain on the Upland Farmers in the Himalayan Range of Pakistan

by
Rakhshanda Kousar
1,
Muhammad Sohail Amjad Makhdum
2,*,
Azhar Abbas
1,*,
Javaria Nasir
1 and
Muhammad Asad ur Rehman Naseer
1
1
Institute of Agricultural and Resource Economics, University of Agriculture Faisalabad, Punjab 38040, Pakistan
2
Department of Economics, Government College University Faisalabad, Punjab 38000, Pakistan
*
Authors to whom correspondence should be addressed.
Sustainability 2019, 11(16), 4482; https://doi.org/10.3390/su11164482
Submission received: 5 July 2019 / Revised: 8 August 2019 / Accepted: 14 August 2019 / Published: 19 August 2019

Abstract

:
The livelihood of the people in the Himalayan range of Pakistan is largely dependent on the cultivation of fruits. Apricot and apple are the major fruits of this region, which are marketed throughout the country and also exported to other countries. Due to high perishability and the poor farm-to-market infrastructure in the region, farmers are unable to get maximum returns. This study was conducted keeping in view the importance of the region and the impacts of fruits on the livelihood of the farmhands. Cross-sectional data from 200 respondents were collected through a multistage random sampling technique. Factor analysis was employed to find out the constraint in the apricot production and propensity score matching estimates were employed to see the impact of apricot production on the farming communities in the study area. The results of the factor analysis show the most important group of constraints in the growth of the apricot industry is awareness, which is an internal factor. This is followed by production, policy, and marketing constraints. The least important is processing technology. Furthermore, the results show that apricot production has a significant positive impact on decreasing the poverty level of the household, depicting a great potential for the development of resilient livelihoods.

1. Introduction

The trend of globalization stimulated excessive prospects for expanding business for developing economies in domestic, as well as in international, markets [1], as agriculture is still a key component for the livelihood and sustainable development of these economies. Therefore, in order to gain competitiveness in the global markets, there is a need to enhance the productivity and efficiency of agricultural commodities along the whole value chain of agriculture-related industries [2,3].
Pakistan’s economy is transforming from traditional subsistence to a semi-industrialized well-integrated economy and is facing serious challenges in terms of growth over the last decade [4]. The agriculture sector was neglected in terms of policy for a long period of time. As a result, it showed a stagnant growth, created the threat of food security and on sustainable livelihoods of the farming communities [5]. Small scale farmers need socioeconomic, financial, and technical assistance to sustain farm families and agriculture absorbs 42% of the country’s total labor force [6].
Despite all these challenges, Pakistan is in the top ten countries in the world in producing different agricultural products, such as apricot, mango, dates, cotton, rice, onion, wheat, sugarcane, chickpea, milk, and meat. However, the huge potential and resources are not being utilized efficiently and that is why the agricultural growth rate is negligible. Pakistan’s agriculture is comprised of five major cash crops and livestock, but the transition towards high-value products needs time, taking into account the small landholding and success stories from the developing the world [7]. The Belt and Road Initiative provides a great opportunity and opens the European and Asian trade options.
Pakistan stands 6th in global apricot production, with an annual production of 178,957 tons in 2018 [8]. Although Pakistan is a leading producer of apricot, apricot has a negligible share in the country’s exports. Mostly, apricot is produced at small scales and used domestically or exported fresh without any sort of value addition. Trade in dried apricot is stagnating and the country exported 413 thousand tons of apricot in 2018, which is less compared to the last year. The export of perishable fruits is an immense challenge in the absence of adequate storage and transportation infrastructure [9]. Moreover, traditional methods of harvesting, processing (mostly sun-drying), cleaning, and sub-standard packing results in post-harvest fruit losses. As a result, farmers get minor returns and the situation is worsened given the inappropriate infrastructure and marketing system [9].
Gilgit-Baltistan (GB) and Chitral are the main apricot growing regions situated in the Himalayan range of Pakistan. The share of GB in apricot production is almost 67% of the total production of Pakistan [10]. This region is isolated, the population is small and dispersed, and harsh weather conditions prevail. Only one percent of the land area is cultivated, whereas the average farm size is less than one hectare in this region. Farming systems are subsistence and inefficient, but the apricot industry provides magnificent potential and still makes a significant contribution to on-farm incomes. Due to the high perishability of apricot and the distance from market, some of the harvests are dried on the farm and sold through wholesalers in auction markets down-country. A simple value chain map for apricot in GB and Chitral is given in Figure 1.
There are a lot of production, marketing, technical, and policy issues that restrict the apricot industry embellishment. Production issues are comprised of pest and disease attacks, small scale farming, inefficient input and output markets, poor quality of inputs, and the lack of technical skills [11]. The lack of a marketing and processing industry is the most important domain in the apricot value chain. Revenue generation from the sale of this fruit can be increased by reducing the massive post-harvest damage and poor quality, which results from traditional harvesting, drying, and handling methods, and by addressing the lack of proper processing facilities, marketing problems, and limitation of diverse improved varieties [12]. Part of the land where this fruit is cultivated is hard to access. Additionally, the attribute of the perishability of fruit, particularly in the case of apricot, adds to such losses. Resultantly, the export of fruits is a big challenge in the absence of an adequate storage and transportation infrastructure [13]. In a nutshell, traditional methods of harvesting, processing, and cleaning and non-hygienical packing results in post-harvest losses of half of the harvested fruit. As a result, farmers get minor returns and the situation is worsened given the inappropriate infrastructure and marketing system [14].
Due to the perishable nature of apricot, farmers choose to sell and/or export it in dried form. Pakistan exports dried apricot to Russia and China, which are the largest importers of it in the world. The China Pakistan Economic Corridor (CPEC) is being considered as a ‘game-changer’ in the region. It is a mega multi-dollar worth plan focused on building road, railway, and energy infrastructure. Pakistan can benefit from this route, which passes directly through the region of GB and Chitral, in the export of these precious fruits. Therefore, connectivity would enhance through the CPEC, not only within the country until the Gwadar port, but also to the huge market of China [15]. Partnership with China in the export of dried fruits can also be beneficial. Apricot seems to have great potential for export that will have a positive impact on the welfare of the local community and Pakistan’s economy overall [16].
Previous empirical literature studied different aspects of apricot-like physicochemical and nutritious features of various varieties of apricot [17], including the production of apricot juices through modern technology [18], the impact of processing on the functional value of dried apricot, energy and labour use for apricot in Turkey [19], food losses during production and processing of agriculture in France [20], a value chain analysis of agricultural commodities and its role in household food security and poverty [21], and an apple supply chain in Chitral [22]. To the best of our knowledge, empirical studies on the constraint analysis along the whole value chain of the apricot industry are scarce, especially in the context of the specific study area. Therefore, there is the need to carry out this study which, developed a framework that captured the constraints of all stakeholders of the apricot industry. This study also differs from the studies that captured the impact of apricot production on poverty reduction as it employs a propensity score matching (PSM) technique to account for selectivity bias.

2. Methodology

2.1. Data Collection
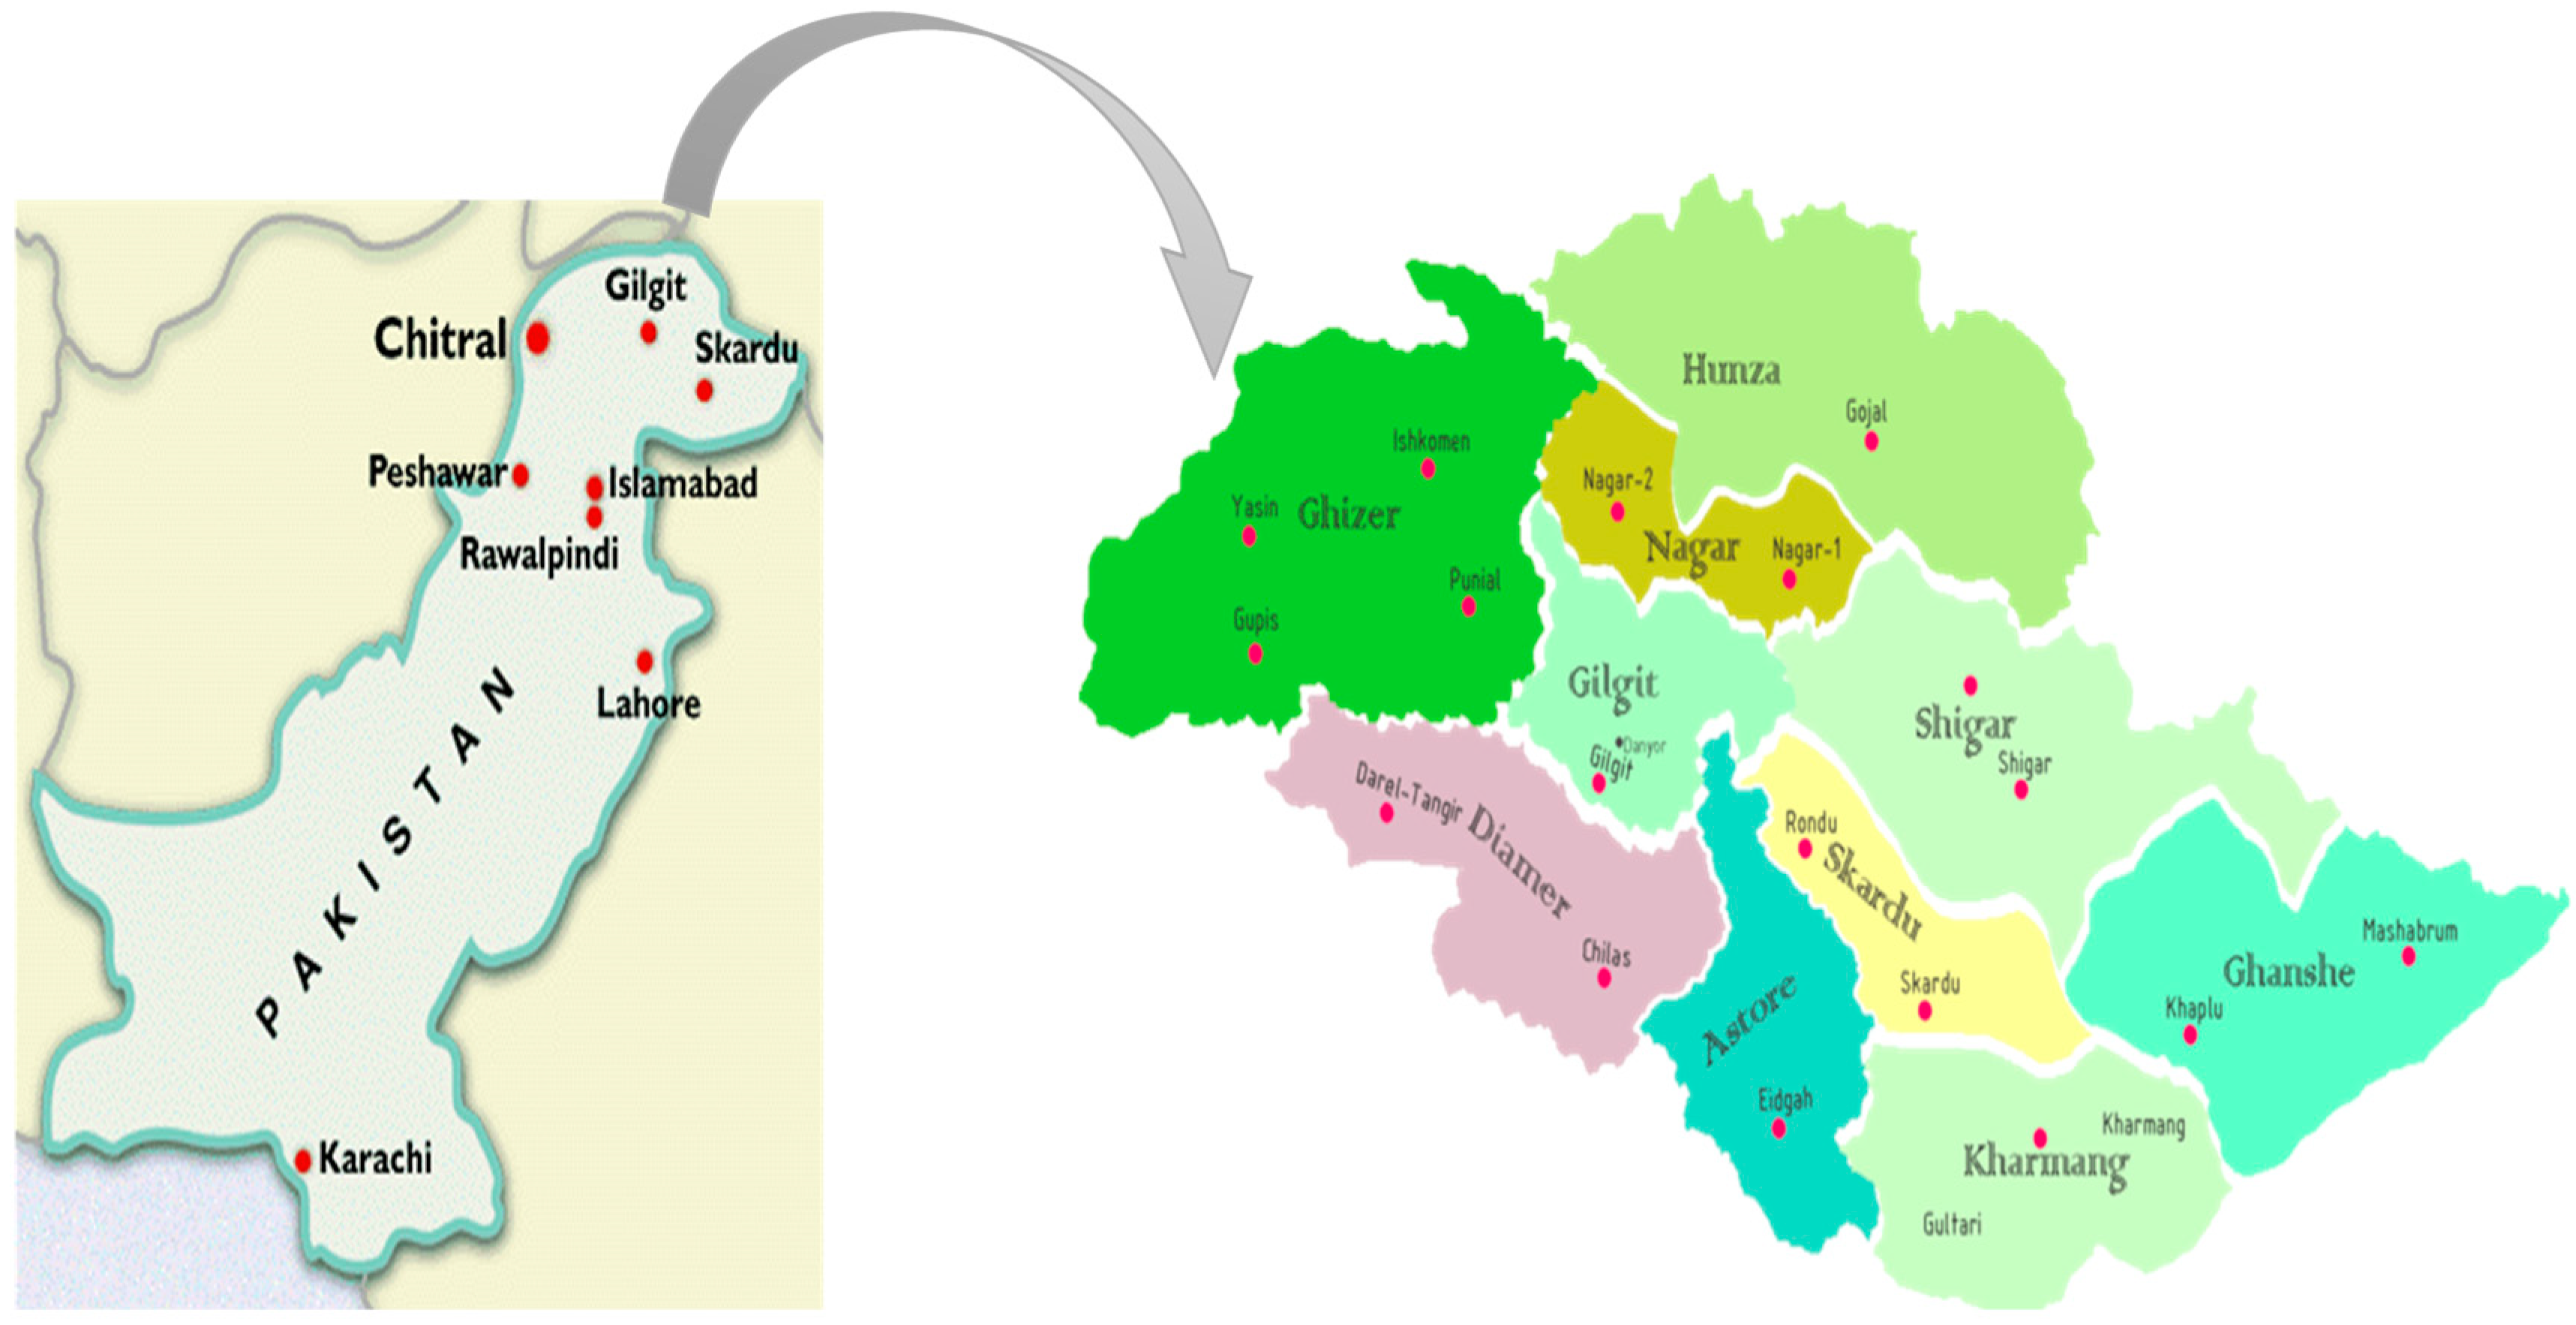
For this study, cross-sectional data were collected from apricot growers of the GB and Chitral regions in July–September 2018. Following Razzaq et al. and Naseer et al. [9,23], a multistage random sampling technique was used to collect the data. In the first stage, the Himalayan range of Pakistan was selected due to its importance in apricot production. In the second stage, the GB and Chitral regions were selected and, in the third stage, three major divisions from GB and one from Chitral, i.e., Gilgit, Baltistan, Astore, and Chitral were selected. Then, one district from each division, Sakardu, Hunza, Astore, and Chitral, was selected from each division for survey based on the highest apricot production. Respondents were selected randomly from each district, making a dataset of 200 apricot growers, and were interviewed through structured questionnaires to collect information regarding the constraints and issues of production, harvesting, handling, processing, and marketing of the apricot. The questionnaire included five-point Likert scale questions enabling respondents to report their opinions on various constraints. The constraints ranged from strongly disagree to strongly agree, based on the judgment of respondents about the bottlenecks or barriers from production to marketing of apricot. Intermediate constraints were classified as ‘neutral’.
Focus group discussions (FGDs) were conducted prior to the survey and the finalized questionnaire. Eight to ten respondents were selected for this purpose and four discussions. The research aims were explained to the respondents and these FGDs were around 90 to 120 min long. Prior to the data collection, the purpose of the research was described to the respondents and verbal consent was obtained from all the respondents. Participation in the survey was entirely voluntary. We assured participants of the anonymity and confidentiality of their responses. Data were collected by trained interviewers who were graduate students in agricultural economics.

2.2. Study Area

Nature has endowed the Himalayan range of Pakistan with high peaks and large glaciers concentrated in a relatively small radius. The livelihood of the people is largely subsistence-oriented due to small landholdings and limited market access. They grow wheat, fodder, and fruits on a small scale to support their household economy. Among fruits, apricot is primarily produced as a cash crop in this region. Similarly, the cultivated land of GB and Chitral is mostly comprised of slopes and valleys, which are scattered in distant areas. Farmers have smallholdings and mainly rely on food crops and some fruits. The location of the sampling districts of GB and Chitral is given in Figure 2.

2.3. Descriptive Analysis of Apricot Producer

FGDs were organized to establish the future research orientation, provision of facilities, formulation of the questionnaire, and to access socioeconomic conditions of farming families in the study area. Based on the received information, descriptive statistics of the important variables are given in Table 1. Due to social and cultural reasons, all the data were obtained from male respondents during the survey. The distance of the orchard from the main road varies from less than 1 km to 15 km and the average distance from the road is 9.9 km. The average age of the respondent was about 42 years (the range was from 20 years to 82 years), the average education was about 11 years, and the average experience of farming was 18 years. The income of the respondent shows high variation due to the disparity in the income class of apricot growers. The average household income was 56,210 rupees.
During the survey, it was observed that apple, apricot, grapes, cherries, and potato farming have a multifaceted socio-economic impact on upland farmers in the GB and Chitral regions of Pakistan. Farmers prioritize the production of apple and apricot due to favorable climatic factors. Apricot is produced by local farmhands at small scales and provides a livelihood to the low-income group, while apple production is mostly at the large and commercial scale.
Substantial opportunities are possible in the apricot processing industry to promote its products in this region. Table 2 presents the level of accessibility to different infrastructure facilities, as described by the respondents. During the focused group discussions, it was noted that more than 80 percent of the respondents claimed that there are substantial primary school education facilities available in their vicinity, but more than 50 percent claimed that higher education and a college education is not accessible. In the same way, proper input markets, output markets, and financial institutions are not easily accessible in these regions.

2.4. Empirical Specification

The present study includes two estimations, the first one is the constraint analysis of the apricot industry (from production to marketing) and the second one is the impact of apricot production on the poverty status of the households.

2.4.1. Constraint Analysis Through Principal Component Analysis

There was a large number of constraints along the whole value chain of apricot and apple that might complicate the data analysis. In order to identify the constraints, we employed factor analysis, i.e., principal component analysis (PCA), which minimizes the sum of the squared perpendicular distances to the axis of the principal component. PCA is a powerful data reduction technique that is used for this kind of constraint analysis [9]. It is used because constraints are highly correlated. It employs orthogonal conversion of a set of observations of possibly correlated variables into a set of values of linearly uncorrelated variables called principal components. It decomposes a correlation matrix with ones on the diagonal. The value of variance depends upon the number of observed variables, the sum of diagonals, or to the trace of the matrix.
The number of principal components is less than or equal to the number of observed variables in the analysis. The first principal component has the largest variance in the data, the second component has the second-largest amount of the variance and is uncorrelated (orthogonal) with the first component, and so on. The principal components are orthogonal as they are the eigenvectors of the covariance matrix, which is symmetric. Eigenvectors are the weights used to calculate component scores.

2.4.2. Impact Assessment Through Propensity Score Matching

A propensity score matching (PSM) technique was employed to estimate the causal effects of apricot production. It may reduce the bias when we make a comparison between the outcomes of treated and control groups with almost similar characteristics. It is the conditional probability of assigning a treatment, given pre-treatment characteristics [24], described as follows:
P ( X i ) = Pr ( L i = 1 | X i ) = E ( L i | X i )
where L = [0,1] is the indicator of exposure to treatment and X is the vector of pre-treatment characteristics. The parameter of interest is the average treatment effect on the treated (ATT), which can be estimated as follows:
A T T = E { E [ Y i 1 Y i 0 | L i = 1 , P ( X i ) ] } = E { E [ Y i 1 | L i = 1 , P ( X i ) ] E [ Y i 0 | L i = 0 , P ( X i ) ]   | | L i = 1 }
where Y i 1 and Y i 0 is the potential outcome in two counterfactual situations. The propensity scores are predicted with a probit or logit model. The predicted propensity scores are then used to estimate the treatment effect. The most commonly used are nearest neighbor matching (NNM), kernel-based matching (KBM), stratified matching, radius matching, and Mahalanobis matching methods. The NNM, radius, and KBM methods were employed in this study.
The headcount index was used as an indicator of household poverty status. The headcount index was calculated based on per capita income. The purchasing power parity (PPP) poverty line used in this study is $1.90 per day per person, as suggested by the World Bank (2018). Poverty outcome was measured as a binary variable.

3. Results and Discussion

3.1. Constraint Analysis

The collected data of 200 respondents were employed for constraint analysis. Table 3 depicts the mean ranking of constraints that hinder the growth of the apricot industry. It shows that constraints relating to marketing, finance, and processing are highly ranked. Variables related to production (such as small-sized farms, improved seedlings, lack of outreach) and infrastructure are ranked low as growth inhibitors of the apricot sector.
In order to confirm the appropriateness of PCA, a Bartlett test of sphericity (BTS) and a Kaiser–Meyer–Olkin (KMO) were employed in this study. Table 4 shows the value of BTS at 445.07 and its level of significance, which indicates that the data were appropriate for PCA. The value of KMO is 0.86, indicating that there are enough items for each factor. We have selected a total of 19 relevant variables for our analysis.
The objective of PCA is to find common factors, called principal components, in the form of linear combinations of the constraints under study and to rank them according to their importance. Table 5 shows the eigenvalues of the components. There are five components whose eigenvalue is greater than one and they account for 79.90% of the total variance. It is worth mentioning that only factors that have eigenvalues greater than one are retained. The plot of eigenvalues shows that only five factors are above the one eigenvalue (benchmark) and the rest are shown in Figure 3.
The eigenvalue of the first component is 6.99 and accounts for the variance of 36.82%. It is evident from Table 6 that the first component consists of five items. The constraints included in this component are poor infrastructure, certified seedlings, lack of on farm processing, research and development, and high cost of production. Poor infrastructure has the highest factor loading with a 0.46 value and other items include certified seedlings (0.35), lack of on farm processing (0.33), research and development (0.32), and the high cost of production (0.32). The sum of the factor loading of component 1 is 1.78 and the value of Cronbach’s alpha for this component is 0.788, indicating the reliability of the cluster. Component one is labelled as “Marketing”. In supply chain constraints, marketing is a very important component and is also discussed in previous literature [9].
The second component has an eigen value of 3.14 and a percent of variance of 16.5%. This component consists of five items, as follows: Incidents of disease/pest (0.38), small size of farm (0.36), lack of price incentive (0.34), spurious fungicides/pesticides (0.34), and the high cost of inputs (0.31). The sum of the factor loading of this component is 1.73 and the Cronbach’s alpha for this component yielded a value of 0.814, indicating the reliability of the cluster. This component is labeled as “Production”. In the study the producers are resource constraints in the form of farm size, inputs that hinder the growth of apricot industry.
The third component has an eigen value of 2.799 and percent of variance of 14.07%. This component comprises four items, as follows: Lack of cold storage (0.39), lack of drier (0.37), unavailability of packaging (0.34), and the lack of farm storage. The sum of the factor loading of this component is 1.38 and the Cronbach’s alpha for this component yielded a value of 0.768, indicating the reliability of the cluster. Component one is labelled as “Processing technology”. There is very limited investment in processing and storage technologies in order to develop a value addition for apricot in GB. Most constraints faced by the apricot sector are crosscutting and generic in nature, which indicate the overall performance of this sector.
The fourth component has an eigen value of 1.213 and percent of variance of 6.30%. This component comprises of three constraints. These constraints are subsidy for processing machinery (0.33), access to financial services (0.30), and the lack of import tax 0.30. The sum of the factor loading of this component is 0.93 and the value of Cronbach’s alpha for this component is 0.805, indicating the reliability of the cluster. Component three is called “Policy”. The absence of enabling policies favoring growers (particularly small farmers), contractors, wholesaler, traders, etc., impedes the ability of important stakeholders to attain maximum benefits they deserve.
The eigen value of last component is 1.03 and accounts for a variance of 5.40%. This component consists of two items. The constraints included in this component are the lack of outreach and the lack of technical know-how. The lack of outreach has the highest factor loading with a 0.29 value and the other item includes the lack of technical know-how at 0.27. The sum of the factor loading of this component is 0.56 and the value of Cronbach’s alpha for this component is 0.725, indicating the reliability of the cluster. Component one is called “Awareness”. This component is very important as this constraint usually increases the complexity of the marketing system on one hand and brings less return to the growers on the other hand. The cumulative variance of all five components is 79.90, which means that the underlying constraints in these five components account for 80% in the given data.
On the basis of the above empirical findings, the most important constraint is the marketing of the apricot, including infrastructure facilities, certified seedlings, processing facilities, research and development, and the transportation facilities. This is followed by production, processing technology, while the least important is the awareness level, which is an internal factor.

3.2. Impact of Apricot Production on Poverty Status of Households

The study used logistic regression techniques to estimate the impact of apricot production on household poverty status. The dependent variable in this case is the probability of being poor and it is represented as 1 = if poor and 0 otherwise. The results of the logistic regression analysis is presented in Table 7.
Results revealed that the coefficient of age is positive though not significant, and the coefficient of education indicates that a number of years of schooling seem to be a key factor to reduce the poverty level of the household. This is due to the fact that education improves the efficiencies of individuals for work. Similarly, the presence of the school in the locality tends to decline the poverty status of the household. These findings are in line with the theory of human capital development. Education positively adds to the human capital which ultimately helps in income-generating activities and promotes employment.
Households endowed with assets like land, house, and livestock are found to have a negative coefficient value of being poor, which means these have a positive and significant impact in reducing poverty. Households located far from the road face more poverty as compared to those with easy road access. This indicates that access to the road tends to reduce the transaction cost. It enhances the efficiency of farmers to access input and financial markets by the declining cost of information and transport. Social networks, like the farming group, and contact with the extension agents are vital for the function of all the activities through the whole supply chain of the apricot industry.

3.3. Impact of Apricot Production on Poverty Status of Households

The study also employed the propensity score matching (PSM) technique to check the robustness of logit results and to control the endogeneity problem. In PSM, the logit model was employed to predict the probability of adopting apricot, which is given in Appendix A. The adoption of apricot is a dummy treatment variable, 1 if farmer grows apricot and 0 if otherwise. The thorough interpretation of the propensity scores is not given here as they used to balance the observed distribution of covariates. The coefficient of age is negative and significant, which indicates that age does influence the likelihood of adopting apricot. Education, school, the farmer’s organization, and extension services tend to facilitate the adoption of apricot. Similarly, household assets like land, house, and livestock are found to have a positive and significant effect in adopting apricot. Households located far from the road adopt less as farmers face high transaction costs and less opportunities to market their produce.
The matching for all three matchings in Table 8 generally indicates that the area under apricot production exerts a negative and significant effect on the poverty status of the household. The estimated impact of apricot on poverty reduction as measured by the headcount index is estimated to range between −0.15 and −0.21, suggesting that the probability of being poor is lower for the participant in the apricot production by 0.15 to 0.21.
In addition, as presented in Table 8, the critical levels of gamma (Γ) are at which the causal inference of significant adoption effect may be questioned. Given that sensitivity analysis for insignificant effects is not meaningful, Rosenbaum bounds were calculated only for treatment effects which were found significantly different from zero [25]. For example, the value of 1.50 implies that if households that have the same X-vector, they differ in their odds of adoption by a factor of 50%. The lowest critical value of Γ is 1.30, whereas the largest critical value is 1.60. We can, therefore, conclude that even large amounts of unobserved heterogeneity would not alter the inference about the estimated effects, suggesting that the findings are generally insensitive to hidden bias.
The third and fourth columns in Table 8 present the pseudo-R2 from the propensity score estimation and from the re-estimation of the propensity score after matching on the matched samples. The likelihood-ratio test of the joint significance of all the regressors in the logit model of propensity score estimation before and after matching and their corresponding p-values are presented in the fifth and sixth columns of Table 8. The corresponding p-values of the likelihood-ratio test show that the joint significance of regressors on treatment status could always be rejected after matching. It was, however, never rejected before matching. The relatively low pseudo-R2 after matching and the p-values of the likelihood-ratio test of joint significance of the regressors imply that there is no systematic difference in the distribution of covariates between adopters and non-adopters after matching. The estimates show substantial bias reduction. Rosenbaum and Rubin [24] suggest that a remaining standardized bias of 20% would be advisable.

4. Conclusions and Policy Implications

Smallholders’ income can be raised by shifting them from subsistence and linking their products to better domestic and international markets. To access these markets, there is a need for identifying and overcoming the constraints along the whole value chain of agricultural commodities.
This study contributes to the literature by assessing the value chain and marketing issues of apricot in the Gilgit-Baltistan regions of Pakistan. In these areas, there is subsistence farming due to mountains and harsh weather conditions. Agricultural activities are largely confined to the production of fruits and some cereals. Among fruits, the most commonly cultivated are apricot, apple, grapes, cherry, pomegranate, peach, and almond, etc. Pakistan stands 6th in production of apricot, but there are several constraints in its whole value chain. There is a need to identify and give suggestions to overcome the main constraints for building the competitiveness of apricot in global markets.
Constraint analysis of the apricot industry was conducted by employing principal component analysis. The results of the constraint analysis of apricot show that there are five components whose eigenvalue is greater than one and they account for 79.90% of the total variance. These components were labeled as follows: “Awareness”, “Production”, “Policy”, “Marketing”, and “Production technology”. On the basis of the above empirical findings, the most important constraint to the growth of the apricot industry is awareness, which is an internal factor. This is followed by production, policy, and marketing constraints. The least important is processing technology. Overall, the findings revealed that the apricot subsector is poorly developed. The impact of the apricot subsector on the poverty status of the household was calculated by employing the propensity score matching technique. The results show that apricot production has a significantly positive impact on decreasing the poverty level of the household, depicting a great potential for the development of resilient livelihoods.
Based on the results, recommendations to improve the performance of apricot industry include the following:
  • There is a need to introduce, propagate, and distribute high yielding and drought and disease-resistant varieties of apricot and apple.
  • The government should also provide a cold chain to fruit producers in order to reduce post-harvest losses. There should be essential infrastructure facilities like farm to market roads, cold storage, and processing machinery.
  • Training of on-farm processing skills to apricot and apple growers.
  • The farming groups or cooperatives can also solve the constraint of technology by sharing the Internet and other latest technology among group members. This is the demand of time for creating self-sufficiency in the agriculture of northern areas.
  • There is a need for market security in the sense of price stability and access to the market. Government and NGOs are required to play an active part.
  • Enhance the export competitiveness by providing technical support and financial assistance to improve processing, packaging, and marketing. Special incentives and support might be given to the transport of these high value and perishable fruits.

Author Contributions

Conceptualization, R.K., J.N., and M.S.A.M.; methodology, R.K. and J.N.; software, R.K.; validation, M.A.u.R.N. and A.A.; formal analysis, R.K., J.N.; investigation, M.S.A.M. and A.A.; resources, R.K. and A.A.; data curation, M.A.u.R.N. and J.N.; writing—original draft preparation, R.K. and J.N.; writing—review and editing, M.A.u.R.N. and A.A.; visualization, J.N.; supervision, R.K.; project administration, R.K.; funding acquisition, R.K. and A.A.

Funding

Punjab Agricultural Research Board, PARB No. 967 and US-Pakistan Center for Advance studies in Agriculture and Food Security, University of Agriculture Faisalabad, Pakistan.

Acknowledgments

The authors would like to acknowledge the data collection team and the respondents for their valuable time.

Conflicts of Interest

The authors declare no conflict of interest.

Appendix A

Table A1. Logit model results to predict the probability of adopting apricot production.
Dependent/Treatment Variable: Adoption of Apricot Production
VariablesDescription of VariablesCoefficients
AgeAge of the household head in years−0.002 *
Familytype0 joint, 1 nuclear0.029
EducationYears of education of HH head0.138 **
OwnlandOwnership of farmland in Kanals0.059 *
House0 if house is Own, 1 rented0.361
AnimalsNumber of livestock animals 0.455
DisroadDistance of household from the main road (Km)−0.001 *
School1 if village has school, 0 otherwise0.475 *
FarmerOrg1 if village has farmer’s organization, 0 otherwise1.167 *
Extension1 if farmer has contact to extension agent, 0 otherwise0.958
OutMarket1 if village has output market, 0 otherwise1.233 *
Location1 if GB, 0 if resides in Chitral−0.011
_constantIntercept−0.215 *
Pseudo R20.165
Log likelihood−209.187
Number of observations300
* and ** shows the level of significance at 10% and 5% respectively.

References

  1. Boccia, F.; Covino, D.; Sarnacchiaro, P. Genetically modified food versus knowledge and fear: A Noumenic approach for consumer behaviour. Food Res. Int. 2018, 111, 682–688. [Google Scholar] [CrossRef] [PubMed]
  2. Guritno, A.D. Agriculture Value Chain as an Alternative to Increase Better Income’s Distribution: The Case of Indonesia. In Agricultural Value Chain; IntechOpen: London, UK, 2017. [Google Scholar]
  3. Naseer, M.A.U.R.; Ashfaq, M.; Hassan, S.; Adil, S.A.; Ariyawardana, A. Outlook on the global trade competitiveness of Pakistan’s mandarin industry: An application of revealed symmetric comparative advantage framework. Outlook Agric. 2019, 48, 66–74. [Google Scholar] [CrossRef]
  4. Braunstein, E.; Houston, M. Pathways Towards Sustainability in the Context of Globalization; Routledge in Association with GSE Research: Abingdon, UK, 2016. [Google Scholar] [CrossRef]
  5. Deshpande, R.S.; Prachitha, J.; Shaha, K. Making of State Agricultural Policy: A Demonstration. In Issues in Indian Public Policies; Annigeri, V.B., Deshpande, R.S., Dholakia, R., Eds.; Springer Singapore: Singapore, 2018; pp. 37–82. [Google Scholar] [CrossRef]
  6. Khan, I.A.; Khan, M.S. Developing Sustainable Agriculture in Pakistan; CRC Press: Boca Raton, FL, USA, 2018. [Google Scholar]
  7. Naseer, M.A.U.R.; Mehdi, M.; Ashfaq, M.; Hassan, S.; Abid, M. Effect of marketing channel choice on the profitability of citrus farmers: Evidence form Punjab-Pakistan. Pak. J. Agric. Sci. 2019, 56, 1–9. [Google Scholar] [CrossRef]
  8. FAO. Crops. Production Quanitites of Apple bu Country. Food and Agriculture Organization; United Nations: Rome, Italy, 2018. [Google Scholar]
  9. Naseer, M.A.U.R.; Ashfaq, M.; Hassan, S.; Abbas, A.; Razzaq, A.; Mehdi, M.; Ariyawardana, A.; Anwar, M. Critical Issues at the Upstream Level in Sustainable Supply Chain Management of Agri-Food Industries: Evidence from Pakistan’s Citrus Industry. Sustainability 2019, 11, 1326. [Google Scholar] [CrossRef]
  10. GOP. Northern Area Agriculture Statistics 2015-16. Pakistan Bureau of Statistics; Statistical Division: Islamabad, Pakistan, 2016. [Google Scholar]
  11. Abbas, A. First Report of Gummosis Disease of Major Fruits in Gilgit-Baltistan (GB) Pakistan. Int. J. Life. Sci. Sci. Res. 2018, 4, 1805–1809. [Google Scholar] [CrossRef]
  12. Hussian, N.; Shahnawaz, M.; Abbas, Y.; Ali, N.; Abbas, T.; Ullah, S.; Ali, A.; Hussain, A. Physio-Chemical and Sensorial Quality Evaluation of Commercially Available Dried Apricots of Gilgit Baltistan, Pakistan. J. Food Nutr. Sci. 2015, 3, 216–222. [Google Scholar] [CrossRef]
  13. Hussain, S.; Hussain, E.; Partap, U. Strategies for Apricot Value Chain Development in Chitral, Pakistan; International Centre for Integrated Mountain Development (ICIMOD): Rome, Italy, 2017. [Google Scholar]
  14. Olwande, J.; Smale, M.; Mathenge, M.K.; Place, F.; Mithöfer, D. Agricultural marketing by smallholders in Kenya: A comparison of maize, kale and dairy. Food Policy 2015, 52, 22–32. [Google Scholar] [CrossRef]
  15. Abid, M.; Ashfaq, A. CPEC: Challenges and opportunities for Pakistan. J. Pak. Vis. 2015, 16, 142–169. [Google Scholar]
  16. Chen, X.; Joseph, S.; Tariq, H. Betting Big on CPEC; The European Financial Review | Empowering Communication Globally: London, UK, 2018. [Google Scholar]
  17. Ali, S.; Masud, T.; Abbasi, K.S. Physico-chemical characteristics of apricot (Prunus armeniaca L.) grown in Northern Areas of Pakistan. Sci. Hortic. 2011, 130, 386–392. [Google Scholar] [CrossRef]
  18. Aider, M.; de Halleux, D. Production of concentrated cherry and apricot juices by cryoconcentration technology. LWT Food Sci. Technol. 2008, 41, 1768–1775. [Google Scholar] [CrossRef]
  19. Gezer, I.; Acaroǧlu, M.; Haciseferoǧullari, H. Use of energy and labour in apricot agriculture in Turkey. Biomass Bioenergy 2003, 24, 215–219. [Google Scholar] [CrossRef]
  20. Redlingshöfer, B.; Coudurier, B.; Georget, M. Quantifying food loss during primary production and processing in France. J. Clean. Prod. 2017, 164, 703–714. [Google Scholar] [CrossRef]
  21. Kumar, A.; Singh, H.; Kumar, S.; Mittal, S. Value chains of agricultural commodities and their role in food security and poverty alleviation-A synthesis. Agric. Econ. Res. Rev. 2011, 24, 169–181. [Google Scholar]
  22. Khan, M.; Bae, J.H. The Environmental Perspectives of Apple Fruit Supply Chain Management in Chitral, Northern Pakistan. Int. J. Supply Chain Manag. 2017, 6, 1. [Google Scholar]
  23. Razzaq, A.; Qing, P.; Naseer, M.A.U.R.; Abid, M.; Anwar, M.; Javed, I. Can the informal groundwater markets improve water use efficiency and equity? Evidence from a semi-arid region of Pakistan. Sci. Total Environ. 2019, 666, 849–857. [Google Scholar] [CrossRef] [PubMed]
  24. Rosenbaum, P.R.; Rubin, D.B. Constructing a control group using multivariate matched sampling methods that incorporate the propensity score. Am. Stat. 1985, 39, 33–38. [Google Scholar]
  25. Hujer, R.; Caliendo, M.; Thomsen, S.L. New evidence on the effects of job creation schemes in Germany—A matching approach with threefold heterogeneity. Res. Econ. 2004, 58, 257–302. [Google Scholar] [CrossRef]
Figure 1. Apricot value chain map in upland areas of Pakistan.
Sustainability 11 04482 g001
Figure 2. Study area map.
Sustainability 11 04482 g002
Figure 3. Scree plot of eigenvalues after PCA.
Sustainability 11 04482 g003
Table 1. Descriptive statistics of important variables.
IndicatorApricot Producers
MinimumMaximumAverageStandard Deviation
Distance from Main Road (km)<1159.952.6
Age (Years)208241.915.4
Education (Years)0.01610.645
Experience (Years)1.06017.914.1
Income (Rupees)1700.080,00056,210.3215,631.1
No. of trees1.0350.044.954.1
Table 2. Level of accessibility of different infrastructure facilities.
IndicatorLevel of AccessibilityDescription
Road AccessLowThe access to the road is not up to mark in most of the areas
Primary EducationHighSchools are present in the area and there are fewer problems for primary school education
Secondary EducationMediumSecondary education is not in the access of everyone because of the long-distance and lack of transportation
Financial ServicesLowFinancial services lack in agricultural sector especially for smallholders
Health FacilitiesLowHealth facilities are not easily accessible
Extension FacilitiesMediumExtension workers visit the growers frequently and have impacts on local growers
Intermediaries (dealers)HighGrowers rely heavily on input dealers for seed, fertilizers, pesticide, and information.
Farmer OrganizationLowFarmer organizations are not active in the region.
Service ProviderLowAt small farming scale, the farm services like processing, packaging, and transportation are not available
CPEC knowledgeHighCommunity is aware of the present scenario of infrastructure development in the region and responds positively
Table 3. Mean ranking of constraints in the apricot industry.
VariableMeanStd. DevMinMax
Lack of cold storage4.670.86815
High cost of transport4.630.71015
Access to financial services4.540.65815
Lack of farm storage4.540.77915
Lack of on-farm processing4.290.80615
High cost of inputs4.210.93115
Subsidy for processing machinery4.211.35015
Fungicides/pesticides4.121.11515
Unavailability of packaging4.041.12215
Lack of price incentive4.01.02115
Incidents of disease/pest3.911.31615
Research and Development3.791.61415
Lack of technical know-how3.711.54515
Lack of import tax3.691.57915
Small farm2.671.20415
Lack of outreach2.671.68515
Certified seedling2.621.63615
Lack of drier2.371.55515
Poor infrastructure (road + transport)2.291.74415
Table 4. Bartlett test of sphericity (BTS) and Kaiser–Meyer–Olkin (KMO).
Bartlett Test of Sphericity Approx. (Chi-Square)0.86
Kaiser–Meyer–Olkin test for sampling adequacy445.07
Df201
Sign0.001
Table 5. Total variance explained by PCA for apricot.
ComponentEigenvalueDifferenceProportionCumulative
16.9953.850.3680.3682
23.1410.340.1650.5335
32.7991.580.1470.6808
41.2130.180.0630.7447
51.0320.160.0540.7990
60.8680.1250.0450.8447
70.7420.0940.0340.8838
80.6480.1740.034 0.9179
90.4730.0840.0240.9429
100.3900.1360.0200.9634
110.2530.0870.0130.9767
120.1660.0480.0080.9855
130.1170.0490.0060.9917
140.0680.0360.0030.9953
150.0330.0040.0020.9970
160.0280.0060.0010.9985
170.0210.0130.0010.9996
180.0080.0070.0001.0000
190.0000.0000.0001.0000
Table 6. Rotated component matrix.
ConstraintsComponentsLabeling
(Sum of Factor Loading)
12345
Poor infrastructure0.46 Marketing
(1.78)
Certified seedling0.35
Lack of on-farm processing0.33
Research and Development0.32
The high cost of transport0.32
Incidents of disease/pest 0.38 Production
(1.73)
The small size of the farm 0.36
Lack of price incentive 0.34
Spurious fungicides/pesticides 0.34
The high cost of inputs 0.31
Lack of cold storage 0.39 Processing technology
(1.38)
Lack of drier 0.37
Unavailability of packaging 0.34
Lack of farm storage 0.28
Subsidy for processing machinery 0.33 Policy
(0.93)
Access to financial services 0.30
Lack of import tax 0.30
Lack of outreach 0.29Awareness
(0.56)
Lack of technical know-how 0.27
Table 7. Results of the logistic regression (probability of being poor).
VariablesDescription of VariablesCoefficientsZ-ValueStd. Dev.
AgeAge of the household head in years0.0160.920.016
Familytype0 joint, 1 nuclear−1.031 *−1.730.597
EducationYears of education of HH head −0.107 *1.920.056
OwnlandOwnership of farmland in Kanals−0.071 *−1.690.044
House0 if house is Own, 1 rented−0.610−1.210.503
AnimalsNumber of livestock animals −0.078 **2.12
DisroadDistance of household from the main road (Km)−0.122 *−1.850.066
School1 if village has school, 0 otherwise−0.255−0.330.762
FarmerOrg1 if village has farmer’s organization, 0 otherwise−1.432 **2.300.622
Extension1 if farmer has contact to extension agent, 0 otherwise−1.158 *−1.780.652
AreaApriCultivated area for apricot in marlas−0.002 **−2.420.002
Location1 if GB, 0 if resides in rural0.0100.020.610
OutMarket1 if village has output market, 0 otherwise−0.3510.650.540
_constantIntercept0.0510.041.419
Pseudo R20.1859
Log likelihood−49.187
Number of observations200
* and ** shows the level of significance at 10% and 5% respectively.
Table 8. Indicators of matching quality before and after matching.
MatchingOutcome VariablePseudo-R2p-ValueMedian Absolute Bias% Bias Reduction
UnmatchedMatchedUnmatchedMatchedUnmatchedMatched
NNMHeadcount0.1220.0200.0000.98719.34.374.62
RadiusHeadcount0.2120.0190.0000.88215.35.066.34
KBMHeadcount0.1120.0390.0000.72914.35.659.94

