Perceived Danger and Landscape Preferences of Walking Paths with Trees and Shrubs by Women


1
Institute of Landscape Architecture, Wrocław University of Environmental and Life Sciences, Grunwaldzka 55, 50-357 Wrocław, Poland
2
Horticulture & Landscape College, Hunan Agricultural University, Changsha 410000, China
3
Faculty of Environmental and Civil Engineering, Latvia University of Life Sciences and Technologies, Lielā iela 2, LV-3001 Jelgava, Latvia
4
Institute of Psychology, University of Gdańsk, Jana Bażyńskiego 4, 80-309 Gdańsk, Poland
*
Author to whom correspondence should be addressed.
Sustainability 2019, 11(17), 4565; https://doi.org/10.3390/su11174565
Submission received: 20 June 2019
/
Revised: 17 August 2019
/
Accepted: 19 August 2019
/
Published: 22 August 2019
(This article belongs to the Special Issue Urban Green Spaces, Urban Forestry, Health and Wellbeing, Planning and Governance)
Abstract
:There have been many studies on the impact of urban greenery on perceived danger and preferences, but not many have been conducted in non-English speaking countries. We carried out our research among female university students in Poland, Latvia and China (n = 243), using a photograph rating survey instrument, and presenting slides presenting park landscapes. We compared the impact of the presence of trees and shrubs and their capability of offering concealment, as well as perceived space use intensity on perceived danger and preferences in all three countries. Participants rated the presence of shrubs as a more positive influence on path use intensity and as a negative influence on perceived danger. The link between tree presence and perceived danger in Poland and Latvia is small as well as insignificant in China. In addition, perceived danger turned out to be a mediator of the relations between the presence of trees and shrubs and perceived path use intensity and preference. Our findings support the idea that vegetation in parks could be shaped so that it does not provide place to hide. However, this recommendation is primarily applicable to areas in which the variable ‘perceived danger’ is of importance.
1. Introduction
A number of studies have shown the positive impact of greenery on reducing the crime rate [1,2,3] and boosting perceived safety [4,5,6]. In contrast, many studies have shown the influence of greenery on perceived danger and fear of violence [7,8,9,10,11]. This is mainly due to the fact that high plant forms (trees and shrubs) can provide concealment for offenders and potentially block the view, thus making it difficult to assess the situation and preventing a potential attacker from being seen from afar [12,13,14,15]. Trees and shrubs also limit contact with the environment and so reduce social control [15,16]. As a result, fear of crime and perceived danger mean that fewer people make use of green spaces and other areas that contain greenery [12,17,18]. This problem affects society as a whole but is more of a concern for women than for men. Gender is one of the most frequently studied demographic variables affecting fear of crime and perceived danger [9,19,20,21,22,23]. It has been confirmed again and again that women in dangerous situations experience a higher level of fear and/or have a stronger perception of threat than men [9,10,20,24,25,26,27,28]. This leads to patterns of behavior related to the avoidance of dangerous areas, including city parks [22,29,30]. Women are afraid of walking through green areas especially after dark [19].
Women, more so than men, as a social group are more sensitive to spatial conditions that evoke fear and react more strongly to it. Hence, the presence of dangerous areas limits the potential benefits to urban areas to a greater extent. That is why our research, as well as other studies on the problem of fear and danger [10,23,31,32,33] was conducted among this group. Fear of crime or concerns about personal safety in urban green spaces crop up again and again in research. Maruthaveeran and Konijnendijk van den Bosch [29] enumerated 48 journal articles on this topic. According to Mak and Jim [34], from 2013 to October 2017, 32 articles were added to the literature. However, most were conducted in European and North American environments. Not much research has been carried out in Asia, [21,23,29,35,36,37,38,39,40] or Central and Eastern Europe [41,42]—in other words, the areas involved in our research.
However, cross-cultural studies on landscape perception with regard to perceived danger or fear in urban green spaces are rare. Those that exist include an article by Wang and Taylor [43], which dealt with perceptions of safety in alleyways. The studies included both Chinese-born and US-born respondents, and the impacts of these individual differences were explored. Therefore, it is unclear whether their findings extend to individuals who live in different countries or are from different cultural backgrounds. Our research aims to fill this gap by focusing on the influence of trees and shrubs in the city on sense of danger and women’s landscape preferences. We compared the results obtained in three countries—Poland, Latvia and China.
Currently, in order to increase the safety of urban areas, it is often recommended to remove plant forms that influence the threat—shrubs in particular [2,44,45]. Greenery is extremely important for residents, fulfilling a complex role. Urban green areas, among others, are conducive to recreational and physical activity [5], building social ties [46,47,48], lowering stress, reducing caution [49,50,51,52], enhancing the perception of health reported by those living nearby [53]. They also fulfil important functions in relation to other aspects of physical health, including shelter from oppressive heat as well as the regulation of air and water pollution [27,54,55]. This applies not only to expansive parks and woodlands but also to trees outside woods [56]. You can look at city greenery using the ecosystem services (ES) and ecosystem disservices (ED) framework [57,58,59]. Green spaces provide many benefits for people but can also incur various costs and losses (maintenance, allergies, litter, damage to buildings or roads, the attraction of unwanted wildlife [59], as well as a lack of objective or subjective safety. Individuals avoiding urban green spaces due to the lack of objective or perceived safety will lose the potential benefits of using these areas. It is important that the green areas are designed in a way that minimizes costs and losses (ED) while at the same time maximizing the potential benefits (ES) that may positively influence our overall well-being. Therefore, the removal of greenery, including shrubs of great significance for biodiversity, should be undertaken with caution. Further research is needed to explain how and why trees and shrubs affect our preferences and the role played by the sense of danger that they evoke. We can assume that these two factors—sense of danger and preferences—are interrelated. The evaluation of preferences is partly due to perceived danger. In other words, trees and shrubs that have a positive effect on the assessment of space may spoil this evaluation in a situation that evokes a sense of danger for other reasons (hot-spots of crime or fear, in remote areas, deprived of social control, etc.). Therefore, in addition to the studies comparing the influence of trees and shrubs on perceived danger in three countries, we studied the role that sense of danger plays in the assessment of a landscape. For this purpose, we applied analyses of intermediary effects, where perceived danger is a mediator of the relationships between the presence of trees and shrubs and preference, as well as perceived path use intensity and preference. It should be noted that in studies on this issue, mediation models are rarely applied, although they are helpful in understanding the phenomena [41,42,60].
2. Literature Review
2.1. Influence of Plant Forms on Perceived Danger
There are two dimensions to safety: objective safety and subjective (personal) safety [61]. Objective safety is measured by facts and figures and refers to the real risk associated with actual crime, risk, safety or security. Subjective safety refers to emotions experienced by the individual (e.g., fear of crime, perceived safety, perceived risk, perceived threat) [21] though shaped in a broader context, resulting from social conditions as well as personal experience. Fear of crime is a broader concept than perceived safety/risk/danger and refers not only to an emotional assessment of security but also to more diverse emotions including anxiety, depression, and social avoidance [17]. On the other hand, the concept of perceived risk/danger has a stronger reference to the situation, is more precise in its operational definition, facilitates the analysis of results in relation to human behavior, and provides specific information that might help resolve the problem [62]. Hence, the concept of perceived risk/danger is often used in research [62,63]. In this paper, we are also concerned with this dimension of safety (perceived danger). We believe, as some [5], that in terms of behavioral constraints, it is subjective safety that influences behavior and causes people to avoid places they associate with danger.
A number of studies have examined the impact of vegetation on the level of crime and anti-social behavior (safety was judged objectively). Their results, however, are unambiguous. Many researchers have stated that dense vegetation provides a meeting point for criminals [44] and creates circumstances that facilitate criminal acts [64,65,66]. But there are also studies that yielded different results. Donovan and Prestemon [1] stated, for example, that the relationship between crime and trees is not cut and dried. Trees with a low-set, view-obstructing crown caused an increase in crime, while high trees lowered it. Kuo and Sullivan [2] studied the effect of vegetation on crime in apartment buildings and found that widely spaced, high-canopy trees were associated with less violent crime and property crime. This was supported by other researchers [67,68,69]. Troy et al. [3], investigating the extent to which urban tree cover influences crime stated that generally there was a negative correlation between crime and trees. In turn, Escobedo et al. [59] considered that although fewer homicides occurred in public tree-scapes with taller trees and higher tree density, the amount of public green areas was not significantly related to homicide levels. As one might observe, research on the impact of greenery on objective safety indicators yields ambiguous results. In addition, these studies are fairly difficult to conduct due to the frequent lack of sufficiently accurate and reliable data [70]. For example, Lis et al. [71] in their research on Sobieski Park in Wałbrzych found, on the basis of questionnaires submitted by park users, a high level of criminal acts of various kinds. These results were divergent with the police data, which registered a small amount.
Numerous studies have dealt with the influence of space in terms of perceived fear or danger (subjective safety). Wang and Taylor [43] divided such studies into four groups. They cover various sets of physical factors affecting fear: (1) physical incivilities (abandoned houses, vacant lots, abandoned cars, graffiti, and trash); (2) the absence of cues of upkeep and local involvement; (3) specific types of land use; and (4) a cluster of specific micro-level design and landscape factors. The latter group includes above all factors that are part of the Nasar/Fisher model [12,45]. The model was built on Appleton’s prospect-refuge theory [72,73]. Fisher and Nasar [12] conducted pioneering research on the impact of environmental conditions in the university campus in relation to the proximate features of a place on perceived safety in relation to three factors—prospect, refuge and escape. The latter, defining the possibility and ease of a victim’s escape, supplemented the characterization of a situation in which a potential victim may find him or herself. The results showed that these factors significantly influence perceived safety—students feel less safe in areas with high concealment, limited prospect, and blocked escape. It has been used as the basis for many studies [24,33,41,43,74,75,76,77,78].
However, most of them were concerned with urban settings, in which greenery played a marginal role. Prospect and its derivatives are the most frequently examined attributes in green spaces. Among others, visibility [79,80], openness [13,81], spaciousness [82] and visual access [83,84] have been explored. Apart from the attributes listed above, the impact of various forms of greenery on the sense of danger and fear were studied and compared. It was confirmed that the sense of security is influenced by trees and shrubs [7,42], the specific spatial structures that trees and shrubs create, especially dense understory vegetation or a high density of trees [8,9,11,21,61,85] as well as specific types of vegetation, in particular naturalistic, dense vegetation [9,27].
Researchers [15,16,42] draw attention to how plants in a park can function as hiding places. They can be used to conceal a potential attacker [12,13,14,15]. The studies by Lis et al. [42] indicate a very significant correlation (r = 0.90) between the hiding place (and specifically a plant feature referred to as ‘effectiveness of concealment’) and perceived danger. These researchers believe that of the Nasar/Fisher model’s three attributes, refuge (concealment) is the attribute most strongly associated with plants. It is also relevant that trees and shrubs provide concealment even in single units that are not part of a group. The other two attributes (escape and prospect) are characteristic of spatial systems. Therefore, in order to study the influence of trees and shrubs on perceived danger, we also focused our research on the features of plants that make vegetation a good hiding place for a potential attacker.
2.2. Preferences and Perceived Danger in Green Spaces
Landscape preference is a measure of the extent to which people “like” the appearance of a landscape [86]. It is a frequently used framework for investigating human perception and how they relate to a particular landscape [87]. The dominant method of research used for establishing landscape preference is the ranking or rating of images on a Likert scale [51]. The basic question is how much someone likes the landscape presented [13,88].
As pointed out by Lis et al. [42], based on the present state of our knowledge, it is difficult to predict whether there will be a positive or negative association between the presence of trees and shrubs on the one hand and preference on the other. This is because the theory is not unambiguous. Numerous studies have demonstrated a positive impact of greenery on preferences [51,52,89]. At the same time, however, the same greenery increases perceived danger and/or fear of crime [2,45]. On the other hand, studies have shown negative associations between preferences and perceived danger [24,88]. It was also confirmed that people express preferences for landscapes that do not contain concealment and view obstructions [60,83,90]. The classic studies by Kaplan and Kaplan [51] which compared preferences towards various forms of landscape showed that the strongest preferences were declared in respect of landscapes with trees located in grassy areas. The lowest preferences were expressed for—apart from monotonous, unvaried landscapes—settings with dense, vision-obscuring vegetation. Similar preference study results indicating that people like open spaces with trees or surrounded by forest have been obtained by other researchers [51,91,92,93]. On one level, shrubs and trees with low crowns contribute to a spatial variation of the landscape. They arouse our interest with elements of surprise and mystery. These characteristics constitute a positive preferential aspect, indicated both in studies and scientific theories. Examples include surprisingness from Berlyne’s [94] aesthetics model and mystery from the Kaplan and Kaplan [51,95] preference model. This paradoxical role of plants—shrubs in particular—is emphasized by, for instance, Andrews and Gatersleben [79] and Lis et al. [15].
Taking the above into consideration, we did not make any assumptions as to whether the presence of trees or shrubs has a negative or positive influence on preferences.
2.3. The Impact of Extra-Spatial Factors on Perceived Danger
Research based on the Nasar/Fisher model has indicated that the presence of spatial forms that provide concealment, limited prospect and blocked escape routes may increase fear of crime and perceived danger even in the absence of a potential criminal [12,33,74,76,77,78]. However, the impact of such forms depends on the characteristics of the environment in which they are found. Hot spots of crime or fear [16,42,96] cause stronger reactions related to perceived danger and fear than areas located in the safer areas of a particular town.
Perceived danger in parks also results from small-scale features called “cues” [97] or “proximate cues to fear” [14]. These include both spatial forms, and extra-spatial factors—e.g., the presence of people nearby, the state of maintenance, the time of the day or lighting [12]. All such factors affect how space is perceived and how intensely danger is experienced. As pointed out by Nasar et al. [14], concealment and prospect can influence perceptions of safety, but first, the conditions for general fear—an area of high crime or danger, incivilities, darkness, et cetera—must be present.
Our study was designed to check the influence of one of the major extra-spatial factors—how the presence of people affects the perceived level of social control. Many theories, particularly the early ones, which dealt with the influence of space on safety, referred to the phenomenon of social control. Jane Jacobs, (1961) [98] describes the ‘eyes on the street’ effect, which constitutes a characteristic element of a busy urban street. A street is safe thanks to the presence of many people exercising informal supervision. The role performed by informal supervision is also emphasized by Oscar Newman, (1972) [99] in his defensible space theory. The phenomenon of social control is used as the basis of a strategy and recommendations relating to the design of safe spaces, in particular a crime prevention through environmental design (CPTED) strategy [100,101]. Many studies have confirmed the fact that perpetrators avoid areas with greater surveillance and likelihood of intervention, and anywhere they can be observed [102,103,104,105]. Therefore, as Kuo [106] suggests, green areas that attract people and, as a result, create an informal system of surveillance [2], decrease crime. The effect of enhanced safety can be caused not only by the presence of people but by spatial indicators of this presence, such as the level of maintenance, equipment, etc. that act as a territorial marker [107].
Considering the importance of this factor, we set out to identify what influence social control has on perceived danger. Because of the difficulty involved in manipulating complex factors that impact the level of social control, we limited its operationalization to the visual indicators of the likelihood of encountering human beings in the surroundings. Such a likelihood is connected in particular to how much the path is used. We believe that a space regarded as frequently visited and used by many will be perceived as less dangerous than a deserted space. This elicits a positive impact on preferences.
3. Research Aims
We assumed preference and danger as our target variables, while our predictor variables were the presence of trees, the presence of shrubs, the effectiveness of concealment and the perceived intensity of path use. By ‘effectiveness of concealment’ we mean the characteristics of shrubs and trees that determine their effectiveness as a potential hiding place for a person or a group of people. By ‘perceived intensity of path use’ we understand the features of space that indicate the likelihood that other people will appear in it.
As we studied the relationships between the variables, we were guided in particular by two main research questions. The first referred to the influence of predictor variables (the presence/absence of trees, the presence/absence of shrubs, effectiveness of concealment, perceived intensity of path use) on perceived danger. We wanted to check if such an influence would emerge in the respondents’ evaluations from the three countries surveyed (Poland, Latvia and China). In addition, we wanted to compare the results from three countries and check whether the relationships uncovered have a similar strength and the same sign.
Our detailed hypothesis regarding this research question was:
Hypothesis 1.
The perception of danger of a person walking along a path is influenced by: (H1a) the properties of the nearby trees or shrubs that provide a potential hiding place for a person or a group of persons (‘effectiveness of concealment’) and how busy the path is perceived to be; (H1b) the presence of trees or shrubs near the path. Perceived danger is negatively correlated with path use intensity and positively with effectiveness of concealment and the presence of trees or shrubs.
The second research question focused on the role of perceived danger in the evaluation of preference. We wanted to check if the presence/absence of trees and shrubs and perceived space use intensity influence preference and what role is played by perceived danger in this relationship. In other words, we wish to know if perceived danger explains the effect of predictor variables on preferences.
Our detailed hypotheses regarding this research question were:
Hypothesis 2.
The presence of trees or shrubs in areas with a high-crime-rate influences preferences, and this can be explained by perceived danger (the sense of danger acts as a mediator for the relationship between the presence of trees or shrubs and preference).
Hypothesis 3.
Perceived path use intensity has a positive effect on preferences, and this can be explained by perceived danger (the sense of danger acts as a mediator for the relationship between path use and preference). The first hypothesis (H1), which describes the direct relationships between the variables, was tested with the study group split into the three countries. The other two hypotheses (H2 and H3), which describe indirect relationships, were tested using the entire study group together. Table S1 presents the schematic character of the relationships studied with reference to the research questions and specific hypotheses.
4. Method
4.1. Design
We conducted the study using a questionnaire survey, with our own photos of landscapes taken in urban green spaces. The respondents assessed them by means a five-point scale. Each respondent answered four questions, each of which measured a different variable.
Our sample included three groups of women from different countries—Poland, Latvia and China. All three groups were comparable in terms of age and educational status (the research focused on female university students). The respondents assessed the same set of settings (18 slides). The slides depicted typical urban green spaces (photos taken in Poland).
4.2. Participants
The sample consisted of 243 female university students from three countries: 80 from Poland, 83 from Latvia and 80 from China The group from Poland consisted of students from Wrocław University of Environmental and Life Sciences. 15 were undergraduates and 65 were graduate students. Their mean age was 21.78 (SD = 1.24; range 20–25 years). The group from Latvia comprised university students from Latvia University of Agriculture (83 undergraduates). Their mean age was 20.59 (SD = 1.89; range 18–26 years). The group from China was made up of university students from Hunan Agricultural University (80 undergraduates). Their mean age was 18.44 (SD = 0.75; range 16–20 years). Students were recruited as follows. With the kind help of university lecturers, we asked their students to participate in our study. From among those who expressed a desire to join in, we selected randomly targeted research groups. These groups are not representative of the societies of the countries where the research was conducted. However, it seems that in the case of exploratory research (e.g., testing the impact of landscape features on human feelings and investigating the mechanisms of this impact) the requirement of sample representativeness may not be met. Therefore, researchers often recruit students for such research [12,13,14,41,42,60,81,82,83,84].
4.3. Stimuli
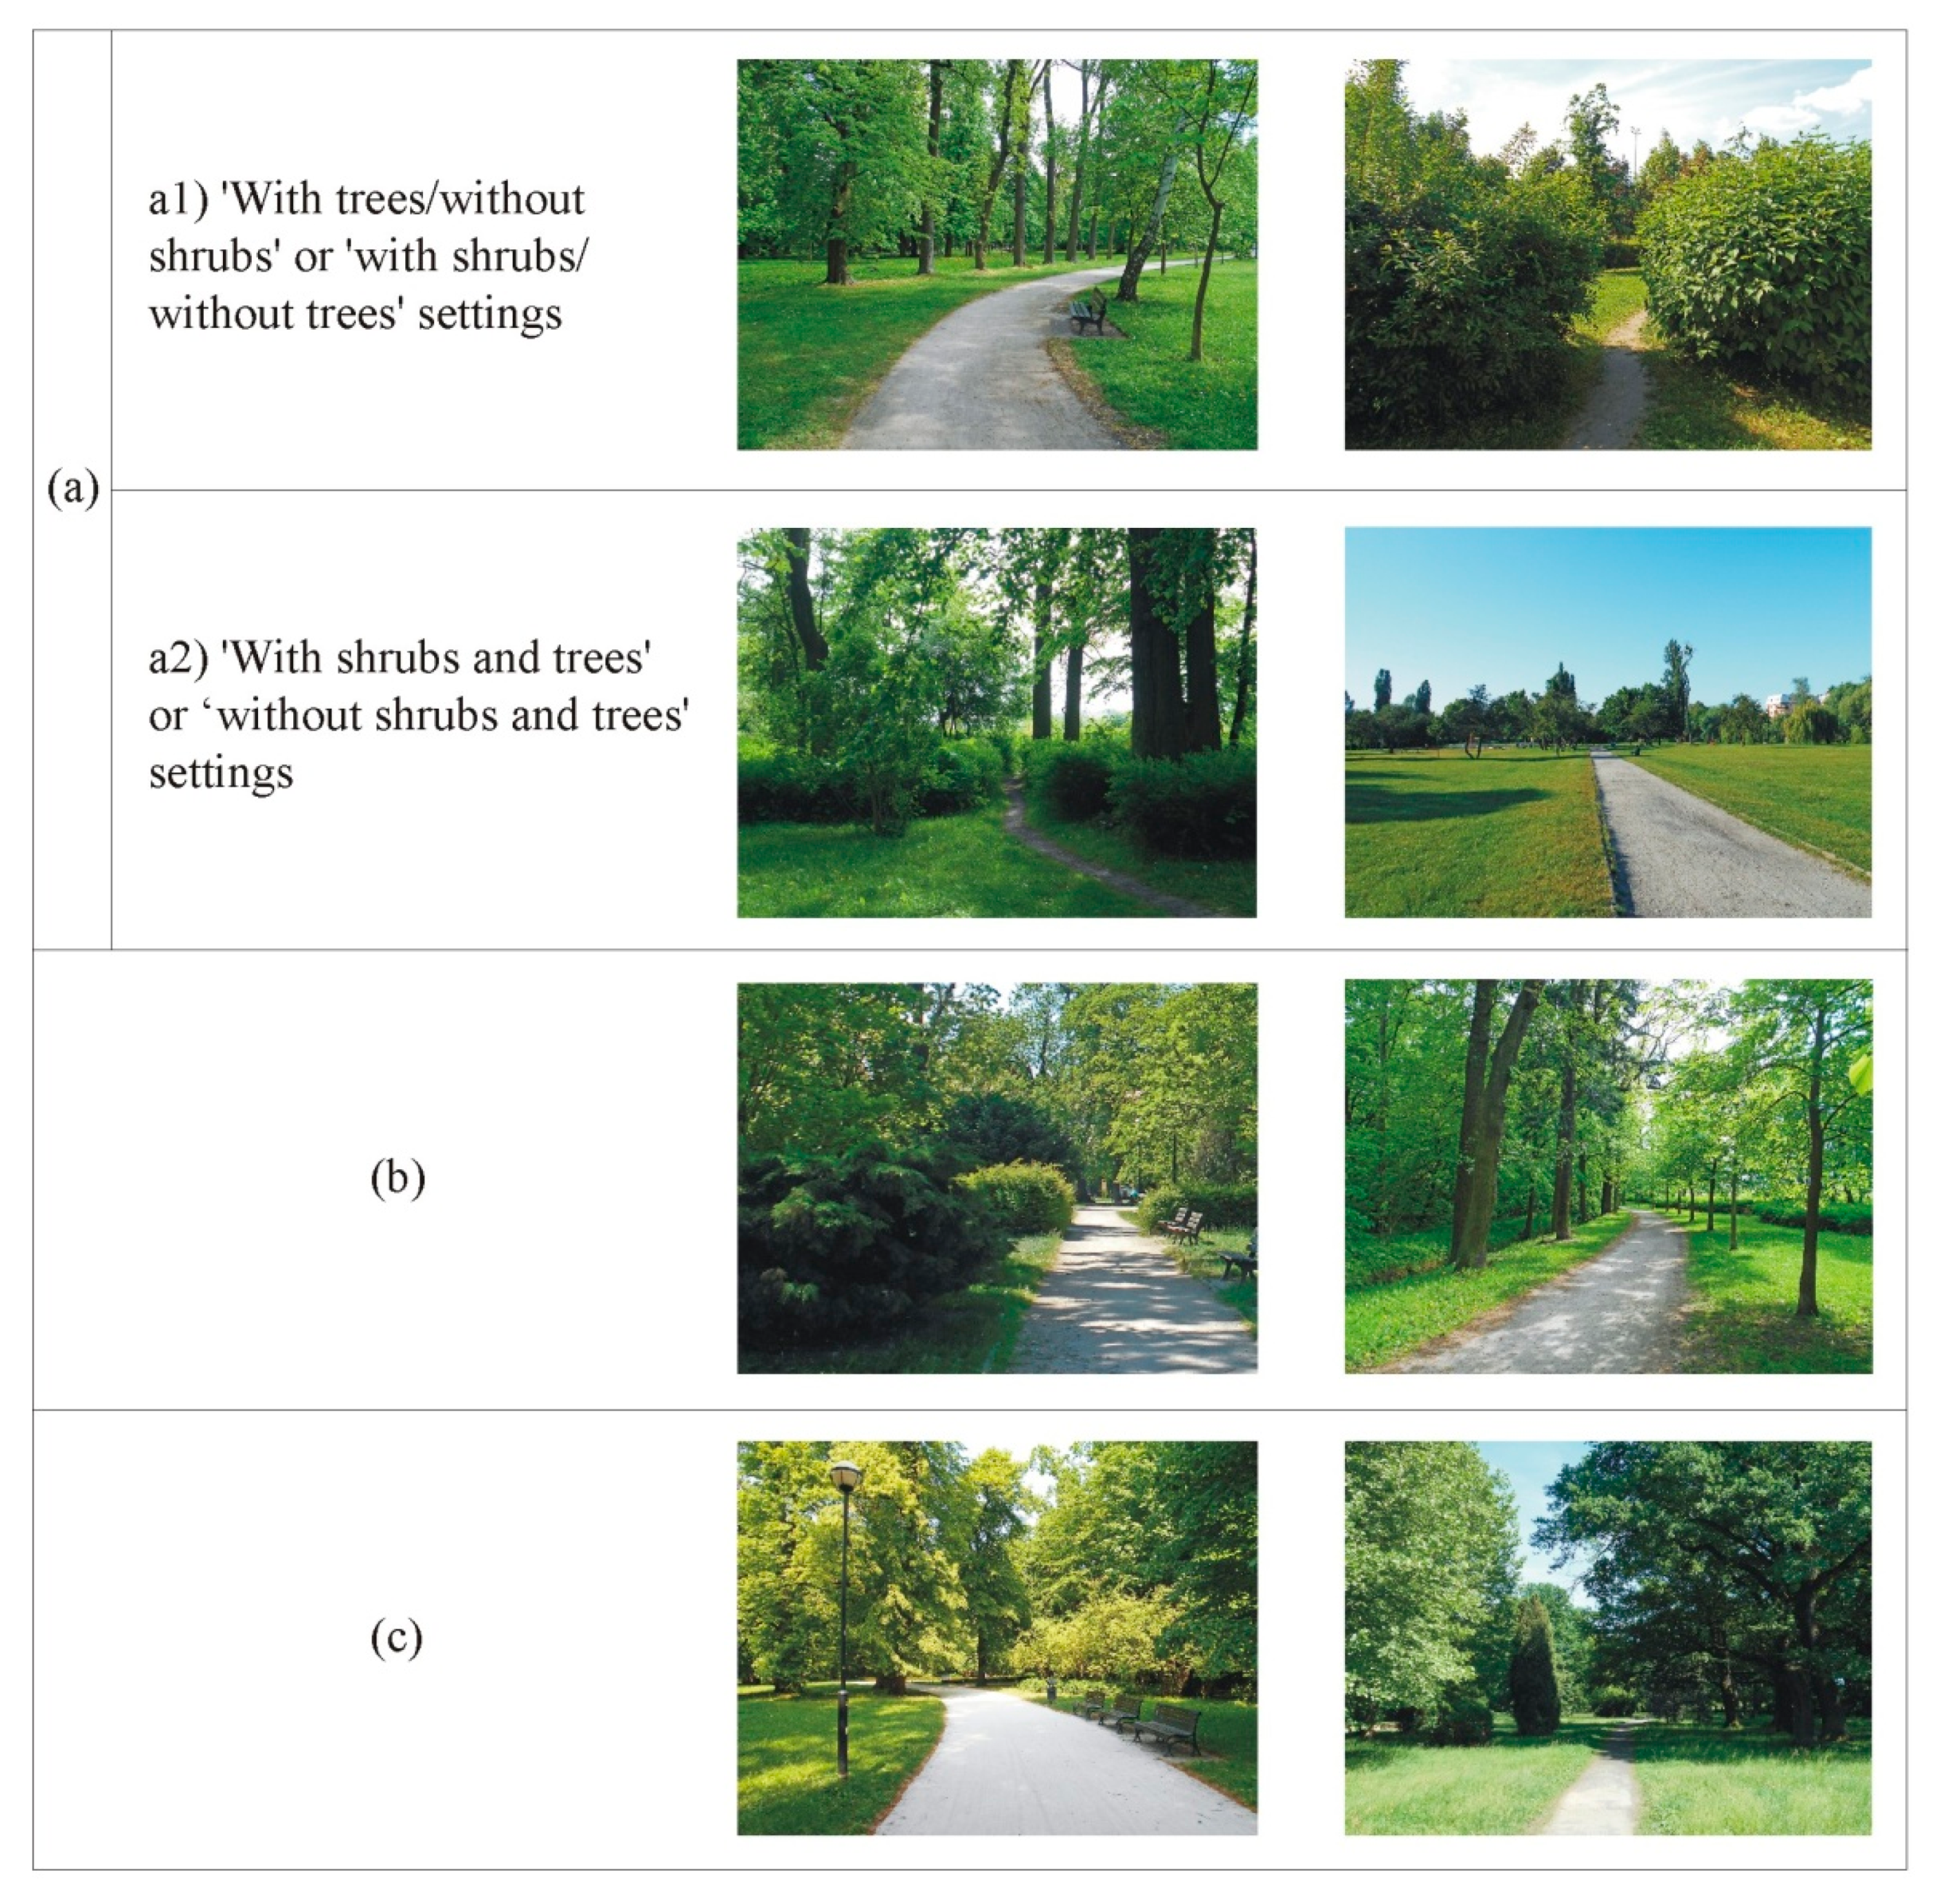
The research tool took the form of a survey supplemented by a set of slides that were shown to individual groups of respondents on a projector in lecture rooms. The survey was translated into the mother tongues of each of the respondent groups. The slides to be selected to had been selected to reflect various predictor variables—the presence/absence of trees, the presence/absence of shrubs, effectiveness of concealment, perceived space use intensity (Figure 1). At the same time, we tried to differ as little as possible in terms of other, unevaluated features that affect preference and danger, such as flowers or the degree to which the landscape is natural [9,27,108]. The pictures came from city parks, with a medium level of naturalness. Both forest landscapes and views of severely manicured landscapes—containing, for example, sculptured plants, hedges, flower beds, etc.—were omitted. The only herbaceous plants were lawns. The trees and shrubs on the slides differ in terms of spatial form (height and width) and are devoid of any strongly distinguishing features (e.g., flowers, colorful leaves). Since the goal is to assess psychological perceptions and preferences, the definition of trees and shrubs is not ecologically based, but perceptually based. We considered shrubs to be no less than about 90 cm in height—in other words, tall enough for a person of average height to hide behind.
For the variable ‘presence of trees’, two categories were formulated: with trees (10 slides) and without trees (8 slides). Similarly, we had two categories for the variable ‘presence of shrubs’: with shrubs (11 slides) and without shrubs (seven slides). We allocated individual slides to a given category based on their content (the presence of trees and shrubs in the picture). The basis for assigning a photo to a specific category was the form of the plant in the landscape, not its botanical/ecological classification. The other two variables were measured based on the respondents’ assessments. We chose photos that contain a vast array of features that may influence this assessment. Thus: the variable ‘perceived space use intensity’ was differentiated by: the possibility to see places where people were present, the presence of elements characteristic of busy circulation paths (lamp posts, benches, rubbish bins, etc.), the width of the path, the degree to which it is overgrown, indicating how busy it is, etc. The variable ‘effectiveness of concealment’ was differentiated by features of the plants that affect the possibility for someone or a group of people to hide behind: the height and width of the shrub, whether it is dense or more ‘lattice-like’, as well as the shape of its crown [15,16,42]. All photos were taken in the summer or late spring. No settings contained people. All slides were oriented horizontally and in color.
There were two target variables—perceived danger and preference. The definitions of the variables were taken from Herzog [13,88]. We adopted the definition of variable efficiency of concealment offered by Lis et al. [42]. In one question, it read as follows: ‘Please imagine that you or someone else may hide behind the shrubs or trees that you can see. How do you rate such a hiding place in terms of effectiveness?’ We asked the respondents, while issuing the assessment, to try to determine how easily they could hide themselves behind the trees or shrubs visible in the picture if they were looking to conceal themselves effectively (for whatever purpose). We explained that the effectiveness of a hiding place is determined by the ease with which a person or a group of people can hide and remain unseen, irrespective of their body position (standing, bent or crouched).
We formulated our own research definition of the variable ‘perceived use intensity’. The relevant question read: ‘Please rate to what extent the path you can see in the photo is used by people. Please give the highest rating to paths where in your opinion you are likely to encounter another user, and the lowest one—to paths which seem desolate and rarely used’.
The questions were preceded by an introduction in which the respondents were asked to imagine that they were walking along the path shown in the picture. When assessing danger or preference, they should refer to the situation presented by the photo and not to the photo per se.
Internal consistency reliability coefficients (Cronbach’s alpha), based on settings as cases and participants as items, ranged from 0.75 to 0.84 (αconcealment = 0.79, αpath use intensity = 0.75, αdanger = 0.84, αpreference = 0.75).
Table 1 contains a list of the variables used in the study together with questions formulated on the basis of the operational definitions cited above.
4.4. Procedure
The study design is described below. The surveys contained four questions, each of which concerned one of the four variables. There were two survey types. These surveys differed only in the order of the photos evaluated. The participants were randomly allocated to each survey. This procedure was aimed at reducing the potential impact that the order of the assessed photos might have on the respondents’ assessments. One half of the respondents completed one survey, and the other half—the other survey. Each respondent assessed all 18 slides four times—separately for each variable. The order of the slides was random and different for each variable. In the middle of the study, the slide order was modified by interchanging the halves of the original order. All the ratings used a five-point scale, ranging from 5 (a great deal [the highest possible rating]) to 1 (not at all [the lowest possible rating]).
The surveys had been translated from English into the mother tongue of each country. Because of the respondents’ relatively poor knowledge of English in all three countries, we did not include the English version of the survey.
The study procedure is described below. The participants answered the questions in lecture rooms. The photos were presented with the following type of projector: 800 × 600 SVGA, 4:3 format, 121 inch diagonal. Prior to completing the questionnaire, all the participants were briefed on the purpose of the study. After the task had been explained, we quickly showed the participants all 18 slides used in the study (2 s per slide). This was done to help them acquire a feel for the landscapes to be assessed, make up their mind about the assessment criteria, become accustomed to the task and practice the task instructions. Then the participants rated the slides by entering their ratings in the surveys.
The study was conducted in sessions, each of which was attended by eight to 18 participants. The viewing time was 15 s per slide. After 36 slides had been presented, there was a five-minute break, followed by an assessment of the remaining 36 slides.
4.5. Data Analysis
The statistical analysis was carried out by means of IBM SPSS Statistics version 25. The software was used to determine Pearson’s correlation coefficients for the variables, and ANOVA and linear regression to test the influence of the predictor variables on the dependent variables. Our ANOVA results are accompanied by estimated conditional marginal means instead of ordinary marginal means, because the groups of slides with trees and shrubs were not equipotent. In order to verify mediation effects, we used the IBM SPSS Amos 25 Graphics application. We conducted all analyses based on the subjects’ results relieved of their individual differences by assuming different random intercepts for each subject (random constant). To this end, we calculated the mean for each subject for each of the studied variables and afterwards we deducted the mean from the results of a given subject.
5. Results
5.1. Relationships between the Variables Measured in the Surveys
Correlation analysis indicated the existence of significant dependences between all four variables measured in the surveys (effectiveness of concealment, perceived path use intensity, perceived danger and preference) among all the subjects (Table 2). Subsequently, we compared the strength of association by country.
In all of the countries analyzed, the directions of association did not change, but the correlation values varied (Table 3). The differentiation was the most pronounced in the case of relationships between preference and all three remaining variables (effectiveness of concealment, perceived path use intensity and perceived danger). The strongest relationships were discovered in the case of the findings obtained in China (respectively: r = −0.30; r = 0.34; r = −0.40), and the weakest ones—in Poland (respectively: r = −0.12; r = 0.12; r = −0.10). The differences for the other variables are considerably smaller.
5.2. The Impact of Effectiveness of Concealment and Perceived Path Use Intensity on Perceived Danger (Hypothesis H1a)
Analysis by means of the ANOVA test has demonstrated that the model predicting the level of assessed danger on the basis of the two predictor variables measured in the surveys (effectiveness of concealment and perceived path use intensity) was statistically significant in all three countries. This explained: 33% of the variance of the dependent variable in China, 23% of its variance in Latvia, and 37% of its variance in Poland (Table 4). Both predictors were statistically significant, with effectiveness of concealment, as opposed to perceived path use intensity, characterized by a positive and stronger association (Table 5). The impact was the strongest in the case of the respondents from Poland (β = 0.46). When the effectiveness of concealment rose by one standard deviation, the perceived danger grew by 0.46 of the standard deviation. On the other hand, the impact of perceived path use intensity on perceived danger proved the smallest in Poland (β = −0.25) and the strongest in China (β = −0.33).
5.3. Impact of the Presence of Trees and Shrubs on Perceived Danger (Hypothesis H1b)
Analysis by the ANOVA test has demonstrated the significance of the presence of shrubs on the impact on perceived danger in all three countries (Table 6). To the greatest extent, the variance of perceived danger was explained by the presence of shrubs in Poland (η2 = 0.23), and to the smallest extent—in Latvia (η2 = 0.12). Despite the differences, the same regularity was found in all three countries. The subjects’ ratings of slides with shrubs were considerably higher than those of slides without shrubs (Table 7). The positive impact of the presence of trees on perceived danger proved much smaller. In Poland, the presence of trees explains 3% of the variance of perceived danger, in Latvia—barely 1%, and in China, the presence of trees proved insignificant to the value of the dependent variable (Table 6). Slides with trees and without trees were rated by the respondents in China in a similar way (Table 7).
5.4. Impact of the Presence of Trees and Shrubs on Preferences
We also explored the impact of the presence of trees or shrubs on preferences in respect of landscape. We compared the findings from the three study groups (from three countries). Analysis by the ANOVA test has demonstrated the significance of the effect of the presence of trees and the presence of shrubs on the impact on preferences in all three countries (Table 8). However, the results differ to some extent. As regards the results from China and Latvia, the presence of shrubs explained preference to a larger extent (respectively: η2 = 0.10 and η2 = 0.09) than the presence of trees (respectively: η2 = 0.05 and η2 = 0.02). The reverse was true for Poland—the presence of trees explained preference to a larger extent (η2 = 0.13) than the presence of shrubs (η2 = 0.06). Despite the differences, the same regularity was found in all three countries. When the respondents were assessing slides with trees, they preferred them noticeably more than slides without trees. The reverse was true for shrubs. Where slides showed shrubs, the subjects assessed their preference as much lower than when the photos had no shrubs (Table 9).
5.5. Mediation Effects (Hypotheses H2 and H3)
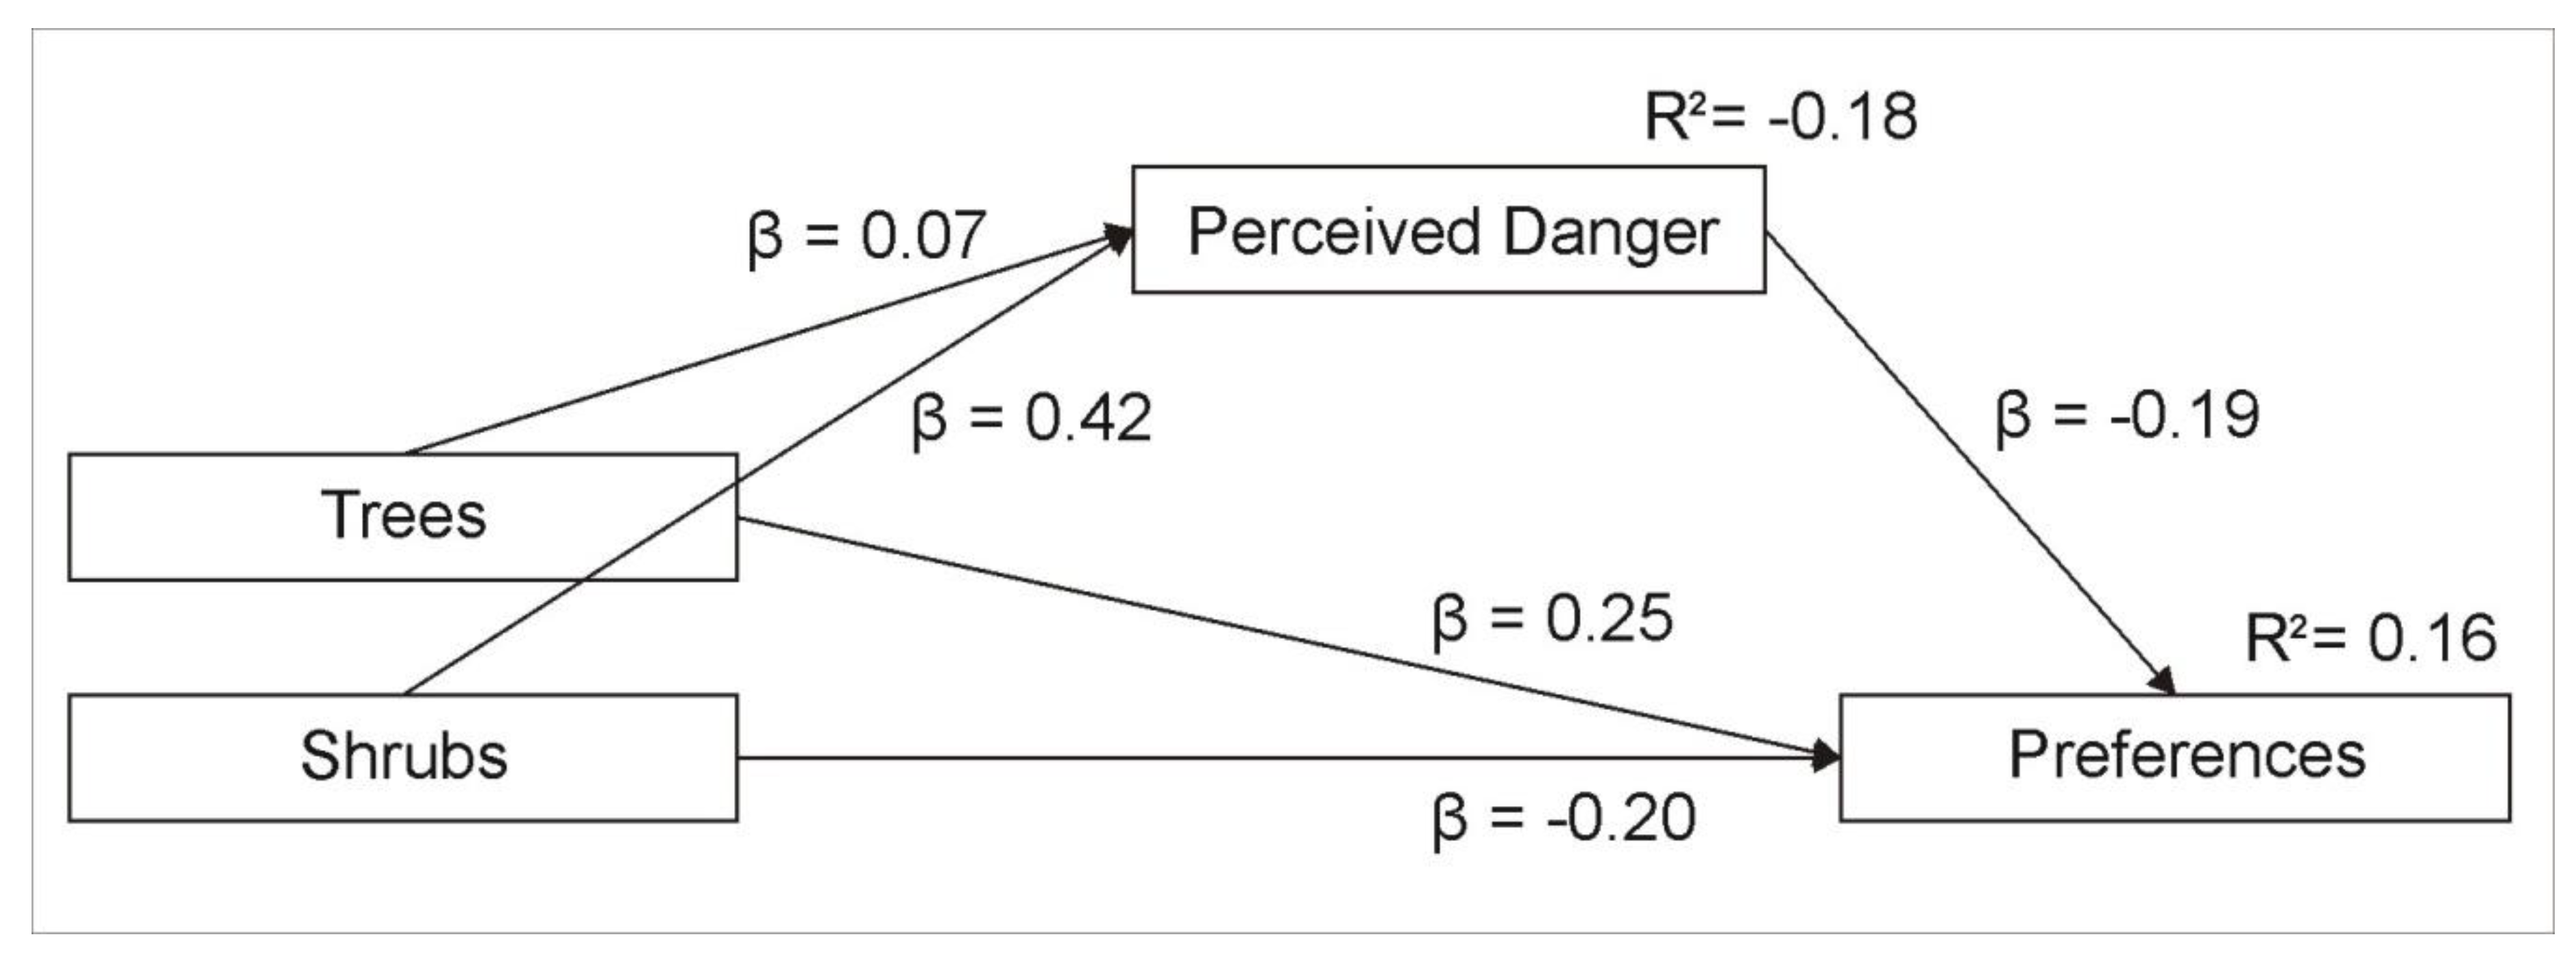
We tested the mediation effects that we had predicted (hypotheses H2 and H3) on the entire study group, without dividing them into individual countries. To this end, we performed a mediation analysis. Mediation analysis serves the purpose of checking whether a particular variable mediates the influence of an independent variable (INDV) on a dependent variable (DV). SEM checks if the influence of the mediator on the on DV is significant and whether this can be attributed by the influence of INDV on the mediator. Mediation is said to occur if such a path appears to be significant. Hypothesis H2 assumed that perceived danger would play a mediating role in the relationship between the presence of trees or shrubs and preference. In order to verify the hypothesis, we first of all familiarized ourselves with direct influences. The presence of trees enhanced preferences (β = 0.25), while the presence of shrubs lessened them (β = −0.20). Both the presence of shrubs and trees on the slides increased the perceived danger, although the effect observed for shrubs was noticeably stronger (β = 0.42) than for trees (β = 0.07) (Figure 2).
Analysis of the indirect effects has demonstrated that perceived danger significantly mediated the influence of the presence of shrubs on preferences (β = −0.08). As regards the relationship between the presence of trees and preferences, perceived danger was discovered to have a small yet significant indirect impact, (β = −0.01). The total effects show all impacts (both direct and indirect) of shrubs and trees on preferences (Table 10). The mediator explains 3.6% of the variance.
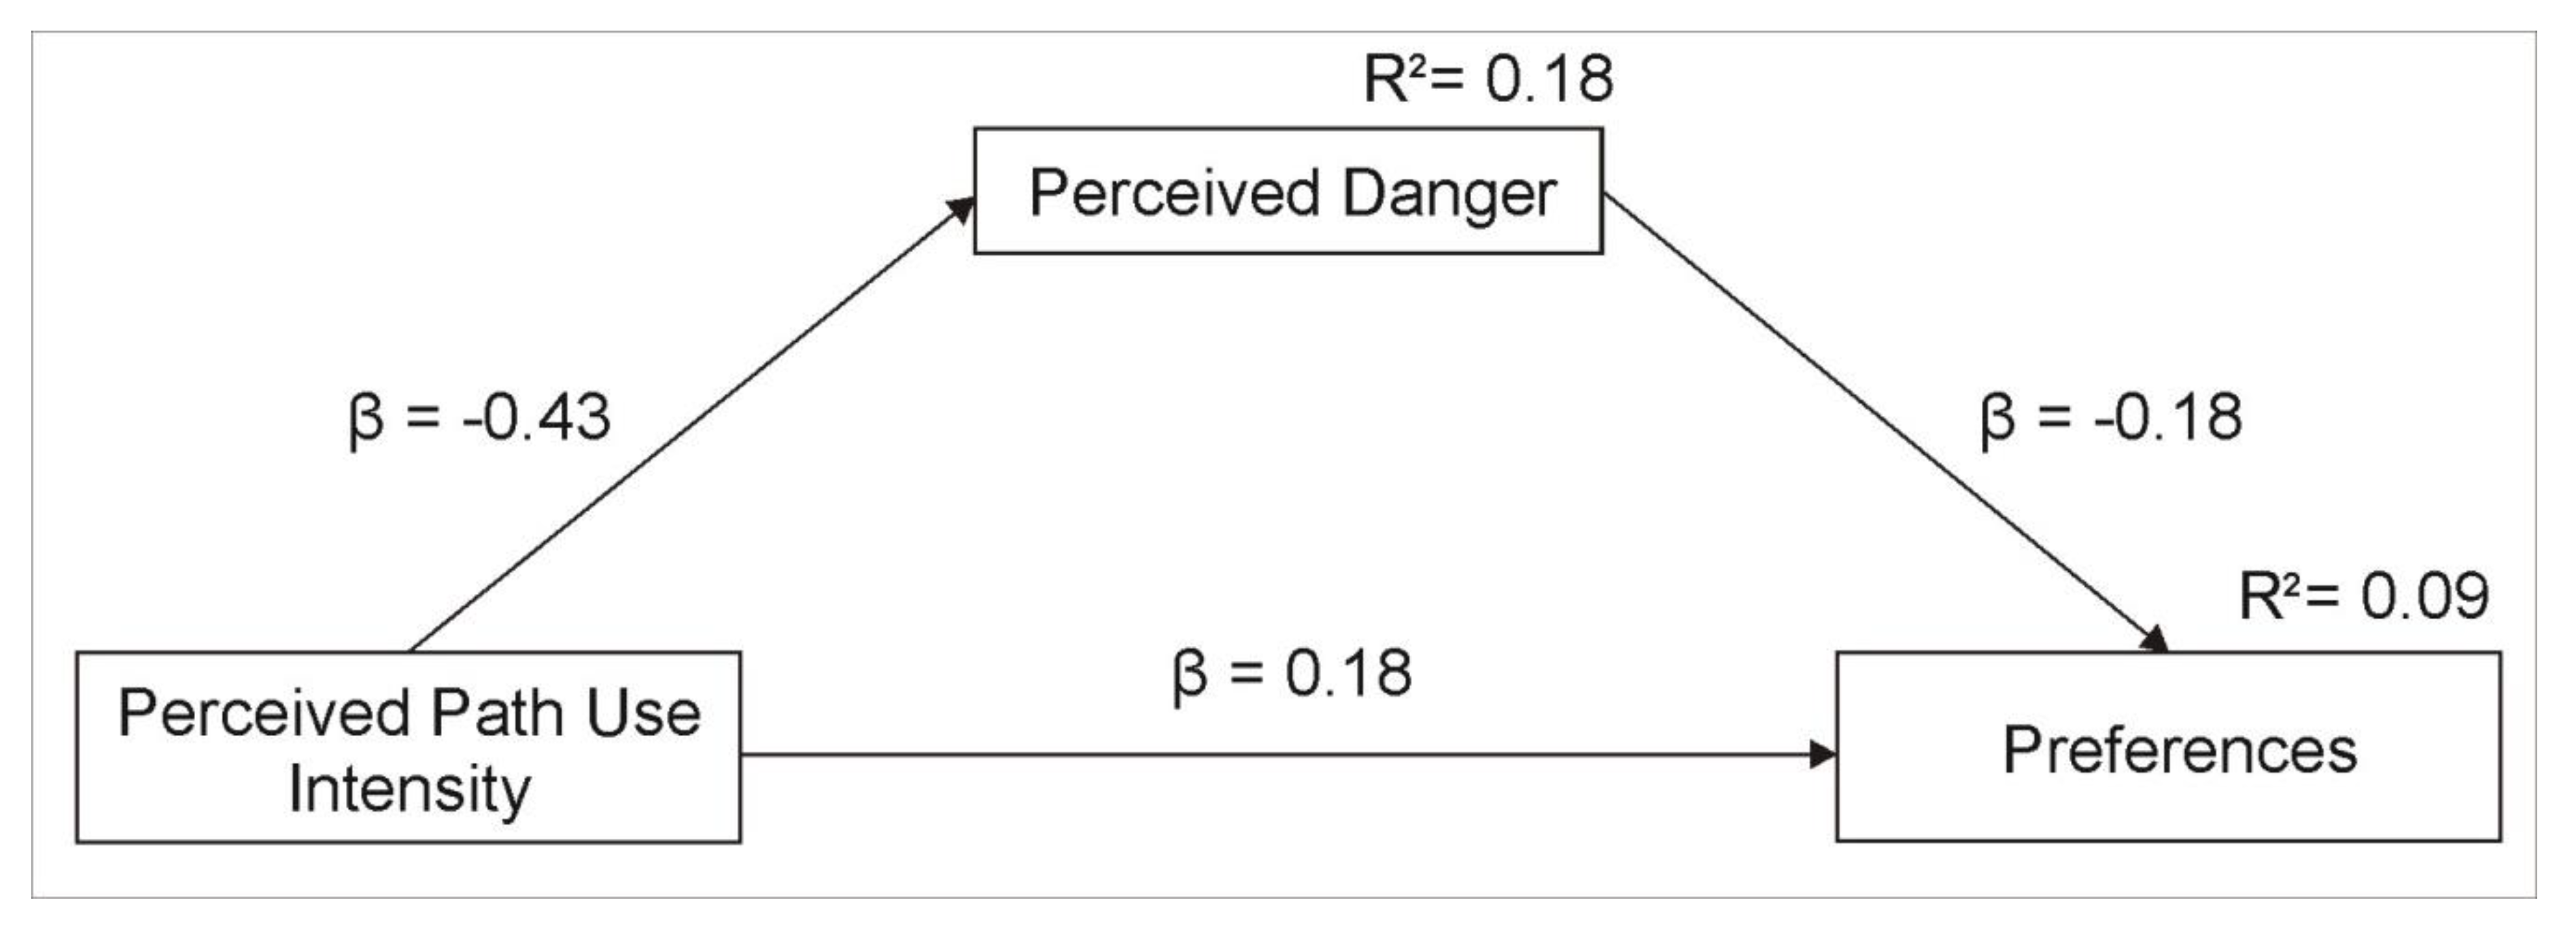
Hypothesis H3 assumed that perceived danger would play a mediating role in the relationship between perceived path use intensity and preference. First of all, we familiarized ourselves with direct influences. Perceived path use intensity had a positive effect on preference (β = 0.18) and a negative one on perceived danger (β = −0.43) (Figure 3). Analysis of indirect effects has demonstrated that perceived danger significantly mediated the influence of perceived path use intensity on preference (β = 0.08). The total effect (taking account of direct and indirect influences) of perceived path use intensity on preference amounted to β = 0.26 (Table 11). The mediator explains 3.2% of the variance.
6. Discussion
In the first part of the study, we compared test results regarding simple relationships between the examined variables in three countries. Generally, it can be stated that nearly all of the explored relationships have proved significant and have the same indicators, irrespective of the country studied. The only exception is an insignificant impact of trees on danger found in the study conducted in China. In the other two countries, the relationship is significant, but it should be emphasized that it is very weak. Thus, it can be observed that the findings of the study as regards this relationship are also similar within the study groups from various countries.
Our study focused on testing the impact of the studied variables on perceived danger. This was the aim of hypothesis H1. The first part of the hypothesis (H1a) assumed that the effectiveness of concealment and perceived path use intensity would affect the perceived danger. All our tests have confirmed this hypothesis. A comparison of the results from the three study groups has shown that differences including are rather insubstantial. What is more, their meaning does not change. Among all the participants, there occurs a significant and relatively strong impact of effectiveness of concealment and perceived path use intensity on perceived danger. At the same time, in every study group, the influence of the effectiveness of concealment is greater. This can be seen both when comparing correlation coefficients and regression models that predict the level of perceived danger on the basis of effectiveness of concealment and perceived path use intensity. The second part of the hypothesis (H1b) assumed that the presence of trees and shrubs has an impact on perceived danger. The hypothesis has only been confirmed fully with regard to the presence of shrubs. The variable substantially differentiates the ratings of the studied landscapes as to the perceived danger. All the respondents perceived locations with shrubs as more dangerous than surroundings without them. The presence of shrubs explains the variance of danger perceived by the study subjects in China, in Latvia and in Poland at 18%, 12% and 23%, respectively. For the ‘presence of trees’ variable, hypothesis H1b was not confirmed. Trees only increase the sense of danger as assessed by Poles and Latvians to a small extent, while for the Chinese the presence of trees has no significant impact on danger rating. The results obtained in three research groups can thus regarded as very similar.
The biggest differences in the results obtained in individual countries were observed when comparing the strength of impact of the studied variables on preferences. In particular, the differences concern the influence of the three variables measured in the survey—effectiveness of concealment, perceived path use intensity and perceived danger. The impact is definitely the weakest in the Poles’ ratings, while the strongest was seen in the ratings provided by the Chinese subjects. Furthermore, the meaning of the variables is different for each of the three nations. In the case of the Chinese, the biggest influence on preference was exerted by perceived danger. These two variables were the most closely correlated with each other (r = −0.40). As regards the Latvian respondents, it was perceived path use intensity that had the strongest correlation with perceived danger (r = −0.30). In Poles, the strength of the correlation between preference and effectiveness of concealment, perceived path use intensity and perceived danger is similar (respectively: r = −0.12; r = −0.12 and r = −0.10).
The data obtained in our study do not allow us to explain the reasons for the differences. The study was not designed to do so. We only set out to check to what extent people of various nationalities who live in different geographical regions perceive urban green spaces similarly and to what extent their perceptions differ. The discovered differences call for further, more detailed studies, designed to identify the causes of such differences. In our opinion, the reasons may be found both in the cultural context that has shaped the respondents’ personalities and in the environment that has influenced their perception of various forms of landscape. Firstly, the study was conducted using photos of settings typical of urban parks in Poland and Latvia. Chinese parks differ in form and composition, and as regards plant species, which may have had a noticeable impact on the ratings. Secondly, geographical conditions related to the place of residence may influence the general perception of danger in urban green spaces and on individual’s sensitivity to danger. One can assume that people living in crime-ridden areas will have a different attitude to danger than people who have no daily contact with the problem. Consequently, respondents with a high sensitivity to danger will be more likely to rate dangerous settings as low in terms of preference than people less sensitive to danger. These assumptions, however, are only hypotheses that require further research.
The results obtained concerning the influence of the studied variables on preferences also feature significant limitations resulting from the selection of the slides presented. A relatively small number (18 slides) were used, which does not allow for the control of a number of variables. In particular, the influence of trees and shrubs on preferences will certainly vary depending on a number of other spatial features, such as the composition, the number of shrubs and their density, species and individual characteristics of the plants, their state of upkeep, etc. Establishing preferences for trees and shrubs in parks therefore requires in-depth research taking into account the possibility of examining at least some of these features.
The results concerning the impact of the examined variables on danger are in line with the previous studies. The importance of social control for space safety [98,99] has been confirmed with our variable ‘path use intensity’. Likewise, the role of concealment, a danger predictor included in the Nasar/Fisher model [12,45], has also been supported. The strength of the correlation between this variable and perceived danger is similar to that found in other studies dealing with the impact of hiding places on perceived danger or fear of crime [14]. It has to be pointed out, however, that a similar study conducted by Lis et al. [42] have demonstrated a noticeably stronger correlation between effectiveness of concealment and perceived danger (r = 0.90). On the other hand, the studies dealt with hot spots of crime and fear, where much stronger reactions from respondents to perilous factors can be expected than in the case of generally understood urban green spaces.
The study findings concerning the effect of the presence of trees and shrubs on perceived danger are also not surprising. The far greater influence of shrubs s than trees on perceived danger can be explained both deductively, and by referring to studies and theoretical models. Particularly useful in predicting the influence of trees and shrubs on danger is the Nasar/Fisher model [12,45]. If, on the basis of the model, we accept that the primary predictors of danger are: concealment, prospect and escape, we must conclude that shrubs probably exert a bigger influence on perceived danger than trees. To some extent, trees can provide a hiding place, but will rarely hinder escape or constitute something that might block one’s view.
All in all, we can state that the relationships assumed in hypothesis H1 have been supported in the studies conducted in all three countries. This enables us to suspect that the nature of the relationships is, at least partly, independent of environmental conditions. This is also indirectly supported by the universalism of such theories and models as the Nasar/Fisher model [12,45] or Appleton’s prospect-refuge theory [72,73].
The subsequent analyses were aimed at verifying the supposed mediation effects (hypotheses H1 and H2). Our tests have confirmed the mediation effect of perceived danger in the influence of the examined variables on preference. The role is clearly visible in the impact of the presence of shrubs and path use intensity on preferences (in both cases β = 0.08). As regards the impact of trees on preference, although the mediation effect is statistically small, yet significant (β = 0.01). All the mediations are partial mediations—the predictor variables also affect the dependent variable (preference) if the mediator (perceived danger) is controlled in the model. The findings can be interpreted as described below. The presence of trees has a positive impact on our preferences, while the presence of shrubs has a negative influence on them. Settings with shrubs are generally less liked than settings without shrubs. This is consistent with other studies. Some researchers have found that people prefer open spaces with trees or surrounded by forest [51,91,92,93]. The results of the study also indicate that people do not like space containing dense shrubs [109,110]. However, such assessments partly result from the fact that shrubs increase our sense of danger. A similar regularity can be noticed in the case of the variable ‘path use intensity’. The variable exerts a positive impact on our preferences towards a landscape. We prefer parks with people to desolate places. However, our preferences do not only result from our attitude to the presence of people in parks as such. They are partly due to the fact that the presence of people reduces danger in space. We tend to like places with people, because—among other things—they are safer. It is worth noting that the lack of human presence in a particular area is not necessarily a negative feature; on the contrary, it can be perceived positively, as offering peace and quiet, the possibility to relax, desired privacy [111]. Research conducted by Lis et al. [41] revealed that secluded places in parks are contradictory–on the one hand, they are liked because of the sense of privacy resulting from a lack of perceived surveillance; on the other, they are not liked because of the sense of danger they evoke.
Apart from the above limitations, there are some associated with the selection of the study group. The study respondents were university students. Some researchers believe that there are grounds for generalizing the results of studies involving university students to the entire population [112].
Considering all the limitations indicated above, the findings from this study can only be described as tentative. Nevertheless, they constitute an important starting point for further, more detailed investigations. It is also one of the few studies dealing with the impact of the spatial features of green spaces on perceived danger conducted simultaneously in study groups from various countries.
7. Conclusions
A comparison of the results gained from the research carried out in different countries indicates that the influence of trees and shrubs and the intensity of path use on perceived danger is of a rather universal nature—the results obtained in the three countries can be considered to manifest an evident similarity. The greatest differences in the results obtained in individual countries are observed when comparing the extent to which effectiveness of concealment, perceived path use intensity and perceived danger influences preferences. An explanation for the causes of these differences requires further research.
Our findings allow us also to draw some practical conclusions:
- The results we obtained indicate that our attitude to trees in green spaces is hardly related to space safety. Although the studies carried out by Lis et al. [42] have demonstrated that the situation differs in hot spots of crime, we can generally assume that in urban green spaces trees have a positive influence on preferences. The way we relate to shrubs differs. Despite the limitations mentioned above, our studies lead us to the conclusion that the tendency to rate settings with shrubs lower is partly connected with the fact that shrubs decrease space safety.
- Many researchers recommend improving visibility at the ground level by reducing the height of shrubs, raising the tree canopies and supplying grass or smooth ground [1,2,11,30]. Indeed, dense shrubs evoke a sense of fear and danger particularly along a park trail [29]. In the light of our research, we can state that such proposals are justified. However, this recommendation is primarily applicable to areas in which the variable ‘perceived danger’ is of importance. Safe areas (e.g., private parks owned by individuals or institutions) do not have to eliminate shrubs. In green public spaces, reducing the number of shrubs should be carried out with due caution. Shrubs, as previously mentioned, are an important element enhancing the social and natural values of green urban spaces. Their removal would negatively affect the quality of ecosystem services. Therefore, such operations should be focused on sensitive spots that are crucial to safety: along important communication routes (in particular those with no alternative routes), in areas located near residential buildings, schools, kindergartens and other facilities that are particularly important for the life of city residents. Operations reducing shrubs are also more justified in areas that are hot-spots of crime than in districts where the crime rate is low.
- Space safety is largely affected not by the very presence of shrubs, but by their concealment/coverage properties. Consequently, when selecting shrubs for lower-safety areas, one should disregard any dense, high and broad vegetation, and instead use ‘lattice-like’ plants, with slim forms, or low ones, which cannot hide a person. Such shrubs will not instill a sense of danger but will constitute an appealing supplement to the composition.
- The final conclusion regards perceived space use intensity. Irrespective of the actual number of space users, any signs that an area is desolate lead to a sense of danger. The best solution for dangerous spaces is to bring them to life so that they are universally and frequently used. If this is not possible, it is important to remove any signs of desolation from them, such as overgrown paths, missing original furnishings, wild or neglected vegetation. However, these operations should apply to places where a sense of safety is more important than a sense of privacy. Areas that can function as silent places of relaxation, loneliness and contact with nature can be equipped with routes without signs of frequent use.
Supplementary Materials
The following are available online at https://www.mdpi.com/2071-1050/11/17/4565/s1, Table S1: The Character of the Tested Relationships in Relation to the Research Questions and Detailed Hypotheses.
Author Contributions
The main conception, methodology, literature review and discussion of this article should be attributed to A.L.; A.L. also wrote the paper; Ł.P. edited the paper, prepared data collection tool (questionnaires) and coded the data; Ł.P., W.C. and A.K. conducted surveys in their countries, Ł.R. prepared statistical data analysis.
Funding
This research received no external funding.
Conflicts of Interest
The authors declare no conflict of interest.
References
- Donovan, G.H.; Prestemon, J.P. The effect of trees on crime in Portland, Oregon. Environ. Behav. 2012, 44, 3–30. [Google Scholar] [CrossRef]
- Kuo, F.E.; Sullivan, W.C. Environment and crime in the inner city: Does vegetation reduce crime? Environ. Behav. 2001, 33, 343–367. [Google Scholar] [CrossRef]
- Troy, A.; Morgan Grove, J.; O’Neil-Dunne, J. The relationship between tree canopy and crime rates across an urban–rural gradient in the greater Baltimore region. Landsc. Urban Plan. 2012, 106, 262–270. [Google Scholar] [CrossRef]
- Kuo, F.E.; Sullivan, W.C.; Coley, R.L.; Brunson, L. Fertile ground for community: Inner-city neighborhood common spaces. Am. J. Community Psychol. 1998, 26, 823–851. [Google Scholar] [CrossRef]
- Maas, J.; Spreeuwenberg, P.; Van Winsum-Westra, M.; Verheij, R.A.; De Vries, S.; Groenewegen, P.P. Is green space in the living environment associated with people’s feelings of social safety? Environ. Plan. A Econ. Space 2009, 41, 1763–1777. [Google Scholar] [CrossRef]
- Nasar, J.L. A model relating visual attributes in the residential environment to fear of crime. J. Environ. Syst. 1982, 11, 247–255. [Google Scholar] [CrossRef]
- Brower, S.; Dockett, K.; Taylor, R.B. Resident’s perceptions of territorial features and perceived local threat. Environ. Behav. 1983, 15, 19–437. [Google Scholar] [CrossRef]
- Burgess, J.; Harrison, C.M.; Limb, M. People, parks and the urban green: A study of popular meanings and values for open spaces in the city. Urban Stud. 1988, 25, 455–473. [Google Scholar] [CrossRef]
- Jorgensen, A.; Hitchmough, J.; Calvert, T. Woodland spaces and edges: Their impact on perception of safety and preference. Landsc. Urban Plan. 2002, 60, 135–150. [Google Scholar] [CrossRef]
- Koskela, H.; Pain, R. Revisiting fear and place: women’s fear of attack and the built environment. Geoforum 2000, 31, 269–280. [Google Scholar] [CrossRef]
- Schroeder, H.W.; Anderson, L.M. Perception of personal safety in urban recreation sites. J. Leis. Res. 1984, 16, 178–194. [Google Scholar] [CrossRef]
- Fisher, B.; Nasar, J.L. Fear of crime in relation to three exterior site features: Prospect, refuge, and escape. Environ. Behav. 1992, 24, 35–65. [Google Scholar] [CrossRef]
- Herzog, T.R.; Chernick, K.K. Tranquility and danger in urban and natural environments. J. Environ. Psychol. 2000, 20, 29–39. [Google Scholar] [CrossRef]
- Nasar, J.L.; Fisher, B.; Grannis, M. Proximate physical cues to fear of crime. Landsc. Urban Plan. 1993, 26, 161–178. [Google Scholar] [CrossRef]
- Lis, A.; Ziemiańska, M.; Weber-Siwirska, M. The Role of Dendroflora in Preventing Crime in Public Green Space; Monografie CXCVII, Wrocław University of Environmental and Life Sciences Publishing: Wrocław, Poland, 2016. [Google Scholar]
- Lis, A.; Weber-Siwirska, M.; Ziemiańska, M. Method of assessment and verification of plant selection in space safety aspect. Space Form 2016, 26, 213–228. [Google Scholar] [CrossRef]
- Spicer, V. The Geometry of Fear: An Environmental Perspective on Fear and the Perception of Crime. Ph.D. Thesis, Simon Fraser University, Burnaby, BC, Canada, 2012. [Google Scholar]
- Foster, S.; Giles-Corti, B.; Knuiman, M. Does fear of crime discourage walkers? A social-ecological exploration of fear as a deterrent to walking in new suburbs. Environ. Behav. 2014, 46, 698–717. [Google Scholar] [CrossRef]
- Farrall, S.; Bannister, J.; Ditton, J.; Gilchrist, E. Social psychology and the fear of crime. Re-examining a speculative model. Br. J. Criminol. 2000, 40, 399–413. [Google Scholar] [CrossRef]
- Jiang, B.; Mak, C.N.S.; Larsen, L.; Zhong, H. Minimizing the gender difference in perceived safety: Comparing the effects of urban back alley interventions. J. Environ. Psychol. 2017, 51, 117–131. [Google Scholar] [CrossRef]
- Maruthaveeran, S. A Socio-Ecological Exploration of Fear of Crime in Urban Green Spaces: A Case in Kuala Lumpur, Malaysia. Ph.D. Thesis, University of Copenhagen, Copenhagen, Denmark, 2015. [Google Scholar]
- Westover, T.N. Perceptions of Crime and Safety in Midwestern Parks. Prof. Geogr. 1985, 37, 410–420. [Google Scholar] [CrossRef]
- Yeoh, B.A.; Yeow, P. Where women fear to tread: Images of danger and the effects of fear of crime in Singapore. GeoJournal 1997, 43, 273–286. [Google Scholar] [CrossRef]
- Blöbaum, A.; Hunecke, M. Perceived danger in urban public space: The impacts of physical features and personal factors. Environ. Behav. 2005, 37, 465–485. [Google Scholar] [CrossRef]
- Jansson, M.; Fors, H.; Lindgren, T.; Wiström, B. Perceived personal safety in relation to urban woodland vegetation–A review. Urban For. Urban Green. 2013, 12, 127–133. [Google Scholar] [CrossRef]
- Jorgensen, L.J.; Ellis, G.D.; Ruddell, E. Fear perceptions in public parks. Environ. Behav. 2013, 45, 803–820. [Google Scholar] [CrossRef]
- Jorgensen, A.; Hitchmough, J.; Dunnett, N. Woodland as a setting for housing-appreciation and fear and the contribution to residential satisfaction and place identity in Warrington New Town, UK. Landsc. Urban Plan. 2007, 79, 273–287. [Google Scholar] [CrossRef]
- Valentine, G. The geography of women’s fear. Area 1989, 21, 385–390. [Google Scholar]
- Maruthaveeran, S.; Konijnendijk van den Bosh, C.C. Fear of crime in urban parks: What the residents of Kuala Lumpur have to say? Urban For. Urban Green. 2015, 14, 702–713. [Google Scholar] [CrossRef]
- Westover, T.N. Park Use and Perception: Gender Differences. J. Park Recreat. Adm. 1986, 4, 1–8. [Google Scholar]
- James, K.; Embrey, L. “Anyone could be lurking around!”: Constraints on adolescent girls’ recreational activities after dark. World Leis. J. 2001, 43, 44–52. [Google Scholar] [CrossRef]
- Krenichyn, K. Women and physical activity in an urban park: Enrichment and support through an ethic of care. J. Environ. Psychol. 2004, 24, 117–130. [Google Scholar] [CrossRef]
- Nasar, J.; Jones, K. Landscapes of fear and stress. Environ. Behav. 1997, 29, 291–323. [Google Scholar] [CrossRef]
- Mak, B.K.L.; Jim, C.Y. Examining fear-evoking factors in urban parks in Hong Kong. Landsc. Urban Plan. 2018, 171, 42–56. [Google Scholar] [CrossRef]
- Hung, K.; Crompton, J.L. Benefits and constraints associated with the use of an urban park reported by a sample of elderly in Hong Kong. Leis. Stud. 2006, 25, 291–311. [Google Scholar] [CrossRef]
- Mani, M.; Hosseini, S.M.; Ramayah, T. Parks as business opportunities and development strategies. Bus. Strategy Ser. 2012, 13, 96–101. [Google Scholar] [CrossRef]
- Maruthaveeran, S. The perception of social safety in a green environment: A preliminary study at the Kepong Metropolitan Park. Asian J. Environ. Behav. Stud. 2016, 1, 99–111. [Google Scholar] [CrossRef]
- Amemiya, M.; Yokohari, M. The physical characteristics of greenways that instill the fear of crime in a New Town. J. Jpn. Inst. Landsc. Archit. 2001, 65, 823–828. [Google Scholar] [CrossRef]
- Amemiya, M.; Yokohari, M. Analyzing the fear of crime in parks and greenways: A case study of Tsukuba Science City. J. Jpn. Inst. Landsc. Archit. 2003, 2, 134–139. [Google Scholar]
- Yokohari, M.; Amemiya, M.; Amati, M. The history and future directions of greenways in Japanese new towns. Landsc. Urban Plan. 2006, 76, 210–222. [Google Scholar] [CrossRef]
- Lis, A.; Anwajler, K.; Iwankowski, P. Why do we choose fear-evoking spots in parks? The role of danger and privacy in the model of dependence between spatial attributes and preference. Urban For. Urban Green. 2018, 38, 193–204. [Google Scholar] [CrossRef]
- Lis, A.; Iwankowski, P.; Pardela, Ł.; Haans, A. Are Trees and Shrubs Unsafe Hiding Places? Impact of Plant Forms on the Perception of Danger in Urban Green Spaces in Crime Hot Spots. Environ. Behav. 2019. under review. [Google Scholar]
- Wang, K.; Taylor, R.B. Simulated walks through dangerous alleys: Impacts of features and progress on fear. J. Environ. Psychol. 2006, 26, 269–283. [Google Scholar] [CrossRef]
- Michael, S.E.; Hull, R.B. Effects of Vegetation on Crime in Urban Parks; Interim Report for the U.S. Forest Service and the International Society of Arboriculture; Utah State University: Logan, UT, USA, 1994. [Google Scholar]
- Nasar, J.L.; Fisher, B.S. “Hot spots” of fear and crime: A multi-method investigation. J. Environ. Psychol. 1993, 13, 187–206. [Google Scholar] [CrossRef]
- Skjaeveland, O.; Gärling, T. Effects of interactional space of neighbouring. J. Environ. Psychol. 1997, 17, 181–198. [Google Scholar] [CrossRef]
- Shu-Chun, L.H. A study of outdoor interactional spaces in high-rise housing. Landsc. Urban Plan. 2006, 78, 193–204. [Google Scholar] [CrossRef]
- Lis, A. Spatial and Social Structure of Recreation Areas in Wrocław Housing Estates from 1970s to 1980s; University of Environmental and Life Sciences Publishing: Wrocław, Poland, 2011. [Google Scholar]
- Ulrich, R.S. View through a window may influence recovery from surgery. Science 1984, 224, 420–421. [Google Scholar] [CrossRef] [PubMed]
- Ulrich, R.S. Human responses to vegetation and landscapes. Landsc. Urban Plan. 1986, 13, 29–44. [Google Scholar] [CrossRef]
- Kaplan, R.; Kaplan, S. The Experience of Nature: A Psychological Perspective; Cambridge University Press: New York, NY, USA, 1989. [Google Scholar]
- Kaplan, S. The restorative benefits of nature: Toward an integrative framework. J. Environ. Psychol. 1995, 15, 169–182. [Google Scholar] [CrossRef]
- Maas, J.; Verheij, R.A.; Groenewegen, P.P.; De Vries, S.; Spreeuwenberg, P. Green space, urbanity, and health: How strong is the relation? J. Epidemiol. Community Health 2006, 60, 587–592. [Google Scholar] [CrossRef] [PubMed]
- Larson, L.R.; Jennings, V.; Cloutier, S.A. Public parks and wellbeing in urban areas of the United States. PLoS ONE 2016, 11, e0153211. [Google Scholar] [CrossRef] [PubMed]
- McCormack, G.R.; Rock, M.; Toohey, A.M.; Hignell, D. Characteristics of urban parks associated with park use and physical activity: A review of qualitative research. Health Place 2010, 16, 712–726. [Google Scholar] [CrossRef]
- Rouquette, J.R.; Holt, A.R. The Benefits to People of Trees Outside Woods (TOWs); Report for the Woodland Trust; Natural Capital Solutions: Towcester, UK, 2017. [Google Scholar]
- Escobedo, F.J.; Kroeger, T.; Wagner, J.E. Urban forests and pollution mitigation: Analyzing ecosystem services and disservices. Environ. Pollut. 2011, 159, 2078–2087. [Google Scholar] [CrossRef]
- Costanza, R.; de Groot, R.; Braat, L.; Kubiszewski, I.; Fioramonti, L.; Sutton, P.; Farber, S.; Grasso, M. Twenty years of ecosystem services: How far have we come and how far do we still need to go? Ecosyst. Serv. 2017, 28, 1–16. [Google Scholar] [CrossRef]
- Escobedo, F.J.; Clerici, N.; Staudhammer, C.L.; Feged-Rivadeneira, A.; Bohorquez, J.C.; Tovar, G. Trees and Crime in Bogota, Colombia: Is the link an ecosystem disservice or service? Land Use Policy 2018, 78, 583–592. [Google Scholar] [CrossRef]
- Herzog, T.R.; Kropscott, L.S. Legibility, Mystery, and Visual Access as Predictors of Preference and Perceived Danger in Forest Settings without Pathways. Environ. Behav. 2004, 36, 659–677. [Google Scholar] [CrossRef] [Green Version]
- Mambretti, I.M. Urban Parks between Safety and Aesthetics. Exploring Urban Green Space Using Visualisation and Conjoint Analysis Methods. Ph.D. Thesis, Eidgenössische Technische Hochschule, Zürich, The Switzerland, 2007. [Google Scholar]
- Gau, J.M.; Pratt, T.C. Revisiting broken windows theory: Examining the sources of the discriminant validity of perceived disorder and crime. J. Crim. Justice 2010, 38, 758–766. [Google Scholar] [CrossRef]
- Rader, N.E.; May, D.C.; Goodrum, S. An empirical assessment of the “threat of victimization”: Considering fear of crime, perceived risk, avoidance, and defensive behaviors. Sociol. Spectr. 2007, 27, 475–505. [Google Scholar] [CrossRef]
- Michael, S.N.; Hull, R.B.; Zahm, D.L. Environmental Factors Influencing Auto Burglary: A Case Study. Environ. Behav. 2001, 33, 368–388. [Google Scholar] [CrossRef]
- Ceccato, V. The Nature of Rape Places. J. Environ. Psychol. 2014, 40, 97–107. [Google Scholar] [CrossRef]
- Groff, E.; McCord, E. The Role of Neighborhood Parks as Crime Generators. Secur. J. 2012, 25, 1–24. [Google Scholar] [CrossRef]
- Gilstad-Hayden, K.; Wallace, L.R.; Carroll-Scott, A.; Meyer, S.R.; Barbo, S.; Murphy-Dunning, C.; Ickovics, J.R. Greater tree canopy cover is associated with lower rates of both violent and property crime in New Haven, CT. Landsc. Urban Plan. 2015, 143, 248–253. [Google Scholar] [CrossRef]
- Wolfe, M.K.; Mennis, J. Does vegetation encourage or suppress urban crime? Evidence from Philadelphia, PA. Landsc. Urban Plan. 2012, 108, 112–122. [Google Scholar] [CrossRef]
- Kondo, M.; Hohl, B.; Han, S.; Branas, C. Effects of greening and community reuse of vacant lots on crime. Urban Stud. 2016, 53, 3279–3295. [Google Scholar] [CrossRef] [PubMed]
- O’Brien, R.M. Estimating the reliability of aggregate-level variables based on individual-level characteristics. Sociol. Methods Res. 1990, 18, 473–503. [Google Scholar] [CrossRef]
- Lis, A.; Krzemińska, A.; Dzikowska, A.; Anwajler, K. Spatial Determinants of Safety in a City Park as Exemplified by Jan III Sobieski Park in Wałbrzych (Poland); I-BIS Publishing: Wrocław, Poland, 2014. [Google Scholar]
- Appleton, J. The Experience of Landscape; John Wiley: London, UK, 1975. [Google Scholar]
- Appleton, J. Prospect and refuge re-visited. Landsc. J. 1984, 3, 91–103. [Google Scholar] [CrossRef]
- Haans, A.; de Kort, Y.A.W. Light distribution in dynamic street lighting: Two experimental studies on its effects on perceived safety, prospect, concealment, and escape. J. Environ. Psychol. 2012, 32, 342–352. [Google Scholar] [CrossRef]
- Petherick, N. Environmental design and fear: The prospect-refuge model and the university college of the Cariboo campus. West. Geogr. 2000, 10, 89–112. [Google Scholar]
- Park, A.; Clare, J.; Spicer, V.; Brantingham, P.L.; Calvert, T.; Jenion, G. Examining context-specific perceptions of risk: Exploring the utility of “human-in-the-loop” simulation models for criminology. J. Exp. Criminol. 2012, 8, 29–47. [Google Scholar] [CrossRef]
- Van Rijswijk, L.; Rooks, G.; Haans, A. Safety in the eye of the beholder: Individual susceptibility to safety-related characteristics of nocturnal urban scenes. J. Environ. Psychol. 2016, 45, 103–115. [Google Scholar] [CrossRef]
- van Rijswijk, L.; Haans, A. Illuminating for safety: Investigating the role of lighting appraisals on the perception of safety in the urban environment. Environ. Behav. 2017, 50, 889–912. [Google Scholar] [CrossRef] [PubMed]
- Andrews, M.; Gatersleben, B. Variations in perceptions of danger, fear and preference in a simulated, natural environment. J. Environ. Psychol. 2010, 30, 473–481. [Google Scholar] [CrossRef]
- Chiang, J.C.; Nasar, J.; Ko, C.C. Influence of visibility and situational threats on forest trail evaluations. Landsc. Urban Plan. 2014, 125, 166–173. [Google Scholar] [CrossRef]
- Herzog, T.R.; Leverich, O.L. Searching for Legibility. Environ. Behav. 2003, 35, 459–477. [Google Scholar] [CrossRef]
- Herzog, T.R. A cognitive analysis of preference for urban spaces. J. Environ. Psychol. 1992, 12, 237–248. [Google Scholar] [CrossRef]
- Herzog, T.R.; Kirk, K.M. Pathway curvature and border visibility as predictors of preference and danger in forest settings. Environ. Behav. 2005, 37, 620–639. [Google Scholar] [CrossRef]
- Herzog, T.R.; Bryce, A.G. Mystery and Preference in Within-Forest Settings. Environ. Behav. 2007, 39, 779–796. [Google Scholar] [CrossRef] [Green Version]
- Madge, C. Public parks and the geography of fear. Tijdschrift voor Economische en Sociale Geografie 1997, 88, 237–250. [Google Scholar] [CrossRef]
- Scherer, K.R. What are emotions? And how can they be measured? Soc. Sci. Inf. 2005, 44, 695–729. [Google Scholar] [CrossRef]
- Harris, V.; Kendal, D.; Amy Hahs, A.K.; Threlfall, C.G. Green space context and vegetation complexity shape people’s preferences for urban public parks and residential gardens. Landsc. Res. 2018, 43, 150–162. [Google Scholar] [CrossRef]
- Herzog, T.R.; Flynn-Smith, J.A. Preference and perceived danger as a function of the perceived curvature, length and width of urban alleys. Environ. Behav. 2001, 33, 655–668. [Google Scholar] [CrossRef]
- Ulrich, R.S. Visual Landscapes and Psychological Well-Being. Landsc. Res. 1979, 4, 17–23. [Google Scholar] [CrossRef]
- Herzog, T.R.; Kutzli, G.E. Preference and Perceived Danger in Field/Forest Settings. Environ. Behav. 2002, 34, 819–835. [Google Scholar] [CrossRef]
- Hull, R.B., IV; Harvey, A. Explaining the emotion people feel in suburban parks. Environ. Behav. 1989, 21, 323–345. [Google Scholar] [CrossRef]
- Steinitz, C. Toward a sustainable landscape with high visual preference and high ecological integrity: The loop road in Acadia national park USA. Landsc. Urban Plan. 1990, 19, 213–250. [Google Scholar] [CrossRef]
- Zube, E.H.; Pitt, D.G.; Anderson, T.W. Perception and prediction of scenic resource values of the Northeast: Values, Perceptions and Resources. In Landscape Assessment: Values, Perceptions and Resources; Zube, E.H., Brush, R.O., Fabos, J.G., Eds.; Hutchinson and Ross: Stroudsburg, PA, USA, 1975; pp. 151–167. [Google Scholar]
- Berlyne, D.E. Studies in the New Experimental Aesthetics: Steps Toward an Objective Psychology of Aesthetic Appreciation; Hemisphere Publishing Corp: Washington, DC, USA, 1974. [Google Scholar]
- Kaplan, S. An informal model for the prediction of preference. In Landscape Assessment: Values, Perception and Resources; Zube, E.H., Fabos, J.G., Brush, R.O., Eds.; Hutchison and Ross: Stroudsburg, PA, USA, 1975; pp. 92–101. [Google Scholar]
- Brantingham, P.L.; Brantingham, P.J. Environmental Criminology; Waveland Press: Prospect Heights, IL, USA, 1981. [Google Scholar]
- Pain, R.H. Social geographies of women’s fear of crime. Trans. Inst. Br. Geogr. 1997, 22, 231–244. [Google Scholar]
- Jacobs, J. The Life and Death of Great American Cities; Vintage Books Ed.: New York, NY, USA, 1992. [Google Scholar]
- Newman, O. Defensible Space: Crime Prevention Through Urban Design; MacMillan: New York, NY, USA, 1972. [Google Scholar]
- Jeffery, C.R. CPTED: Past, Present and Future. In Proceedings of the A Position Paper Prepared for the International CPTED Association at the Fourth Annual International CPTED Association Conference, Mississauga, ON, Canada, 20–22 September 1999. [Google Scholar]
- Cozens, P.M. Viewpoint sustainable urban development and crime prevention through environmental design for the British city. Towards an effective urban environmentalism for the 21st century. Cities 2002, 19, 129–137. [Google Scholar] [CrossRef]
- Rhodes, W.M.; Conley, C. Crime and mobility: An empirical study. In Environmental Criminology; Brantingham, P.J., Brantingham, P.L., Eds.; Sage: Beverly Hills, CA, USA, 1981; pp. 167–188. [Google Scholar]
- Cromwell, P.F.; Olson, J.N.; Avary, D.W. Breaking and Entering: An Ethnographic Analysis of Burglary; Erlbaum: Hillsdale, MI, USA, 1991. [Google Scholar]
- Macdonald, J.E.; Gifford, R. Territorial cues and defensible space theory: The burglar’s point of view. J. Environ. Psychol. 1989, 9, 193–205. [Google Scholar] [CrossRef]
- Merry, S.E. Defensible space undefended. Urban Aff. Q. 1981, 16, 397–422. [Google Scholar] [CrossRef]
- Kuo, F.E. The role of arboriculture in a healthy social ecology. J. Arboric. 2003, 29, 148–155. [Google Scholar]
- Brown, B.; Bentley, D. Residential burglars judge risk—The role of territoriality. J. Environ. Psychol. 1993, 13, 51–61. [Google Scholar] [CrossRef]
- Hoyle, H.; Hitchmough, J.D.; Jorgensen, A. All about the ‘wow factor’? The relationships between aesthetics, restorative effect and perceived biodiversity in designed urban planting. Landsc. Urban Plan. 2017, 164, 109–123. [Google Scholar] [CrossRef]
- Palmer, J.F. Residents Characterisation of Their Residential Greenspace Resource; Report to the Consortium for Environmental Studies; USDA Forest Service: Washington, DC, USA; SUNYESF: Syracuse, NY, USA, 1986. [Google Scholar]
- Parsons, R. Conflict between ecological sustainability and environmental aesthetics: Conundrum, canard or curiosity. Landsc. Urban Plan. 1995, 32, 227–244. [Google Scholar] [CrossRef]
- Altman, I. The Environment and Social Behavior; Brooks/Cole: Monterey, CA, USA, 1975. [Google Scholar]
- Stamps, A.E., III. Psychology and the Aesthetics of the Built Environment; Kluwer Academic/Plenum Publishers: New York, NY, USA, 2013. [Google Scholar]
Figure 1.
Examples of settings in different categories: (a) Examples of four possible situations resulting from the use of categories ‘with trees/without trees’ and ‘with shrubs/without shrubs’ (b) ‘High concealment effectiveness’ and ‘low concealment effectiveness’ settings (c) ‘Perceived high path use intensity’ and ‘perceived low path use intensity’ settings

Figure 2.
A model showing the impact of trees and shrubs on preferences, taking account of the mediation effect of perceived danger.
Figure 2.
A model showing the impact of trees and shrubs on preferences, taking account of the mediation effect of perceived danger.

Figure 3.
A model showing the impact of perceived path use intensity on preference, taking account of the mediation effect of perceived danger.
Figure 3.
A model showing the impact of perceived path use intensity on preference, taking account of the mediation effect of perceived danger.


Table 1.
The variables used in the study together with the questions used in the questionnaire.
| Variables | Measurement Method | |
|---|---|---|
| predictor variables | the presence/absence of trees | Category resulting from the selection of photos |
| the presence/absence of shrubs | Category resulting from the selection of photos | |
| effectiveness of concealment | Evaluation of the respondents (1–5) in answer to the question:‘Please imagine that you or someone else might want to hide behind the shrubs or trees you see. How do you rate such a hiding place for effectiveness?’ | |
| perceived path use intensity | Evaluation of the respondents (1–5) in answer to the question:Please rate to what extent the path you can see in the photo is used by people. Please give the highest rating to paths where in your opinion you are likely to encounter another user, and the lowest one—to paths which seem desolate and rarely used’ | |
| target variables | perceived danger | Evaluation of the respondents (1–5) in answer to the question:‘How dangerous is this setting? Please imagine you’re walking along such a path. How likely is it that you could be harmed in this setting?’ |
| preference | Evaluation of the respondents (1–5) in answer to the question:‘How much do you like the setting? This is your own personal degree of liking for the setting, and you don’t have to worry about whether you’re right or wrong or whether you agree with anybody else.’ | |
Table 2.
Pearson’s correlation coefficients for dependences between the four variables measured in the surveys among all subjects.
Table 2.
Pearson’s correlation coefficients for dependences between the four variables measured in the surveys among all subjects.
| Effectiveness of Concealment | Perceived Path Use Intensity | Perceived Danger | Preference | |
|---|---|---|---|---|
| Effectiveness of concealment | – | |||
| Perceived path use intensity | −0.37 ** | – | ||
| Perceived danger | 0.49 ** | −0.43 ** | – | |
| Preference | −0.19 ** | 0.26 ** | −0.26 ** | – |
** Significant correlation at 0.001 (bilaterally).
Table 3.
Pearson’s correlation coefficients for dependences between the four variables measured in the surveys by country.
Table 3.
Pearson’s correlation coefficients for dependences between the four variables measured in the surveys by country.
| Country | Effectiveness of Concealment | Perceived Path Use Intensity | Perceived Danger | Preference | |
|---|---|---|---|---|---|
| Effectiveness of concealment | China | - | |||
| Latvia | - | ||||
| Poland | - | ||||
| Perceived path use intensity | China | −0.36 ** | - | ||
| Latvia | −0.32 ** | - | |||
| Poland | −0.42 ** | - | |||
| Perceived danger | China | 0.49 ** | −0.46 ** | - | |
| Latvia | 0.41 ** | −0.38 ** | - | ||
| Poland | 0.57 ** | −0.44 ** | - | ||
| Preference | China | −0.30 ** | 0.34 ** | −0.40 ** | - |
| Latvia | −0.17 ** | 0.30 ** | −0.26 ** | - | |
| Poland | −0.12 ** | 0.12 ** | −0.10 ** | - |
** Significant correlation at 0.001 (bilaterally).
Table 4.
ANOVA test results for the regression model that predicts the level of perceived danger on the basis of effectiveness of concealment and perceived path use intensity.
Table 4.
ANOVA test results for the regression model that predicts the level of perceived danger on the basis of effectiveness of concealment and perceived path use intensity.
| F | p | R2 | |
|---|---|---|---|
| China | 362.98 | <0.001 | 0.33 |
| Latvia | 227.25 | <0.001 | 0.23 |
| Poland | 427.46 | <0.001 | 0.37 |
Table 5.
Unstandardized and standardized coefficients for the predictors included in the regression.
Table 5.
Unstandardized and standardized coefficients for the predictors included in the regression.
| Unstandardized Coefficients | Standardized Coefficients | t | p | |||
|---|---|---|---|---|---|---|
| B | SE | β | ||||
| China | Effectiveness of concealment | 0.33 | 0.02 | 0.37 | 16.13 | <0.001 |
| Perceived path use intensity | −0.33 | 0.02 | −0.33 | −14.25 | <0.001 | |
| Latvia | Effectiveness of concealment | 0.26 | 0.02 | 0.32 | 13.22 | <0.001 |
| Perceived path use intensity | −0.24 | 0.02 | −0.28 | −11.54 | <0.001 | |
| Poland | Effectiveness of concealment | 0.38 | 0.02 | 0.46 | 20.21 | <0.001 |
| Perceived path use intensity | −0.24 | 0.02 | −0.25 | −10.82 | <0.001 | |
Table 6.
ANOVA test results for the impact of the presence of trees and shrubs on perceived danger.
| Country | Effect | F | p | η2p |
|---|---|---|---|---|
| China | Trees | 3.12 | 0.08 | 0.00 |
| Shrubs | 316.06 | <0.001 | 0.18 | |
| Latvia | Trees | 17.83 | <0.001 | 0.01 |
| Shrubs | 200.40 | <0.001 | 0.12 | |
| Poland | Trees | 40.82 | <0.001 | 0.03 |
| Shrubs | 435.58 | <0.001 | 0.23 |
Table 7.
Marginal conditional means for perceived danger grouped by the presence of trees and shrubs.
Table 7.
Marginal conditional means for perceived danger grouped by the presence of trees and shrubs.
| Mean | Std. Error | N | |||
|---|---|---|---|---|---|
| China | Trees | Not present | −0.12 | 0.04 | 640 |
| Present | −0.11 | 0.04 | 800 | ||
| Shrubs | Not present | −0.63 | 0.04 | 560 | |
| Present | 0.40 | 0.03 | 880 | ||
| Latvia | Trees | Not present | −0.24 | 0.04 | 664 |
| Present | 0.04 | 0.03 | 830 | ||
| Shrubs | Not present | −0.47 | 0.04 | 581 | |
| Present | 0.28 | 0.03 | 913 | ||
| Poland | Trees | Not present | −0.38 | 0.04 | 640 |
| Present | 0.08 | 0.03 | 800 | ||
| Shrubs | Not present | −0.72 | 0.04 | 560 | |
| Present | 0.42 | 0.03 | 880 |
Table 8.
ANOVA test results for the impact of the presence of trees or shrubs on preference assessment.
Table 8.
ANOVA test results for the impact of the presence of trees or shrubs on preference assessment.
| Country | Effect | F | p | η2p |
|---|---|---|---|---|
| China | Trees | 73.06 | <0.001 | 0.05 |
| Shrubs | 167.02 | <0.001 | 0.10 | |
| Latvia | Trees | 33.95 | <0.001 | 0.02 |
| Shrubs | 139.79 | <0.001 | 0.09 | |
| Poland | Trees | 223.43 | <0.001 | 0.13 |
| Shrubs | 93.55 | <0.001 | 0.06 |
Table 9.
Marginal conditional means for perceived danger grouped by the presence of trees or shrubs.
Table 9.
Marginal conditional means for perceived danger grouped by the presence of trees or shrubs.
| Mean | Std. Error | N | |||
|---|---|---|---|---|---|
| China | Trees | Not present | −0.10 | 0.04 | 640 |
| Present | 0.24 | 0.04 | 800 | ||
| Shrubs | Not present | 0.46 | 0.04 | 560 | |
| Present | −0.33 | 0.03 | 880 | ||
| Latvia | Trees | Not present | −0.03 | 0.04 | 664 |
| Present | 0.17 | 0.04 | 830 | ||
| Shrubs | Not present | 0.43 | 0.04 | 581 | |
| Present | −0.29 | 0.03 | 913 | ||
| Poland | Trees | Not present | −0.35 | 0.04 | 640 |
| Present | 0.39 | 0.04 | 800 | ||
| Shrubs | Not present | 0.30 | 0.04 | 560 | |
| Present | −0.25 | 0.03 | 880 | ||
Table 10.
Standardized and unstandardized coefficient estimations for the mediation model.
| Direct Effects | |||||||
|---|---|---|---|---|---|---|---|
| R2 | B | S.E. | β | p | |||
| Perceived danger | 0.18 | <--- | Trees | 0.15 | 0.03 | 0.07 | <0.001 |
| <--- | Shrubs | 0.92 | 0.03 | 0.42 | <0.001 | ||
| Preference | 0.16 | <--- | Trees | 0.55 | 0.03 | 0.25 | <0.001 |
| <--- | Shrubs | −0.46 | 0.04 | −0.20 | <0.001 | ||
| <--- | Perceived danger | −0.19 | 0.02 | −0.19 | <0.001 | ||
| Indirect effect | |||||||
| Preference | <--- | Trees | −0.03 | 0.01 | −0.01 | <0.001 | |
| <--- | Shrubs | −0.18 | 0.02 | −0.08 | <0.001 | ||
| Total effect | |||||||
| Preference | <--- | Trees | 0.52 | 0.03 | 0.24 | <0.001 | |
| <--- | Shrubs | −0.63 | 0.03 | −0.28 | <0.001 | ||
Table 11.
Standardized and unstandardized coefficient estimations for the mediation model.
| Direct Effects | |||||||
|---|---|---|---|---|---|---|---|
| R2 | B | S.E. | β | p | |||
| Perceived danger | 0.18 | <--- | Perceived path use intensity | −0.41 | 0.01 | −0.43 | <0.001 |
| Preference | 0.09 | <--- | Perceived danger | −0.18 | 0.02 | −0.18 | <0.001 |
| Preference | <--- | Perceived path use intensity | 0.18 | 0.02 | 0.18 | <0.001 | |
| Indirect effect | |||||||
| Preference | <--- | Perceived path use intensity | 0.08 | 0.01 | 0.08 | <0.001 | |
| Total effect | |||||||
| Preference | <--- | Perceived path use intensity | 0.25 | 0.02 | 0.26 | <0.001 | |
© 2019 by the authors. Licensee MDPI, Basel, Switzerland. This article is an open access article distributed under the terms and conditions of the Creative Commons Attribution (CC BY) license (http://creativecommons.org/licenses/by/4.0/).
Share and Cite
MDPI and ACS Style
Lis, A.; Pardela, Ł.; Can, W.; Katlapa, A.; Rąbalski, Ł. Perceived Danger and Landscape Preferences of Walking Paths with Trees and Shrubs by Women. Sustainability 2019, 11, 4565. https://doi.org/10.3390/su11174565
AMA Style
Lis A, Pardela Ł, Can W, Katlapa A, Rąbalski Ł. Perceived Danger and Landscape Preferences of Walking Paths with Trees and Shrubs by Women. Sustainability. 2019; 11(17):4565. https://doi.org/10.3390/su11174565
Chicago/Turabian StyleLis, Aleksandra, Łukasz Pardela, Wu Can, Anna Katlapa, and Łukasz Rąbalski. 2019. "Perceived Danger and Landscape Preferences of Walking Paths with Trees and Shrubs by Women" Sustainability 11, no. 17: 4565. https://doi.org/10.3390/su11174565
Note that from the first issue of 2016, this journal uses article numbers instead of page numbers. See further details here.