The Rich Picture Method: A Simple Tool for Reflective Teaching and Learning about Sustainable Food Systems


1
World Food System Center, ETH Zurich, 8092 Zurich, Switzerland
2
Department of Environmental Systems Science, Grassland Sciences, ETH Zurich, 8092 Zurich, Switzerland
*
Author to whom correspondence should be addressed.
Sustainability 2019, 11(18), 4815; https://doi.org/10.3390/su11184815
Submission received: 24 July 2019
/
Revised: 27 August 2019
/
Accepted: 2 September 2019
/
Published: 4 September 2019
(This article belongs to the Special Issue Reflective Learning in Higher Education)
Abstract
:The World Food System Summer School is an innovative two-week course that seeks to develop the knowledge, skills and attitudes of the next generation of decision makers to build sustainable food systems. Meaningful learning, where the participant is able to relate new information to existing knowledge, is a critical part of education about complex systems and requires the integration of reflective approaches to teaching and learning. We adapted the rich picture method in three summer schools in Switzerland, South Africa and Côte d’Ivoire (74 participants with 29 nationalities) to support the reflection of participants on their knowledge gained on complex food systems. Coding and comparing 51 pairs of pre- and post-course pictures of food systems clearly demonstrated newly gained knowledge: The number of sub-categories drawn significantly increased from 11 to 19 in the post-course pictures, the largest increase occurred for environmental sustainability (57%). The rich picture method is a highly valuable and simple tool to gain insight into how participants’ knowledge changes and where there are gaps in meeting the learning objectives. This is particularly useful within a highly diverse participant cohort, as it allows participants to discuss and reflect on their own learning experience in a personalized way. Additionally, the rich picture method provides insights for faculty to improve their approaches to teaching on food systems.
1. Introduction
The challenges facing food systems today are complex and pressing. Creating a more sustainable food system requires us to work across diverse disciplines, sectors and scales—competencies that are not often the focus of traditional tertiary education programs [1]. Education in this space needs to support learners to build these competencies by acquiring and integrating new knowledge, skills and attitudes that enable successful task performance and problem solving as applied to real-world challenges at the interface of food systems and sustainability [1,2]. Although the overall application of these competencies is of critical importance for graduates of education programs in this space, as faculty we still have an interest in assessing the gain of component parts—namely knowledge, skills and attitudes and how they change as a result of an educational intervention. This information can support us to reflect on the program design and delivery and what participants from different backgrounds are learning.
Much like sustainability education, learning about food systems is complex and the assessment techniques used need to reflect this complexity [3]. This is particularly crucial when assessing knowledge gained as a result of a course. In How People Learn, a comprehensive synthesis of research on learning, the authors argue that effective learning environments should treat people as individuals, understanding that they have different states of initial knowledge, perceptions, culture, language and sense making processes [4]. Furthermore, knowledge should be considered as an interconnected structure that is continually expanded, organized and refined, and that the learning environment should help people understand this process [5]. How this knowledge is then evoked while solving a particular problem is strongly influenced by an individual’s own framing of the situation [5].
This makes assessing the knowledge gained as a result of an educational intervention challenging, particularly when the cohort is diverse in terms of cultural and disciplinary backgrounds. The challenge is similar when trying to gather an understanding of the knowledge and perspectives of multiple actors within a complex problem or issue. Rich pictures (RPs), developed as a part of Soft Systems Methodology (SSM), have been used in such situations for many years as a method to analyze a complex situation and define problems with a diverse group of actors [6]. The main developer of SSM, Peter Checkland, describes the approach as follows:
“Soft systems methodology (SSM) is an approach for tackling problematical, messy situations of all kinds. It is an action-oriented process of inquiry into problematic situations in which users learn their way from finding out about the situation, to taking action to improve it. The learning emerges via an organised process in which the situation is explored using a set of models of purposeful action (each built to encapsulate a single worldview) as intellectual devices, or tools, to inform and structure discussion about a situation and how it might be improved”.[7]
RPs, as one tool within this SSM, were originally developed to structure and frame problems in complex socio-technical systems, for example in development cooperation projects, government policy design, information system planning, engineering and health care [6]. RPs are simple in concept—they involve a small group of people collectively drawing a freehand diagram of a particular situation. They are a diagrammatic representation of a perspective of a complex situation that can include objects, ideas, people, feelings, conflicts and prejudices [8]. As outlined by Bell, Berg and Morse [9], RPs are very specific to the people who draw them, reflecting their own ways of thinking and contexts. They thus act as a visual thinking device and a representation of people’s perspectives of a situation.
Researchers working with RPs highlight that the value of this method is that it allows complexity to be captured in a way that is concise while still being rich in information [10]. Further, RPs allow elements to be captured that may never emerge in a verbal dialogue, such as spatial information, mood, symbolic meaning, relationships and emotions [11]. On this basis, we explored the potential to adapt this method and apply it within an educational setting that deals with complex systems, namely food systems and sustainability. Although usually applied in a group setting, with each RP drawn by a group of people, we employed the method as a tool for individual reflection of participants. With the exception of an example in Teaching on Information Systems from Horan [12], research on the use of RPs in an educational setting as a tool to understand knowledge gained as the result of a course is limited. In the work of Horan [12], the RP method was used as a tool to help people explore their understanding of the subject matter and how they were learning about it. The pictures were developed individually or in pairs and were used as a basis for people to reflect on and manage their own learning experience and to feed group discussions. Although this study was undertaken in the early 2000s, we were not able to identify any other examples of RPs being further evolved or researched in such a setting. Here, we adapted the application of the RP method, namely as a pre- and post-assessment of knowledge about the food system, completed by individual participants at the beginning and end of the course.
As there is no right or wrong depiction of a food system, each person’s version of it will be inherently connected to their worldview and experience [7]. Thus, the RP method is useful in this context as it does not capture a description of the “real world” but is simply a device to capture individual perspectives and observe changes of a person´s view. On this basis, we decided to utilize the RP method as a tool to assess how participants’ knowledge changes as a result of an educational intervention—in our case, a two-week intensive course on food systems involving diverse participants from a range of disciplines and cultures.
The World Food System Summer School was launched in 2013 to offer an innovative approach to training the next generation of food system decision makers. To date, the course has been run seven times in four different countries, training 169 participants, i.e., graduate-level university students and young professionals, from 49 different countries. It has been built around twelve design criteria [13] that aim to make the experience rigorous, meaningful and impactful for the participants. The design criteria include: the promotion of cross-cultural exchange and team work; an awareness of the context specificity of challenges and solutions; the application of systems thinking; interdisciplinary, cross-sectoral and values-based approaches; a blend of experience, theory and skill acquisition; an experimental approach to program design; an exploration of agency and power of diverse actors; and the appreciation of participants as producers and users of knowledge. The course is enriched by the inclusion of a diverse participant and faculty cohort and by hosting the experience in unique locations that offer first-hand engagement with food system issues. The entire program is structured around Kolb’s theory, outlining learning as a cyclical procedure involving concrete experience, reflective observation, abstract conceptualization and active experimentation [14].
As course designers, we have a specific interest in understanding, in a systematic way, the knowledge that participants gain during the course. This is challenging given the complex nature of food systems, the necessity to work across different disciplines, with multiple sectors and across different spatial and temporal scales, and the dynamic and diverse learning environment that we deliberately create. Such conditions make it inappropriate to apply a more traditional test with a pre-set list of questions only in written form. For this reason, we decided to conduct a pre- and post-course knowledge test for individual participants using RPs that allows them to individually capture their baseline understanding of the system and then reflect on and communicate how this understanding has changed. The RP tool has two purposes: (1) to provide participants with a structured process to reflect on what they have learned from a content perspective and (2) to support the faculty to understand what participants have learned and feed this back into the development of future courses.
The overall objective of this paper is to assess the efficacy of the RP as a tool in this context—firstly, as a means to investigate the knowledge gained by participants in the course; secondly, to explore how this information can be used in a reflective process to inform future course design and teaching. We conclude that, despite some limitations, the RP method is a highly valuable and simple tool to gain insight into how participants’ knowledge has changed. It is thus also helpful to guide changes to the course or session design, including how other reflection methods are linked to the RP method. We have initial feedback from participants regarding the value of this tool for their own reflection. However, further research is needed to explore in more detail the participant perspectives on the RP method as a tool for their own reflective learning.
2. Materials and Methods
We began applying the RP method in 2016, the fourth year of running the World Food System Summer School courses. We conducted the RP method in the 2016 course in Switzerland, in the 2017 course in South Africa, and in the 2018 course in Côte d’Ivoire. Although each course followed a similar concept and framework, each context, cohort of participants and program was unique (Table 1). We developed a protocol for conducting the RP method with the participants, and it was administered by the same faculty member each time to ensure consistent execution.
For each summer school, we collected data at two points in time—pre-course and post-course. This translated to conducting the RP method on the very first and very last day of the course. The pre-course RPs were constructed just after the participants arrived, to ensure that we were collecting their baseline knowledge before any course inputs. Following the initial welcome and logistics overview, the participants were each provided with an empty sheet of paper (DIN A4) and a single colored felt pen. They were given 15 min to work individually and in silence to draw a picture of the food system, as they understood it at that exact point in time. They were specifically told to rely on images as much as possible, keeping text to a minimum and to use only one color felt pen. Participants were requested to add their first name, date and course to the back of the drawing.
At the end of the 15 min, the participants were broken into small groups together with a facilitator from the faculty team. During the next 20–30 min, the group went around one by one, explaining their picture and what was drawn. The facilitator made notes to support the interpretation of each of the pictures, and participants had the opportunity to discuss with one another questions or insights that arose. In this sense, the activity itself also provided the first content input, through being able to discuss and learn from the drawings of other participants.
Following the group discussions, the lead faculty collected all the pictures for safe keeping until the end of the course. At this point, a scan was made of each picture to capture the baseline picture. On the final day of the course, after the official program was finished, the same process was repeated (post-course RP). This time, the participants were given back their picture they had drawn on the first day of the course and instructed to take another color felt pen and add anything they had learned during the course. They were also allocated 15 min for this process.
The timing of the RP activity was important to make sure that the data represented the baseline at the beginning of the course and status at the end of the course. This created the challenge that any participant who arrived late or left early due to travel restrictions did not draw both pictures. In total, we collected 132 RPs from the three summer school cohorts. Among these were 56 pairs of completed pre- and post-course pictures. The remainder of the pictures were either pre- or post-course pictures of participants who arrived late to the courses or left early. We also collected auxiliary information about all summer school participants, namely gender, the highest degree obtained, and the field of study (natural or social sciences).
The RPs were anonymized before coding and analysis. For coding of the RPs, a set of six food system categories was defined, i.e., value chain, outcomes, actors, system elements, boundaries, and special topics, based on the key elements of food systems [15]. These six categories were further divided into a total of 38 sub-categories (see Table 3). The categories were linked to one of the knowledge-related learning objectives of the course, namely to understand food systems and their outcomes and challenges. The pictures were also scanned for emergent categories that were not included in this initial list. The (sub-)category definition process was conducted by two of the course faculty. Presence or absence of each sub-category in all RPs was coded as 1 or 0, respectively. All pictures were coded by the same person, a second person was consulted in cases of doubt. In cases where interpreting the drawn elements presented in the RPs was not possible without making many assumptions, therefore making coding arbitrary, the picture was not included in the analysis. Thus, after coding, a total of 51 pairs of RPs were analyzed.
For an initial analysis of the coded data, we computed a presence/absence (1/0) variable for each of the six categories, based on the presence or absence of sub-categories in the respective category. We summed up the number of categories represented in each picture and calculated the difference in the number of categories in the post-compared to the pre-course RPs for each pair (i.e., for each participant). Additionally, the average of this presence/absence variable represents the proportion of pictures that included drawn elements of the respective category. The number of categories in pre- and post-course pictures, the difference in categories represented in the RPs as well as the proportion of pictures containing elements of the different categories were used to broadly assess in which elements of the food system knowledge gain was highest. Similar to the categories, we also summed up the total number of sub-categories represented in each picture and calculated the difference in the number of sub-categories in the post-compared to the pre-course picture for each pair (i.e., participant). This difference was used as a proxy for overall food system knowledge gained in the course.
To identify sub-categories with a particularly low or high knowledge gain, we calculated the proportion of pictures containing each sub-category for the pre- and post-course pictures. This then allowed us to identify areas that could be given more emphasis in future courses to improve the food systems understanding of participants even further. Statistics were run using the R software version 3.6.0 Patched [16]. A generalized linear model (adjusted to the Poisson distribution) was used to test for differences between pre- and post-course pictures. To analyze the full dataset, we used a generalized linear model with course cohort, gender, highest degree, and field of studies as explaining variables.
3. Results
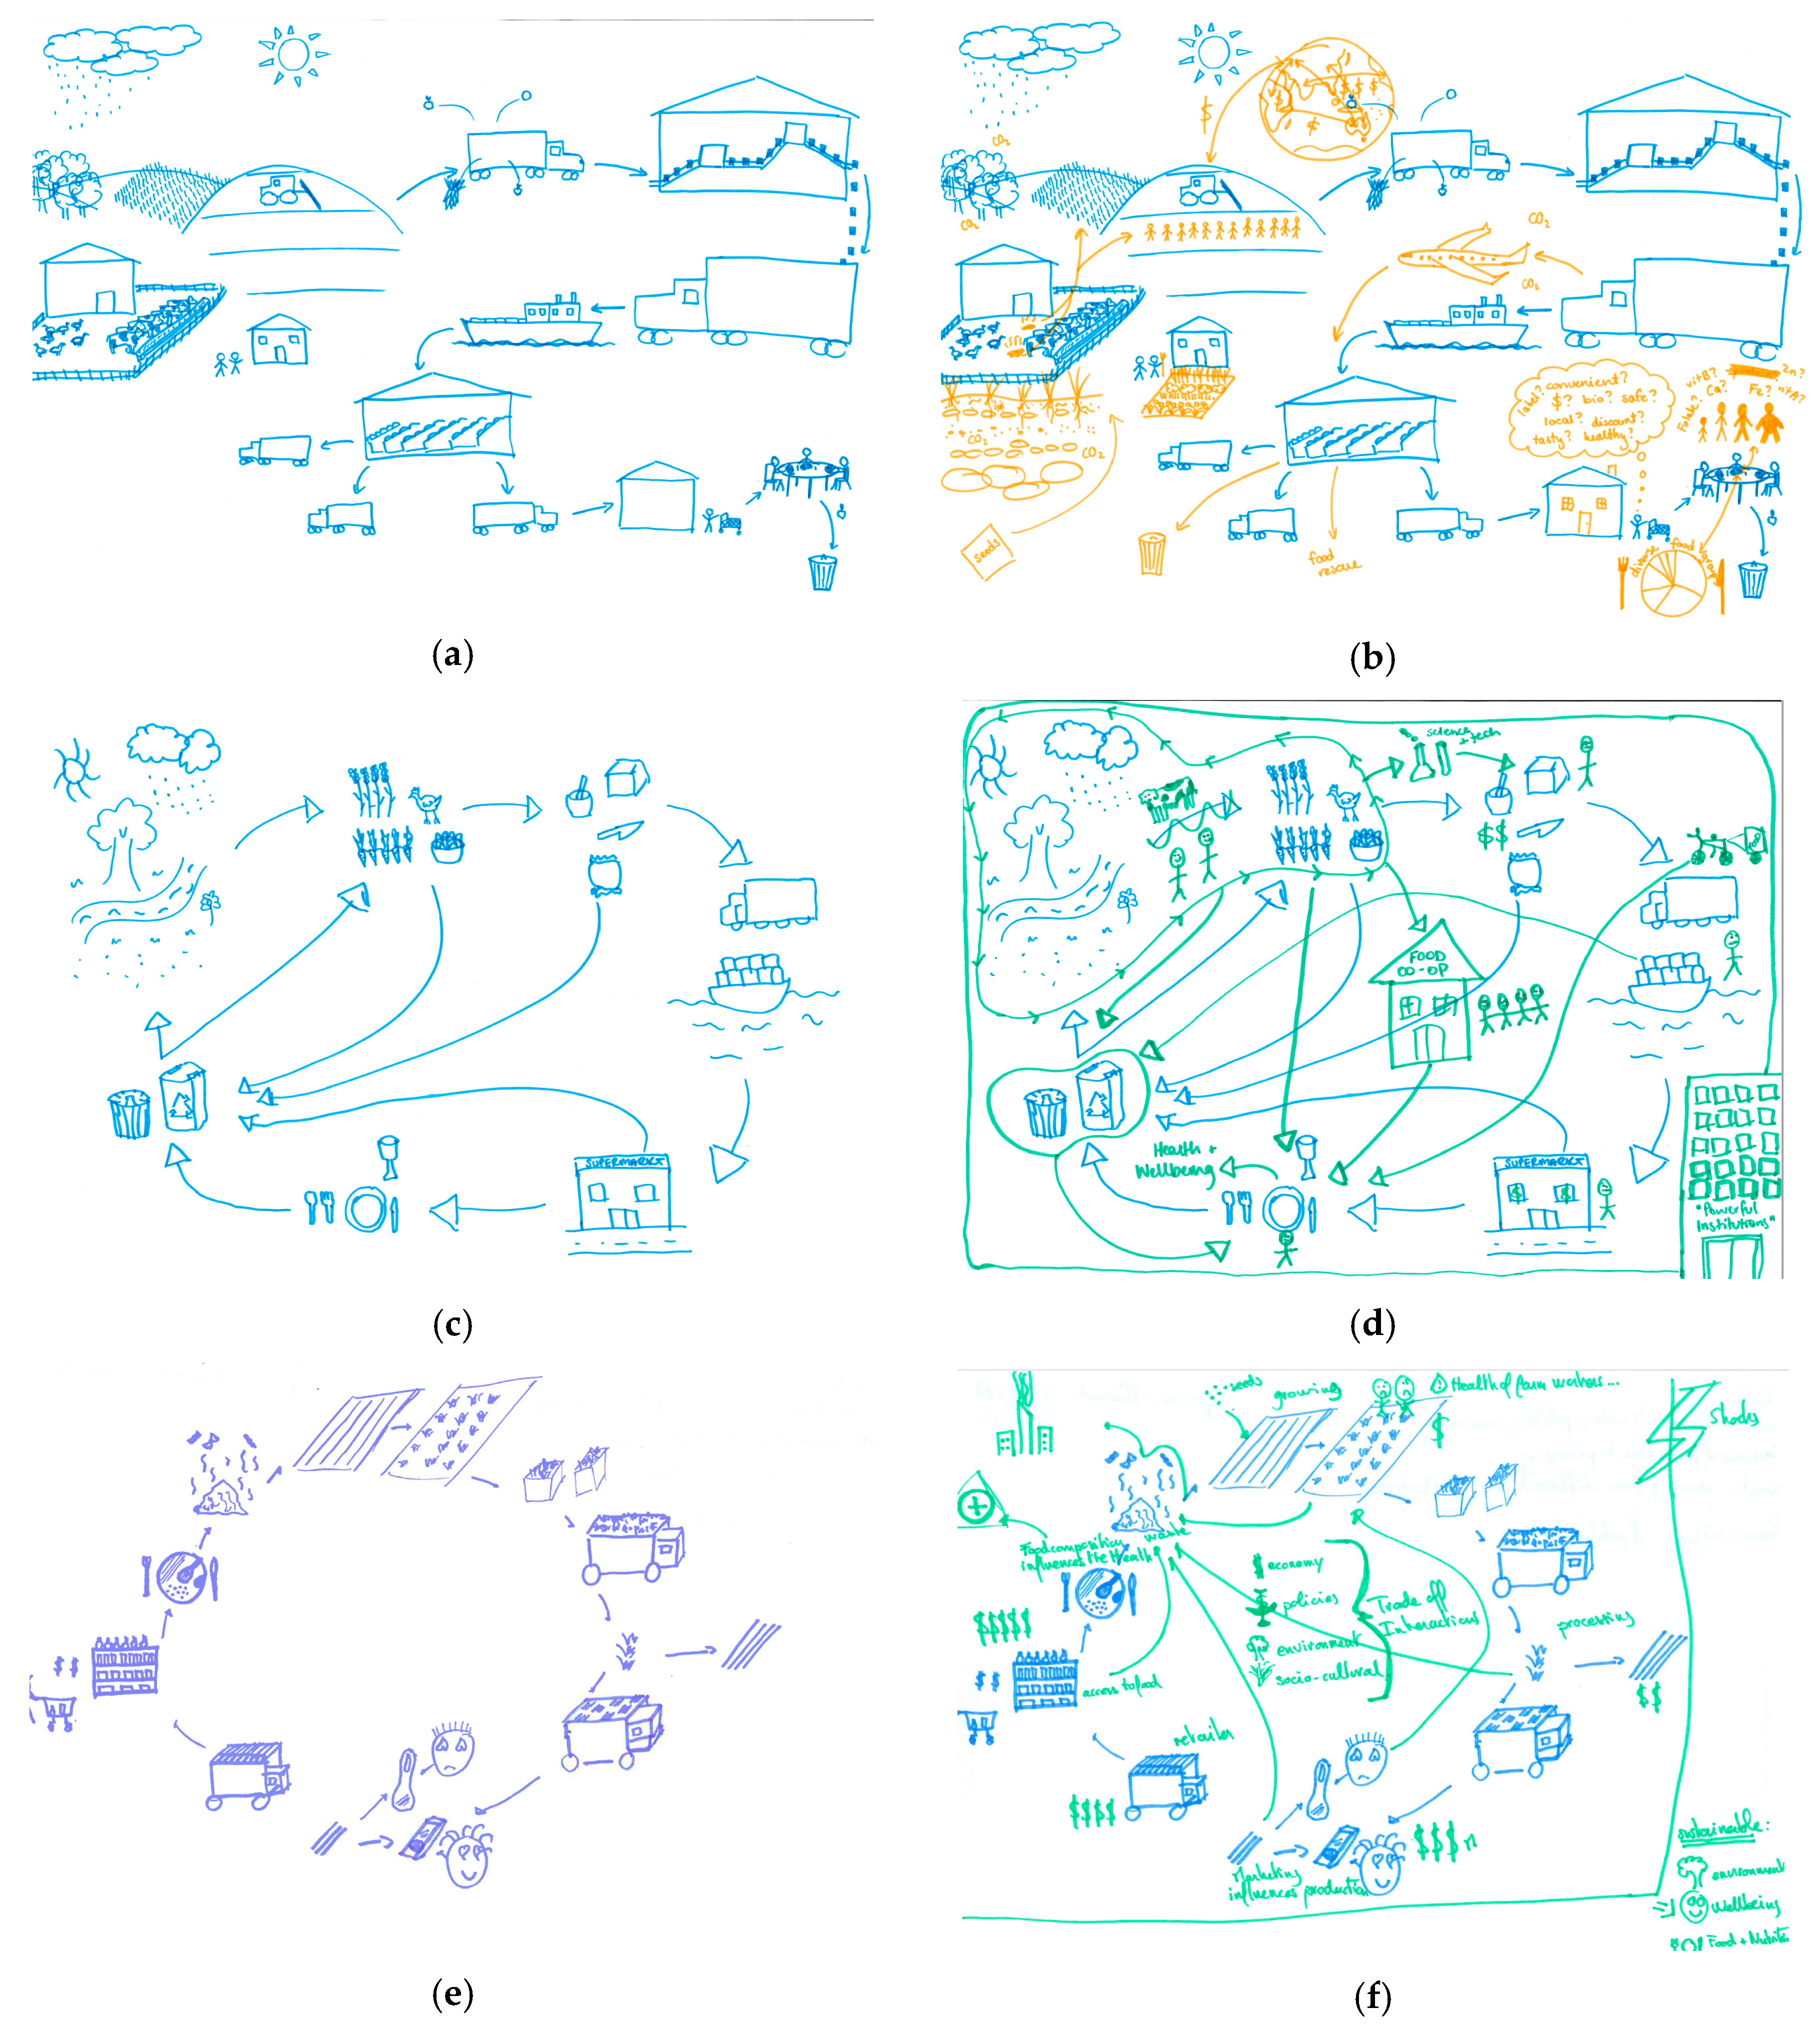
The participants fully engaged with the RP method and drew (and later added) their knowledge about food systems within the allotted time (for examples of RP pairs, see Figure 1). The number of overarching categories represented in the RPs increased from an average of 3.73 (±0.15 SE) in the pre-course pictures to 5.31 (±0.11 SE) in the post-course pictures (Table 2). The six categories of the food system were not equally represented in the RPs, particularly in those before the course. The value chain was the only category represented in all the pre-course pictures, i.e., the pre-course pictures all contained at least one sub-category of the value chain. Also actors were almost always represented (overall mean of 96%; Table 2). All other categories of the food system were represented less in the pre-course pictures. While system elements and boundaries were represented in considerably more than 50% of the pre-course pictures (in approximately 70%), specific topics were represented in approximately one-quarter of the pre-course pictures, and outcomes were only represented in 18% of the pre-course pictures. On average, all six categories were better represented in the post-course pictures (except for the value chain and the actors, which were already well represented in all the pre-course pictures; Table 2).
Over all three courses, 18.96 (±0.57 SE) sub-categories were represented in the post-course pictures, while only 11.02 (±0.51 SE) sub-categories were depicted in the pre-course pictures. Thus, course participants added on average 7.94 sub-categories (±0.45 SE), which is a significant increase in sub-categories represented in the picture after taking the summer school course compared to before the course (p = 0.019; Table 2). Neither summer school cohort, nor gender, highest degree or field of study of the participants had a significant effect on the difference in the number of sub-categories represented in the pre- and post-course pictures (p > 0.09).
The average representation of the different sub-categories in the pre-course pictures varied between 0 for the representation of actors from international organizations and 98% for the agricultural part of the value chain (Table 3). The majority of the summer school participants (i.e., more than 50%) included the value chain elements agriculture, transport and storage, processing and packaging, retail, consumption and resource inputs in their pre-course pictures. Farmers and consumers (from the actor category) were also represented in the majority of the pre-course pictures as well as some representation of interactions (from the system elements category). All other sub-categories were represented in less than 50% of the pre-course RPs. We observed very limited representation of special topics (like organic agriculture, diversity or labels), certain actor sub-categories (like non-governmental organizations and international organizations) and food system outcomes in the pre-course pictures (Table 3).
As a result of the course, the proportion of RPs containing a particular sub-category increased between 2% for the agricultural part of the value chain (that already had the highest representation in the pre-course pictures) and 57% for the food system outcome environmental sustainability. A number of sub-categories were substantially better represented in the post-course RPs, with representation increasing by more than 30% compared to the pre-course RPs. These were in particular sub-categories of the food system outcomes and the food system boundaries but also workers (from the actor category) and waste and losses (from the value chain category; Table 3).
4. Discussion
This research explored the suitability of the RP method as a tool for understanding the knowledge gained by participants in an intensive two-week summer school course and to support faculty in reflecting on the course design and teaching. To our knowledge, this study is the first to apply the RP method to teaching about food systems. The results of the RP analysis gave detailed insights into the knowledge categories for which significant changes were observed as a result of the course. At the beginning of the course, there were nine sub-categories present in the majority of the RPs drawn by participants (indicated by presence in >50% of RPs). These were sub-categories representing key elements of the food value chain (namely agriculture, transport and storage, processing and packaging, retail, consumption and resource inputs) as well as farmers, consumers and some system interactions. This highlighted that the knowledge most participants had when they came into the summer school course was based on a rather simple concept of what a food system is, with little reference made to the intended outcomes of the system, the diversity of actors involved, the boundary conditions it is embedded in or the forces that shape it. Based on the post-course RPs, there was a substantial increase in knowledge in nine sub-category areas, namely the three key food system outcomes (food and nutrition security, social wellbeing, and environmental sustainability), the four food system boundaries that influence how food systems function (environmental, social, political and economic boundaries), food waste and losses, and farm workers as actors in the system. Thus, using the RP method, the faculty was able to easily identify if one of the key learning objectives of the course, i.e., to explain the elements of a food systems, the desired outcomes and the challenges, was achieved.
There were also a large number of sub-categories for which there were no substantial differences in knowledge before and after the course. This included agriculture, which was depicted in 98% of all pre-course RPs and added in the post-course RPs by the remaining 2% of participants, or consumption, present in 88% of pre-course and 96% of post-course RPs. Further, some sub-categories were not often present in either the pre- or post-course RPs. These included a large number of the possible actors that could have been included, the depictions of scales and tradeoffs as a part of the system, as well as special topics like labels. It remains unclear why these latter sub-categories were not included. It may be that the participants gained new knowledge on these aspects, however considered it less relevant for a general, i.e., hypothetical food system, or that they simply found it too difficult to draw. Alternatively, it could be that these participants did not learn or retain any new knowledge on these topics. As outlined by Schneider and Stern [17], there are many factors that need to optimally interact for learning to occur, the knowledge a person has can only be directly assessed by this person and is only made sense of when interpreted in the light of prior knowledge. This means that to understand in detail why certain sub-categories were omitted we would need more detailed data from each individual, which is not possible to gather for all participants due to limited resources (namely, time and faculty). In this sense, the RP method allowed us to collect high-level information from all participants that indicated the knowledge at the forefront of each participant’s cognition at the end of the course.
From the perspective of the course faculty, a number of sub-categories were more important to be conveyed during the teaching program than others. For example, the understanding of food system outcomes and boundary conditions as well as their interactions, was a key part of the food systems concept explored in the courses. The analysis of the RPs indicated a substantial lack of knowledge in all these areas before the course which were closed with the course, clearly indicating that the course was successful in building knowledge in these areas. Another sub-category that was very under-represented in the pre-course RPs was the diverse range of actors within the food system. The post-course RPs saw a substantial increase in participants including farm workers as actors, in addition to the farmers who were often already depicted in the pre-course RPs. However, there was a large number of other actors and institutions in the system which were still not widely depicted in the post-course RPs, despite the role of these actors being explored in the program and integrated into interactive activities like stakeholder mapping. Although it is not our expectation that the final post-course RPs include an exhaustive mapping of all actors, their absence in the post-course RPs helps faculty reflect on why this may be the case, and consider how this could be better embedded in the program. Regardless, the addition of farm workers was a very positive step considering that the majority of participants came from a natural sciences background and had not been exposed to many social science topics.
Moreover, this change in the RPs clearly demonstrated a knowledge gain by the participants, which would have potentially gone unnoticed to the faculty without the employment of the RP method. Assessment methods in higher education are often ‘feedout’ (rather than ‘feedback’) in nature, in that the main objective is to grade people at the end of the course to act as a performance indicator for faculty and future employers or admission departments [18,19]. Grades from such assessment methods, typically in the form of exams or end of course assignments, often do not reflect the amount of learning occurring among the people during a course [18]. The RPs could be considered an alternative to this, a type of Classroom Assessment Technique (CAT), which is carried out for the purpose of learning and not for grading [20]. In this manner, the RP offers a tool to gain insight into what people are learning and to collect information in a manner that can be personalized yet broadly interpreted. Importantly, it has the nature of a pretest/posttest, which helps establish knowledge gain in the context of prior knowledge [21].
Our experience with the RP has highlighted it is a method that is aligned with several of the ten cornerstone findings from cognitive research on learning outlined by Schneider and Stern [17]. Firstly, it allows participants to create the new knowledge structures themselves, as they are completely free to draw and amend their diagram how they choose. Secondly, it allows the participants to make sense of new information by linking it to prior knowledge. By amending their pre-course RPs, they are making sense of new information by interpreting it against their prior knowledge. The RP also helps participants to create relationships between the individual pieces of knowledge they acquire in the course, which is a requirement for successful learning [17]. Constructing the RPs requires the drawer to break down a complex system into its component parts, which can also help support the learning process. Thus, although we did not directly collect data from the perspective of the participants regarding if and how the RPs supported their reflection on their knowledge gained, considered from the cognitive perspective of learning, the method has the additional role of supporting their learning process through reflection. This is supported by a substantial amount of anecdotal evidence from participants, in the form of verbal feedback to faculty, that they found this tool a very useful method to gauge their own learning and to capture the new knowledge they gained.
The insights from the analysis of the RPs has also informed the course design in terms of how participant reflection should be integrated into the course. In the last couple of courses, we thus have increased the number of reflective sessions with the participants and begun to trial a number of different formats to help them reflect on what they are learning at more regular intervals. We do this through a number of methods, for example daily journaling, daily plenary discussions on “What are we learning?”, back reflection sessions, and reflective artwork or creativity, which allow participants to reflect more broadly on their overall experience. This includes not only the knowledge participants are gaining, but also the skills they are building, values and attitudes they are developing as well as capturing anything that is coming up for them emotionally and psychologically during this intensive learning experience. We now see an opportunity to better link these intermittent activities to the final RP activity, so that this acts as a recap and culmination of what is being learned, rather than as a stand alone activity. Reflecting on the RP as a form of CAT, we identified that it could also be valuable to do the updates to the RPs at regular intervals during the course. This would offer an additional reflection tool for the participants during the course, and would allow faculty to evaluate these assessments and adapt the program in real time based on any gaps that are identified. This could also result in participants having a “richer” RP at the end of the course that they could refer back to.
To date, the RPs have been collected by faculty at the end of each course to be analyzed. Participants had the opportunity to take a photo of their picture if they wished. In the future, it could be beneficial to email a copy of the picture to each participant at a certain timepoint after the end of the course. In this way, the picture can act as a reminder of what they learned during the course, but participants could also be encouraged to use it as a template to continually add to as they learn more about the system. In this sense, it would help to better communicate that there is no “end point” per se to a RP, and the learning process. The picture can continually be iterated and used as a tool to capture new knowledge beyond the end of the course. In this way, the RP supports the understanding of knowledge as an interconnected structure that is continually expanding [5].
Through a structured analysis of the RPs, we were able to better understand the key areas where participants gained knowledge, and this helped us as faculty to reflect on which parts of the course were delivering the intended learning, and which parts needed further development. Interestingly, the comprehensive analysis of the RPs across three cohorts reinforced the information that faculty had picked up from informally reviewing the RPs at the time they were drawn. This experience encourages us to continue using the RPs without a comprehensive coding and analysis as a way to gauge the knowledge of the participants as they come into the course, and to understand what knowledge was gained or where there were gaps. As a process, it was helpful for faculty to see, very broadly, what messages came across, where there was room for improvement and how that can be designed into the course and associated reflection sessions.
Interestingly, the analysis indicated that the summer school cohort, gender, or field of study had no significant impact on the number of additional sub-categories in the post-course compared to the pre-course pictures. This showed that despite differences in courses and participant backgrounds, using our course design principles [13], it was possible to create a learning environment and course program that benefited all participants in terms of increasing their knowledge of food systems.
The implementation and analysis of the RPs also allowed the identification of a number of limitations of this method as a tool to determine knowledge gained over the course. Firstly, by adding to the picture that was drawn at the beginning of the course, the participants were structurally constrained to the framing of the system as they originally understood it. Although they were able to completely change it, the time restraints and the point in time when it was undertaken (at the very end of the course) made it less likely that they did so since this activity coincided with the wrapping up of an intense two-week course and the process of closing a social dynamic that had been built. This means it was difficult time to keep the attention of the participants and, as faculty, we often found ourselves constrained by time pressure to get through the full day of closing the course. This has meant there was never adequate time to discuss the changes to the pictures in great depth, which would provide additional data to support the interpretation of the pictures. From this insight we could identify a need in future courses to allocate and structure time at the end of the course to do a collective reflection on lessons learned with the group, based on their individual pictures. Further, we see the RPs offering a good opportunity to discuss more openly with participants around questions of worldview, how we know what we know, and how any situation is perceived differently by different actors. Time for participants to sit together and compare their pictures and discuss these questions could potentially be valuable at the end of the course. In order to reintroduce the original conceptualization of the RPs as a participatory process, we could also have participants collectively draw a new RP at the end of the course, using it as an opportunity to explore knowledge, understanding, perspectives, values and blind spots, as well as to reflect on how they know what they have learned by attending the course. This more nuanced discussion may also give faculty additional information which can help in the interpretation of the RPs drawn by participants.
As has been extensively written about by Bell, Berg and Morse [6], the interpretation and sense making of RPs by a third party is inherently challenging. We took an approach of coding categories based on one of the key learning objectives of our summer school, thus identifying changes against a predetermined set of themes. This helped to obtain a high-level overview. However, this might mean that we lost the nuanced information in each individual picture. It could be interesting in the future to apply a form of content analysis called ‘Educative Interpretation’ proposed by Bell, Berg and Morse [6], where emergent themes are identified from the diagrams themselves. Either way, there is substantial risk of misinterpretation, subjectivity or bias on the part of the coder, even when great care is taken to avoid these things. Essentially, we are still interpreting the creative work of others which is always challenging without extensive dialogue with the creator of the work.
Generally speaking, we have found the RP method to be an effective and simple way to assess the knowledge gained by participants as a result of the educational experience they have during our two-week course. Although it has a number of limitations, it has allowed us to obtain a high-level overview of what knowledge participants have when they come into the course, what knowledge they have when they leave, and to identify any gaps where we may need to adapt the content and methods in the course. Additionally, this method is valuable as a reflective tool for participants to consider and structure what they are learning from a content perspective. This needs to be supplemented with additional reflective methods to allow the participants to consider learnings beyond only knowledge to include skills, attitudes, values and their own role in creating change. It would be valuable for future research to further explore the efficacy of this method as a tool for reflection for participants’ learning in and about other complex systems. In our experience, the RP method is a simple tool that works very well to support both reflective teaching and reflective learning in food systems education and we recommend its use in the sustainability education space.
Author Contributions
This study was conceptualized by N.B. and M.G.; M.G. was responsible for the methodology and the implementation of the method during the summer schools; M.G. and A.K.G. carried out the data analysis; M.G. and A.K.G. wrote the first draft; M.G., A.K.G. and N.B. finalized the paper; M.G. and A.K.G. were responsible for project administration; N.B. and M.G. acquired the funding.
Funding
This research was funded by the Swiss National Science Foundation through the project Delivering Food Security on Limited Land within the NRP 68 and FACCE JPI (grant number 40FA40_160406).
Acknowledgments
We thank Aimee Shreck for her contribution to and discussion on the original design of the study. Special thanks go to all summer school participants for their great motivation and engagement.
Conflicts of Interest
The authors declare no conflict of interest. The funders had no role in the design of the study; in the collection, analyses, or interpretation of data; in the writing of the manuscript, or in the decision to publish the results.
References
- Wiek, A.; Withycombe, L.; Redman, C.L. Key competencies in sustainability: A reference framework for academic program development. Sustain. Sci. 2011, 6, 203–218. [Google Scholar] [CrossRef]
- Baartman, L.K.J.; de Bruijn, E. Integrating knowledge, skills and attitudes: Conceptualising learning processes towards vocational competence. Educ. Res. Rev. 2011, 6, 125–134. [Google Scholar] [CrossRef]
- McKeown, R. Using rubrics to assess student knowledge related to sustainability: A practitioner’s view. J. Educ. Sustain. Dev. 2011, 5, 61–74. [Google Scholar] [CrossRef]
- How People Learn: Brain, Mind, Experience, and School; Bransford, J.D.; Brown, A.L.; Cocking, R.R. (Eds.) National Academy Press: Washington, DC, USA, 1999. [Google Scholar]
- Beatty, I.D.; Gerace, W.J. Technology-enhanced formative assessment: A research-based pedagogy for teaching science with classroom response technology. J. Sci. Educ. Technol. 2009, 18, 146–162. [Google Scholar] [CrossRef]
- Bell, S.; Berg, T.; Morse, S. Towards an understanding of rich picture interpretation. Syst. Pract. Act. Res. 2019, 1–14. [Google Scholar] [CrossRef]
- Checkland, P.; Poulter, J. Soft systems methodology. In Systems Approaches to Managing Change: A Practical Guide; Reynolds, M., Holwell, S., Eds.; Springer: London, UK, 2010; pp. 191–242. ISBN 978-1-84882-809-4. [Google Scholar]
- Cristancho, S.; Bidinosti, S.; Lingard, L.; Novick, R.; Ott, M.; Forbes, T. Seeing in different ways: Introducing “rich pictures” in the study of expert judgment. Qual. Health Res. 2015, 25, 713–725. [Google Scholar] [CrossRef] [PubMed]
- Bell, S.; Berg, T.; Morse, S. Rich Pictures: Encouraging Resilient Communities; Routledge: London, UK, 2016; ISBN 978-131-570-839-3. [Google Scholar]
- Bell, S.; Morse, S. Rich pictures: A means to explore the ‘sustainable mind’? Sustain. Dev. 2013, 21, 30–47. [Google Scholar] [CrossRef]
- Booton, C.M. Using rich pictures to verify, contradict, or enhance verbal data. Qual. Rep. 2018, 23, 2835–2849. [Google Scholar]
- Horan, P. Using rich pictures in information systems teaching. In ICSTM2000, International Conference on Systems Thinking in Management, Geelong, Australia, 8–10 November 2000; CEUR Workshop Proceedings 72; RWTH Aachen University: Aachen, Germany, 2000; Available online: http://ceur-ws.org/Vol-72 (accessed on 27 August 2019).
- Grant, M.; Shreck, A.; Buchmann, N. Tackling food system challenges through experiential education: Criteria for optimal course design. GAIA 2018, 27, 169–175. [Google Scholar] [CrossRef]
- Kolb, D. Experiential Learning: Experience as the Source of Learning and Development, 2nd ed.; Pearson Education: Upper Saddle River, NJ, USA, 2015; ISBN 0132952610. [Google Scholar]
- Grant, M. A food systems approach for food and nutiton security. Sight Life 2015, 29, 84–87. [Google Scholar]
- R Core Team. R: A language and Environment for Statistical Computing; R Foundation for Statistical Computing: Vienna, Austria, 2019. [Google Scholar]
- Schneider, M.; Stern, E. The cognitive perspective on learning: Ten cornerstone findings. In The Nature of Learning: Using Research to Inspire Practice; Dumont, H., Istance, D., Benavides, F., Eds.; OECD Publishing: Paris, France, 2010; pp. 69–90. [Google Scholar]
- Astin, A.W.; Antonio, A.L. Assessment for Excellence: The Philosophy and Practice of Assessment and Evaluation in Higher Education, 2nd ed.; Rowman & Littlefield/American Council on Education: Lanham, MD, USA, 2012. [Google Scholar]
- Knight, P.T. Summative assessment in higher education: Practices in disarray. Stud. High. Educ. 2002, 27, 275–286. [Google Scholar] [CrossRef]
- Walker, D.-M. Classroom assessment techniques: An assessment and student evaluation method. Creative Educ. 2012, 03, 903–907. [Google Scholar] [CrossRef]
- Delucchi, M. Measuring student learning in social statistics: A pretest-posttest study of knowledge gain. Teach. Sociol. 2014, 42, 231–239. [Google Scholar] [CrossRef]
Figure 1.
Pairs of rich pictures (RPs) drawn by participants in the World Food System Summer School. (a,c,e) were drawn before the start of the course (pre-course), while (b,d,f) were drawn at the conclusion of the course (post-course). Note that pre- and post-course RPs were scanned with different devices, leading to some discrepancies in colors.


Table 1.
Overview of the three summer school cohorts.
| Course Year | Course Location | Number of Participants | Approximate Number of Disciplines | Number of Nationalities |
|---|---|---|---|---|
| 2016 | Switzerland | 23 | 18 | 17 |
| 2017 | South Africa | 25 | 12 | 17 |
| 2018 | Côte d’Ivoire | 26 | 9 | 14 |
Table 2.
Average number of categories (±standard error) and proportion of categories represented in pre- and post-course pictures (±standard error) as well as average number of sub-categories represented in pre- and post-course pictures (±standard error) over all three summer school courses and for each of the three courses separately. N = 17, 18, and 16 in 2016, 2017 and 2018, respectively. SE: standard error.
| Overall | 2016 | 2017 | 2018 | |||||
|---|---|---|---|---|---|---|---|---|
| Mean | SE | Mean | SE | Mean | SE | Mean | SE | |
| Number of categories present in pre- and post-course pictures | ||||||||
| Number of categories pre-course | 3.73 | 0.15 | 4.18 | 0.29 | 3.61 | 0.26 | 3.38 | 0.20 |
| Number of categories post-course | 5.31 | 0.11 | 5.59 | 0.15 | 5.39 | 0.16 | 4.94 | 0.21 |
| Difference in number of categories (post-course–pre-course) | 1.59 | 0.15 | 1.41 | 0.30 | 1.78 | 0.24 | 1.56 | 0.22 |
| Share of pictures containing one or more sub-categories of the respective category pre-course | ||||||||
| Value Chain | 1.00 | 0.00 | 1.00 | 0.00 | 1.00 | 0.00 | 1.00 | 0.00 |
| Outcomes | 0.18 | 0.05 | 0.24 | 0.11 | 0.28 | 0.11 | 0.00 | 0.00 |
| Actors | 0.96 | 0.03 | 0.94 | 0.06 | 0.94 | 0.06 | 1.00 | 0.00 |
| System Elements | 0.67 | 0.07 | 0.82 | 0.10 | 0.61 | 0.12 | 0.56 | 0.13 |
| Boundaries | 0.69 | 0.07 | 0.82 | 0.10 | 0.56 | 0.12 | 0.69 | 0.12 |
| Special Topics | 0.24 | 0.06 | 0.35 | 0.12 | 0.22 | 0.10 | 0.13 | 0.09 |
| Share of pictures containing one or more sub-categories of the respective category post-course | ||||||||
| Value Chain | 1.00 | 0.00 | 1.00 | 0.00 | 1.00 | 0.00 | 1.00 | 0.00 |
| Outcomes | 0.84 | 0.05 | 0.88 | 0.08 | 0.89 | 0.08 | 0.75 | 0.11 |
| Actors | 1.00 | 0.00 | 1.00 | 0.00 | 1.00 | 0.00 | 1.00 | 0.00 |
| System Elements | 0.88 | 0.05 | 0.94 | 0.06 | 0.94 | 0.06 | 0.75 | 0.11 |
| Boundaries | 0.98 | 0.02 | 0.94 | 0.06 | 1.00 | 0.00 | 1.00 | 0.00 |
| Special Topics | 0.61 | 0.07 | 0.82 | 0.10 | 0.56 | 0.12 | 0.44 | 0.13 |
| Number of sub-categories present in pre- and post-course pictures | ||||||||
| Number of sub-categories pre-course | 11.02 | 0.51 | 11.82 | 0.94 | 11.11 | 0.78 | 10.06 | 0.92 |
| Number of sub-categories post-course | 18.96 | 0.57 | 20.88 | 1.06 | 18.39 | 0.83 | 17.56 | 0.91 |
| Difference in number of sub-categories (post-course–pre-course) | 7.94 | 0.45 | 9.06 | 0.91 | 7.28 | 0.66 | 7.50 | 0.76 |
Table 3.
Average representation of sub-categories in the pre- and post-course pictures as well as the average proportion of participants adding the sub-categories to their pictures after the course (i.e., difference in post- minus pre-course picture). SE: standard error.
Table 3.
Average representation of sub-categories in the pre- and post-course pictures as well as the average proportion of participants adding the sub-categories to their pictures after the course (i.e., difference in post- minus pre-course picture). SE: standard error.
| Categories | Sub-Categories | Pre-Course | Post-Course | Difference (Post-Course‒Pre-Course) | |||
|---|---|---|---|---|---|---|---|
| Average | SE | Average | SE | Average | SE | ||
| Value Chain | Agriculture | 0.98 | 0.02 | 1.00 | 0.00 | 0.02 | 0.02 |
| Transport and Storage | 0.65 | 0.07 | 0.80 | 0.06 | 0.15 | 0.05 | |
| Trade | 0.27 | 0.06 | 0.41 | 0.07 | 0.14 | 0.05 | |
| Processing and Packaging | 0.69 | 0.07 | 0.80 | 0.06 | 0.11 | 0.05 | |
| Retail | 0.76 | 0.06 | 0.88 | 0.05 | 0.12 | 0.05 | |
| Consumption | 0.88 | 0.05 | 0.96 | 0.03 | 0.08 | 0.04 | |
| Resource Inputs | 0.71 | 0.06 | 0.92 | 0.04 | 0.21 | 0.06 | |
| Waste and Losses | 0.41 | 0.07 | 0.76 | 0.06 | 0.35 | 0.07 | |
| Emissions and Pollution | 0.37 | 0.07 | 0.57 | 0.07 | 0.20 | 0.06 | |
| Outcomes | Food and Nutrition Security | 0.04 | 0.03 | 0.51 | 0.07 | 0.47 | 0.07 |
| Environmental Sustainability | 0.14 | 0.05 | 0.71 | 0.06 | 0.57 | 0.07 | |
| Social Wellbeing | 0.04 | 0.03 | 0.41 | 0.07 | 0.37 | 0.07 | |
| Actors | Agricultural Workers | 0.20 | 0.06 | 0.51 | 0.07 | 0.31 | 0.07 |
| Farmers | 0.69 | 0.07 | 0.76 | 0.06 | 0.07 | 0.04 | |
| Transport and Storage Workers | 0.06 | 0.03 | 0.20 | 0.06 | 0.14 | 0.05 | |
| Processors and Packagers | 0.06 | 0.03 | 0.16 | 0.05 | 0.10 | 0.04 | |
| Traders | 0.16 | 0.05 | 0.27 | 0.06 | 0.11 | 0.05 | |
| Retailers | 0.18 | 0.05 | 0.29 | 0.06 | 0.11 | 0.05 | |
| Consumers | 0.59 | 0.07 | 0.75 | 0.06 | 0.16 | 0.05 | |
| Researchers | 0.06 | 0.03 | 0.22 | 0.06 | 0.16 | 0.05 | |
| Policy Makers | 0.12 | 0.05 | 0.27 | 0.06 | 0.15 | 0.05 | |
| Industry | 0.04 | 0.03 | 0.24 | 0.06 | 0.20 | 0.06 | |
| Non-Governmental Organizations | 0.04 | 0.03 | 0.12 | 0.05 | 0.08 | 0.04 | |
| International Organizations | 0.00 | 0.00 | 0.08 | 0.04 | 0.08 | 0.04 | |
| Relationships/Power between actors | 0.06 | 0.03 | 0.24 | 0.06 | 0.18 | 0.05 | |
| Animals | 0.49 | 0.07 | 0.59 | 0.07 | 0.10 | 0.04 | |
| System Elements | Interactions, Feedback and Cycles | 0.53 | 0.07 | 0.80 | 0.06 | 0.27 | 0.06 |
| Trade-offs | 0.02 | 0.02 | 0.22 | 0.06 | 0.20 | 0.06 | |
| Scale | 0.27 | 0.06 | 0.45 | 0.07 | 0.18 | 0.05 | |
| Boundaries | Economic Boundary | 0.37 | 0.07 | 0.71 | 0.06 | 0.34 | 0.07 |
| Environmental Boundary | 0.49 | 0.07 | 0.82 | 0.05 | 0.33 | 0.07 | |
| Social Boundary | 0.10 | 0.04 | 0.59 | 0.07 | 0.49 | 0.07 | |
| Political Boundary | 0.20 | 0.06 | 0.57 | 0.07 | 0.37 | 0.07 | |
| Drivers | 0.08 | 0.04 | 0.29 | 0.06 | 0.21 | 0.06 | |
| Special Topics | Organic | 0.02 | 0.02 | 0.24 | 0.06 | 0.22 | 0.06 |
| Diversity | 0.14 | 0.05 | 0.33 | 0.07 | 0.19 | 0.06 | |
| Nutrient Cycles | 0.12 | 0.05 | 0.27 | 0.06 | 0.15 | 0.05 | |
| Labels | 0.02 | 0.02 | 0.24 | 0.06 | 0.22 | 0.06 | |
© 2019 by the authors. Licensee MDPI, Basel, Switzerland. This article is an open access article distributed under the terms and conditions of the Creative Commons Attribution (CC BY) license (http://creativecommons.org/licenses/by/4.0/).
Share and Cite
MDPI and ACS Style
Grant, M.; Gilgen, A.K.; Buchmann, N. The Rich Picture Method: A Simple Tool for Reflective Teaching and Learning about Sustainable Food Systems. Sustainability 2019, 11, 4815. https://doi.org/10.3390/su11184815
AMA Style
Grant M, Gilgen AK, Buchmann N. The Rich Picture Method: A Simple Tool for Reflective Teaching and Learning about Sustainable Food Systems. Sustainability. 2019; 11(18):4815. https://doi.org/10.3390/su11184815
Chicago/Turabian StyleGrant, Michelle, Anna K. Gilgen, and Nina Buchmann. 2019. "The Rich Picture Method: A Simple Tool for Reflective Teaching and Learning about Sustainable Food Systems" Sustainability 11, no. 18: 4815. https://doi.org/10.3390/su11184815
Note that from the first issue of 2016, this journal uses article numbers instead of page numbers. See further details here.