A Tax Coming from the IPCC Carbon Prices Cannot Change Consumption: Evidence from an Experiment

1
UMR Économie Publique, Agroparistech, Université Paris-Saclay, 16 rue Claude Bernard, 75005 Paris, France
2
UMR Économie Publique, INRA, Université Paris-Saclay, 16 rue Claude Bernard, 75005 Paris, France
*
Author to whom correspondence should be addressed.
Sustainability 2019, 11(18), 4834; https://doi.org/10.3390/su11184834
Submission received: 15 July 2019
/
Revised: 26 August 2019
/
Accepted: 29 August 2019
/
Published: 4 September 2019
(This article belongs to the Special Issue Economics of Environmental Taxes and Green Tax Reforms)
Abstract
:This article compares a socially-optimal tax coming from a model integrating consumers’ preferences for various milks, with a tax directly computed from carbon emissions of milks with carbon prices given by the International Panel for Climate Change (IPCC). Regarding consumers’ preferences, we conducted an experiment in France for finding consumers’ willingness-to-pay (WTP) for different bottles coming from either cow’s milk or soy milk, under a regular or an organic process of production. This experiment shows higher WTPs for organic bottles than for regular bottles, and higher WTPs for soy milk than for cow’s milk. These WTPs were introduced into a model estimating the effects of regulatory instruments. From this model using WTPs, it was shown that, for milk coming from cows and soy, a tax on regular bottles and a subsidy on organic bottles maximized the consumers’ welfare. This tax on regular bottles was stronger than the tax that was alternatively estimated with the emissions and IPCC carbon prices. Indeed, a tax based on the IPCC carbon prices seemed too weak for efficiently changing the consumption towards sustainable products.
1. Introduction
Finding an optimal tax for limiting pollution is a thorny task. Regarding environmental taxation, it is frequently used to simply assess environmental damages by using life cycle analysis, without taking into account citizens’ preferences. One way to determine a tax policy consists in integrating the carbon price suggested by the International Panel for Climate Change (IPCC) for limiting greenhouse gas emissions [1]. Even if there is no clear indication about the process used to determine these carbon prices, this reference can be used as a basis for defining tax mechanisms related to the carbon emissions of various products. The absence of monetary values for environmental damages might lead to inappropriate tax levels.
The aim of this paper is to develop an alternative method that would rely on citizens’ preferences for specific products. Despite limitations, the methodology is built up from consumers’ preferences, generally overlooked by scientific debates and economic assessments regarding carbon prices and global warming (such as the one made by the Carbon Price Leadership Coalition [2]). This paper offers a different point of view, shedding light on consumers’ perceptions and reactions.
We elicited consumers’ preferences, computed consumers’ surplus, and applied a tax corresponding to the IPCC carbon price, to observe its impact on consumers’ choice. We developed an alternative method for computing taxes and subsidies related to environmental issues. Our method was based on the internalization of externalities by consumers through the revelation of precise environmental information in the laboratory. Willingness-to-pay (WTP) is integrated in a simple model detailing consumers’ surpluses, allowing the computation of taxes/subsidies as a regulator could do.
The theoretical background of this model consists in (i) a partial-equilibrium perspective focusing on one specific product, (ii) a static approach with only one period of exchanges, and (iii) a simplified view regarding the production sector. The empirical background consists in revealed WTP determined in the lab with performance-based financial incentives, for both regular and innovative products exhibiting significant differences regarding environmental damages. Indeed, to convert WTP into demand curves and surpluses, we assumed that each participant would purchase one unit of the product, providing the highest surplus approximated by the difference between WTP and the market price. Then, the WTP values were integrated into a model measuring the impact of regulatory instruments, such as the perfect information case or per-unit taxes and subsidies. Instruments relied on revealed preferences related to different products offered in a laboratory, but these tools were not determined in the lab for avoiding the regulation aversion biasing choices made by many participants. This type of study may complement other methodologies based on the carbon price for determining socially-optimal policies, such as the international carbon price proposed by the IPCC. Indeed, it suggests a per-ton carbon price between €40 and €80 in 2020, €50 to €100 in 2030, and €125 to €140 in 2040 [3].
For illustrating this new methodology, this paper focuses on the milk market. Indeed, in Europe, one fifth of the total carbon emissions is caused by the agricultural and food sector, and half of it is due to cattle raising, including dairy farming [4]. This sector has a significant impact on the environment via greenhouse gas (GHG) emissions, but also via land use, water consumption, and chemical pollution. Regulation seems essential for reducing the negative impact of cattle breeding on the environment. However, one significant barrier for determining policies and taxes stems from the difficulty to give monetary values to the environmental damages caused. This study determines a socially optimal tax and subsidy program maximizing consumers’ welfare. Then, it also assesses the impact of the implementation of an IPCC carbon price on milk consumption.
To build a socially optimal tax and subsidy program, we used a database composed of French consumers’ willingness-to-pay (WTP) for four products: regular cow’s milk (RCM), organic cow’s milk (OCM), regular soy milk (RSM), and organic soy milk (OSM). It was assumed that consumers are incorrectly informed about milk’s environmental impact, which can be internalized when relevant information is revealed. For each of these products, WTP values were elicited when consumers were not exposed to messages about environmental impacts and when they internalized environmental information thanks to the revelation of messages. We provided four messages. One of these addressed GHG emissions. This message allowed for the internalization of the important impact of cow’s milk in terms of GHG emissions, compared to soy milk. The shift of the WTP with and without this message allowed us to assess the impact of IPCC carbon price. The three other messages addressed questions related to pesticides, animal welfare, and cholesterol. They were used to define the optimal tax. This database comes from a laboratory experiment, determining WTP with performance-based financial incentives, conducted in Dijon, France, in 2017.
The selection of the aforementioned four products is relevant because it allowed for the exploration of different dimensions of the environmental impacts of milk. Indeed, the organic alternative to regular milk highlights the aspect of chemical contamination, whereas the plant-based alternative allows highlighting the aspect of GHG emissions. As well as this, plant-based alternatives are considered to be highly necessary for health and environmental reasons [5]. Moreover, these products are interesting because (i) French consumers favor organic milk, even if it represents only 2% of the French milk production [6]; (ii) vegetable milk is a nascent but trendy market in France; (iii) the cultivating of organic soy has a relatively low impact on the environment; (iv) unlike soy milk, cow’s milk contains cholesterol, which impacts health through cardiovascular diseases; and (v) dairy farming faces animal welfare issues, whereas soy milk is a vegan alternative. It is interesting to study under which conditions French people could decrease their consumption of cow’s milk and increase their consumption of soy milk.
With our alternative method applied to the milk market, the welfare maximization leads to the selection of a significant tax on regular cow’s and regular soy milk associated with a positive subsidy on organic cow’s and organic soy milk. In other words, our results demonstrate that the best solution is to tax regular milk, and to provide a subsidy for organic milk. By favoring organic products, these taxes and subsidies deter the consumption of regular cow’s milk, which leads to a significant decrease in GHG emissions. This estimated per-unit tax is significantly higher than the tax alternatively computed from carbon prices given by IPCC. The tax based on the IPCC carbon price would be too low for efficiently changing the consumption toward sustainable products.
The paper is organized as follows: Section 2 presents the background, Section 3 presents the data, Section 4 details the methodology, Section 5 explains the welfare analysis of regulatory tools, and Section 6 concludes the paper. We now proceed with the brief recall of some results of the literature.
2. Background and Literature
The present paper is related to several fields of the economic literature.
First, as consumers are at the center of our analysis, the literature on consumers’ behavior is pivotal for evaluating policies. Regarding environmental problems and pollutions, citizens are generally overwhelmed by the scientific complexity related to the various impacts of their behaviors, explaining why they cannot fully internalize the external effects coming from their actions [7]. The search for reliable information often appears as a costly challenge. In general, the consumers’ intents to protect the environment are not directly visible in their purchasing decisions [8]. Additionally, for environmentally-friendly consumers, “virtuous” behaviors are limited to the purchase of a few “green” products, because of a generally small “green” spillover effect across different goods and domains [9]. Both cognitive limits and imperfect recalls for many consumers often leads to a market failure characterized by an unsatisfying offer of “green” products [10].
In this context of market failure, the economic theory has searched for the best combination of regulatory instruments guaranteeing both economic efficiency and internalization of environmental dimensions. Tools for improving the environment encompass eco-labels, abatement and environmental quality standards, per-unit tax or per-unit subsidy depending on the environmental quality products, or emission permits. The relative efficiency of each instrument depends on many parameters, including the market conditions. For instance, eco-labels are often characterized by difficulties to convey technical information, and by the proliferation of various claims and logos, implying consumers’ confusion among various labels, and risks of inefficiencies in the conveyed signals of green products [11]. Beyond this specific instrument, the economic theory does not isolate one instrument dominating the other ones in terms of welfare impact [12]. However, among these instruments, Pigovian per-unit taxes and per-unit subsidies depending on environmental quality were highly studied and promoted by economists.
Indeed, per-unit taxes and per-unit subsidies are supposed to be passed into product prices that influence the consumers’ purchasing decisions [13]. The efficiency of this mechanism depends on direct and indirect price elasticities of demands, which influence the consumption shifts towards eco-friendly choices. However, elasticities of demands for many products are generally relatively low. Alternatively, when elasticities are relatively high, this often comes from relatively poor consumers who significantly react to price changes, which raises inequality concerns linked to such a policy [14]. Another crucial question consists in the use of the money coming from tax (also called double dividend) that could be used for spending related to other domains, such as in helping poor people to turn to purchases of clean products and/or to finance subsidies on clean/green products [15]. The implementation of tax/subsidy mechanisms appears difficult when firms wield market power [16]. Eventually, from an empirical point of view, the determination of the optimal level of tax/subsidy is sometimes complex because of the absence of knowledge regarding environmental damages and their monetary valuations (as explained in the introduction for the damages coming from GHG emissions). Our methodology tries to circumvent this problem of the absence of knowledge regarding environmental damages. The way our simple model determines a tax and a subsidy differs from other approaches studying a Pigovian tax, such as approaches using a general-equilibrium context [17], approaches implementing dynamic models with several periods of exchanges [18], or models detailing the production sectors with multiple actors in the supply chain(s) [19]. Our approach abstracts from these previous dimensions for detailing estimations of tax and subsidies coming from a model integrating WTP for various products.
In this paper, the empirical method eliciting WTP in the lab with a possible consequential purchase of a real product aimed at limiting the risk of upward biases for WTP, coming from hypothetical choices, which is the case with a classical method as the contingent valuation [20,21]. The WTP for environmental characteristics were related to a specific product (namely, the milk) and came from the revelation of information on the impact of various substitutes.
Moreover, by offering four products with important differences regarding GHG emissions, our study is related to the experimental literature on climate change. It can be compared to the public-good experiment conducted by Hasson et al. [22], who assumed that mitigation of GHG is a public-good and that the adaptation to global warming is a private good. However, this paper [22] did not refer to any existing products sold in supermarkets Our study also contributes to the experimental literature studying the Pigovian taxation for limiting pollution and/or GHG emissions. Tax aversion appears as a real issue when some market participants have to implement the tax imposed on other participants, as shown by Kallbekken et al. [23]. Moreover, Sarr et al. and Lanz et al. [24,25] explored various difficulties in implementing the Pigovian tax. Our study is different because we inferred both the optimal tax and subsidies from the surplus maximization based on our model, which avoided the tax aversion problems and the difficulties arising from the implementation of the policy. Additionally, our tax and subsidy were product-specific, which was not the case in these previous experiments. Because our model integrated WTP, our study differs from recent theoretical contributions studying the Pigovian taxation with many details on market adjustments but without elicited WTP [26,27,28,29]. The methodology focusing on final products markets and consumers’ perception was overlooked by many institutions, such as the IPCC [1]. Even if our methodology was not a panacea, and using it for a few products could enrich the classical analyses targeting a reduction in GHG emissions.
Compared to previous studies only focusing on regular and organic cow’s milk, such as Bernard and Bernard, Bai et al., and Akaichi et al. [30,31,32], our study was innovative in introducing new vegetable alternatives with significant consequences on market mechanisms and regulation. Some other studies examined the impact of mandatory and complete information on welfare, estimated with elicited WTP, as shown by Rousu et al., Rousu and Corrigan, and Rousu et al. [33,34,35]. Even though we briefly present a policy leading to perfect information, this study mainly details taxes and subsidies computed through various methods. Indeed, our welfare model also integrated taxes estimated through the IPCC carbon prices applied to emissions of various types of milk, which has not been done before. The IPCC carbon prices are directly integrated into the prices of milk bottles, which differs from many studies focusing on abatement costs as, for instance, the Carbon Pricing Leadership Coalition [2] that did not study market adjustments regarding final products.
3. Data
3.1. Experiment and Data Collection
We created a database composed of WTP values indicated by 122 French consumers for four products: regular cow’s milk, organic cow’s milk, regular soy milk, and organic soy milk. These data come from a laboratory experiment, determining WTP with performance-based financial incentives, conducted in Dijon, France, in 2017. Participants were randomly selected on the basis of the quota method, and were representative of the age groups and socioeconomic status of the French population. Table 1 presents some descriptive statistics of the participants.
Table 2 presents a picture of each product. The average prices of these products as sold in supermarkets were relatively similar at the time of the experiment, as reported under each picture. These prices were not revealed to participants.
For eliciting WTP with performance-based financial incentives, we used the Becker, DeGroot, and Marschak (BDM) procedure [36]. In each round of the experiment, and for each product, participants were asked to specify their WTP, namely the maximum price they would pay to purchase the product. We note that, in each new round, participants could specify a new WTP or keep the one they indicated in the previous round. The BDM mechanism works as follows: At the end of the experiment, each participant randomly selected (i) one purchasing price among several prices going from €0.10 to €3.50, and (ii) one indicated WTP of one round and one product. If the indicated WTP was higher than the purchasing price, the participant bought one unit of the corresponding product at the purchasing price. If the indicated WTP was lower than the purchasing price, the participant did not buy the product. We explained this BDM procedure to participants at the beginning of the experimental session.
In round #1, WTP values for RCM, OCM, RSM, and OSM were elicited without any informative message. In each round from #2 through #5, four messages regarding pesticides, GHG emissions, animal welfare, and cholesterol were successively revealed. WTP values were elicited after each message. The four messages, translated from French and preceding the declaration of the WTP, were as follows:
Message about GHGs (GHG): “Cows emit methane, which is a greenhouse gas. In France, they emit 92% of the methane produced by agricultural activities. Greenhouse gases contribute to global warming. The production of soybean emits very small amounts of greenhouse gases.”
Message about pesticides (PES): “Neither pesticides nor fertilizers degrading the environment are used in the cultivation of organic cow feed, which results in organic cow’s milk. Conversely, pesticides and fertilizers are used in the feeding of cows in conventional breeding, which produces regular cow’s milk. No pesticides or fertilizers impacting the environment are used in organic soybean production for organic soy milk. A few pesticides and fertilizers are used in the conventional soybean crop, for the production of regular soy milk.”
Message about animal welfare (AWF): “In most conventional farms producing regular cow’s milk, dairy cows are prone to a set of animal welfare problems. They have little or no access to pasture, and are confined in uncomfortable buildings. Organic dairy cows giving OCM have access to pasture, and have less restrictive living conditions than cows in conventional breeding. Soy milk entirely comes from vegetable sources. Its production does not involve the exploitation of any animal.”
Message about cholesterol (CHO): “Cow’s milk contains cholesterol and saturated fatty acids. This cholesterol, consumed in large quantities, can have an impact on health, and introduces the risk of cardiovascular diseases. Unlike cow’s milk, soy milk does not contain cholesterol and low saturated fat, which helps to reduce the risk of cardiovascular disease.”
In rounds #2 through #5, messages were revealed to participants by alternating the order of these messages by different subgroups. The order of explanatory messages is different, as detailed in Table 3.
3.2. Analysis of WTP
We first present the average WTP for each of the four products. In round #1, where no message was revealed, RCM had the lowest average WTP, and OSM has the highest one, which is consistent with the observed market prices of the products presented in Table 2.
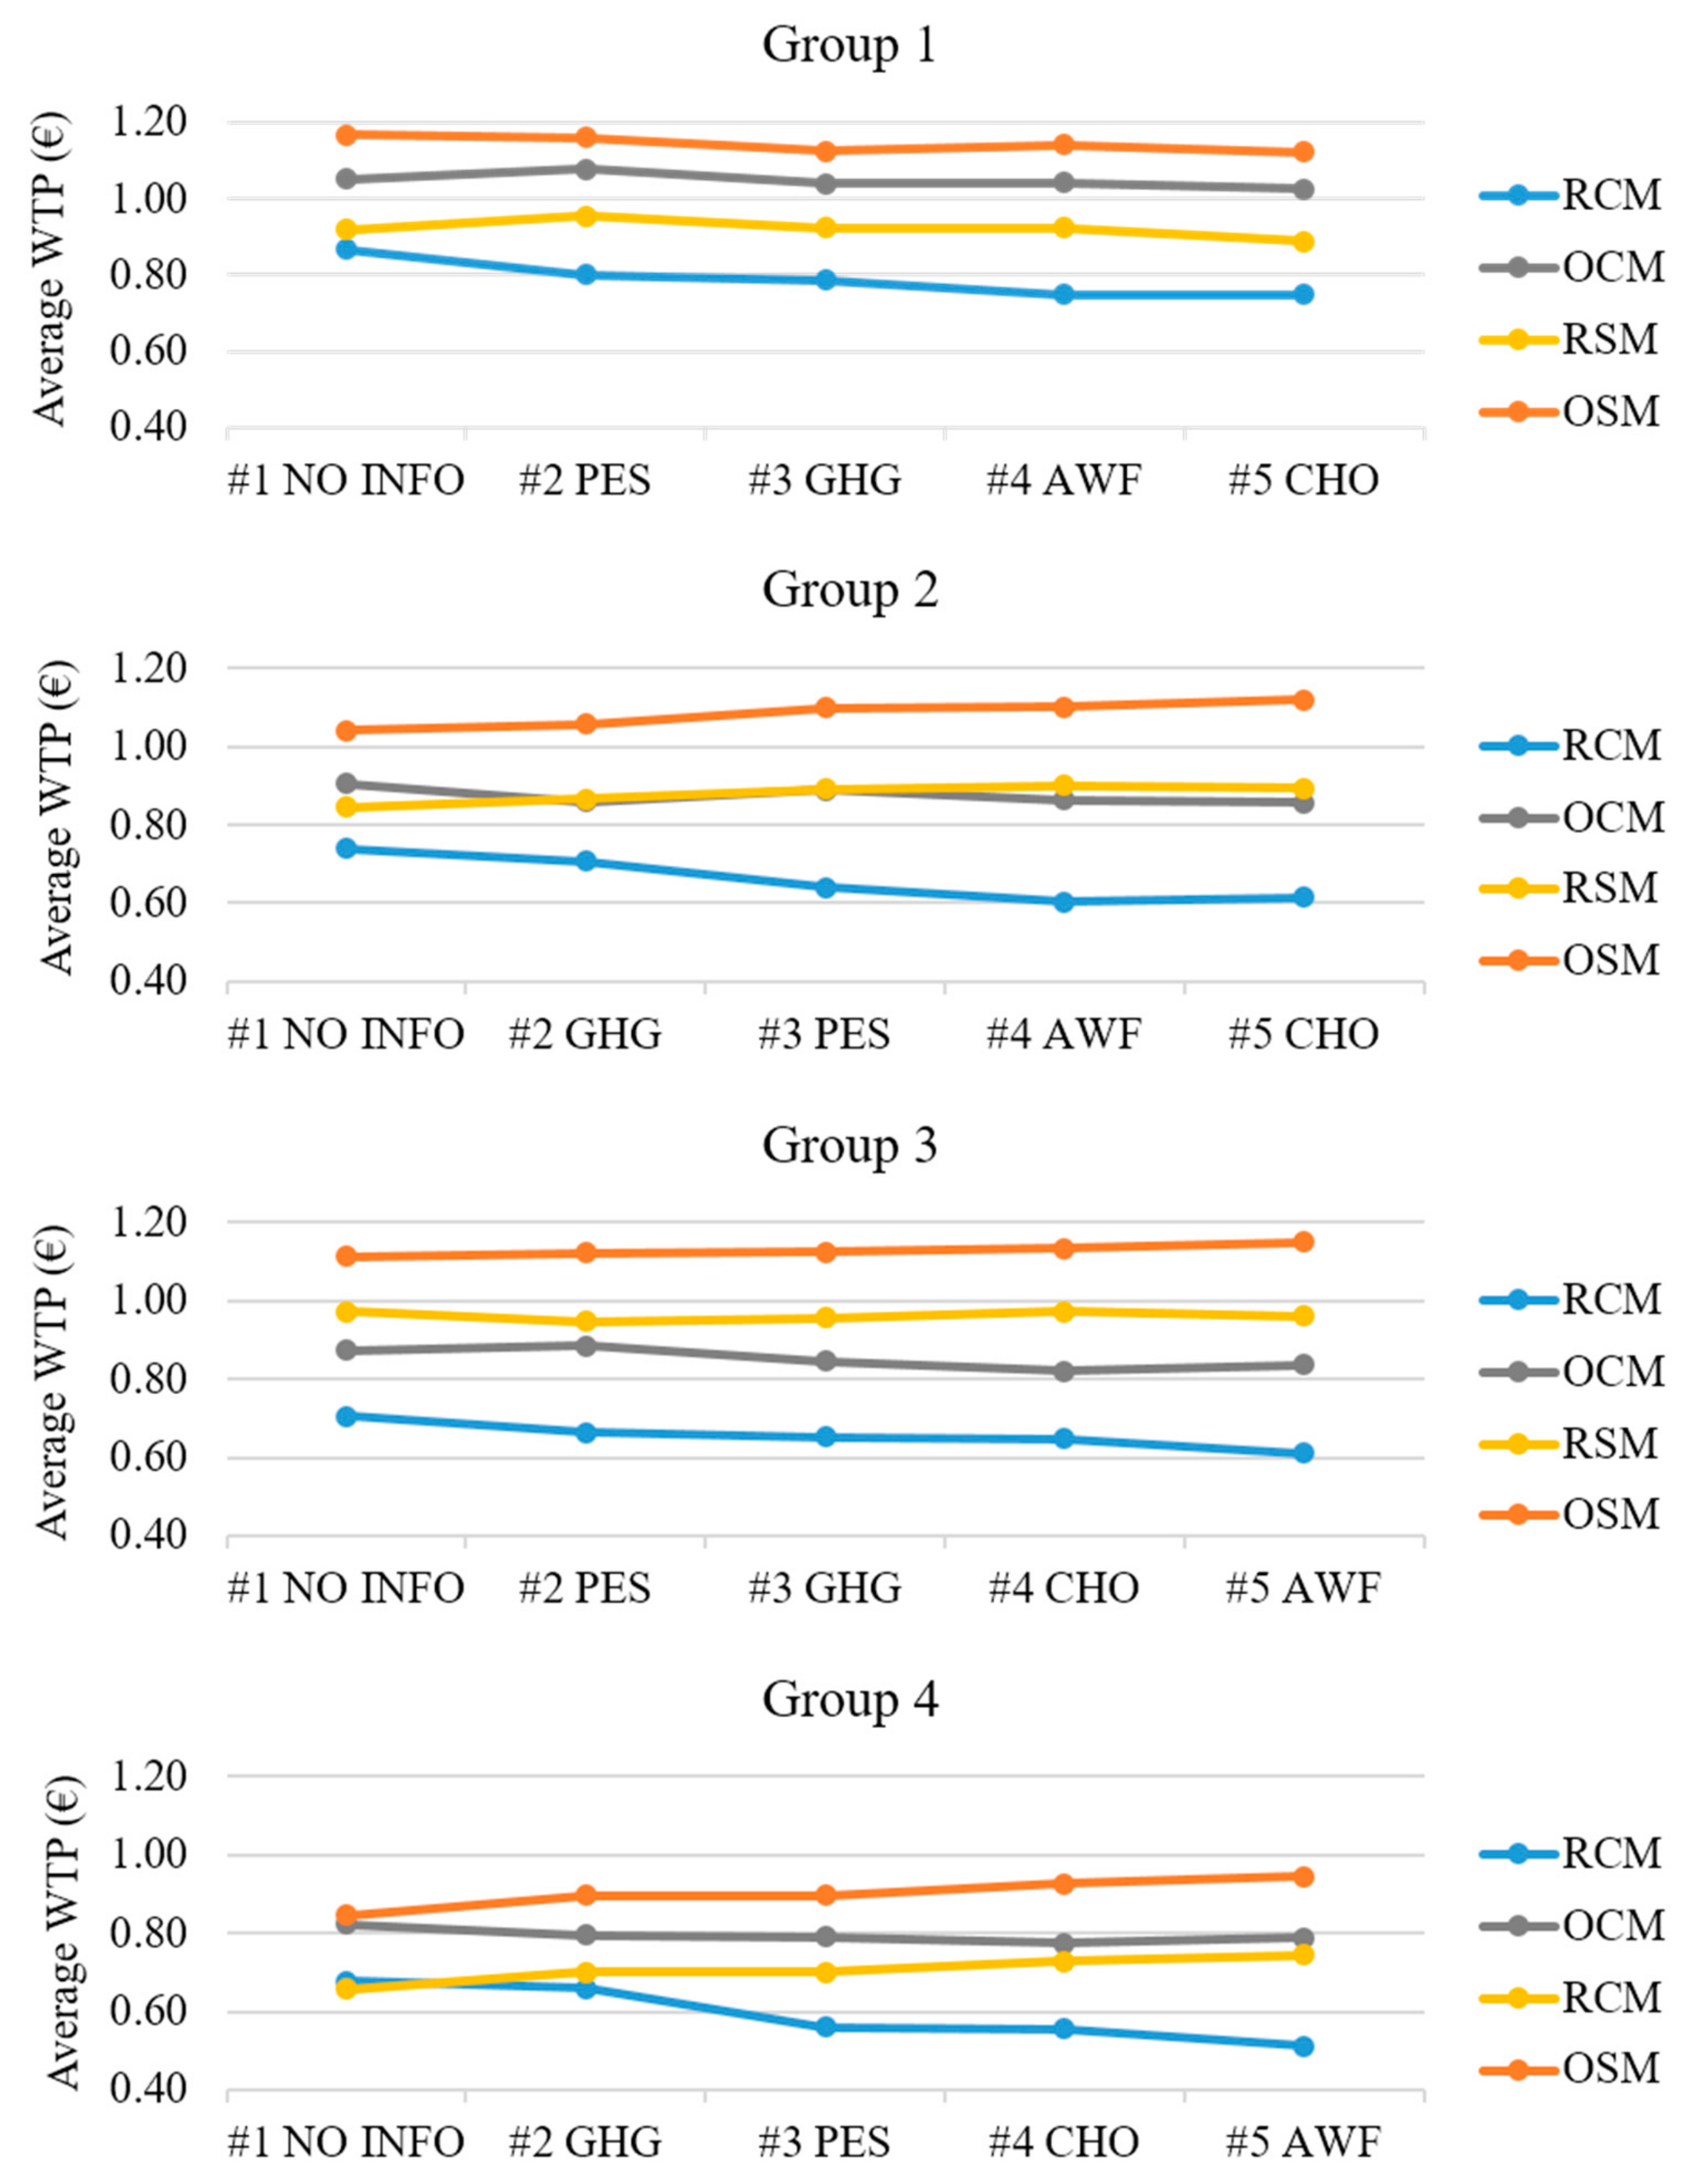
As regards the impact of the messages on the WTP values for RCM, OCM, RSM, and OSM, Figure 1 shows the average WTP for RCM (blue), OCM (grey), RSM (yellow), and OSM (orange). Each chart presents the five rounds of WTP elicitation on the x-axis, and the average WTP values in euro are presented on the y-axis, from €0.40 to €1.20. Each chart corresponds to one group of respondents. The chart indicates the types of messages preceding the WTP value elicitation above the x-axis in their order of delivery. The difference between two successive points represented the average variation in WTP arising from one message. Figure 1 shows variations in the WTP of different products, with the reduction in the WTP for RCM being more pronounced than the variations for other products. This figure highlights that a significant premium was associated with soy milk and with organic products, whether it be cow’s or soy milk. This significant organic premium associated with both cow’s and soy milk, and the significant premium for soy milk compared to cow’s milk, was verified in different rounds. Between rounds #1 and #5, the introduction of the messages boosted these premiums.
The significant differences in WTP between rounds #1 and #3, #3 and #5, and #1 and #5 were tested using the Wilcoxon test for paired samples. We report the p-value of each Wilcoxon paired sample test in Table 4. We observed that no Wilcoxon test p-value was significant, except those of the tests of the WTP for RCM. Indeed, for this RCM, the decrease in WTP observed in Figure 1 was statistically significant. This change influences the demands for these products, as shown in the next section.
4. Methods
Using the WTP values from the experiment, we can estimate the impact of alternative policies on consumers’ surplus. It was assumed that each participant purchased the product that provided the highest surplus if this surplus was positive. It was an inferred choice, as we cannot observe “real” choices in the laboratory—only WTP values were elicited.
The framework integrated individual WTP estimates in a calibrated partial equilibrium model detailing the price and cost effects of regulatory tools. Participants’ surpluses were approximated by their estimated WTP minus the observed market price if they bought the product, and zero otherwise [12]. Our approach directly used individual estimates of WTP [33,37,38,39]. It hence explicitly incorporated the full heterogeneity of consumer preferences.
4.1. Explanation with a Simplified Example
Before explaining the model accounting for the prices of the four products, for heuristic purposes, we first presented a simplified version of the model with only one product available. Let WTP1 and WTP3 indicate individual i’s WTP for RCM before and after the revelation of information, respectively. Indeed, for the case with revelation of information, we restrict our attention to the environmental messages fully revealed in round #3. The information on this product was relatively negative, leading to a potential decrease in its WTP. Let us consider the situation without any additional information. We assumed that the per-unit tax t was fully passed onto consumers into prices. Note that we did not consider the strategies of firms. However, when a firm wields a market power entailing price distortions, the optimal Pigovian tax can be lower than the social damage [16]. For an equilibrium price P + t, where t denotes the per-unit tax, consumer i who purchases a unit of RCM derives utility WTP1i − (P + t) or zero in the case of non-purchase (i.e., the utility of non-purchase is normalized to zero). The consumer chooses the option that generates the highest utility, namely
max{WTP1i − (P + t), 0}.
However, Equation (1) does not provide a complete welfare estimate, as some consumers would value environmental damages of the product based on WTP3i, but their non-informed evaluation of WTP1i determines their purchase. The welfare estimate should also consider the effect of ignorance, Ji(WTP3i − WTP1i), where Ji is an indicator variable taking the value 1 if individual i is predicted to have chosen the product at P + t, and the value 0 otherwise. The benefit associated with the per-unit tax for the taxpayer is Jit. Without information, the complete surplus for participant i is
CSi(t) = max{WTP1i − (P + t), 0} + Ji(WTP3i − WTP1i) + Jit.
The effect of ignorance was taken into account, because it corrected the non-informed valuation of WTP1i when the participant purchased the good without information and, thus, received the benefit without fully valuing it in the WTP estimate. Without information, some participants could regret their purchase if their choice would have been different with perfect information. The participants’ surplus with the integration of the effect of ignorance led to a positive surplus variation only when the purchasing decision changed after the revelation of information, which is fully compatible with the value of information defined under welfare theory [40]. With perfect information, the tax is useless for correcting some choices. WTP may change, and the consumer chooses the option that generates the highest utility, namely
CSPi = max{WTP3i − P, 0}.
In this case, the ignorance did not have any effect because the information was provided. The welfare variation associated with provision of information (without any tax) is CSPi − CSi(0). The difference was not equal to zero when a participant who did purchase the product without any information decided to stop purchasing the product when he/she internalized the information. Taking into account all L participants, the variation in the per-unit welfare is equal to . This is the maximum variation, but information is hard to convey, which requires using other instruments. With a per-unit tax t, some participants may change their purchasing decisions because of the price increase, despite not having additional information. Compared to the variation in the absence of policy, the variation in per-unit welfare is equal to , taking into account the N participants. A groping process determines the tax t∗ that maximizes this variation.
Figure 2 and Figure 3 illustrate the impact of regulation. First, Figure 2 shows the market configuration without a tax (t = 0) and with four participants. For each participant i with i = 1, …, 4, a (green) segment represents WTP1i without information and a bold (red) segment represents WTP3i with information. In Figure 2, three buyers purchased the product since their WTP without information, WTP1i, was higher than the market price, P. The complete surplus CSi(0), given by Equation (2), is represented by the uppercase letters. The complete surplus, integrating the cost of ignorance, was positive and equal to A for the first participant, and equal to C for the third participant. Both benefitted from the purchase. The complete surplus, integrating the cost of ignorance, was negative and equal to −B for the second participant. This participant would not purchase the product under perfect information, where she/he purchased the product without information. The impact of perfect information is observable in Figure 2. The revelation of information led participants to consider WTP3i under perfect information. The second participant avoided purchasing the product with the complete surplus variation B coming from the information associated with the avoided loss −B. The complete surplus of the first and third participants was unchanged because they still decided to purchase the product.
Figure 3 shows the impact of a tax. A tax t leading to a price P + t > WTP12 deterred the second participant from purchasing the product, as he would do under perfect information, which led to a positive complete surplus variation B. However, the third participant would not purchase the product, which would not be the case without the tax. The tax was distortive by leading to a negative variation of the complete surplus equal to −C. The tax t > WTP12 − P was implemented if B > C. In this case, the benefit for the second participant was higher than the loss for the third participant (as represented in Figure 3). Conversely, if B < C, no tax was implemented.
4.2. Surpluses with the Four Types of Milk
The previous equations were easily extended to our market configuration with four types of milk, as presented in the Appendix A. The elicited WTP values for RCM, OCM, RSM, and OSM are compared to the respective market prices of products. The average observed prices in the experiment, namely the RCM price, PRCM = €0.80, the OCM price, POCM = €1.10, the RSM price, PRSM = €1.20, and the OSM price, POSM = €1.30, are given in Table 2. For simplicity, these prices were assumed constant under all configurations, and we overlooked producers’ profits (extensions could consider price adjustments and profit variations following policy implementation). This led to the direct surplus given by Equation (A1) in the Appendix A—each participant bought the product, which led to the highest surplus.
The effect of ignorance was taken into account with the four products, since it corrected the non-informed valuation when the consumer purchases the good without information. Without information, some participants could regret their purchase if their choice would have been different under perfect information. Equation (A2) in the Appendix A presents the complete surplus with the cost of ignorance associated with the purchase of a given product without the full information. The case with perfect information is given by Equation (A3) in the Appendix A. The participants’ surplus with the integration of the effect of ignorance led to a positive surplus variation only when the purchasing decision changed after the revelation of information, which was fully compatible with the value of information defined in welfare theory [40]. The next subsection details the cases with taxes and subsidies in different scenarios.
4.2.1. Scenarios with an Optimal Tax and Subsidy in the Absence of Information
In real life, precise information is hard to convey to consumers, who face information overload and imperfect recall. When perfect information is missing, a per-unit tax t and/or a per-unit subsidy s can be applied to compensate for the consumers’ ignorance. In the different cases we considered, the prices PII + t and PII − s with II = {RCM, OCM, RSM, OSM} replaced the previous prices (i.e., those without a tax and subsidy; Equation (A1)) in Equation (A3) in the Appendix A. In the revised Equation (A2) in the Appendix A, JII,i equaled to 1 if the product II was purchased at price PII + t or PII − s. The regulator also considered the subsidy cost and tax income. The subsidy/tax program aimed to internalize the non-internalized benefit/damage associated with the absence of information.
We focused on two scenarios: S1 and S2. In scenario S1, there was a tax on RCM and OCM, and a subsidy on RSM and OSM. In scenario S2, there was a tax on the RCM and the RSM, and a subsidy on the OCM and the OSM. Taking into account the complete surplus integrating the effect of ignorance (or the non-internalized damage/benefit) and the estimated subsidy cost and tax income, we defined CSiD1(s, t) and CSiD2(s, t) to be the surpluses for participant i, for scenarios S1 and S2, respectively. The corresponding surpluses are given by Equations (A5) and (A6), respectively, in the Appendix A.
For participant i and scenario k (with k = {1,2} for S1 and S2), the improvement associated with the tax/subsidy program was captured by the surplus variation CSiDk(s, t) − CSiB. The average variation in surplus, given by ∆CS2(s, t) in Equation (A7) in the Appendix A, measured the welfare effect.
For each scenario, a groping process maximizing the average surplus ∆CS2(s, t) gave the optimal subsidy s∗ and tax t∗. We conducted the groping process using Excel. In what follows below, we reported the lowest value of s∗ and tax t∗ maximizing ∆CS2(s, t). Furthermore, in the estimation, we reported the variations in the products’ market shares. We also reported the average surplus variation, given by Equation (A7) in the Appendix A, for 1 liter of milk. Finally, we extrapolated this average surplus variation ∆CS2(s, t) for 1 liter of milk to the overall consumption of liquid milk in a given year. In 2016, milk consumption in France was 3.347 billion liters. Because ∆CS2(s, t) was given for 1 liter of milk, the overall variation over a year ∑ CS2(s, t) was calculated by multiplying ∆CS2(s, t) by 3.347 × 10⁹. The accuracy of this extrapolation was limited, since no price adjustments in the products were considered, and no quality differentiation was taken into account.
Then, we repeated the same process considering WTP5 instead of WTP3 to take account of the internalization of the issues in the four messages: GHG emissions, chemical contamination, animal welfare, and cholesterol.
4.2.2. Taxes Based on the IPCC Carbon Price
We also considered an alternative method for determining the tax t based on the GHG emissions. Regarding climate change, IPCC indicated the carbon prices that were assumed to cap GHG emissions. IPCC suggested a gradual implementation of a per-ton carbon price, namely between US$40 and US$80 by 2020, between US$50 and US$100 by 2030, and eventually, between US$125 and US$140 by 2040 [2]. These values can be applied to the one-liter bottle of milk in our experiment to compute a tax that can be compared to the optimal taxes obtained with those in scenarios S1 and S2 previously presented. Using a life cycle analysis, we evaluated the carbon emissions of milk production. González et al. [41] presented the carbon emissions of several crops and food products, including milk and soybeans. Based on IPCC values, adjusting these emissions to a liter leads to a per-liter carbon price, which can be considered as the environmental cost to society. We assumed that this cost was internalized via a per-unit/liter tax transferred to consumers through the price. We also assumed that the GHG emissions for organic bottles of milk were the same as those for regular bottles of milk. The previous welfare model integrated taxes estimated with the IPCC carbon prices applied to the emissions corresponding to the various milk bottles. Interestingly, our methodology using consumers’ preferences endorsed an assessment of possible taxes based on the IPCC carbon price.
5. Results
5.1. Perfect Information Scenario
Table 5 first details the impact of having perfect information about environmental issues. The first four columns show the variation of the market share of each product, with the value in parentheses indicating the sales under perfect information, the fifth column showing the mean per-unit variation in consumers’ surplus, and the last column showing the total consumers’ surplus for the total milk consumption in one year. The perfect information scenario led to the highest average surplus variation. Because of the full internalization, there was no need for an additional per-unit tax and per-unit subsidy—they were equal to zero.
The perfect information scenario was almost impossible to implement in a real context because many consumers with an imperfect recall never take into account environmental criteria in their purchasing choices.
These results are presented as variations from the baseline scenario. We observed that under the perfect information scenario, only 40 of the 124 consumers purchased a product. RCM purchases decreased by 52%, OCM purchases remained constant, OSM purchases increased by 22%, and there were no RSM purchases, as the only bottle of RSM purchased in the baseline scenario was not purchased in this perfect information scenario. In this scenario, the per unit consumers’ surplus increased by 13.2%, which represents €0.0215. This corresponded to a total annual surplus of €71.98 million.
5.2. Scenarios with Optimal Tax and Subsidy in the Absence of Information
Table 6 details the economic impact of regulatory tools when consumers had no environmental information regarding the products. The first column lists the scenarios. The second and third columns present the optimal tax and subsidy maximizing the welfare in each scenario. In the fourth through the seventh column, we detail the market share variations of the different products. The eighth column provides the total variation of bottles sold.
Table 7 details the consumers’ surpluses for the scenarios S1 and S2. In this table, the third column shows the average variations in surplus associated with the purchase of one liter of milk. The fourth column shows the overall surplus variation, extrapolated to the total number of milk bottles sold in 2016 in France. The last three columns present the regulator’s revenue from taxes, cost from subsidies, and total budget.
Regarding the taxation scenarios, a tax can be imposed on products because of their negative impact on the environment through GHG emissions and/or pesticides. In our scenarios, the products on which a tax can be imposed were RCM, RSM, and OCM and those to which a subsidy can be applied were OCM, RSM, and OSM. In scenario S1, a tax concerned both RCM and OCM to internalize the externalities due to GHG emissions, and a subsidy was applied to RSM and OSM. In scenario S2, a tax was imposed on both RCM and RSM, because of the externalities stemming from the use of pesticides and other chemicals, and a subsidy was applied to OCM and OSM. For each scenario, we selected the tax and subsidy pair that maximized the welfare variations. Recall that the tax and subsidy maximized welfare by making the products on which ignorance had the lowest effect more favorable, namely the ones that a consumer would choose under perfect information.
The third and fourth columns of Table 7 clearly show that scenario S2, with a tax equal to €0.4 imposed on both RCM and RSM, and a subsidy equal to €0.1 imposed on both OCM and RSM, led to the greatest surplus variations. With S2, the relative increase in welfare was equal to 3.9% compared to the baseline scenario. By favoring organic products, this tax on regular milk and subsidy on organic milk deterred the consumption of RCM. Among the previous consumers of RCM, half of them turned to OCM, a quarter of them chose OSM, and the remaining quarter of them did not purchase any milk. The decrease in the consumption of RCM milk was not outweighed by a symmetrical increase in the consumption of OCM, which led to a significant decrease in GHG emissions. This result was consistent with the WTP variations underlining a significant premium associated with both OCM and OSM. As consumers value the fact that a product is organic more than the fact that soy milk is from a vegetable source, the tax on regular products and the subsidy on organic products help consumers turn to the organic products.
Using the same process, and applying the same scenario to WTP for all messages, we obtained the same optimal tax and subsidy, and the same market share for each product. Only the consumers’ surpluses were different. Table 8 presents the consumers’ surpluses taking into account the WTP values for all messages. We observed that in scenario S1, the consumers’ surplus was more than six times higher; for scenario S2, it was almost five times higher than that in the case considering WTP values for environmental messages only. We noted that the optimal tax of €0.40 per liter corresponded to a carbon price of $460 per ton, which was around 5 times higher than the tax proposed by the IPCC for 2020, and three times higher than the one for 2040.
5.3. Taxes Based on IPCC Carbon Prices
Producing 1 liter of milk leads to the emission of 1.0 kg CO2eq [42]. Multiplying this level of emissions by the carbon price suggested by the IPCC and considering the exchange rate of US$1.15 for €1, we obtained a cost per-liter, specifying the per-unit tax. The per-unit taxes are presented in Table 9. All the per-unit taxes were much lower than the t* per-unit taxes estimated from participants’ WTP values in the second column of Table 6. Recall that the tax levels of Table 6 maximized the welfare, accounting for consumers’ preferences. This means that tax levels different from the IPCC’s estimates could be acceptable for consumers who were implicitly ready to pay higher levels of taxes, as were the ones shown in Table 6. This is an important result, suggesting that an IPCC carbon taxation is endorsed by consumers’ preferences and also providing the maximum welfare.
Producing 1 kg of soybeans delivers 505 g CO2eq. González et al. [41] provided the carbon emissions related to the protein content. Referring to the nutritional value of soy milk, we observed that 100 ml of soy milk contains 3.8 g of protein, which corresponds to 38 g of protein per liter of the product. We can deduce that 1 liter of soy milk produces around 0.075 kg CO2eq. Applying the carbon prices proposed by the IPCC, we obtained the per-unit taxes presented in Table 9. We observed that the per-unit taxes for soy milk were 13.33 times lower than those for cow’s milk. The per-unit taxes for cow’s milk increased from €3 cents in 2020 to €12 cents in 2040, and for soy milk, from €0.2 cents in 2020 to €0.9 cents in 2040. We observed that the taxes based on the IPCC carbon prices were largely lower than the optimal tax found in our scenarios (3.3 times lower for the tax based on the IPCC carbon price for 2040 and 11.5 times lower for the tax based on the IPCC carbon price for 2020).
The IPCC carbon prices were assumed to cap GHG emissions. Therefore, to observe the impact of carbon prices on the consumers’ surplus, it would be interesting to apply the taxes corresponding to the IPCC carbon prices to the process of welfare maximization, considering as complete information only the message on GHG emissions. We observed that scenarios with taxes based on the IPCC carbon price applied to cow’s milk only, and to cow’s milk and soy milk, led to a decrease in the welfare in both cases. Indeed, all tax scenarios considering WTP after the GHG emissions message to be based on complete information decrease the welfare. Regarding the welfare variation by tax level when taking into account only the WTP after the message on GHG emissions, we observed that there was no tax level leading to a positive welfare variation. The higher the tax, the higher is the loss of welfare. This result can be explained by the low consumer sensitivity to the impact of GHG emissions from cow’s milk. Solely on the basis of consumers’ WTP for GHG emissions, we cannot say that consumers would accept a tax.
Moreover, it was interesting to analyze the impact of regulatory scenarios on the carbon taxes based on the IPCC carbon prices on the welfare, when considering the messages about GHG emissions and the message about pesticides as complete environmental information. Table 10 presents the impact of these taxes on welfare for the scenarios using the carbon prices suggested by the IPCC for 2020 and 2040. We observe that surplus variations in these scenarios were negative (namely, lower than the surplus variation in the baseline scenario). Indeed, both scenarios with taxes based on the IPCC carbon prices applied to cow’s milk only, and those on cow’s milk and soy milk led to a decrease in welfare. As regards the welfare variation by tax level for the case using the WTP after the GHG emission and the pesticide information, we observed that only a tax between €0.50 and €0.65 could lead to a positive welfare variation. Per-unit taxes lower than €0.50 on cow’s milk led to a negative welfare variation because the tax revenue was not high enough to compensate for the loss of consumer surplus because of the decrease in the direct surplus, and to some consumers’ cessation of milk consumption. Per-unit taxes higher than €0.65 on cow’s milk led to a negative welfare variation because there was no cow’s milk consumption in this case and, hence, no tax revenue (in the case of a tax only on cow’s milk) or very little tax revenue (in the case of a tax on cow’s and soy milk). The surplus variations for the scenarios on the basis of taxes from IPCC carbon prices were negative because the per-unit taxes may have implied changes in consumers’ choices, but they were too low to generate enough tax revenue to compensate for the loss of welfare due to the decrease in the direct consumers’ surplus.
Table 10 shows that different tax levels based on the IPCC’s estimates were acceptable for consumers who were implicitly ready to pay higher levels of taxes, as were the ones presented in Table 6. Comparing Table 6 and Table 10 shows that an efficient tax program for reducing GHG emissions should also examine market adjustments for a specific type of product, including the diversity of sub-categories, such as the regular and organic version of a product.
6. Conclusions
This study proposes an alternative approach to an environmental tax. We developed a method on the basis of the maximization of consumers’ surplus using WTP. Simulations show the optimality of scenario S2, applying a positive per-unit tax on both regular cow’s milk and regular soy milk, and a per-unit subsidy on both organic cow’s milk and organic soy milk. By reducing the market share of regular cow’s milk, this scenario would allow an effective reduction in chemical contamination and GHG emissions. This means that an environmental tax taking into account externalities from GHG emissions and chemical pollution is compatible with consumers’ preferences. Moreover, consumers’ surpluses were higher considering animal welfare and cholesterol information. This result suggests that for decreasing the demand for regular cow’s milk, it can be more relevant to choose a tax related to health or animal welfare.
Using a life cycle analysis, alternative taxes on cow’s milk and soy milk were calculated on the basis of the carbon prices proposed by the IPCC. The alternative taxes obtained from IPCC carbon prices were lower than the optimal tax, resulting in the maximization of the consumers’ surplus. Scenarios with the alternative IPCC carbon taxes led to only a small reduction in cow’s milk market share and a decrease in welfare. We can say that consumers’ preferences endorsed carbon taxes on the basis of the carbon prices proposed by IPCC. However, those carbon prices were lower than the optimal tax in the consumers’ point of view. This means that an efficient tax program for reducing GHG emissions should also examine market adjustments for various specific products, rather than only considering a general carbon price.
There were shortcomings in the methods developed in this study. Our methodology did not elicit a willingness to accept a tax, but it determined the optimal taxes obtained from the maximization of the welfare, which used elicited WTP for products. Another limitation of our methodology arose from the focus on only one type of product, namely milk. The experimental analysis should consider configurations in which the regulation targets a basket with various goods and characteristics. WTP, for a good/characteristic, may vary depending on whether it is evaluated on its own, or as part of a “broad basket” of goods/characteristics, which ultimately raises the question of the stability of WTP. Kahneman and Knetsch [43] underlined the sub-additivity effect that occurred when the estimated WTP for the improvement of one characteristic/good plus the estimated WTP for another characteristic/good was greater than the “bundle WTP” when participants were asked to value the two goods/characteristics together. In other words, the non-internalized premiums given by the WTP differences following the messages were determined for one type of product, but not for many types of products belonging to the basket of products purchased by consumers. The premiums justifying the tax on regular products are likely to decline when many products are considered. The decrease in premiums that could emerge when many other products are considered could lead to lower levels of optimal taxes compared to the ones in Table 6. However, as the optimal taxes of Table 6 were relatively high, it is possible that the new levels of taxes imposed on many products would be higher than the alternative taxes based on the IPCC carbon prices.
More work should be done to understand how consumers value environmental damages. Despite limitations, our experimental results are useful for guiding public debates and understanding consumers’ preferences regarding environmental challenges.
Author Contributions
Conceptualization, M.Y. and S.M.; data curation, M.Y.; formal analysis, M.Y.; funding acquisition, S.M.; investigation, M.Y. and S.M.; methodology, M.Y. and S.M.; project administration, S.M.; resources, S.M.; software, M.Y.; supervision, S.M.; validation, S.M.; visualization, M.Y. and S.M.; writing—original draft, M.Y.; writing—review and editing, S.M.
Funding
This paper was funded by (i) the project Susdiet, financed by the ERANET-SUSFOOD Consortium (European Commission) and the Daniel and Nina Carasso foundation, and (ii) the project DIETPLUS ANR-17-CE21-0003 by the Agence National de la Recherche in France.
Acknowledgments
We thank Guy Millet and Christophe Martin for their technical support. We also thank Benoît Chèze, Fabrice Etilé, and Julien Wolfersberger for their comments on previous versions. A previous version of this paper was entitled “Consumers’ preferences and environmental tax: results from an experiment with milk” (see https://faere2018.sciencesconf.org/210764).
Conflicts of Interest
The authors declare no conflict of interest.
Appendix A. Consumers’ Surpluses with Four Products
The surplus CSiA for the baseline scenario is
CSiA = max{WTP1RCM,i − PRCM,WTP1OCM,i − POCM, WTP1RSM,i − PRSM,WTP1OSM,i − POSM, 0}.
By starting from Equation (A1), the complete surplus accounting for the ignorance when one unit of product is purchased is
CSiB = max{WTP1RCM,i − PRCM, WTP1OCM,i − POCM, WTP1RSM,i − PRSM,WTP1OSM,i − POSM, 0} + JRCM,i[WTP3RCM,i − WTP1RCM,i] + JOCM,i[WTP3OCM,i − WTP1OCM,i] + JRSM,i[WTP3RSM,i − WTP1RSM,i] + JOSM,i[WTP3OSM,i − WTP1OSM,i].
With an information campaign where all consumers receive information, a participant i receives the surplus
CSic = max{WTP3RCM,i − PRCM,WTP3OCM,i − POCM, WTP3RSM,i − PRSM,WTP3OSM,i − POSM, 0}.
By using Equations (A2) and (A3), the average variation in surplus following the broadcast of perfect information is equal to
where N is the overall number of participants.
For the tax and subsidy, the complete surplus integrates the effect of ignorance and the estimated subsidy cost, JIIs, when the product II is subsidized and purchased, and the estimated tax income, JIIIt, when the product III is taxed and purchased. The complete surplus related for participant i, for the scenario S1, applying a tax on the RCM and the OCM, and a subsidy on the RSM and the OSM, the participant’s complete surplus is equal to
CSiD1(s, t) = [max{WTP3RCM,i − PRCM − t,WTP3OCM,i − POCM,i − t, WTP3RSM,i − PRSM + s,WTP3OSM,i − POSM + s, 0}] + JRMC,i[WTP3RCM,i − WTP1RCM,i + t] + JOCM,i[WTP3OCM,i − WTP1OCM,i + t] + JRSM,i[WTP3RSM,i − WTP1RSM,i − s] + JOSM,i[WTP3OSM,i − WTP1OSM,i − s].
For the scenario S2, applying a tax on the RCM and the RSM, and a subsidy on the OCM and the OSM, the participant’s complete surplus is equal to
CSiD2(s, t) = [max{WTP3RCM,i − PRCM − t,WTP3OCM,i − POCM,i + s, WTP3RSM,i − PRSM − t,WTP3OSM,i − POSM + s, 0}] + JRMC,i[WTP3RCM,i − WTP1RCM,i + t] + JOCM,i[WTP3OCM,i − WTP1OCM,i − s] + JRSM,i[WTP3RSM,i − WTP1RSM,i + t] + JOSM,i[WTP3OSM,i − WTP1OSM,i − s].
The average variation in surplus linked to the purchase of one unit is equal to
where N is the overall number of participants, and k = {1,2} indicates the scenario S1 and S2.
References
- IPCC Reports 2019. Available online: https://www.ipcc.ch/reports/ (accessed on 1 July 2019).
- Carbon Pricing Leadership Coalition. Report on the high-level commission on carbon prices. Available online: https://www.ipcc.ch/reports/ (accessed on 1 July 2019).
- Edenhofer, O.; Pichs-Madruga, R.; Sokona, Y.; Farahani, E.; Kadner, S.; Seybothm, K.; Adler, A.; Baum, I.; Bruner, S.; Eickmeier, P.; et al. Climate change 2014: Mitigation of Climate Change; Contribution of Working Group III to the Fifth Assessment. Report of the Intergovernmental Panel on Climate Change; Cambridge University Press: Cambridge, UK, 2014. [Google Scholar]
- Eurostat, J. Agriculture—Greenhouse Gas Emission Statistics; European Commission: Luxemburg, 2015. [Google Scholar]
- Springmann, M.; Mason-D’Croz, D.; Robinson, S.; Wiebe, K.; Godfray, H.C.J.; Rayner, M.; Scarborough, P. Health-motivated taxes on red and processed meat: A modelling study on optimal tax levels and associated health impacts. PLoS ONE 2018, 13, e0204139. [Google Scholar] [CrossRef] [PubMed]
- FranceAgriMer. Données et Bilan Lait; Technical report; Etablissement National des Produits de L’agriculture et de la Mer; FranceAgriMer: Montreuil, France, 2017. [Google Scholar]
- Sunstein, C.R. Behavioural economics, consumption and environmental protection. In Handbook of Research on Sustainable Consumption; Reisch, L.A., Thøgersen, J., Eds.; Edward Elgar Publishing: Cheltenham, UK, 2015. [Google Scholar]
- Moser, A. Thinking green, buying green? Drivers of pro-environmental purchasing behavior. J. Consumer Mark. 2015, 32, 167–175. [Google Scholar] [CrossRef]
- Thøgersen, J.; Ölander, F. Spillover of environment-friendly consumer behavior. J. Environ. Psych. 2003, 23, 225–236. [Google Scholar] [CrossRef]
- Akerlof, G.A. The market for “lemons”: Quality uncertainty and the market mechanism. Quart. J. Econ. 1970, 84, 488–500. [Google Scholar] [CrossRef]
- Yokessa, M.; Marette, S. A review of eco-labels and their economic impact. Int. Rev. Environ. Resour. Econ. 2019, 13, 119–163. [Google Scholar] [CrossRef]
- Disdier, A.-C.; Marette, S. Taxes, minimum-quality standards and/or product labeling to improve environmental quality and welfare: Experiments can provide answers. J. Regul. Econ. 2012, 41, 337–357. [Google Scholar] [CrossRef]
- Cornwell, A.; Creedy, J. Environmental Taxes and Economic Welfare; Edward Elgar Publishing: Cheltenham, UK, 1997. [Google Scholar]
- Aasness, J.; Larsen, E.R. Distributional effects of environmental taxes on transportation. J. Consumer Policy 2003, 26, 279–300. [Google Scholar] [CrossRef]
- Bansal, S.; Gangopadhyay, S. Tax/subsidy policies in the presence of environmentally aware consumers. J. Environ. Econ. Manag. 2003, 45, 333–355. [Google Scholar] [CrossRef]
- Barnett, A.H. The pigouvian tax rule under monopoly. Am. Econ. Rev. 1980, 70, 1037–1041. [Google Scholar]
- Hafstead, M. Introducing the E3 carbon tax calculator: Estimating future CO2 emissions and revenues. Available online: https://www.resourcesmag.org/common-resources/introducing-the-e3-carbon-tax-calculator-estimating-future-co2-emissions-and-revenues/ (accessed on 22 August 2019).
- Heal, G.; Schlenker, W. Coase, hotelling and pigou: The incidence of a carbon tax and CO2 emissions. Nat. Bur. Econ. Res. 2019. working paper No. 26086. [Google Scholar]
- Guo, D.; He, Y.; Wu, Y.; Xu, Q. Analysis of supply chain under different subsidy policies of the government. Sustainability 2016, 8, 1290. [Google Scholar] [CrossRef]
- Lusk, J.L.; Marette, S. Welfare effects of food labels and bans with alternative willingness to pay measures. Appl. Econ. Perspect. Policy 2010, 32, 319–337. [Google Scholar] [CrossRef]
- McFadden, D.; Leonard, G. Issues in the contingent valuation of environmental goods. In Contingent Valuation: A Critical Assessment; Hausman, J., Ed.; Emerald Group Publishing Limited: Bingley, UK, 1993; Volume 220, pp. 165–215. [Google Scholar]
- Hasson, R.; Löfgren, Å.; Visser, M. Climate change in a public goods game: Investment decision in mitigation versus adaptation. Ecol. Econ. 2010, 70, 331–338. [Google Scholar] [CrossRef] [Green Version]
- Kallbekken, S.; Kroll, S.; Cherry, T.L. Do you not like Pigou, or do you not understand him? Tax aversion and revenue recycling in the lab. J. Environ. Econ. Manag. 2011, 62, 53–64. [Google Scholar] [CrossRef] [Green Version]
- Lanz, B.; Wurlod, J.-D.; Panzone, L.; Swanson, T. The behavioral effect of pigovian regulation: Evidence from a field experiment. J. Environ. Econ. Manag. 2017, 87, 190–205. [Google Scholar] [CrossRef]
- Sarr, H.; Bchir, M.A.; Cochard, F.; Rozan, A. Nonpoint Source Pollution: An Experimental Investigation of the Average Pigouvian Tax; Working Paper; Université de Franche-Comté: Besançon, France, 2016. [Google Scholar]
- Borger, B.D.; Glazer, A. Support and opposition to a pigovian tax: Road pricing with reference-dependent preferences. J. Urban Econ. 2017, 99, 31–47. [Google Scholar] [CrossRef]
- Gahvari, F. Second-best pigouvian taxation: A clarification. Environ. Resour. Econ. 2014, 59, 525–535. [Google Scholar] [CrossRef]
- MacKenzie, I.A.; Ohndorf, M. Coasean bargaining in the presence of pigouvian taxation. J. Environ. Econ. Manag. 2016, 75, 1–11. [Google Scholar] [CrossRef]
- McAusland, C.; Najjar, N. Carbon Footprint Taxes. Environ. Resour. Econ. 2015, 61, 37–70. [Google Scholar] [CrossRef]
- Akaichi, F.; Nayga, R.M., Jr.; Gil, J.M. Assessing consumers’ willingness to pay for different units of organic milk: Evidence from multiunit auctions. Can. J. Agric. Econ. 2012, 60, 469–494. [Google Scholar] [CrossRef]
- Bai, J.; Zhang, C.; Jiang, J. The role of certificate issuer on consumers’ willingness-to-pay for milk traceability in China. Agric. Econ. 2013, 44, 537–544. [Google Scholar] [CrossRef]
- Bernard, J.C.; Bernard, D.J. What is it about organic milk? An experimental analysis. Am. J. Agric. Econ. 2009, 91, 826–836. [Google Scholar] [CrossRef]
- Rousu, M.; Huffman, W.E.; Shogren, J.F.; Tegene, A. Effects and value of verifiable information in a controversial market: Evidence from lab auctions of genetically modified food. Econ. Inquiry 2007, 45, 409–432. [Google Scholar] [CrossRef]
- Rousu, M.; Lusk, J. Valuing information on GM foods in a WTA market: What information is most valuable? AgBioForum 2009, 12, 226–231. [Google Scholar]
- Rousu, M.C.; Corrigan, J.R. Estimating the welfare loss to consumers when food labels do not adequately inform: An application to fair trade certification. J. Agric. Food Ind. Org. 2008, 6, 1–26. [Google Scholar] [CrossRef]
- Becker, G.M.; Degroot, M.H.; Marschak, J. Measuring utility by a single-response sequential method. Behav. Sci. 1964, 9, 226–232. [Google Scholar] [CrossRef] [PubMed]
- Huffman, W.E.; Rousu, M.; Shogren, J.F.; Tegene, A. The effects of prior beliefs and learning on consumers’ acceptance of genetically modified foods. J. Econ. Behav. Org. 2007, 63, 193–206. [Google Scholar] [CrossRef]
- Lusk, J.L.; House, L.O.; Valli, C.; Jaeger, S.R.; Moore, M.; Morrow, B.; Traill, W.B. Consumer welfare effects of introducing and labeling genetically modified food. Econ. Lett. 2005, 88, 382–388. [Google Scholar] [CrossRef]
- Lusk, J.L.; Shogren, J.F. Experimental Auctions. Methods and Applications in Economic and Marketing Research; Cambridge University Press: Cambridge, UK, 2007. [Google Scholar]
- Foster, W.; Just, R.E. Measuring welfare effects of product contamination with consumer uncertainty. J. Environ. Econ. Manag. 1989, 17, 266–283. [Google Scholar] [CrossRef]
- González, A.D.; Frostell, B.; Carlsson-Kanyama, A. Protein efficiency per unit energy and per unit greenhouse gas emissions: Potential contribution of diet choices to climate change mitigation. Food Policy 2011, 36, 562–570. [Google Scholar] [CrossRef]
- Cederberg, C.; Stadig, M. System expansion and allocation in life cycle assessment of milk and beef production. Int. J. Life Cycle Assess. 2003, 8, 350–356. [Google Scholar] [CrossRef]
- Kahneman, D.; Knetsch, J.L. Valuing public goods: The purchase of moral satisfaction. J. Environ. Econ. Manag. 1992, 22, 57–70. [Google Scholar] [CrossRef]
Figure 1.
Average willingness-to-pay (WTP) by group for each product.

Figure 2.
WTP mechanism without information.

Figure 3.
WTP mechanism with tax.


Table 1.
Statistics about the sample in the experiment.
| Income | |
|---|---|
| ≤€2000 | 31.7% |
| between €2000 and €4000 | 49.6% |
| between €4000 and €6000 | 13.0% |
| >€6000 | 1.6% |
| No answer | 3.3 % |
| Academic | |
| No degree | 0.8% |
| High school degree | 51.2% |
| Bachelor to master’s degree | 48.0% |
| Sex | |
| Female | 49.6% |
| Male | 50.4% |
| Do you regularly consume organic cow’s milk? * | |
| Yes | 57.7% |
| Do you regularly consume soy milk? * | |
| Yes | 17.1% |
* Note: Questions coming from the exit questionnaire filled at the end of the experiment.
Table 2.
The four products presented to the participants. RCM = regular cow’s milk, OCM = organic cow’s milk, RSM = regular soy milk, OSM = organic soy milk.
Table 2.
The four products presented to the participants. RCM = regular cow’s milk, OCM = organic cow’s milk, RSM = regular soy milk, OSM = organic soy milk.
| Picture |  |  |  |  |
|---|---|---|---|---|
| Code | RCM | OCM | RSM | OSM |
| Type | Cow’s milk | Cow’s milk | Soy milk | Soy milk |
| Characteristics | Regular | Organic | Regular | Organic |
| Market price (€) | 0.80 | 1.10 | 1.20 | 1.30 |
Table 3.
The groups and the order of messages. PES = message about pesticides, GHG = message about greenhouse gases, AWF = message about animal welfare, CHO = message about cholesterol.
Table 3.
The groups and the order of messages. PES = message about pesticides, GHG = message about greenhouse gases, AWF = message about animal welfare, CHO = message about cholesterol.
| Round #1 | Round #2 | Round #3 | Round #4 | Round #5 | |
|---|---|---|---|---|---|
| Group 1 31 participants | no message | PES | GHG | AWF | CHO |
| Group 2 32 participants | no message | GHG | PES | AWF | CHO |
| Group 3 28 participants | no message | PES | GHG | CHO | AWF |
| Group 4 32 participants | no message | GHG | PES | CHO | AWF |
Table 4.
Wilcoxon test’s p-value between rounds #1 and #3, #3 and #5, and #1 and #5.
| #1 to #3 | #3 to #5 | #1 to #5 | |
|---|---|---|---|
| RCM | 0.076 | 0.397 | 0.009 |
| OCM | 0.822 | 0.878 | 0.713 |
| RSM | 0.767 | 0.922 | 0.701 |
| OSM | 0.724 | 0.800 | 0.552 |
Table 5.
Variations of the market share of each product and consumers’ surplus for the perfect information scenario.
Table 5.
Variations of the market share of each product and consumers’ surplus for the perfect information scenario.
| ∆MSRCM | ∆MSOCM | ∆MSRSM | ∆MSOSM | ∆CS (s, t) | ∑CS (s, t) | |
|---|---|---|---|---|---|---|
| No. of Unit | No. of Unit | No. of Unit | No. of Unit | €/Unit | Million € | |
| Value | −12 (13) | 0 (3) | −1 (0) | +4 (22) | +0.0215 | +71.98 |
| Percentage | −52 | 0 | −100 | +22 | +13.2 | +13.2 |
Note: ∆MSRCM: variation of the market share for RCM; ∆MSOCM: variation of the market share for OCM; ∆MSRSM: variation of the market share for RSM; ∆MSOSM: variation of the market share for OSM; ∆MStot: variation of market share for all the products; ∆CS (s, t): variation of consumers’ surplus; ∑CS (s, t): value of consumers’ surplus; (): number of unit purchased under perfect information.
Table 6.
Variations of the market share of each product for scenarios with optimal tax and subsidy based on environmental information (this table is valid as well for all information).
Table 6.
Variations of the market share of each product for scenarios with optimal tax and subsidy based on environmental information (this table is valid as well for all information).
| Scenarios | t∗ | s∗ | ∆MSRCM | ∆MSOCM | ∆MSRSM | ∆MSOSM | ∆MStot |
|---|---|---|---|---|---|---|---|
| €/Unit | €/Unit | No. of Unit | No. of Unit | No. of Unit | No. of Unit | No. of Unit | |
| S1 Value | 0.4 | 0.1 | −24 (1) | −2 (1) | +1 (2) | +11 (29) | −14 (33) |
| Percentage | −96.0 | −66.7 | +100.0 | +61.1 | −28.9 | ||
| S2 Value | 0.4 | 0.1 | −25 (0) | +12 (15) | −1 (0) | +7 (25) | −7 (40) |
| Percentage | −100.0 | +400 | −100.0 | +38.9 | −14.9 |
Note: t*: tax/unit; s*: subsidy/unit; ∆MSRCM: variation of the market share for RCM; ∆MSOCM: variation of the market share for OCM; ∆MSRSM: variation of the market share for RSM; ∆MSOSM: variation of the market share for OSM; ∆MStot: variation of market share for all the products; (): number of unit purchased.
Table 7.
Consumers’ surplus for scenarios with optimal tax and subsidy based on environmental information only.
Table 7.
Consumers’ surplus for scenarios with optimal tax and subsidy based on environmental information only.
| Scenarios | t∗ | s∗ | ∆CS (s, t) | ∑CS (s, t) | Rtot |
|---|---|---|---|---|---|
| €/Unit | €/Unit | € | Million € | Million € | |
| S1 Value | 0.4 | 0.1 | +0.0020 | +4.49 | −154.00 |
| Percentage | +1.2 | +1.2 | |||
| S2 Value | 0.4 | 0.1 | +0.0063 | +17.0 | −234.35 |
| Percentage | +3.9 | +3.9 |
Note: t*: tax/unit; s*: subsidy/unit; ∆CS(s, t): variation of consumers’ surplus; ∑CS(s, t): value of consumers’ surplus; Rtot: total revenue of the tax; (): number of unit purchased.
Table 8.
Consumers’ surplus taking account of WTP with all messages (GHG emission, chemical contamination, animal welfare, and cholesterol information).
Table 8.
Consumers’ surplus taking account of WTP with all messages (GHG emission, chemical contamination, animal welfare, and cholesterol information).
| Scenarios | t∗ | s∗ | ∆CS (s, t) | ∑CS (s, t) | Rtot |
|---|---|---|---|---|---|
| €/Unit | €/Unit | € | Million € | Million € | |
| S1 Value | 0.4 | 0.1 | +0.0137 | +30.18 | −154.00 |
| Percentage | +14 | +14 | |||
| S2 Value | 0.4 | 0.1 | +0.0314 | +84.05 | −234.35 |
| Percentage | +32.3 | +32.3 |
Note: t*: tax/unit; s*: subsidy/unit; ∆CS(s, t): variation of consumers’ surplus; ∑CS(s, t): value of consumers’ surplus; Rtot: total revenue of the tax; (): number of unit purchased.
Table 9.
Taxes based on carbon prices suggested by the International Panel for Climate Change (IPCC).
Table 9.
Taxes based on carbon prices suggested by the International Panel for Climate Change (IPCC).
| Type of Milk | Emission | Tax2020 | Tax2030 | Tax2040 |
|---|---|---|---|---|
| Kgeq CO2/Unit | €/Unit | €/Unit | €/Unit | |
| Cow’s milk | 1.0 | 0.0348–0.0696 | 0.0435–0.0870 | 0.1087–0.1217 |
| Soy milk | 0.075 | 0.0026–0.0052 | 0.0033–0.0065 | 0.0082–0.0091 |
Table 10.
Variations of the market share of each product and consumers’ surplus for the scenarios with IPCC carbon price.
Table 10.
Variations of the market share of each product and consumers’ surplus for the scenarios with IPCC carbon price.
| Scenarios | PCO2 $/ton | taxcowmilk €/Unit | taxsoymilk €/Unit | ∆MSRCM Unit | ∆MSOCM Unit | ∆MSRSM Unit | ∆MSOSM Unit | ∆MStot Unit | ∆CS(s, t) €/Unit | Milion € | RTot Million € |
|---|---|---|---|---|---|---|---|---|---|---|---|
| S4: 2020 | |||||||||||
| Value Percentage | 40 | 0.0348 | 0.0026 | −1 −4.0% | 0 0.0% | 0 0.0% | +3 +16.7% | +2 +4.0% | −0.0025 −1.5% | −8.07 −1.5% | 66.74 |
| Purchase | 24 | 3 | 1 | 21 | 49 | ||||||
| S5: 2020 | |||||||||||
| Value Percentage | 80 | 0.0696 | 0.0052 | −9 −36% | 0 0% | 0 0% | −4 −22.2% | −5 −11% | −0.0041 −2.5% | 11.55 −2.5% | 96.55 |
| Purchase | 16 | 3 | 1 | 22 | 42 | ||||||
| S4: 2040 | |||||||||||
| Value Percentage | 125 | 0.1087 | 0.0033 | −17 −68% | −1 −33.3% | −1 −100% | +5 +27.8% | −13 −28.0% | −0.0066 −4.0% | −14.96 −4.0% | 85.96 |
| Purchase | 8 | 2 | 0 | 23 | 34 | ||||||
| S5: 2040 | |||||||||||
| Value Percentage | 145 | 0.1217 | 0.0082 | −17 −68.0% | −1 −33.3% | 0 0.0% | +5 +27.8% | −13 −28.0% | −0.0066 −4.0% | −14.98 −4.0% | 96.11 |
| Purchase | 8 | 2 | 1 | 23 | 34 | ||||||
Note: PCO2: price of the CO2 suggested by the International Panel on Climate Change; Taxcowmilk: tax/unit for cow’s milk; Taxsoymilk: tax/unit for cow’s milk; ∆MSRCM: variation of the market share for RCM; ∆MSOCM: variation of the market share for OCM; ∆MSRSM: variation of the market share for RSM; ∆MSOSM: variation of the market share for OSM; ∆MStot: variation of market share for all the products; ∆CS(s, t): variation of consumers’ surplus; ∑CS(s, t): value of consumers’ surplus; RTot: total revenue of the tax.
© 2019 by the authors. Licensee MDPI, Basel, Switzerland. This article is an open access article distributed under the terms and conditions of the Creative Commons Attribution (CC BY) license (http://creativecommons.org/licenses/by/4.0/).
Share and Cite
MDPI and ACS Style
Yokessa, M.; Marette, S. A Tax Coming from the IPCC Carbon Prices Cannot Change Consumption: Evidence from an Experiment. Sustainability 2019, 11, 4834. https://doi.org/10.3390/su11184834
AMA Style
Yokessa M, Marette S. A Tax Coming from the IPCC Carbon Prices Cannot Change Consumption: Evidence from an Experiment. Sustainability. 2019; 11(18):4834. https://doi.org/10.3390/su11184834
Chicago/Turabian StyleYokessa, Maïmouna, and Stéphan Marette. 2019. "A Tax Coming from the IPCC Carbon Prices Cannot Change Consumption: Evidence from an Experiment" Sustainability 11, no. 18: 4834. https://doi.org/10.3390/su11184834
Note that from the first issue of 2016, this journal uses article numbers instead of page numbers. See further details here.