Taxi Downsizing: A New Approach to Efficiency and Sustainability in the Taxi Industry

1
College of Civil Engineering and Architecture, Zhejiang University, 866 Yuhangtang Rd, Hangzhou 310058, China
2
Department of Civil & Environmental Engineering, National University of Singapore, Singapore 117576, Singapore
*
Author to whom correspondence should be addressed.
Sustainability 2019, 11(18), 4944; https://doi.org/10.3390/su11184944
Submission received: 14 August 2019
/
Revised: 4 September 2019
/
Accepted: 9 September 2019
/
Published: 10 September 2019
(This article belongs to the Special Issue Sustainability in Transportation and the Built Environment)
Abstract
:Taxis are considered one of the symbols of urban transportation systems due to their large daily traveling mileage. Taking into account hatchback cars with two rows of seats, this paper presents a new approach to taxi efficiency by decreasing the vehicle size. The policy’s influences on fuel consumption, emission, safety, and economic efficiency are comprehensively analyzed. With supplementary surveys of taxi passengers, a total of 1110 taxi trips are observed at nine busy locations. The results show that the trunk is not used in 88% of taxi trips in Hangzhou. It is estimated that downsizing each taxi results in annual decreases in fuel consumption by 1600 L, CO by 311.9 kg, HC by 15.4 kg, and NOx by 8.9 kg. By using a small car as a taxi instead of a standard car, the annual fixed cost plus the fuel cost will be reduced by 38%. By analyzing GPS data of 7081 taxis in Hangzhou, we found a network-wide average taxi speed of 23 km/h. Since the average speed of taxis is relatively low in urban areas, the use of small cars could provide drivers with higher maneuver capability, while increasing the safety of small cars. According to the findings of this paper, using small cars will increase the efficiency and sustainability of the taxi industry.
Keywords:
taxi downsizing; sustainability; GPS data; fuel consumption; emission; economic efficiency1. Introduction
Taxis play an essential role in urban public transportation systems due to their speediness, convenience, efficiency, capacity to provide door-to-door service, privacy, flexibility, and 24-h availability. Since the average daily mileage of a taxi is usually higher than a private car, the importance of taxis and their influence on daily traffic, air pollution, and fuel consumption have attracted much attention. Recently, different approaches have been presented to reduce traffic congestion and air pollution, such as ridesharing, ride-splitting, and on-demand telephone taxis, along with the application of natural gas, hybrid, and electric vehicles [1,2].
One of the most useful methods could be decreasing the taxi size, which has a positive effect on traffic efficiency, the capacity of transportation infrastructure, and a reduction in vehicle weight. In many cases, taxis are only occupied by one single-seat passenger, especially in commercial centers, where travelers often take a ride without baggage, such that the taxi does not need to use the trunk. Even in the case that some passengers carry baggage, the vehicle roof could be armed with a trunk to hold the baggage. Various studies in China have shown that the average taxi speed is usually around 30 km/h in populated urban areas [3,4,5]. According to the vehicle’s speed versus drag force graph in the Automotive Aerodynamics Handbook [6], which shows that the impact of aerodynamic drag force under low speeds (below 25 km/h) is small, the use of a trunk on the vehicle roof does not have severe negative impacts on the aerodynamic drag force. One advantage of decreasing the car size to a non-trunk hatchback car is a reduction in car weight, which positively reduces fuel consumption and air pollution, with consideration to the considerable daily mileage traveled of taxis. Also, the lower price for small cars and lower maintenance costs could be strong motivation for taxi drivers and fleet managers to downsize taxi vehicles.
In terms of safety, when the vehicle is small and has a lower weight, the safety of drivers, passengers, and pedestrians in an accident can be decreased, according to Newton’s law. In metropolises with high population densities and relatively low traffic speeds for taxis, the probability of accidental injuries to passengers can be decreased, because the kinetic energy will be lower for smaller cars. Also, automakers improve safety issues with side airbags and more residence chassis productions, and drivers have better maneuvering capability with small vehicles to avoid incidents [7].
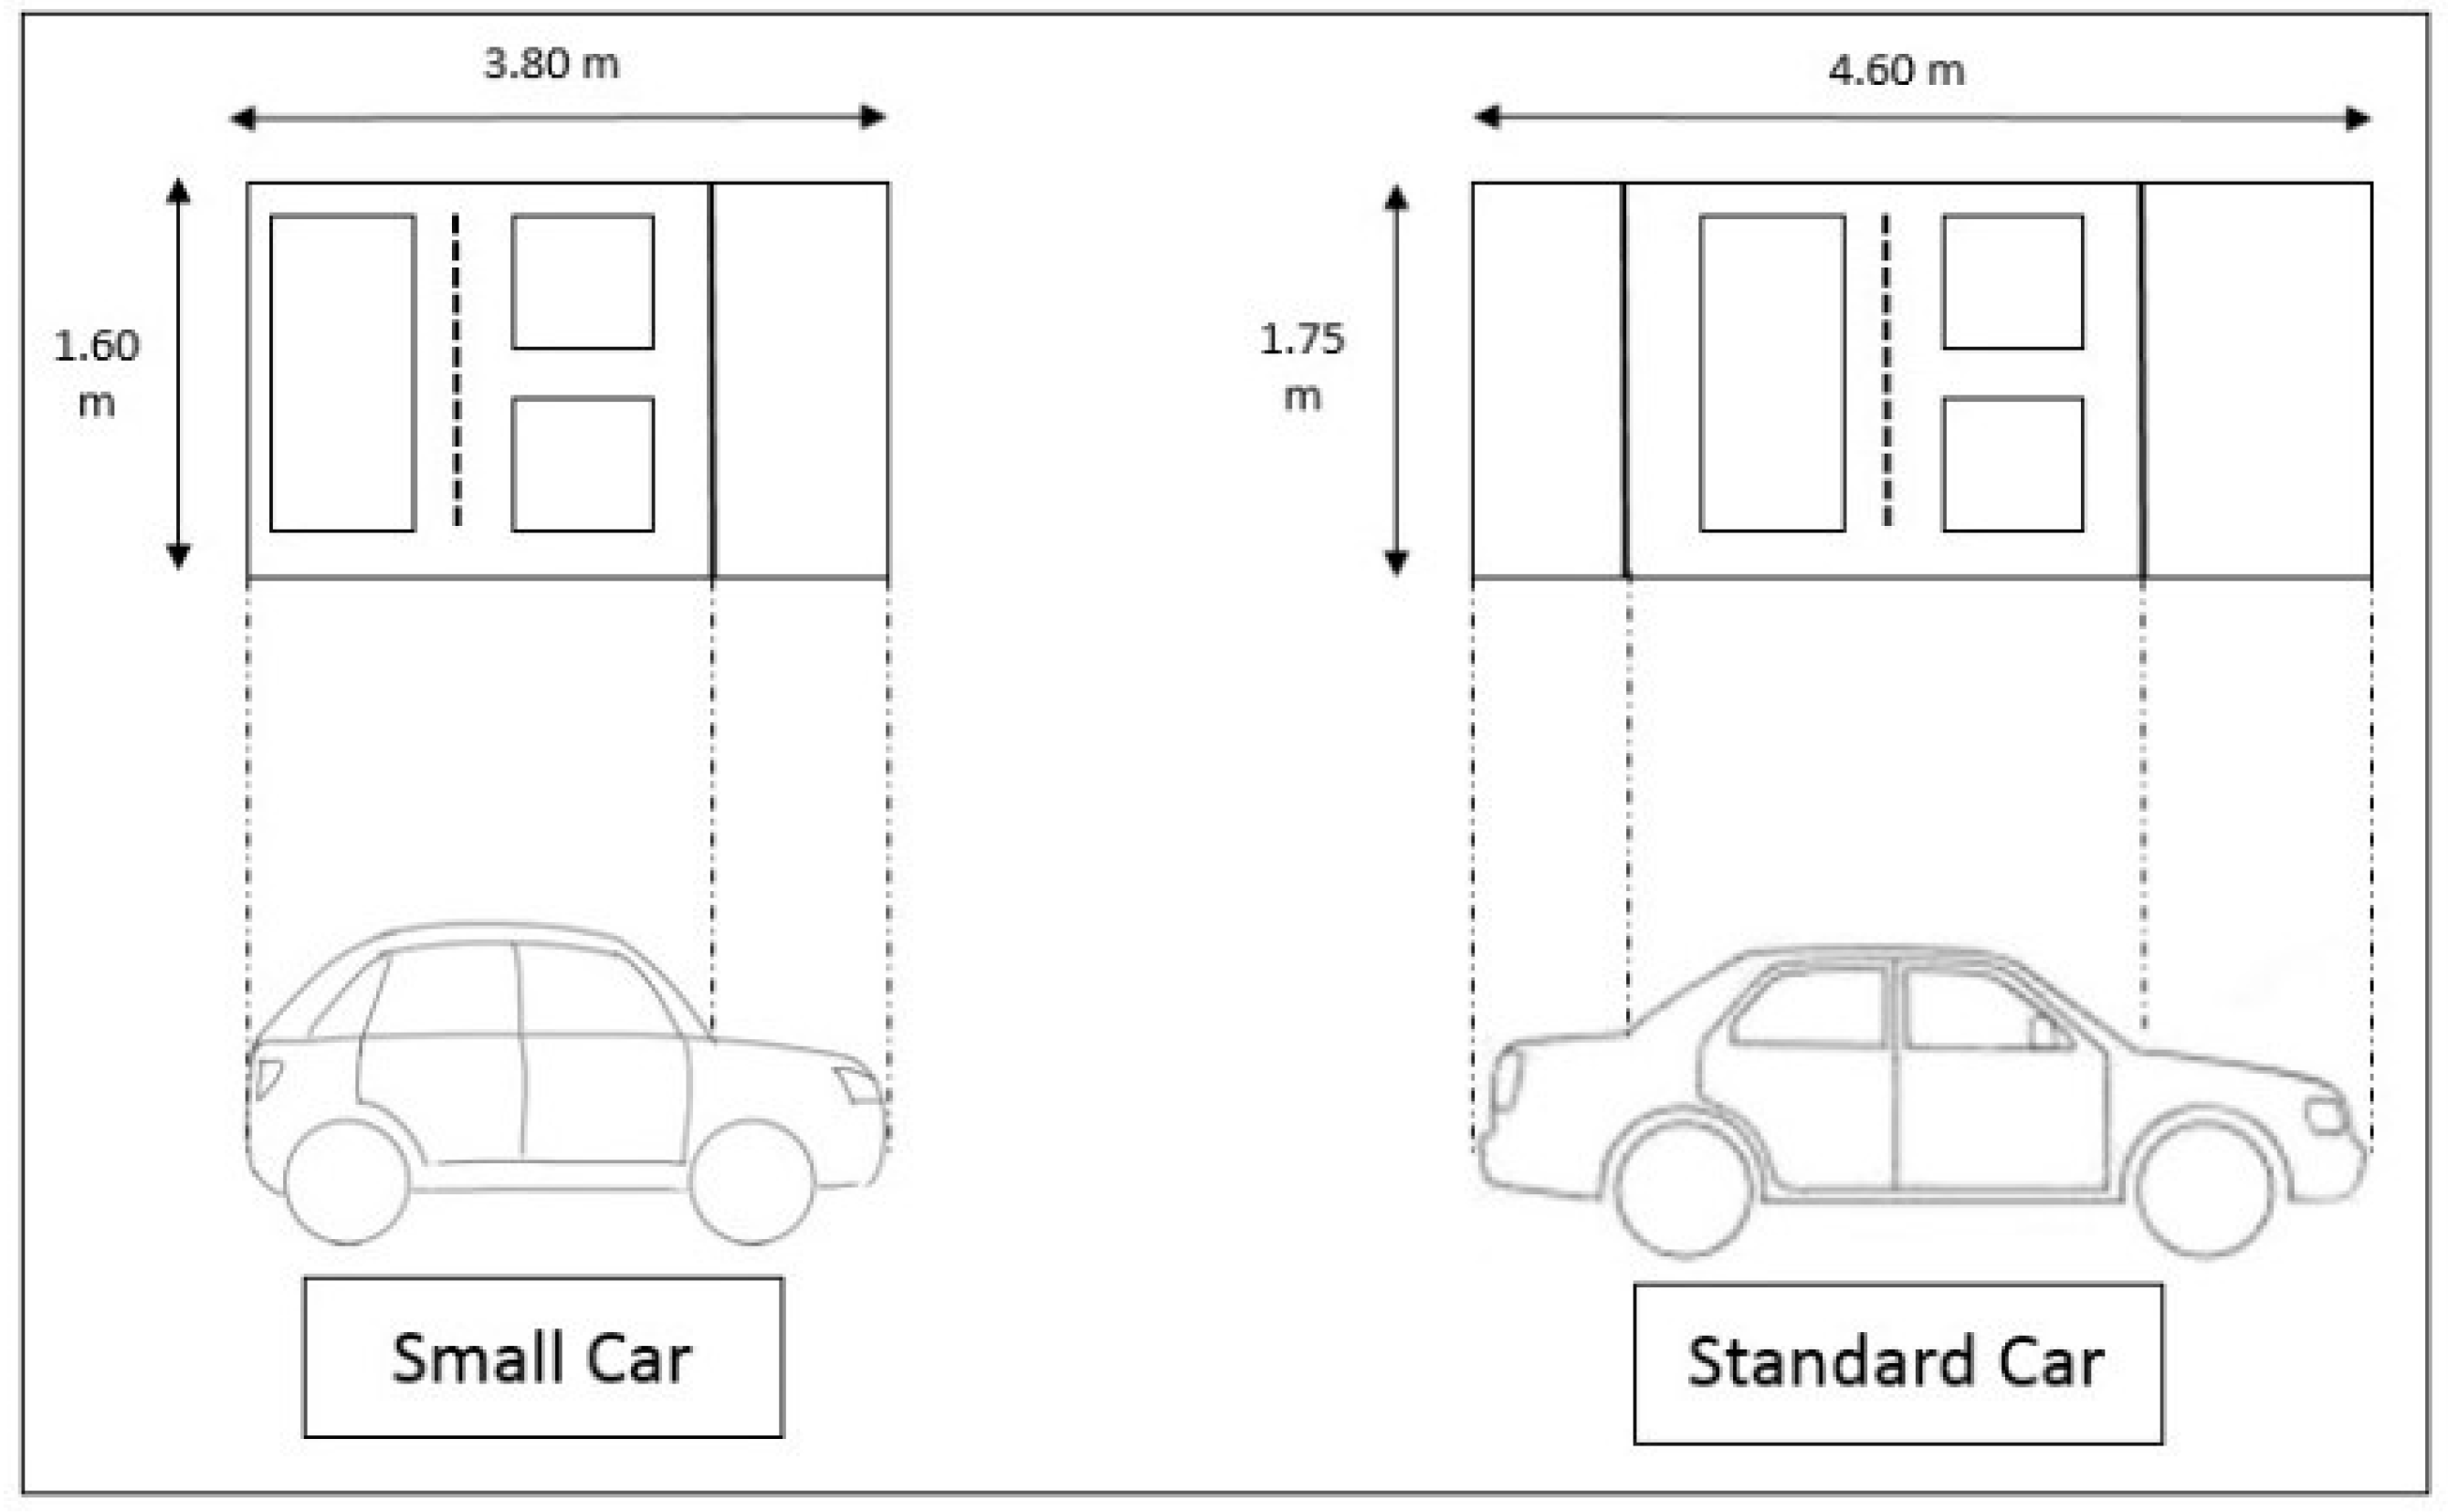
The definition of a small car in this study is a four-door hatchback, non-trunk, two-seat rows car, which is smaller than standard taxis by 80 cm in length and 15 cm in width. Figure 1 presents a schematic design of the two cars. The left image is a small car (according to some models of hatchback vehicles, such as Toyota Aygo, Citroen C1, BYD F0, Chevrolet spark, Peugeot 108, Skoda Citigo, Kia Morning, Mini Cooper, Geely Merrie, Hyundai I10, Fiat Panda, Volkswagen Up) and the right image is a standard taxi in Hangzhou, China (Hyundai Sonata).
In this research, we investigate the influence of replacing the current taxi vehicles with small cars through the following procedures: (a) field data are collected at nine locations representative of Hangzhou for investigating how many passengers use taxi trunks; (b) GPS data of over 7000 taxis are analyzed to reveal the travel patterns of taxi passengers, temporal profiles of taxi speeds, most popular taxi trips, and average daily travel mileage; and (c) we estimate and discuss the effects of taxi downsizing on fuel consumption, emission, safety, and financial issues.
The rest of the paper is organized as follows: Section 2 presents a literature review of the taxi GPS data usage, taxi fuel consumption, air pollution, and safety. Section 3 describes the taxi fleet in Hangzhou and shows the results of field data. Section 4 presents the impacts of taxi downsizing on fuel consumption, emission, safety, and economic efficiency. Section 5 presents a summary of the effects of taxi downsizing on the taxi industry and sustainability. Finally, Section 6 concludes the paper and outlooks for future research.
2. Literature Review
The role of taxis is significant as a part of urban public transportation systems. For instance, taxis account for 20% and 25% of the number of daily trips in Shanghai [8] and in New York City [9], respectively. According to the Government of Hong Kong [10], more than one million people used taxis for their daily trips, with a total number of 15,000 taxis in the city. Another study by Yang et al. [11] showed that 60% of trips in the central area of Hong Kong were completed by taxi. In this section, a literature review of relevant studies on transportation sustainability, taxis, taxi GPS data, and effects of urban taxis on the air pollution emission, fuel consumption, and safety is presented.
2.1. Transportation Sustainability
The World Commission on Environment and Development defines sustainable development as, “development which meets the needs of the present without compromising the ability of future generations to meet their own needs” [12]. Sustainable development suggests a good balance between present lives and caring for future communities [13]. Sustainability is commonly explored in terms of the theories of sustainable development, and public transportation is a major issue of urban sustainability, which has impacts on the economy, environment, and society [14]. These three categories of issues are the primary considerations of sustainability, and sustainable transportation aims to meet the requirements to maintain sustainability [15,16].
Transportation is a major source of air pollution [17]. Vehicles emit greenhouse gases (GHG) such as CO2, which have an impact on climate change and bring air pollution, which is harmful to public health [18]. GHG and air pollution have influences on both the environment and society. Therefore, there is a need to find a way to solve these problems and make the transportation system sustainable. Fergusson [19] pointed out that sustainable transportation should avoid damage to the environment. Cloutier et al. [20] addressed that sustainable transportation even has impacts on the well-being of society. Transportation has significant effects on economic growth [21]. Martin and Rogers presented that a transportation pattern developed the regional economy [22]. Mosaberpanahi and Khales [23] explained that the satisfaction of a community based on accessibility to a cheaper transportation system was a part of sustainable transportation.
2.2. Taxi GPS Data Analysis
GPS devices in taxis can be utilized to monitor travel patterns of passengers, e.g., movements and activities. Taxi traces show where passengers are picked up and dropped off, which routes are taken, and what steps the driver takes a cruise to find a new passenger. There are fruitful studies on the exploration of taxi GPS datasets in the literature. Some studies related to this paper are summarized as follows. Gühnemann et al. [24] studied the relationship between pollution and vehicle speed in cities. In each route, they obtained the vehicle speed by using GPS data, then estimated the pollution in different areas. Chang et al. [25] found out which areas in a city had high taxi demand according to the time, position, and weather conditions. Li et al. [26] estimated the volume of passengers in various hotspot places and prepared a strategy for vacant taxis according to the historical taxi GPS trajectories. Fathi and Krumm [27] illustrated the distribution of GPS paths near a location by a localized shape descriptor for searching road intersections automatically. Zhang et al. [28] showed that it was possible to estimate travel time and speed by using GPS data. With taxi GPS data, it was known where passengers had been picked up and dropped off, which was very useful for detecting locations of high-ranking interest. Wang et al. [29] analyzed the travel patterns of passengers by using hotspots of pick-up and drop-off locations. Liu et al. [8] found that the land use of different areas (e.g., commercial, residential, and recreational land use) affected taxi pick-up and drop-off patterns. Luo et al. [30] used the taxi GPS data in Shanghai Metropolis for determining the distribution of fuel consumption and emission, then provided a spatial–temporal map of emissions.
2.3. Fuel Consumption
As is well-known, a moving vehicle needs energy to overbear gravitational losses, aerodynamic force, and rolling resistance. An increase in mass requires that the engine burn more fuel. Decicco and Ross [31] found that a 10% reduction in automobile mass with 1300 kg weight would gain a 6% saving for fuel. In another study, Burgess and Choi [32] showed that car energy demand was intimately related to the car mass. They estimated that a 10% reduction in the mass of a car decreased the energy demand by 8%. Cheah and Heywood [33] used computer simulation software to show that the fuel-saving would be 0.3–0.4 L/100 km if the car mass was decreased by 100 kg.
2.4. Air Pollution
In the literature, to the best knowledge of the authors, there was no fruitful work about taxis in selecting various fuels, powertrains, spare part expense, or carbon footprint impact. Gao and Kitirattragarn [34] investigated the impact of taxi fleet emissions in New York City. The results showed that emissions were reduced by 2.29% for CO2, 1.45% for CO, 1.12% for HC, and 1.7% for HO, by replacing 10% of taxis with hybrid-electric vehicles (HEVs). Another case study in Mexico City presented that the taxi fleet accounted for 6% of the daily trips, but it produced 13% of greenhouse gases (GHG) and 10% of NOx and CO of the road transportation [35]. Wang et al. [36] measured the whole vehicle kilometers traveled (VKT) in Shanghai and showed that taxi VKT was 18.2% and taxi emissions for CO and NOx were 22.2% and 10.4%, respectively. In recent research, Li et al. [37] revealed the effect of taxi pollutant emissions in Nanjing. They suggested providing high-quality fuel and improving the taxi occupancy rate to help reduce taxi pollution.
2.5. Safety
The automobile mass and speed are two important factors of harm and fatality for passengers. Kahane [38] showed that even a 50 kg reduction in car mass (but not truck mass) would improve safety, by decreasing the number of fatalities in other cars, pedestrians, bikers, and motorcyclists. Wenzel and Ross [39] discovered that drivers had a high risk with car mass reduction. Tolouei and Titheridge [40] considered the relationships of mass, fuel consumption, and safety. They expressed that car mass made a conflict between safety and fuel savings. The advantage of mass deduction was fuel saving but might change the crash risk. Nevertheless, there were a few studies on this matter which had inconsistencies with the results. Kahane [41] presented that injury risk decreased with increasing the car mass. Their outcomes, based on data of 13 countries, demonstrated that there was no relationship between changes in these two different issues [42]. Ross and Wenzel [43] presented that even many sport utility cars (SUVs) were more dangerous for drivers in contrast with subcompact cars.
Regarding the impact of speed on safety, Buzman et al. [44] realized that a 10% reduction of speed in the collision could decrease injuries and fatalities by 24% and 40%, respectively. Also, that World Health Organization [45] reported that a driver could increase the crash risk of injury and fatality by 3% and 5%, respectively, by increasing their average speed by 1 km/h. Kloden et al. [46] presented that if the speed was higher than 60 km/h, the accident risk would double with a speed change of 5 km/h.
There are many studies in the field of fuel consumption, vehicle mass, and air pollution, but the focus has usually been on private vehicles. In this paper, we study the effects of taxi downsizing on some issues, such as pollution, fuel consumption, safety, and economic efficiency, which are significant for urban transportation systems and sustainability. Taxis have high maintenance costs due to the high annual mileage and high initial investment cost. Renewing is required after a certain operational period (usually five years). Besides this, they usually move in city centers and regions with a high population density, vehicular pollution, and traffic jams. Thus, these considerations motivate us to understand the impacts of taxi downsizing on fuel consumption, emission, safety, and economic efficiency, and furthermore, to evaluate the impacts on transportation sustainability.
A method with high validity feedback for cognizing the influence of taxi downsizing on the aforementioned factors is naturalistic driving (ND). This method gives results based on driving under real conditions, with minimum external effects. In this case, we could choose two kinds of taxi, small taxis and standard taxis, and get the feedback after a certain time, so that the results would be reliable based on the real conditions. Balsa-Barreiro et al. [47,48] worked and explained the basis of this method. For our study, this method would be costly, and we could not conduct the real test, so this would be worthwhile for future studies.
3. Data
3.1. Taxi Fleet in Hangzhou
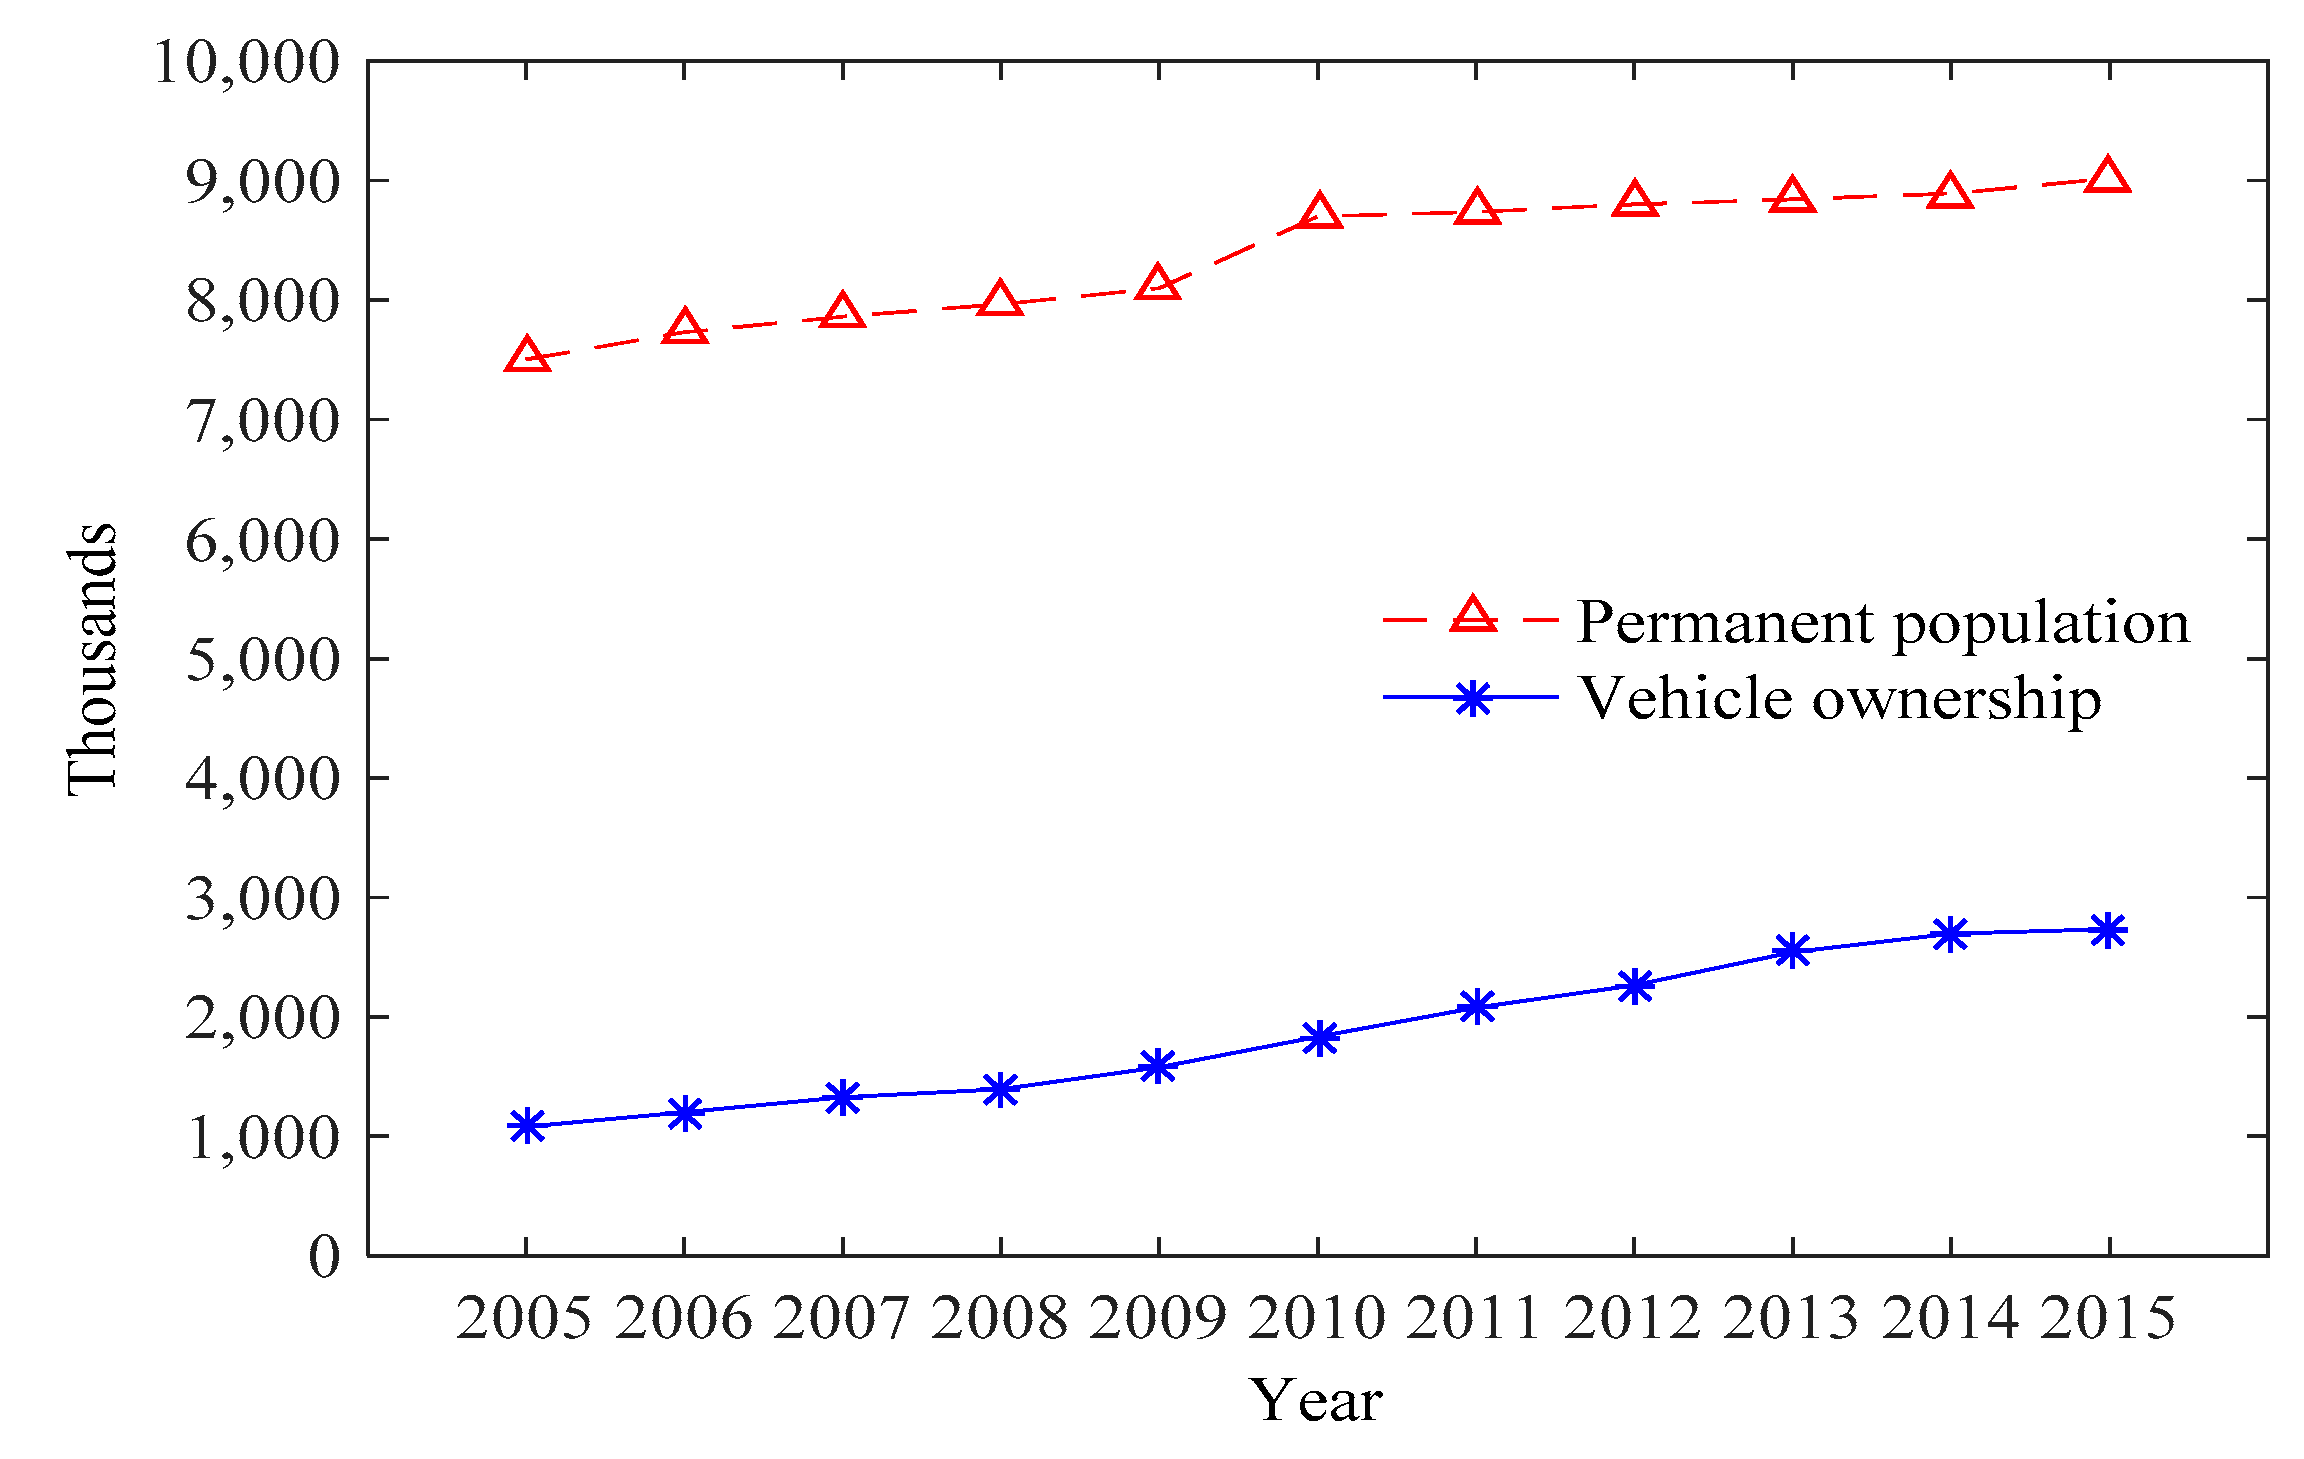
Hangzhou is the capital city of Zhejiang Province, which is located in the eastern part of China. It is a densely populated city, with over 8.7 million people dwelling in an area of around 3000 km2. There were 12,600 taxis in Hangzhou in 2016 [49]. In the past decade, the total vehicle ownership dramatically grew from approximately 1 million in 2005 to 2.9 million in 2015, see Figure 2. The permanent population in Hangzhou has grown relatively slowly since 2010 and remained steady in recent years [50]. By the end of 2015, one in every three residents in Hangzhou owned a car.
3.2. Taxi GPS Data
Data used in this study were retrieved from a large dataset of GPS traces collected by 7081 equipped taxis in Hangzhou. As shown in Table 1, the sample columns include the location (longitude and latitude), time and date, vehicle ID, operation status (occupied/vacant), spot speed, and movement direction. Each GPS signal was captured every 60 s. During nine days (22–30 June 2015), there were 271,117,329 rows of data recorded. By eliminating missing values and removing invalid points caused by data recording or transferring errors, the final samples consisted of 6462 taxis and 202,196,343 records. In this study, the duration of two continuous samples of GPS data varied between 5 s and 50 s, with most of them being 20–30 s, and a few up to 180 s due to data transferring errors. The percentage of invalid GPS data and errors was low according to our previous studies in [51], although Balsa-Barreiro et al. [52] introduced a method for estimating the positioning of large volumes of data quickly and with a high level of accuracy.
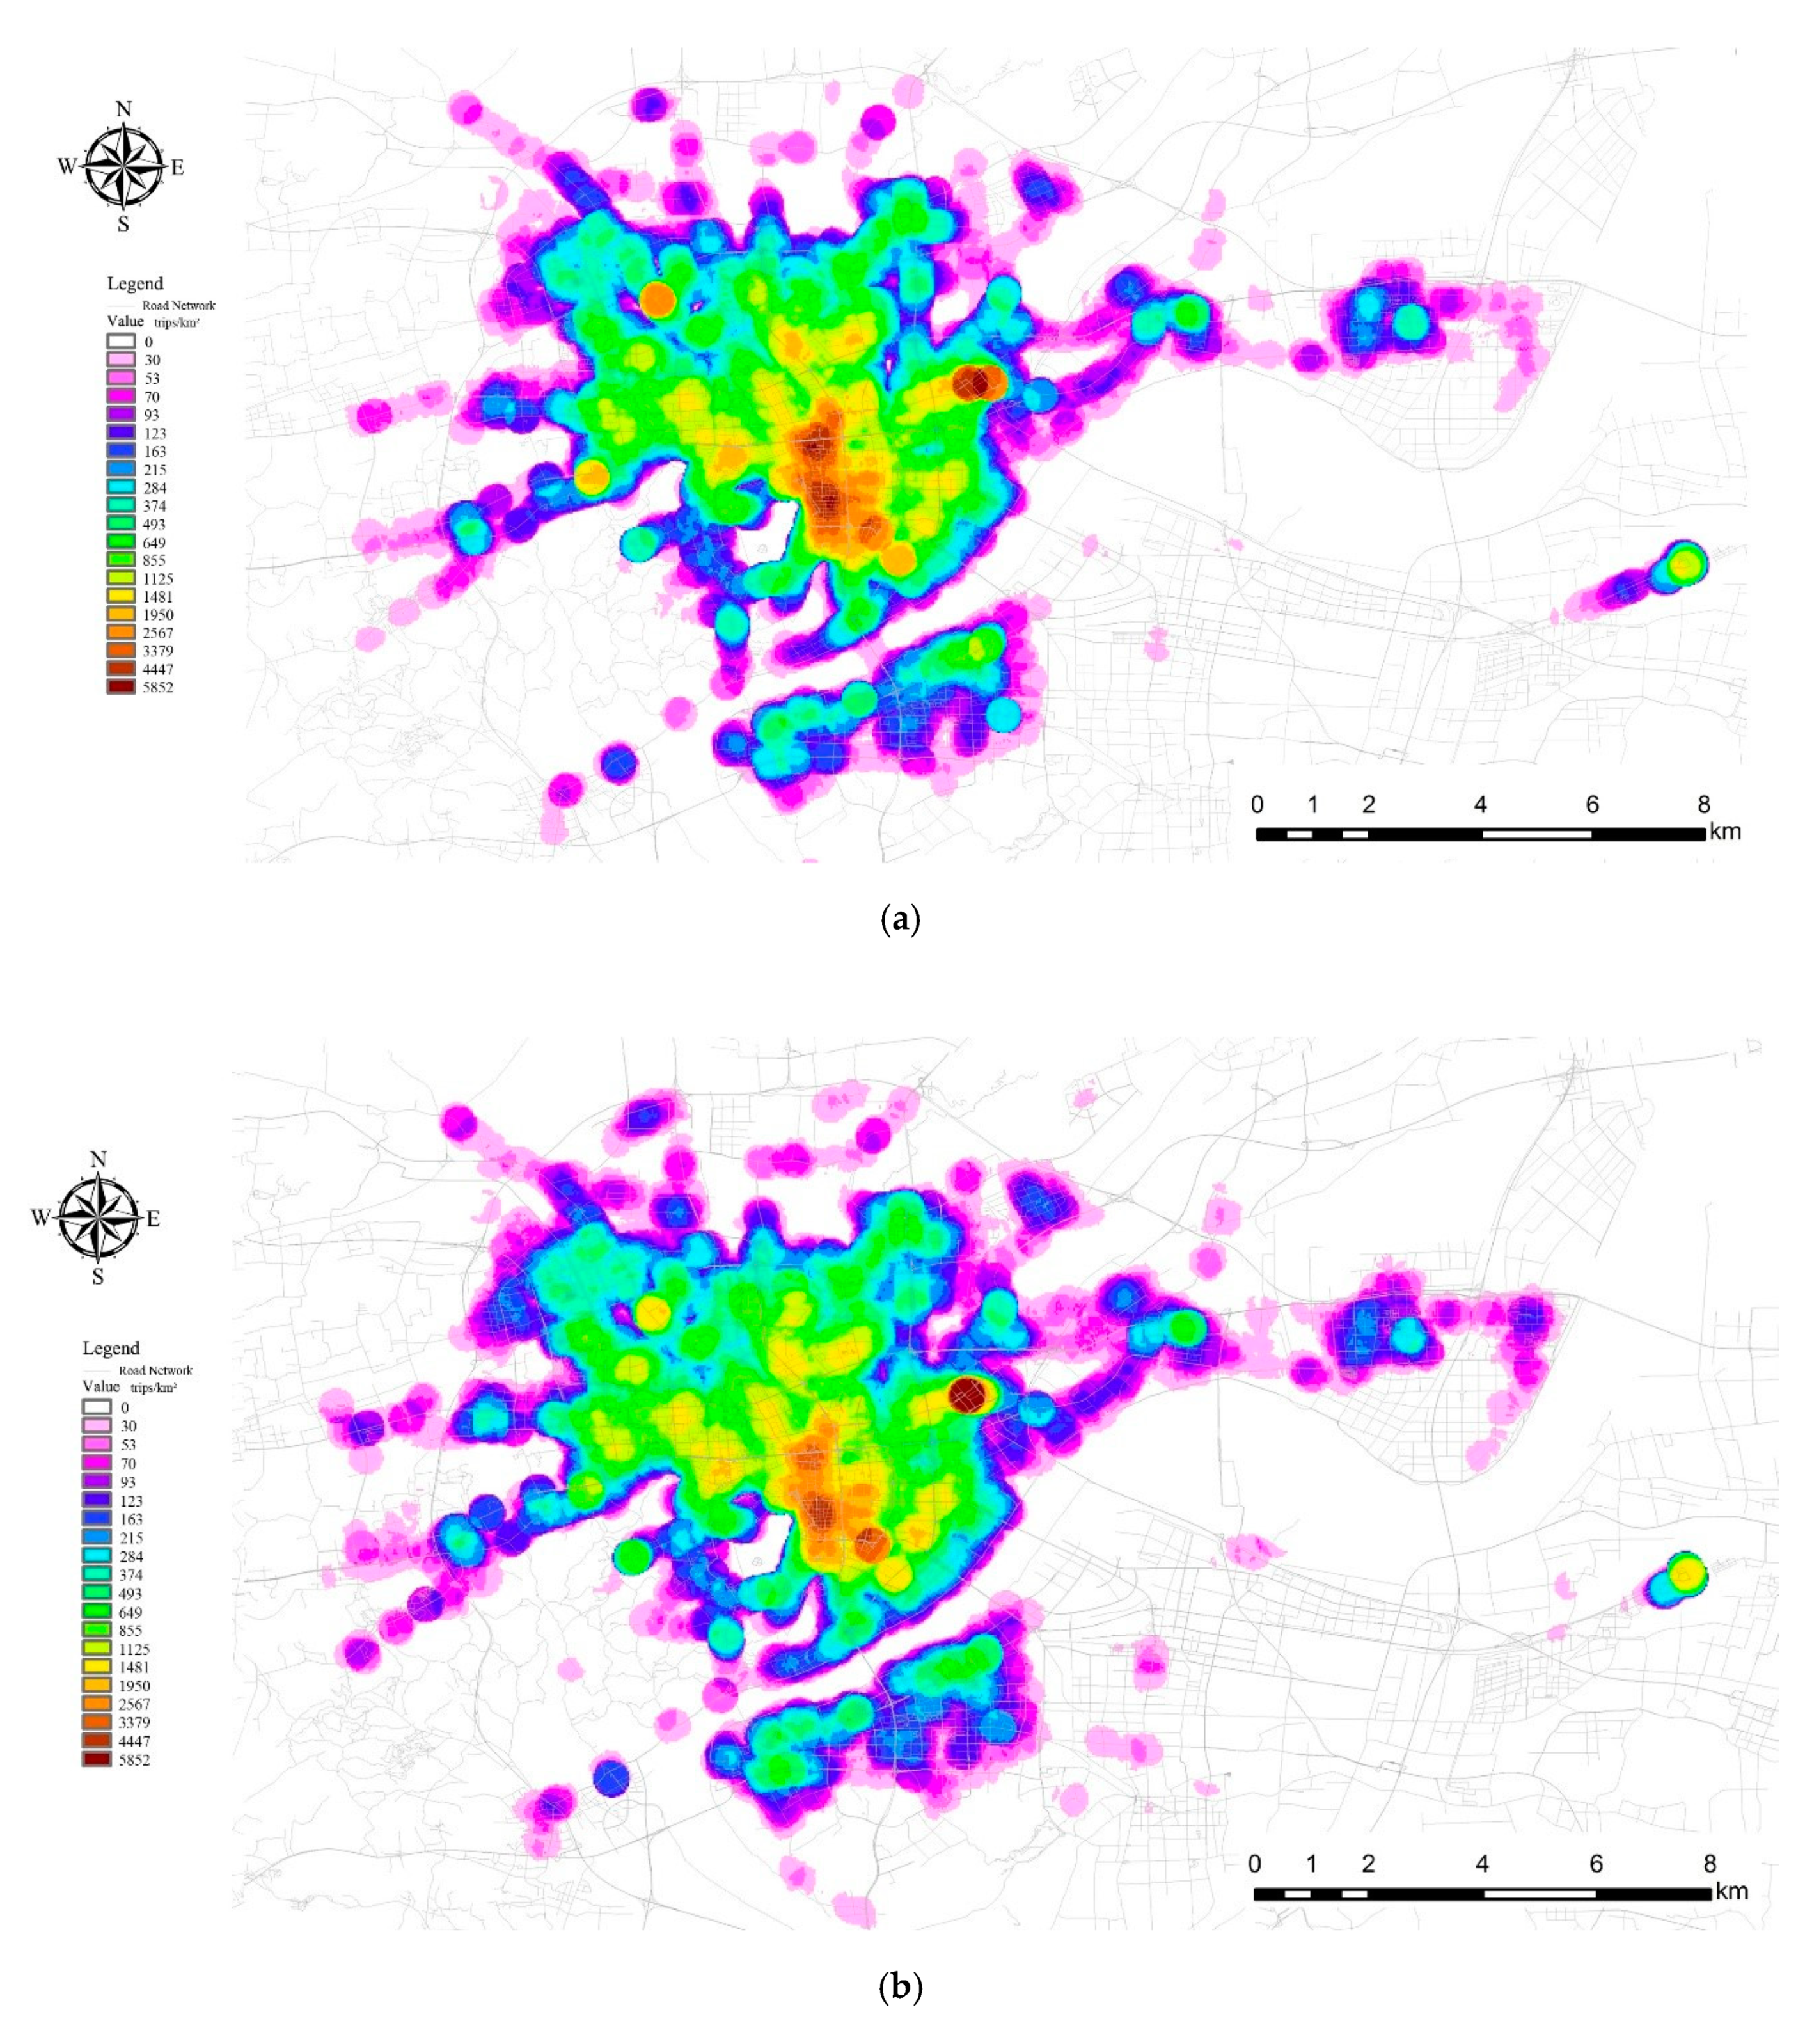
Usually, when people talk about taxis, the long queues and high density of taxis in transportation terminals come to mind. So, in the first step, we aimed to find out the percentage of taxis that provide services around these places. Based on the analysis of the taxi GPS data, Figure 3 illustrates taxi trip distributions of origin and destination in Hangzhou. The results show the percentages of taxi trips at the major transportation hubs and terminals, such as Hangzhou East High-Speed Rail (HSR) Station, Hangzhou Xiaoshan International Airport, and Hangzhou Railway Station were about 5.2%, 2.2%, and 2.1%, respectively. Figure 3 also shows that around 70% of the taxi trips originated from or terminated in the city center, based on the GPS data. Then, we mainly observed the taxi usage in the busy urban areas (including both railway stations) and omitted studying the usage of taxis by airport passengers because of the low percentage of taxi trips from/to the airport (about 2.2%).
3.3. Observation Survey Data
To explore whether the current taxi size is proper, we did a visual survey on the whole taxi fleet to find out how many passengers shared a ride for each taxi trip and how many passengers utilized the trunk. According to the density of the pick-up and drop-off locations of taxis (as shown in Figure 3) and with consideration of diversified land use, nine busy places were selected for conducting supplementary surveys. These locations included one shopping mall, two intercity bus stations, two train stations, one metro station, and three tourist spots. We manually counted the number of passengers and trunk usage based on our visual inspection.
We investigated these nine sites and observed 1110 Hangzhou taxi fleet trips. Only 12% (134 trips) of the trips observed used the trunk, while the majority of taxis (88%) did not open the trunk in the trip. Most of the trunk usage was at the railway stations (28%), and the lowest usage rate was at the shopping mall, i.e., 5%. According to the observations, 60% of taxis picked up only one passenger, 29% of taxis picked up two passengers, and 11% of taxis picked up three or four passengers. It is noteworthy that all of the data were collected on sunny working days on 30 May and 2 November 2016. The results are summarized in Table 2.
Normally, the trunk usage at intercity bus stations and railway stations is more frequent than other places, since passengers have long trips with suitcases. There was a significant difference in the trunk usage by passengers at Hangzhou East HSR Station and Hangzhou Railway Station. The reasons for this include: (a) HSR fare is more expensive than the ordinary train fare, and usually, high-income travelers prioritize HSR, and (b) most of the taxi passengers at the HSR station were one or two people, and they often did not have large luggage during the investigations.
4. Results
4.1. Fuel Consumption
The weight of a hatchback car, which could be used as a taxi, is set as 950 kg, while the weight of a regular taxi vehicle in Hangzhou is 1350 kg. The relationship between car weight and fuel consumption was provided by Hao et al. [53]. For every 100 kg reduction in the vehicle weight, the adjusted fuel consumption rate can be decreased by 0.4 L/100 km, given by:
where is the reduction of the average fuel consumption rate (L/100 km) and is the reduction of the average vehicle weight (kg).
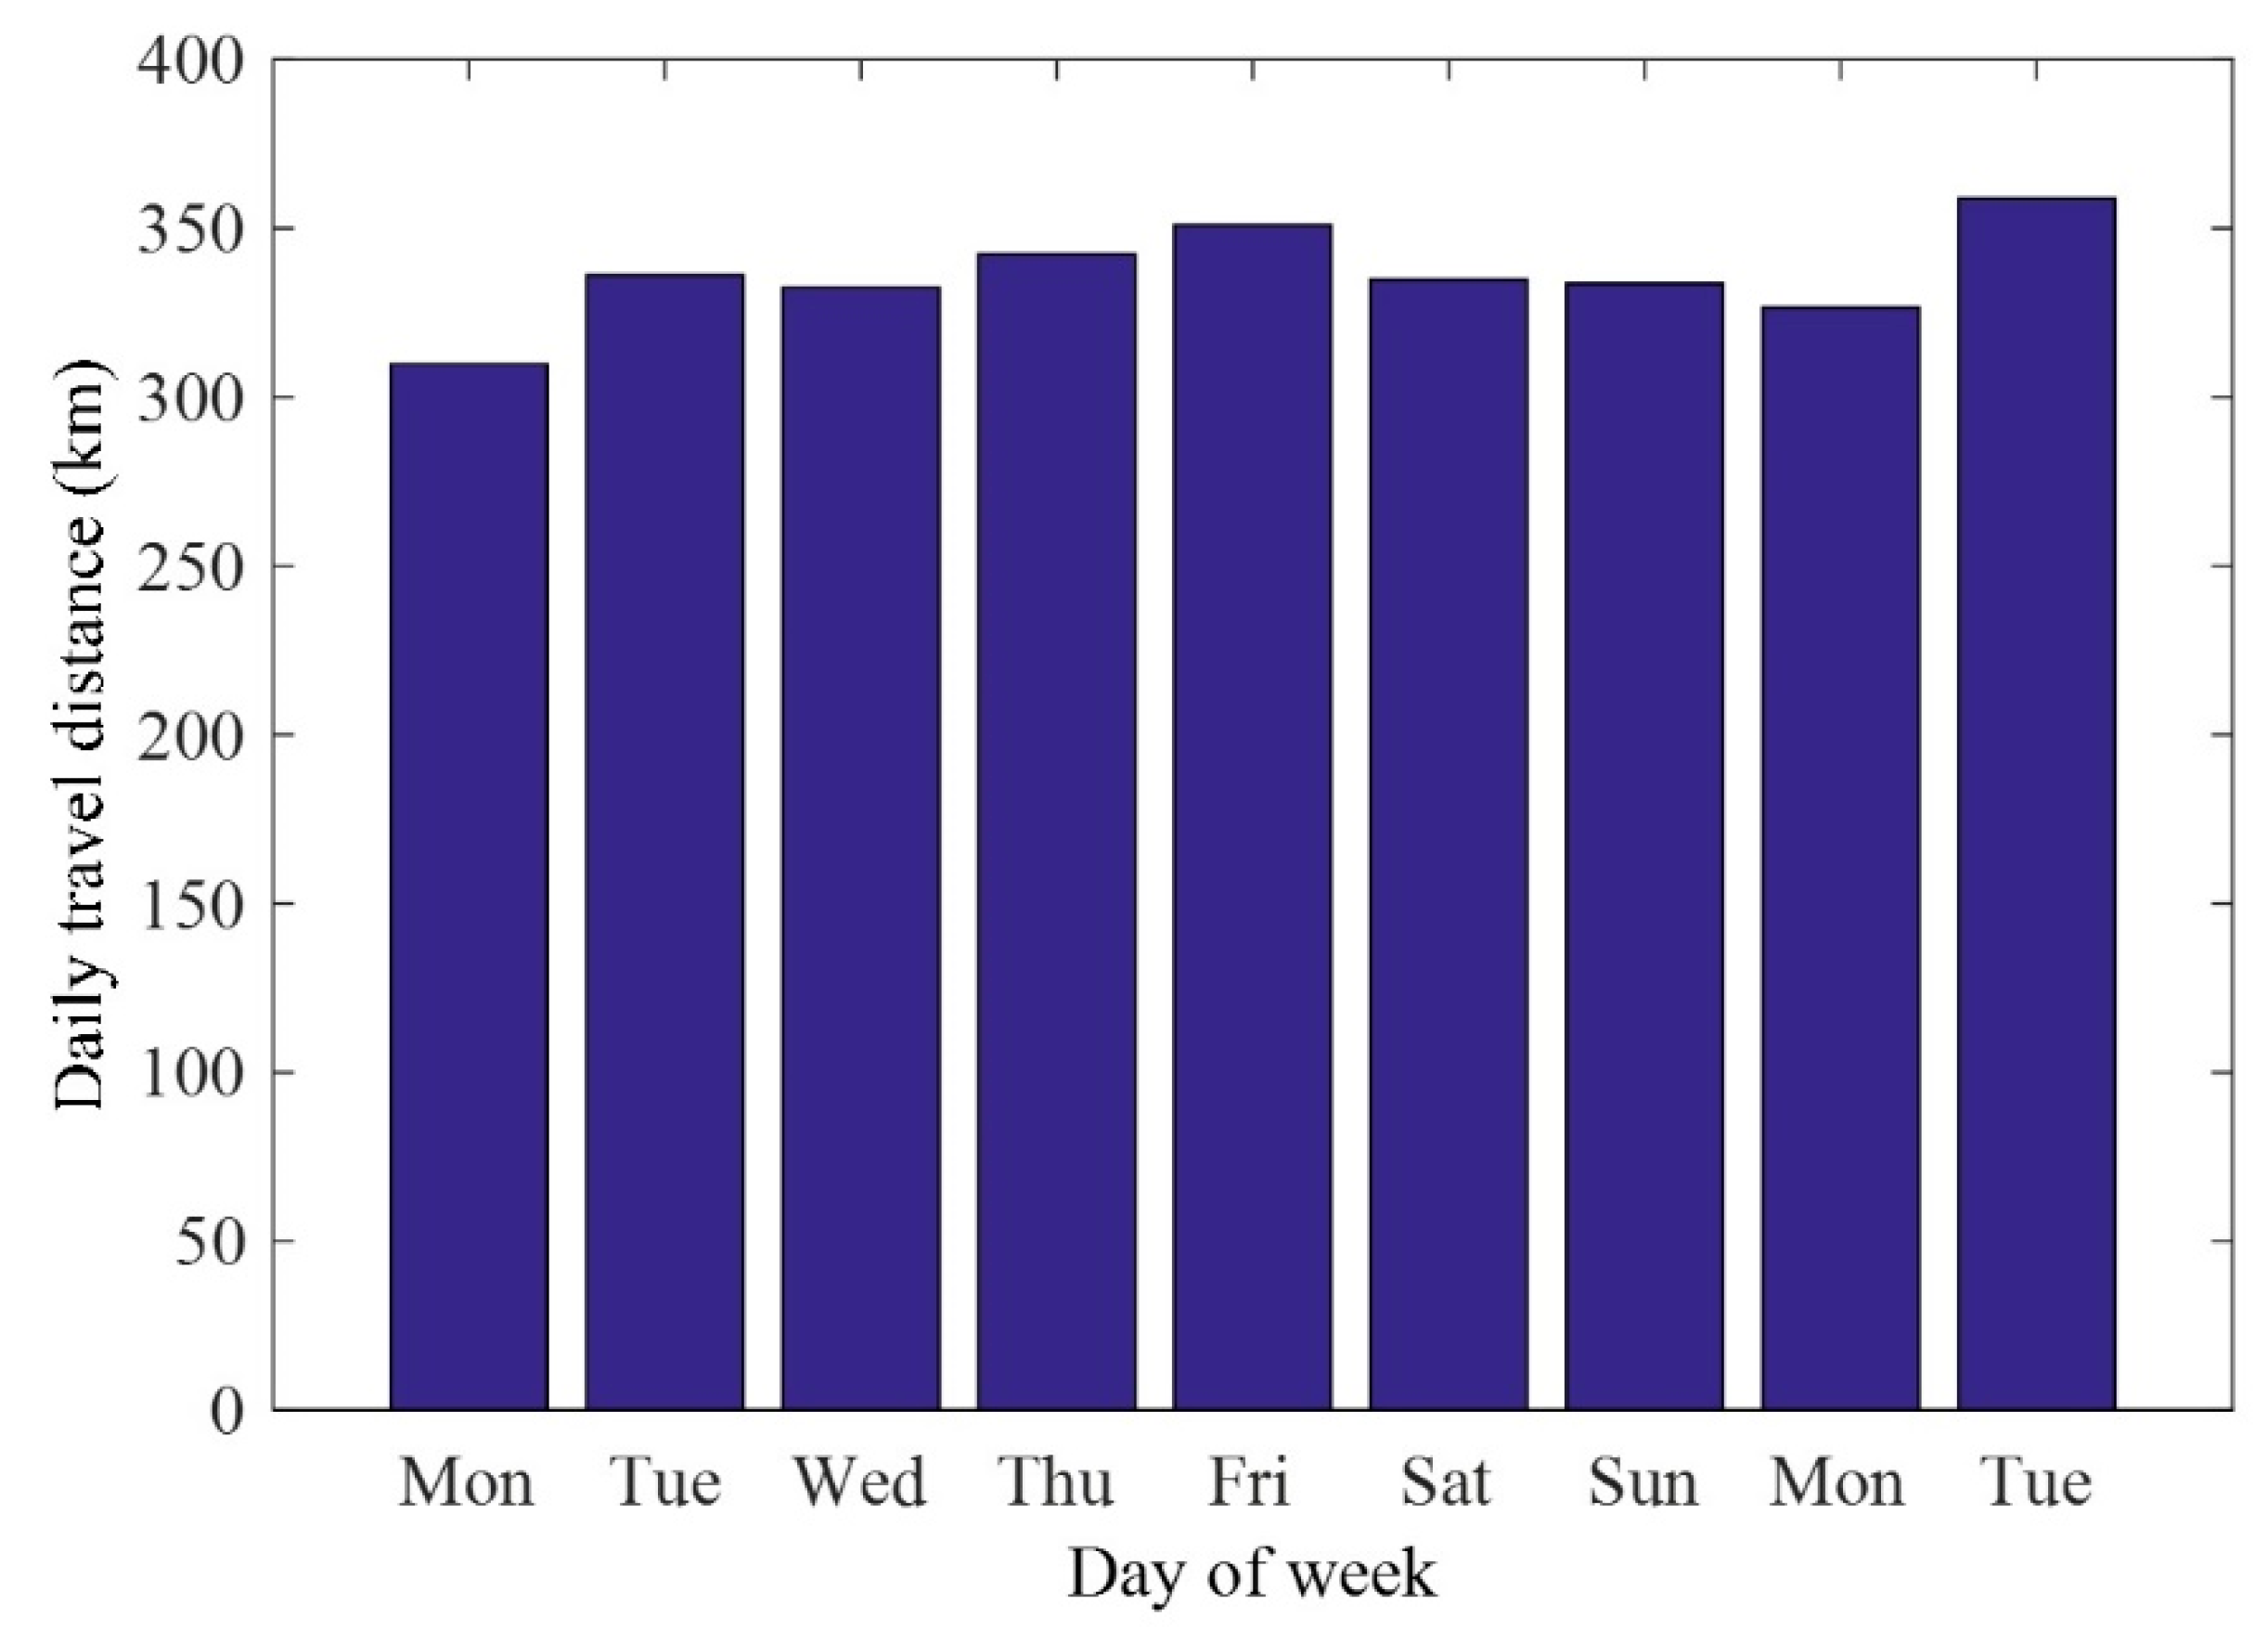
There are around 12,600 in-use taxis in Hangzhou, China. Based on the field investigation of this study, approximately 88% of taxis do not use the trunk, and 89% of taxi trips are only occupied by one or two passengers. If we assume that 50% of the current taxis, i.e., 6300 taxis, would be replaced with small cars, the benefits would be significant. Since small cars are, on average, 400 kg lighter than regular taxis, according to Equation (1), the fuel consumption reduction of small cars will be 1.6 L/100 km. As shown in Figure 4, our study on taxi GPS data shows that the average daily travel mileage of taxis in Hangzhou is 336 km.
The annual mileage of each taxi can be 100 thousand km, with 300 workdays for taxis per year. Therefore, the fuel consumption reduction for each taxi will be . Then, this value for 6300 small taxis will be . This saving can be even larger, since heavy taxis have more fuel consumption in the stop-and-go traffic of urban areas. The importance of fuel saving in Shanghai, with 46,000 taxis [54], Beijing, with 66,000 taxis [4], and Athens, with 14,000 taxis [55], would be more meaningful. Small cars possess numerous environmental and economic advantages, among which the lower fuel consumption and emissions are the most important aspects.
An essential type of emission by gasoline vehicles is CO2, which relates to fuel consumption and results in greenhouse gas (GHG) problems. For example, Oliver et al. [5] demonstrated the taxi cabs in Tianjin, China, generated 33% of GHG and 25% of CO emissions from all the city’s vehicles. In Hangzhou, air pollutants and CO2 emissions produced by vehicles were at an alarming level, and about 77% of CO2 emissions of the transportation sector were from cars and two-wheelers [56]. These problems reveal the severe issue of taxi-related air pollution emissions in Chinese cities. Thus, using small car taxis might be a solution to reduce vehicle emissions.
Car downsizing, which results in a lower weight, is one of the accelerators for the transformation of taxis with a fossil fuel engine to hybrid-electric engine vehicles. The Chinese Government had a programme to develop EV taxis in different cities [57], for example, replacing all gasoline taxis to EV taxis in Taiyuan city in 2016 was a plan in this regard [37]. As reported by Jong et al. [58], the car weight is one of the main concerns for the higher energy store and efficiency of electric batteries.
4.2. Air Pollution
The downsizing of taxis analyzed by this study could be an essential and applicable factor to reduce emissions from both environmental and economic perspectives. He et al. [59] illustrated that the average fuel efficiency was 11.03 km/L, based on the data of all passenger cars in China. An et al. [3] showed that the fuel efficiency of taxis in Harbin was between 10.5 km/L and 11.6 km/L. Then, a reasonable assumption of the fuel efficiency for standard-car taxis in Hangzhou could be 11 km/L or 9 L/100 km.
As shown in Figure 4, we calculated the average daily mileage of taxis, i.e., 336 km, in Hangzhou, which was close to 320.1 km in Harbin [3], 300 km in Shanghai [36], and 360 km in Beijing [4]. For measuring the emission due to the daily vehicle kilometer travel (VKT), we chose three emissions (i.e., CO, NOx, and HC) because they are the primary pollutants from gasoline vehicles, as presented by Gwilliam et al. [60]. Guo et al. [61] expressed that in Hangzhou gasoline vehicles produced high CO and HC emissions as well as low NOx, with the average emission factors of 193.08 ± 15.63, 9.52 ± 2.40, and 5.54 ± 0.48 g/L, respectively.
In terms of decreasing fuel consumption by small taxis (a small taxi that is replacing a taxi in the fleet), the emission reduction is estimated in Table 3. Considering 300 workdays for each taxi vehicle annually, the total decrease in emissions is estimated to be 311.9 kg for CO, 15.4 kg for HC, and 8.9 kg for NOx. If 50% of the taxi fleet is small cars (i.e., 6300 taxis), annual emissions will be decreased by 1965 ton for CO, 97 ton for HC, and 56 ton for NOx. As a hatchback car with the weight of 950 kg has approximately 1600 L/year lower fuel consumption than a regular taxi vehicle, the total daily air pollution reduction of each small car is 1.1 kg, and the annual emission is estimated to decrease by 17.8%.
Since taxis generate greater daily mileage than most private cars in the urban road network, emissions produced by taxis have become an essential source in urban areas.
4.3. Safety
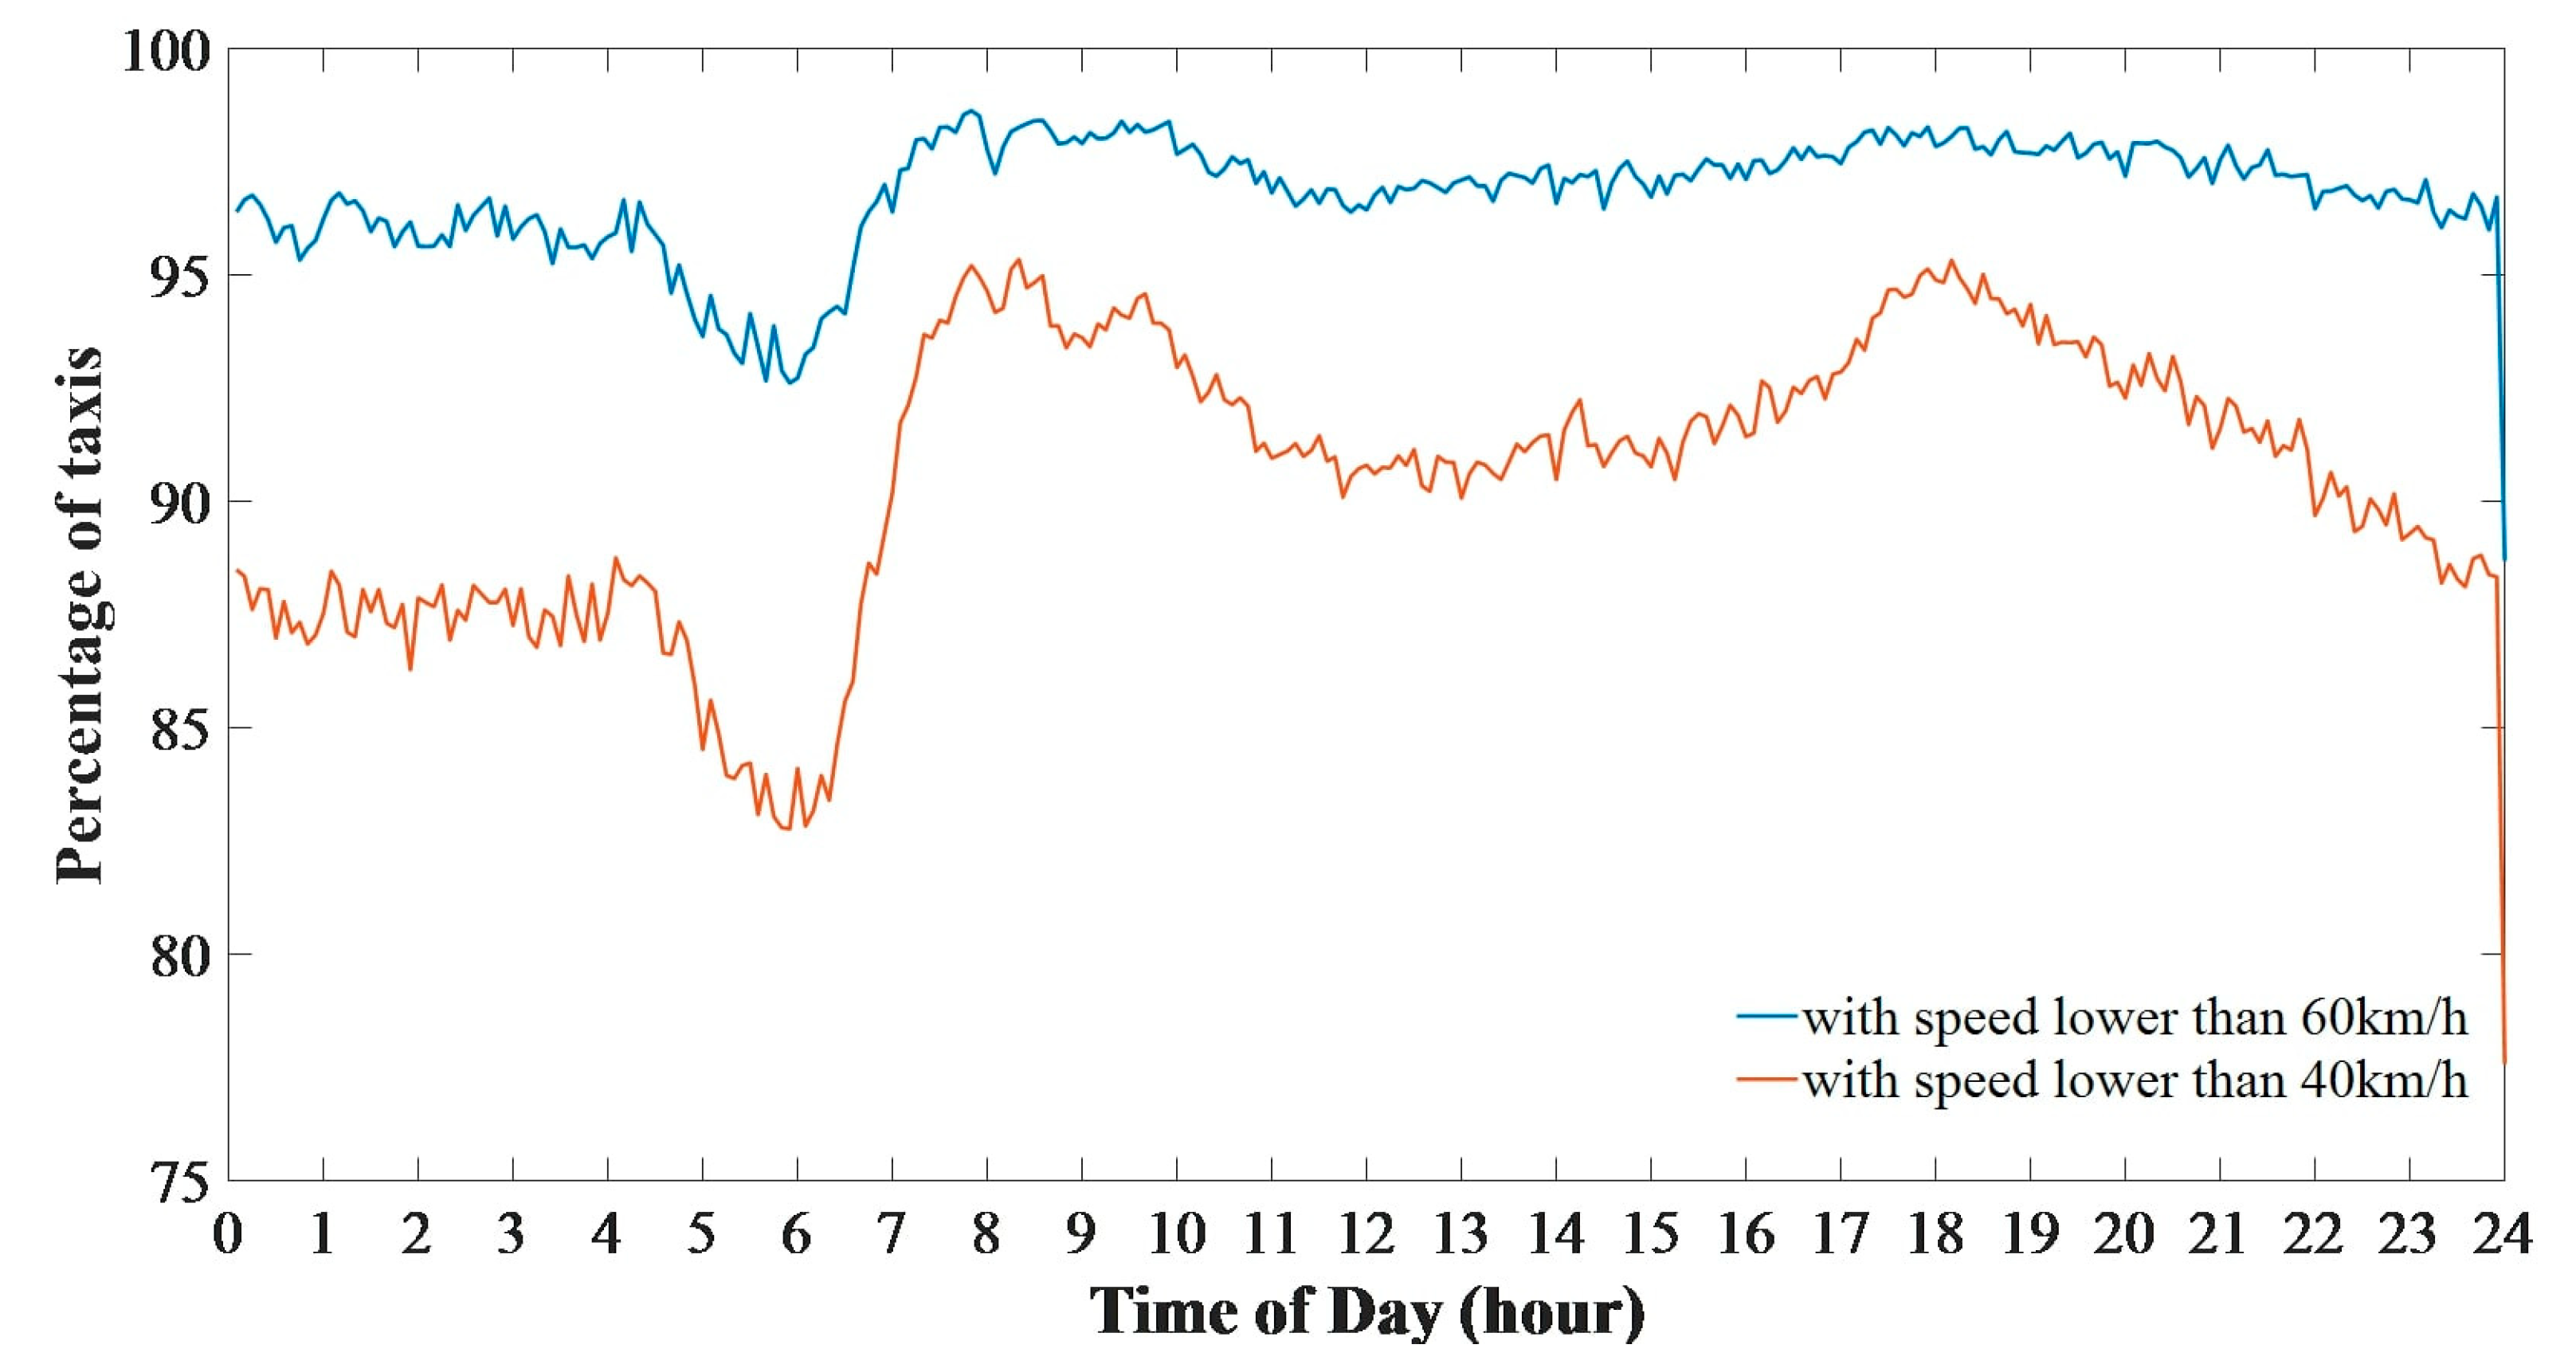
Speed is always considered one of the most original and significant traffic parameters, which makes it the main effect on accident risk and injury severity. Driving with a higher speed obtains a higher kinetic energy, so that it makes more intensive injuries in a crash. A lower speed reduces the probability and severity of crashes. During the daytime, taxi drivers can move when serving passengers or stay in the queue when being vacant. It is interesting to note that according to the International Association of Public Transport (UITP) in 2001, the average traffic speeds in some cities, like Bangkok, Manila, Jakarta, Shanghai, London, and New York City, were 15, 18, 19, 20, 28, and 38 km/h, respectively [62]. Most cities in China have high population densities and heavy traffic congestion, especially in downtown areas. The average speed of vehicles is usually below 30 km/h. To obtain the driving speed, we analyzed the nine-day GPS dataset of 7081 taxis in Hangzhou (22–30 June 2015) and obtained an average daily speed of 23 km/h. In Hangzhou, the low average speed can be positive for the safety of a small taxi. For a better evaluation of small car safety, we calculated the speed of taxis every 5 min. Figure 5 shows the percentage of taxis driving below 40 km/h and 60 km/h with a time interval of every 5 min (25 June 2015). It is evident that during the majority of time, up to 95% of taxis drive below 60 km/h and up to 80% of taxis drive with speeds lower than 40 km/h. Therefore, the taxi drivers in Hangzhou seem to drive carefully, which is helpful for safety.
As shown in Table 4, according to the four vehicle safety test centers, the Insurance Institute for Highway Safety (IIHS) [63], National Highway Traffic Safety Administration (NHTSA) [64], European New Car Assessment Program (Euro NCAP) [65], and Australasian New Car Assessment Program (ANCAP) [66], the safety scores of small cars have recently increased and we can see most of the small cars have a five-star safety rating.
Many studies presented that the major violation of drivers is high-speed driving [67]. Three main factors of an accident include the reaction time, less control, and braking distance, which all depend on speed. At a higher speed, cars become more difficult to control. In a crash between a taxi and a pedestrian or cyclist, the fatality rate will increase hugely when the taxi speed increases. Rosen et al. [68] demonstrated that in an accident between an automobile with a speed of 20 km/h and pedestrians, almost all pedestrians survived, and at crash speeds of 40, 80, and 100 km/h, the percentages of survivors were 90%, less than 50%, and 10%, respectively. With the driving speed in Hangzhou (average on 23 km/h), the fatality rate could be low. Therefore, changing the standard cars to small cars would not bring safety issues. Besides, the World Health Organization reported [69] the largest group of fatalities in the road belonged to pedestrians. The pedestrian fatality rate increased by 27% from 2007 to 2016 [70]. Small taxis or small cars can reduce the rate, because small cars are more maneuverable (easier to control), and their low weight results in lighter crash energy.
How do we deal with the potential safety issues raised by the weight reduction of small cars? Given these considerations, small cars could be safe. This study suggests choosing a small car with high-grade safety in an accident as urban taxis by taxi service companies. Although, as Richardson and Ross [71] expressed, it is hard to make the best car according to the different culture demands based on the ideal speed, passenger capacity, convenience, weather protection, and passenger safety.
4.4. Economic Efficiency
To study the financial attractiveness of changing the current taxis to small car taxis, as an illustration, the authors examined a Peugeot 108 1.0 Active five-door [72] and a Hyundai LF SONATA 2.0 GLS [73] as taxis in Hangzhou. Some reasons for choosing these two types of cars include: (a) they are average-level products in the world; (b) Peugeot 108 has the proper size and weight for working as a small car; and (c) typical taxis in Hangzhou are Hyundai Sonata, but this version is newer and has better efficiency, and we hope to have a comparison between a high-efficiency car and small cars, such as Peugeot 108.
The replacement frequencies of components like oil and filters largely depend on driver behavior, travel distance, type of car, climate, and the geographical conditions of the roads. There are no accurate data available about changing frequencies of the spare parts, but it is clear that when a car works as a taxi, a driver should change the components, like oil filter, oil, air filter, brake pad, clutch plate, engine plug, and rubber, more frequently than private cars. Also, the initial price for each taxi compared to small hatchback cars is an attractive factor for the replacement of the current taxi fleet with small cars. Gao and Kitirattragarn [34] measured some factors for taxi owners in New York City who want to buy a new car as the taxi. The factors included vehicle cost, vehicle maintenance cost, fuel consumption, engine power, passenger space, and environmental effect. As shown in their results, the initial vehicle cost and maintenance cost are the most important for investors. Table 5 presents the annual costs of Peugeot 108 and Hyundai Sonata. We calculated the purchase price and fuel consumption on the Peugeot [72] and Hyundai websites [73]. The life expectancy of a taxi is assumed to be five years. According to their catalog, the fuel consumptions of Peugeot 108 and Hyundai Sonata are 5.3 L/100 km and 8 L/100 km, respectively. When working as a taxi, with a daily VKT 336 km, 300 days a year, and a fuel cost in China of 1.1 USD/L [74], we obtained annual fuel costs of 5877 USD and 8870 USD for these two cars, respectively.
Usually, the fuel consumption of vehicles based on the city cycle test is more than their fuel consumptions in the trading catalog (of course, the fuel consumption of taxis with more stop–move maneuvers will be more than the city cycle test). The reduced fuel cost (34%) presents a remarkable difference between a small car and a standard car. Besides this, the insurance of a small car and a standard car is different in China. Based on online vehicle insurance calculators, we found a reduction in insurance of 18% annually [75]. Due to various cases of maintenance, we assumed that the maintenance fee is about 5% of the purchase price. Thus, there is a 45% reduction in the maintenance cost. For tax, car owners will be taxed based on the engine volume of their vehicles. For example, the annual fee is 43 USD for volume 1.0–1.6 L and 96 USD for volume 2.0–2.5 L in Hangzhou [76]. A bigger car with higher horsepower pays more than small cars. Here, we have a reduction of 55% for the tax cost. In summary, there would be a 45% reduced price in purchase and maintenance, 55% for tax cost, and 34% for fuel consumption, which shows the importance of the proposed taxi downsizing policy. In summary, the total annual cost for a small taxi and standard taxi can be 9607 USD and 15,394 USD, respectively, and the average reduction percent is about 38%.
5. Discussions
As shown in the results above, the benefits of taxi downsizing are clear and impossible to ignore. To understand how many taxis should be replaced with small cars, we need comprehensive spatio–temporal data of the demand for the standard taxi. If taxi downsizing is conducted for the taxi system in Hangzhou, and 50% of taxis are changed from standard taxis to small taxis (since the trunk usage in Hangzhou is only 12%, assuming that replacing 50% of taxis is acceptable), there will be significant benefits regarding the environment, economy, and society.
Table 6 summarizes those benefits. The monetary saving in the purchase cost for replacing half of the taxi fleet from standard cars to small cars, in a city such as Hangzhou, is remarkable (about 15.75 million USD), so that the taxi service company can invest in providing better services. Also, we estimate the fuel cost difference would be 18,855,900 USD, which is a good point for drivers about the benefits of driving a small car instead of a standard car. Also, there are reduced costs in insurance, maintenance, and tax by 730, 787.5, and 1392.3 thousand USD, respectively. The estimation of 10 million liter fuel saving is another main benefit of taxi downsizing, which reduces annual emissions of CO, HC, and NOx by 1965, 98, and 58 ton, respectively.
Our findings show that most taxi seats and trunks are not occupied. Mitigating vacant taxi space creates some environmental, economic, and social benefits, which coincide with the sustainable transportation systems, as discussed by Loppolo et al. [77]. Nowadays, sustainable development is a major concern of governments’ policies for the future of the world [78]. Taxi downsizing can improve the efficiency of taxi services by reducing fuel consumption, emissions, raw materials, road space, road amortization, and taxi station space can be introduced as an environmentally friendly vehicle. The positive economic effect of taxi downsizing is clear, because a small taxi has cheaper expenses than a standard taxi (for a small car, the initial vehicle purchase cost, maintenance cost, depreciation cost, insurance cost, and tax cost are cheaper than a standard car). When a small car is used as a taxi, drivers can charge a cheaper fare based on the lower operating cost, so it is also beneficial for passengers. Small cars, due to the cheaper cost, can be a good option for carsharing services of transportation network companies (TNCs). Governments can provide subsidies for taxi drivers using small cars. The taxi downsizing also has inherent benefits, such as the reduced health cost due to the reduced pollutants. Other influences of small taxis in a city can be expressed in accidents. Pedestrians will have lighter injuries in the case of being hit by a small taxi in comparison with the standard car, although the passengers in small taxis are at a higher risk of severity in the accident. A solution to this could be preparing specific rules for small taxis, such as limited speed or determining expensive penalties. Taxi downsizing could also psychologically increase the popularity of using small cars due to the increasing usage in the taxi industry. The usage of small taxis will help promote the usage of Micro cars and Nano cars as taxis in the future, and even the usage of quadcopters for moving small taxi from one place to another place in the city. Even though we think in the first view taxi downsizing will find good popularity because of the lower fare. Also, taxi service companies can increase the number of small taxis in contrast with standard taxis in the city, based on the lower cost, which provides better accessibility for passengers and increases social satisfaction. Table 7 displays the benefits of small taxis on sustainable development indices.
Besides taxi downsizing, the government can encourage people to use small cars for developing sustainable transportation systems by providing car owners with subsidies for downsizing passenger cars. For example, in 2015, the local government offered a subsidy of 10,000 CNY for replacing old and high-polluting vehicles to electric cars in Xi’an, China [79]. Those policies improved urban transportation systems to achieve a good step toward sustainability.
6. Conclusions
Taxis, as one of the urban public transportation modes, has considerably more mileage than private cars. Taxi downsizing has positive impacts on the environment, society, and economy. These three components are the primary concerns of city managers and urban planners for providing a sustainable city, where taxi downswing helps promote the sustainable development of urban transportation systems. This paper is aimed at finding a better fleet management mode for taxi vehicles. The usage of taxi trunks and the number of passengers for each taxi trip were investigated. According to the observations in Hangzhou, China, we found that 88% of taxi drivers did not use their trunk because passengers did not have any baggage and 60% of the taxis only picked up one passenger. Also, with the analysis of GPS data of 7081 taxis in Hangzhou, this paper found that the average speed of taxis was 23 km/h. The taxi downsizing policy was considered by replacing standard car taxis with small cars, and the vehicle mass can be reduced by 400 kg. Consequently, the annual reductions for a taxi vehicle in terms of fuel consumption, CO, HC, and NOx were estimated to be 1600 L, 311.9 kg, 15.4 kg, and 8.9 kg, respectively. Attention to safety based on vehicle weight reduction is essential after implementing the taxi downsizing. Due to the low average speed of taxis, the risk of fatalities in accidents can be significantly reduced. After decreasing the 400 kg weight of a standard taxi, the taxi downsizing has some influences on economic efficiency, e.g., 1760 USD (1600 L × 1.1 USD/L) saved for the annual fuel cost. Comparing a standard car and a small car, such as Hyundai Sonata and Peugeot 108, we found that replacing standard cars with small cars saves about 38% of the total cost.
The proposed policy of taxi downsizing could be expanded in the future research: (a) the management of electric taxis; (b) driver behavior in the acceptance of small vehicles as taxis; and (c) effects of small taxis on road capacity. This study provides the feasibility of taxi downsizing for urban and traffic managers. The future work will consider the right fare fee of a small taxi to evaluate all expenses and define a specific policy.
Author Contributions
Conceptualization, M.Z. and X.C.; methodology, M.Z.; software, J.L.; validation, M.Z. and J.L.; formal analysis, M.Z.; investigation, M.Z.; resources, X.C.; data curation, M.Z. and J.L.; writing—original draft preparation, M.Z.; writing—review and editing, X.C.; visualization, J.L.; supervision, X.C.; project administration, X.C.; funding acquisition, X.C.
Funding
This research is financially supported by the National Key Research and Development Program of China (2018YFB1600900), Zhejiang Provincial Natural Science Foundation of China (LR17E080002), National Natural Science Foundation of China (71922019, 71771198, 71961137005), Young Elite Scientists Sponsorship Program by CAST (2018QNRC001), and Key Research and Development Program of Zhejiang (2018C01007).
Conflicts of Interest
The authors declare no conflict of interest. The founding sponsors had no role in the design of the study; in the collection, analyses, or interpretation of data; in the writing of the manuscript, and in the decision to publish the results.
References
- Li, Z.; Hong, Y.; Zhang, Z. Do ride-sharing services affect traffic congestion? An empirical study of uber entry. Soc. Sci. Res. Netw. 2016, 2002, 1–29. [Google Scholar]
- Chen, X.; Zahiri, M.; Zhang, S. Understanding ridesplitting behavior of on-demand ride services: An ensemble learning approach. Transp. Res. Part C Emerg. Technol. 2017, 76, 51–70. [Google Scholar] [CrossRef]
- An, S.; Hu, X.; Wang, J. Urban taxis and air pollution: A case study in Harbin, China. J. Transp. Geogr. 2011, 19, 960–967. [Google Scholar] [CrossRef]
- Oliver, H.H.; Gallagher, K.S.; Li, M.; Qin, K.; Zhang, J.; Liu, H.; He, K. In-Use Vehicle Emissions in China: Beijing Study; Energy Technology Innovation Policy Research Group, Belfer Center for Science and International Affairs, Harvard Kennedy School of Government, Harvard University: Cambridge, MA, USA, 2009. [Google Scholar]
- Oliver, H.H.; Zhang, J.; Li, M.; Qian, G.; Qin, K.; Liu, H.; He, K.; Davis, N.; Lents, J. In-Use Vehicle Emissions in China—Tianjin Study; Belfer Center for Science and International Affairs: Cambridge, MA, USA, 2008. [Google Scholar]
- The Free Library. The Automotive Aerodynamics Handbook, 10th ed.; The Film Instruction Company of America: Wauwatosa, WI, USA, 2018; Available online: https://www.thefreelibrary.com/The+Automotive+Aerodynamics+Handbook%2c+10th+Edition.-a0157592287 (accessed on 24 April 2019).
- Saito, M.; Gomi, T.; Taguchi, Y.; Yoshimoto, T.; Sugimoto, T. Innovative Body Structure for the Self-Tootection of a Small Cam in a Frontal Vehicle-to-Vehicle Crash; SAE: Warrendale, PA, USA, 2003. [Google Scholar]
- Liu, Y.; Wang, F.; Xiao, Y.; Gao, S. Urban land uses and traffic ‘source-sink areas’: Evidence from GPS-enabled taxi data in Shanghai. Landsc. Urban Plan. 2012, 106, 73–87. [Google Scholar] [CrossRef]
- Yuan, J.; Zheng, Y.; Zhang, L.; Xie, X.; Sun, G. Where to find my next passenger. In Proceedings of the 13th International Conference on Ubiquitous Computing, Beijing, China, 17–21 September 2011; ACM: New York, NY, USA, 2011; pp. 109–118. [Google Scholar]
- Government of Hong Kong. Transport—Hong Kong: The Facts; Government of Hong Kong: Hong Kong, China, 2013.
- Yang, H.; Lau, Y.W.; Wong, S.C.; Lo, H.K. A macroscopic taxi model for passenger demand, taxi utilization and level of services. Transportation 2000, 27, 317–340. [Google Scholar] [CrossRef]
- World Commission on Environment and Development. Our Common Future; Oxford University Press: London, UK, 1987. [Google Scholar]
- Litman, T. Well Measured: Developing Indicators for Sustainable and Livable Transport Planning; Victoria Transport Policy Institute: Victoria, BC, Canada, 2012. [Google Scholar]
- Miller, P.; de Barros, A.G.; Kattan, L.; Wirasinghe, S.C. Public transportation and sustainability: A review. KSCE J. Civ. Eng. 2016, 20, 1076–1083. [Google Scholar] [CrossRef]
- Sustainable Urban Transportation Systems: An Overview. Available online: https://www.uncclearn.org/sites/default/files/inventory/unescap20_0.pdf. (accessed on 24 April 2019).
- Jeon, M.C. Incorporating Sustainability into Transportation Planning and Decision Making: Definitions, Performance Measures, and Evaluation. Ph.D. Thesis, Georgia Institute of Technology, Atlanta, GA, USA, 2007. [Google Scholar]
- Dobranskyte-Niskota, A.; Perujo, A.; Pregl, M. Indicators to Assess Sustainability of Transportation Activities; European Commission Joint Research Centre Institute for Environment and Sustainability: Ispra, Italy, 2007. [Google Scholar]
- Laffel, N. Promoting Public Transportation for Sustainable Development; Commission on Sustainable Development, United Nations: New York, NY, USA, 2006. [Google Scholar]
- Fergusson, M. Greening Transportation. Environ. Sci. Policy Sustain. Dev. 1999, 41, 24–27. [Google Scholar] [CrossRef]
- Cloutier, S.; Karner, A.; Breetz, H.; Toufani, P.; Onat, N.; Patel, S.; Paralkar, S.; Berejnoi, E.; Morrison, B.; Papenfuss, J.; et al. Measures of a Sustainable Commute as a Predictor of Happiness. Sustainability 2017, 9, 1214. [Google Scholar] [CrossRef]
- Eberts, R. Understanding the Impact of Transportation on Economic Development; Transportation in the New Millennium; TRB: Washington, DC, USA, 2000. [Google Scholar]
- Martin, P.; Rogers, C.A. Industrial location and public infrastructure. J. Int. Econ. 1995, 39, 335–351. [Google Scholar] [CrossRef]
- Mosaberpanah, M.A.; Khales, S.D. The role of transportation in sustainable development. In Proceedings of the ICSDEC 2012: Developing the Frontier of Sustainable Design, Engineering, and Construction, Fort Worth, TX, USA, 7–9 November 2013; pp. 441–448. [Google Scholar]
- Gühnemann, A.; Schäfer, R.P.; Thiessenhusen, K.U.; Wagner, P. Monitoring Traffic and Emissions by Floating Car Data; Institute of Transport Studies: Sydney, Australia, 2004. [Google Scholar]
- Chang, H.W.; Tai, Y.C.; Hsu, J.Y. Context-aware taxi demand hotspots prediction. Int. J. Bus. Intell. Data Min. 2010, 5, 3. [Google Scholar] [CrossRef]
- Li, X.; Pan, G.; Wu, Z.; Qi, G.; Li, S.; Zhang, D.; Zhang, W.; Wang, Z. Prediction of urban human mobility using large-scale taxi traces and its applications. Front. Comput. Sci. 2012, 6, 111–121. [Google Scholar]
- Fathi, A.; Krumm, J. Detecting road intersections from GPS traces. In Proceedings of the International Conference on Geographic Information Science, Zurich, Switzerland, 14–17 September 2010; Springer: Berlin/Heidelberg, Germany, 2010; pp. 56–69. [Google Scholar]
- Zhang, W.; Xu, J.; Wang, H. Urban traffic situation calculation methods based on probe vehicle data. J. Transp. Syst. Eng. Inf. Technol. 2007, 7, 43–48. [Google Scholar] [CrossRef]
- Wang, H.; Zou, H.; Yue, Y.; Li, Q. Visualizing hot spot analysis result based on mashup. In Proceedings of the 2009 International Workshop on Location Based Social Networks, Seattle, WA, USA, 3 November 2009; ACM: New York, NY, USA, 2009; pp. 45–48. [Google Scholar]
- Luo, X.; Dong, L.; Dou, Y.; Zhang, N.; Ren, J.; Li, Y.; Sun, L.; Yao, S. Analysis on spatial-temporal features of taxis’ emissions from big data informed travel patterns: A case of Shanghai, China. J. Clean. Prod. 2017, 142, 926–935. [Google Scholar] [CrossRef]
- DeCicco, J.; Ross, M. Recent advances in automotive technology and the cost-effectiveness of fuel economy improvement. Transp. Res. Part D Transp. Environ. 1996, 1, 79–96. [Google Scholar] [CrossRef]
- Burgess, S.C.; Choi, J.M. A parametric study of the energy demands of car transportation: A case study of two competing commuter routes in the UK. Transp. Res. Part D Transp. Environ. 2003, 8, 21–36. [Google Scholar] [CrossRef]
- Cheah, L.; Heywood, J. Meeting US passenger vehicle fuel economy standards in 2016 and beyond. Energy Policy 2011, 39, 454–466. [Google Scholar] [CrossRef]
- Gao, H.O.; Kitirattragarn, V. Taxi owners’ buying preferences of hybrid-electric vehicles and their implications for emissions in New York City. Transp. Res. Part A Policy Pract. 2008, 42, 1064–1073. [Google Scholar] [CrossRef]
- Chavez-Baeza, C.; Sheinbaum-Pardo, C. Sustainable passenger road transport scenarios to reduce fuel consumption, air pollutants and GHG (greenhouse gas) emissions in the Mexico City Metropolitan Area. Energy 2014, 66, 624–634. [Google Scholar] [CrossRef]
- Wang, H.; Chen, C.; Huang, C.; Fu, L. On-road vehicle emission inventory and its uncertainty analysis for Shanghai, China. Sci. Total Environ. 2008, 398, 60–67. [Google Scholar] [CrossRef]
- Li, R.; Yang, F.; Liu, Z.; Shang, P.; Wang, H. Effect of taxis on emissions and fuel consumption in a city based on license plate recognition data: A case study in Nanning, China. J. Clean. Prod. 2019, 215, 913–925. [Google Scholar] [CrossRef]
- Kahane, C.J. Relationship between Vehicle Size and Fatality Risk in Model Year 1985-93 Passenger Cars and Light Trucks; National Highway Traffic Safety Administration: Washington, DC, USA, 1997.
- Wenzel, T.P.; Ross, M. The effects of vehicle model and driver behavior on risk. Accid. Anal. Prev. 2005, 37, 479–494. [Google Scholar] [CrossRef] [PubMed] [Green Version]
- Tolouei, R.; Titheridge, H. Vehicle mass as a determinant of fuel consumption and secondary safety performance. Transp. Res. Part D Transp. Environ. 2009, 14, 385–399. [Google Scholar] [CrossRef]
- Kahane, C.J. Vehicle Weight, Fatality Risk and Crash Compatibility of Model Year 1991–99 Passenger Cars and Light Trucks; National Highway Traffic Safety Administration: Washington, DC, USA, 2003.
- Noland, R.B. Fuel economy and traffic fatalities: Multivariate analysis of international data. Energy Policy 2005, 33, 2183–2190. [Google Scholar] [CrossRef]
- Ross, M.; Wenzel, T. An Analysis of Traffic Deaths by Vehicle Type and Model; Report Number T021; American Council for an Energy-Efficient Economy: Washington, DC, USA, 2002. [Google Scholar]
- Buzeman, D.G.; Viano, D.C.; Lövsund, P. Car occupant safety in frontal crashes: A parameter study of vehicle mass, impact speed, and inherent vehicle protection. Accid. Anal. Prev. 1998, 30, 713–722. [Google Scholar] [CrossRef]
- World Health Organization—Department of Violence. Injury Prevention. Global Status Report on Road Safety: Time for Action; World Health Organization: Geneva, Switzerland, 2009. [Google Scholar]
- Kloeden, C.N.; McLean, A.J.; Moore, V.M.; Ponte, G. Travelling Speed and the Risk of Crash Involvement Volume 2-Case and Reconstruction Details; NHMRC Road Accident Research Unit, The University of Adelaide: Adelaide, Australia, 1997. [Google Scholar]
- Balsa-Barreiro, J.; Valero-Mora, P.M.; Pareja-Montoro, I.; Sánchez-García, M. Quality control procedure for naturalistic driving data using geographic information systems. In Proceedings of the European Conference on Human Centred Design for Intelligent Transport Systems, Vienna, Austria, 5–6 June 2014; pp. 5–6. [Google Scholar]
- Balsa-Barreiro, J.; Valero-Mora, P.M.; Berné-Valero, J.L.; Varela-García, F.A. GIS Mapping of Driving Behavior Based on Naturalistic Driving Data. ISPRS Int. J. Geo Inf. 2019, 8, 226. [Google Scholar] [CrossRef]
- Hangzhou Statistics Bureau. Hangzhou Statistics Yearbook. Available online: http://www.hzstats.gov. cn/web/tjnj/nj2008/5/nj_.htm (accessed on 2 April 2017).
- China’s National Bureau of Statistics. China Statistics Yearbook. Available online: http://www.stats.gov.cn. (accessed on 2 April 2017).
- Liu, J.; Han, K.; Chen, X.M.; Ong, G.P. Spatial-temporal inference of urban traffic emissions based on taxi trajectories and multi-source urban data. Transp. Res. Part C Emerg. Technol. 2019, 106, 145–165. [Google Scholar] [CrossRef] [Green Version]
- Balsa-Barreiro, J.; Valero-Mora, P.M.; Montoro, I.P.; García, M.S. Geo-referencing naturalistic driving data using a novel method based on vehicle speed. IET Intell. Transp. Syst. 2013, 7, 190–197. [Google Scholar] [CrossRef]
- Hao, H.; Wang, H.; Ouyang, M. Fuel conservation and GHG (Greenhouse gas) emissions mitigation scenarios for China’s passenger vehicle fleet. Energy 2011, 36, 6520–6528. [Google Scholar] [CrossRef]
- Shanghai Bureau of Statistics of China. Shanghai Statistical Yearbook 2009; China Statistics Press: Beijing, China, 2009.
- Balafoutas, L.; Beck, A.; Kerschbamer, R.; Sutter, M. What drives taxi drivers? A field experiment on fraud in a market for credence goods. Rev. Econ. Stud. 2013, 80, 876–891. [Google Scholar] [CrossRef]
- Clean Vehicles in Public Transport. Available online: www.unhabitat.org (accessed on 18 May 2019).
- Baek, S.; Kim, H.; Chang, H. A feasibility test on adopting electric vehicles to serve as taxis in Daejeon metropolitan city of South Korea. Sustainability 2016, 8, 964. [Google Scholar] [CrossRef]
- De Jong, R.; Åhman, M.; Jacobs, R.; Dumitrescu, E. Hybrid Electric Vehicles: An Overview of Current Technology and its Application in Developing and Transitional Countries; UNEP Kenya: Nairobi, Kenya, 2009. [Google Scholar]
- He, K.; Huo, H.; Zhang, Q.; He, D.; An, F.; Wang, M.; Walsh, M.P. Oil consumption and CO2 emissions in China’s road transport: Current status, future trends, and policy implications. Energy Policy 2005, 33, 1499–1507. [Google Scholar] [CrossRef]
- Gwilliam, K.M.; Kojima, M.; Johnson, T. Reducing Air Pollution from Urban Transport; World Bank: Washington, DC, USA, 2004. [Google Scholar]
- Guo, H.; Zhang, Q.; Shi, Y.; Wang, D. On-road remote sensing measurements and fuel-based motor vehicle emission inventory in Hangzhou, China. Atmos. Environ. 2007, 41, 3095–3107. [Google Scholar] [CrossRef]
- Boquet, Y. Changing mobilities in Asian cities. In Proceedings of the 2010 Southeast Asian Geography Conference (SEAGA), Hanoi, Vietnam, 23–26 November 2010. [Google Scholar]
- The Insurance Institute for Highway Safety (IIHS). Available online: https://www.iihs.org/ (accessed on 3 July 2019).
- The National Highway Traffic Safety Administration (NHTSA). Available online: https://www.nhtsa.gov/ratings (accessed on 3 July 2019).
- The European New Car Assessment Program (Euro NCAP). Available online: https://www.euroncap.com/en/ratings-rewards/ (accessed on 3 July 2019).
- The Australasian New Car Assessment Program (ANCAP). Available online: https://www.ancap.com.au/safety-ratings/light-car (accessed on 3 July 2019).
- Nallet, N.; Bernard, M.; Chiron, M. Self-reported road traffic violations in France and how they have changed since 1983. Accid. Anal. Prev. 2010, 42, 1302–1309. [Google Scholar] [CrossRef] [PubMed]
- Rosen, E.; Stigson, H.; Sander, U. Literature review of pedestrian fatality risk as a function of car impact speed. Accid. Anal. Prev. 2011, 43, 25–33. [Google Scholar] [CrossRef] [PubMed]
- World Health Organization. World Report on Road Traffic Injury Prevention; World Health Organization: Geneva, Switzerland, 2004. [Google Scholar]
- Retting, R. Pedestrian Traffic Fatalities by State; Governors Highway Safety Association: Washington, DC, USA, 2017. [Google Scholar]
- Richardson, M.; Rose, G. Alternative personal transportation: Bridging the gap between cars and sustainable transport. (No. 02383). In Proceedings of the 12th World Congress on Transport Research, Lisbon, Portugal, 11–15 July 2010. [Google Scholar]
- Peugeot Website. Available online: https://www.peugeot.co.uk/showroom/108/ (accessed on 18 June 2019).
- Hyundai Website. Available online: http://allnewsonata.beijing-hyundai.com.cn/ (accessed on 18 June 2019).
- Gasoline Price in China. Available online: https://www.globalpetrolprices.com/China/gasoline_prices/ (accessed on 18 June 2019).
- Online Insurance Calculator, in China. Available online: https://www.pingan.com/official/insurance (accessed on 18 June 2019).
- Online Tax Calculator in China. Available online: http://www.chajiaotong.com/fagui1/86312.html (accessed on 18 June 2019).
- Ioppolo, G.; Cucurachi, S.; Salomone, R.; Saija, G.; Shi, L. Sustainable local development and environmental governance: A strategic planning experience. Sustainability 2016, 8, 180. [Google Scholar] [CrossRef]
- Louro, A.; Marques da Costa, N.; Marques da Costa, E. Sustainable urban mobility policies as a path to healthy cities—The case study of LMA, Portugal. Sustainability 2019, 11, 2929. [Google Scholar] [CrossRef]
- He, H.; Jin, L.; Cui, H.; Zhou, H. Assessment of Electric Car Promotion Policies in Chinese Cities; International Council on Clean Transportation: Washington, DC, USA, 2018. [Google Scholar]
Figure 1.
An illustration of a small/standard car as a taxi.

Figure 2.
Permanent population and vehicle ownership of Hangzhou (2005–2015).

Figure 3.
Taxi trip distributions according to the taxi GPS data in Hangzhou: (a) densities of pick-up locations; (b) densities of drop-off locations.
Figure 3.
Taxi trip distributions according to the taxi GPS data in Hangzhou: (a) densities of pick-up locations; (b) densities of drop-off locations.

Figure 4.
The average daily travel distance of taxis (22–30 June, 2015).

Figure 5.
Percentage of taxi drivers who drive below 60 km/h and 40 km/h during their daily cycling in Hangzhou city (25 June 2015).
Figure 5.
Percentage of taxi drivers who drive below 60 km/h and 40 km/h during their daily cycling in Hangzhou city (25 June 2015).


Table 1.
Sample taxi GPS data.
| Date | Time | Taxi ID | Longitude | Latitude | Speed (km/h) | Direction | Status |
|---|---|---|---|---|---|---|---|
| 29/06/2015 | 23:59:59 | 18338 | 118.254585 | 31.403702 | 63.3 | 140 | occupied |
| 29/06/2015 | 23:59:55 | 13044 | 120.143700 | 30.338099 | 2.2 | 0 | vacant |
| 29/06/2015 | 23:59:58 | 22320 | 120.161050 | 30.279967 | 0 | 135 | vacant |
Table 2.
Percentage of taxi trunk usage in terms of passengers.
| Observation Locations | Number of Passengers | Trunk Usage | |||
|---|---|---|---|---|---|
| One | Two | Three | Four | ||
| East High-Speed Rail Station | 60% | 33% | 6% | 1% | 6% |
| Railway Station (old station) | 50% | 34% | 14% | 2% | 28% |
| Intercity Bus Stations (two places) | 60% | 29% | 6% | 5% | 19% |
| Shopping Mall | 50% | 35% | 12% | 3% | 5% |
| Hotspot Area (three places) | 68% | 24% | 6% | 2% | 8% |
| Metro Station | 70% | 20% | 9% | 1% | 10% |
Table 3.
Estimation of fuel and emission reduction by small taxis.
| Fuel/Emission | Per Liter | Per 100 km | Per day (336 km) | Annually (300 days) | |||||
|---|---|---|---|---|---|---|---|---|---|
| St.* Taxi | Small Taxi | St.* Taxi | Small Taxi | St.* Taxi | Small Taxi | St.* Taxi | Small Taxi | Difference | |
| Gasoline (L) | NA ** | NA ** | 9 | 7.4 | 30.2 | 24.9 | 9060 | 7470 | 1590 |
| CO (g) | 193.07 ± 15.63 | 1738 | 1428 | 5838 | 4799 | 1,751,529 | 1,439,625 | 311,904 | |
| HC (g) | 9.51 ± 2.40 | 86 | 70 | 288 | 236 | 86,274 | 70,860 | 15,414 | |
| NOx (g) | 5.53 ± 0.48 | 50 | 41 | 167 | 137 | 50,160 | 41,247 | 8913 | |
* St.: Standard; ** NA: Not applicable.
Table 4.
Safety rating (due to the number of stars) of small cars by four car safety testing centers.
Table 4.
Safety rating (due to the number of stars) of small cars by four car safety testing centers.
| Small Car | ANCAP | NHTSA | IIHS | Euro NCAP |
|---|---|---|---|---|
| Mazda2 | 5 | 5 | 3 | 4 |
| Fiat 500 | 5 | 4 | - | 4 Fiat panda |
| Chevrolet Spark | - | 4 | 5 Chevrolet bolt | 4 |
| Toyota Yaris | 5 | 5 | 4 Toyota 86 | - |
| Peugeot 108 | 5 Peugeot 208 | - | - | 4 |
| Citroen c1 | 4 Citroen c3 | - | - | 4 |
| Skoda Citigo | 5 Skoda Fabio | - | - | 5 |
| Mini Cooper | 4 | 4 | 4 (2 door) | 4 |
| Kia Rio | 5 | 4 | 5 | - |
| Hyundai i20 | 4 | - | - | 4 |
| Ford Fiesta | 5 | 4 | 4 | 5 |
| Honda Jazz | 5 | 5 Honda fit | 5 Honda fit | 5 |
| Volkswagen Golf | 5 (also Volkswagen Polo) | 5 Volkswagen Golf | 5 Volkswagen Golf | 5 Volkswagen Polo |
Table 5.
Annual fixed cost and fuel cost of Peugeot 108 and Hyundai Sonata in Hangzhou, China.
| Car Type | Fixed Cost (Average Annual Cost/USD) | Fuel Cost * (USD) | Total Cost (USD) | |||
|---|---|---|---|---|---|---|
| Purchase | Insurance | Maintenance | Tax | |||
| Peugeot 108 | 3001 | 536 | 150 | 43 | 5877 | 9607 |
| Hyundai Sonata | 5501 | 652 | 275 | 96 | 8870 | 15,394 |
| Reduced Price Percentage | 45% | 18% | 45% | 55% | 34% | 38% |
* Fuel cost: Based on the vehicle usage as a taxi in Hangzhou.
Table 6.
Annual comparison of downsizing 50% of taxis in Hangzhou (6300 taxis).
| Scenarios | Features | Standard Taxi | Small Taxi | Difference |
|---|---|---|---|---|
| Comparison of Peugeot 108 and Hyundai Sonata usage as a taxi | Purchase cost (USD) | 34,656,000 | 18,906,300 | 15,750,000 |
| Insurance cost (USD) | 4,107,600 | 3,376,800 | 730,000 | |
| Maintenance cost (USD) | 1,732,500 | 945,000 | 787,500 | |
| Tax cost (USD) | 3,068,100 | 1,675,800 | 1392,300 | |
| Fuel cost (USD) | 55,881,000 | 37,025,100 | 18,855,900 | |
| Impact of Reduce 400 kg weight of a taxi | CO (ton) | 11,035 | 9070 | 1965 |
| HC (ton) | 544 | 446 | 98 | |
| NOx (ton) | 316 | 260 | 56 | |
| Fuel consumption (million liter) | 57 | 47 | 10 | |
| Safety | A small taxi should choose with high-grade safety | |||
Table 7.
Benefits of small taxi on sustainable development.
| Small Taxi Impacts on Sustainable Development Indices | ||
|---|---|---|
| Environmental | Economic | Social |
| Fuel consumption | Purchase cost | Healthy cost |
| Raw material | Maintenance cost | Pedestrian fatality risk |
| Noise pollution | Tax cost | Bike fatality risk |
| Global pollution (GHG) | Insurance cost | Fare cost |
| Local pollution (CO, HC, NOx) | Fuel cost | Car ownership cost |
| Road maintenance cost | More popular | |
| Taxi station space cost | Motivation and familiar to use small car | |
© 2019 by the authors. Licensee MDPI, Basel, Switzerland. This article is an open access article distributed under the terms and conditions of the Creative Commons Attribution (CC BY) license (http://creativecommons.org/licenses/by/4.0/).
Share and Cite
MDPI and ACS Style
Zahiri, M.; Liu, J.; Chen, X. Taxi Downsizing: A New Approach to Efficiency and Sustainability in the Taxi Industry. Sustainability 2019, 11, 4944. https://doi.org/10.3390/su11184944
AMA Style
Zahiri M, Liu J, Chen X. Taxi Downsizing: A New Approach to Efficiency and Sustainability in the Taxi Industry. Sustainability. 2019; 11(18):4944. https://doi.org/10.3390/su11184944
Chicago/Turabian StyleZahiri, Majid, Jielun Liu, and Xiqun (Michael) Chen. 2019. "Taxi Downsizing: A New Approach to Efficiency and Sustainability in the Taxi Industry" Sustainability 11, no. 18: 4944. https://doi.org/10.3390/su11184944
Note that from the first issue of 2016, this journal uses article numbers instead of page numbers. See further details here.