Assessment of the Financial Sustainability of China’s New Rural Pension Plan: Does the Demographic Policy Reform Matter?

Research Institute of Population Science, School of Public Administration, Hohai University, Nanjing 211100, China
*
Author to whom correspondence should be addressed.
Sustainability 2019, 11(18), 5110; https://doi.org/10.3390/su11185110
Submission received: 3 July 2019
/
Revised: 6 August 2019
/
Accepted: 13 September 2019
/
Published: 18 September 2019
(This article belongs to the Special Issue Sustainability and Social Policy)
Abstract
:Rural China is experiencing a rapid aging process caused by low fertility and large-scale rural-to-urban migration, which will place an increasing payment burden on the rural pension plan. To allay the negative impact of the aging transition, China has recently carried out a demographic policy reform, replacing the famous one-child policy with the two-child policy. This paper evaluates the impacts of the demographic policy reform on the financial sustainability of China’s New Rural Pension Plan (NRPP). By applying the cohort component population projection method and building actuarial models, the solvency sustainability of the NRPP between 2019 and 2080 is estimated under six demographic policy scenarios, followed by sensitivity analysis. The simulation results show that under the one-child policy, the current and the accumulated pension fund would run deficits in 2030 and 2042, and then the pension deficits would expand rapidly. The two-child policy would relieve the pension pressure moderately before 2075, but thereafter, the pension deficits would become much worse. Sensitivity analysis of a series of demographics and pension parameters on the financial sustainability of the NRPP are displayed. On average, the long-term pension gap may not be avoided for the NRPP, regardless of raising the contribution rate, delaying the retirement age, or encouraging people to have more children.
1. Introduction
Overt population aging, caused by declining fertility and extended life expectancy, has caused severe challenges in social welfare, especially in the pension system. As noted by the European Commission’s White Paper on Pensions (2012), an expected sustainable pension system should develop in a financially sustainable way while providing an adequate pension benefit to retirees with a fair benefit level in relation to pension contributions [1]. Under the guidance of this connotation of pension sustainability, many authorities have embarked on serious measures in their pension system, such as strengthening actuarial fairness, switching from DB to DC system, setting up funding systems, and creating a framework for longer working lives [2,3]. Although the conflict of pension system objectives, for example, benefit adequacy, equity between/within generations, and financial sustainability, is abating, financial sustainability of the pension system remains a core concern for policymakers [4].
China, with the largest population in the world, is experiencing an accelerating aging process, which exerts enormous upward pressure on the pension system. In 2015, China’s urban pension fund went into the red in 25 of 31 provinces [5]. Recent research shows that the current urban pension deficit is expected to reach CNY 42.02 trillion in 2050 and CNY 74.23 trillion in 2070 [6], indicating an inevitable trend towards imbalance of the pension fund [7,8,9]. However, China’s rural pension plan gets much less attention than the urban pension scheme, particularly within international academia.
Traditionally, supporting the elderly has been the obligation of the family in China. Nevertheless, this has been changed due to the rapid decline of fertility and large-scale rural–urban migration of the working-age population through urbanization. The former promotes the shrinking of the family, while the latter leads to the emergence of a large number of left-behind rural older adults, both resulting in the weakness of families’ ability to support the elderly. Besides, the urban–rural inverse relationship between socioeconomic development and the demographic transition is a prominent feature of China that cannot be ignored. In 2015, the population aged 60 and over reached 120 million, accounting for 18.47% of the total rural population, 4.11 percentage points higher than in urban areas [10]. However, the per capita disposable income of rural residents is only 36.6% (CNY 11,421.7) of that of urban residents [11]. To provide economic security for the rural elderly, the Chinese government innovatively introduced the New Rural Pension Plan (NRPP) in 2009. It is worth noting that as the aging process and rural–urban migration continue, the payment pressure of the NRPP is expected to expand year by year with a faster pace than the urban pension system, which is threatening the sustainability of the pension system [12,13].
To fight the problem of aging and improve the long-run fiscal sustainability of the pension fund, the Chinese government introduced the demographic policy reform, i.e., replacing the well-known one-child policy with the two-child policy, marking the end of nearly three decades of population control [14]. Boosting the fertility level is expected to increase the future labor force and therefore mitigate the adverse socioeconomic impacts and contribute to pension revenue. However, the effect of the new demographic policy on improving the financial sustainability of the pension plan hinges on mid- and long-term population dynamics, social-economic developments, and pension policy reforms. The complexity and uncertainty surrounding these issues require an accurate quantitative model to assess the financial capacity of the pension plan for the purpose of avoiding future pension policy failures, which is particularly urgent for the NRPP. In this paper, we focus on the assessment of the financial sustainability of the NRPP and the implementation effect of the demographic policy reform by employing actuarial models. We also run a sensitivity analysis to show the impacts of possible demographic changes and policy reform options on pension sustainability. The actuarial projection results could inspire China’s rural pension policymakers, as well as providing examples for reforming rural pension plans in other nations, particularly those developing countries under similar circumstances.
2. Literature Review
The financial sustainability of the pension plan is a core theme of social welfare, especially in the era of population aging. Due to its close relations with macroeconomic development indicators, such as the gross domestic product, government revenue, local labor supply, and employment, as well as individual decisions on bearing children, consumption, saving, and retirement at the micro level [4,15,16,17,18], policy reforms have been taken to enhance the sustainable capacity of the pension plan.
Encouraging people to have more children is one common policy adopted by many countries to meet the challenges of the aging transition [16]. Existing studies have examined the impact of fertility dynamics and family policy reforms on PAYG pension sustainability. Some studies found that raising fertility would relieve pension pressure. For instance, using data from countries in Europe, North America, and Asia, Bongaarts [19] pointed out that on average, each increase in fertility by 0.5 per woman would lead to a pension payment ratio decline by 20% by mid-century. Blake and Maythew [20], through both static and dynamic estimate models, showed that if fertility picked up in the coming years, the pension payment pressure would be relieved, though with a time-lagged effect. Some other studies pointed out that the pension system would react to fertility changes, which would not necessarily lead to a financial imbalance of pension fund [21]. As illustrated by Fanti and Gori [22], with fertility decline, the shrinking young working-age population would result in a reduction in the cost of raising their children, which in turn would increase the pension contribution. Besides, family policies may have distinct impacts on the pension system. By applying an overlapping generation model, Stauvermann and Kumar [23] demonstrated that a child allowance would lead to an increase in the population of children as well as a drop in pension benefits, while an educational subsidy would play an inverse role. However, existing studies on the relationship between fertility and pension sustainability are mainly in the context of a PAYG pension system, and the conclusions have not reached an agreement.
As a policy response to the aging transition, pension reforms have also been implemented to improve financial liquidity over the past few years by implementing parametric or structural pension reforms [24]. A growing body of literature has studied the impacts of these reforms on pension sustainability. For instance, by building a rich overlapping generation model, Lisenkova and Bornukova investigated Belarus’ 2017 retirement reform [25]. They concluded that decreasing the pension replacement rate from 43% in 2013 to 28% in 2050 would help to keep the pension deficit below 3% of GDP in 2050, and the pension deficit would almost disappear in 2100. As noted by Grech [26], raising the pension eligibility age is a more popular and accepted policy choice compared with directly cutting benefits to constrain pension expenditure. Simulating the UK’s state pension deferral mechanism with a systematic dynamics model, Moizer et al. [27] found that progressively delaying retirement to 68 in 2046 would improve pension accumulation, with a reduction in the enhancement rate from 10.4% to 5.8%. However, some studies came to the opposite conclusion, that parametric pension reforms are not sufficient to guarantee liquidity, no matter whether they delay retirement, raise contribution levels, or cut pension benefits [4]. In addition, some countries have taken measures to switch their defined benefit (DB) pension system to a defined contribution (DC) one. According to the numerical studies of DC pension systems’ performance in risk-spreading among generations, Auerbach and Lee [28] and Alonso-García and Devolder [29] showed that, as with the parametric reform, scheme transition would not ensure the financial security of the pension system. Vidal-Meliá et al. [30] developed a social insurance accounting model for an NDC scheme to indicate the status of system sustainability and financial solvency. They provided a Swedish-type financial reporting statement and argued that an NDC system combining retirement and long-term care would be financially sound at least theoretically. Besides, authorities may also implement reforms that would strengthen actuarial fairness of the pension system, such as assessing pension benefits based on lifelong earnings rather than on a limited number of highest contribution years or expanding interpersonal redistributions of income within pension schemes. However, policy effects vary from nation to nation according to policy details and the characteristics of the pension system [2,31].
As population aging accelerates, the sustainability of China’s pension system draws more and more attention within international academia. Previous studies showed that China’s urban pension scheme is facing a severe challenge, where financial imbalance is inevitable in the long run [7,8]. For example, by developing an overlapping generation model, Coeurdacier et al. [32] suggested that relaxing or abandoning fertility restrictions would not offer much help to finance the urban pension system, particularly when children are considered the main source of old-age provision. In addition, Zeng et al. [9,33] argued that relaxing population control would relieve the pension burden, but fertility intention plays an essential role which should be improved. Applying a comprehensive risk assessment model, Zhao et al. [7] concluded that the urban pension fund would have a gap around 2045, while the accumulated pension deficits would expand to CNY 2270.59 trillion in 2088. Tian and Zhao [8] argued that if the pension age were delayed by five years, i.e., to 60 for women and 65 for men, the pension fund imbalance would be retarded by about two decades, and the accumulated pension deficits would be reduced by 64.25% in 2087.
Only a few studies have investigated China’s rural pension system. Williamson et al. [34] showed that along with low contribution level and lack of adequacy, China’s rural pension system would have sustainability issues in decades due to population aging and rural–urban migration. Applying actuarial models, Wang and Béland [35] demonstrated that to ensure the sustainability of rural pension system, the state budget is supposed to transfer CNY 3.28 trillion in 2049. Meanwhile, they pointed out that creating dynamic adjustment mechanisms, improving investment practices, and designing a national pension redistribution mechanism are possible policy options.
Recently, China has implemented one demographic policy reform, relaxing population control to allow couples to have a second child without any conditions, i.e., the two-child policy. This new policy is expected to raise the total fertility rate and increase the future labor force, as well as to stimulate economic growth and increase pension revenue. However, the impacts of China’s demographic policy reform on pension sustainability have not been given in-depth investigation within international academia, particularly the rural pension system. This study aims to fill this gap. Besides, given the characteristics of the rural pension plan in China (see Section 3), we also consider some possible pension reform options along with their interaction effects with demographic policy reform. The rest of the paper is arranged as follows: We briefly introduce China’s rural pension system and describe its attributes in Section 3. In Section 4, we build and describe the projection models of population and actuarial models of pension income and expenditure. Fertility scenario and data assumptions are outlined in Section 5. Section 6 presents simulation outcomes and results analysis. Section 7 displays the conclusions.
3. Rural Pension System in China
Traditionally, family have been responsible for old-age provision in China, which holds true in both urban and rural areas. In 1951, the Chinese government introduced a defined benefit (DB) public pension scheme for the employees in urban state-owned enterprises. In 1956, the “Five Guarantees” scheme, which was financed by the rural collective community, was adopted to provide very low-level social support only to childless rural residents in terms of food, clothing, housing, medical care, and burial expenses. Old-age provision has remained the responsibility of family for rural residents. In 1992, a rural pension scheme with one individual funding account, also known as the “old rural pension scheme”, was piloted at the county level. However, due to various reasons such as low coverage, inadequate benefits, pension fund diversion, and corruption, the old rural pension scheme was abolished in 1999 [36,37].
After entering the new century, by following a series of county-level pilot projects, the Chinese government introduced the NRPP in 2009, which was quickly accepted by rural residents. The coverage rate of the NRPP increased from 10% in 2009 to 75.4% in 2015 [38]. Similar to China’s partly accumulated urban pension system, the NRPP has two components: one noncontributory social pooling account financed by the government and one voluntary individual funding account with defined contributions [39]. According to pension regulations, insured working-age rural residents receive pension benefits from both pension accounts only after they have contributed to the NRPP for at least 15 years and reached 60, while the elderly already aged 60 and older in 2009 receive merely social pooling account benefits. The government set the pension benefit standards for the social pooling account. In 2009, the social pooling account benefit was set at CNY 55 per month; and in 2018, it was raised to CNY 88 per month. The pension benefit level for individual accounts depends on multiple factors, such as contribution level, contribution years, return rate, and so on. Rural pension enrolment is voluntary by stipulations. Therefore, working-age rural residents have some decisions to make. First, they need to decide whether to participate in the NRPP. Second, if they decide to participate in the NRPP, they are allowed to choose their contribution level from 12 fixed grades: CNY 100, 200, 300, 400, 500, 600, 700, 800, 900, 1000, 1500, and 2000 per year [40]. The government is also required to contribute to the enrolled participant’s individual account as supplements, according to his/her contribution level. Generally, more government contributions go with higher individual contribution levels. Specifically, if a rural participant chooses a low contribution level, such as CNY 100 per year, the government contributes CNY 30 per year to his/her individual account. If the participant opts for a higher contribution level of at least CNY 500 per year, the government is required to contribute CNY 60 per year to his/her individual account. The collective rural community is encouraged to contribute to enrolled participants’ individual accounts as well.
As with the pension systems in urban China and other aging countries, the financial sustainability of China’s NRPP is challenged by rapid demographic transition. Although pension income has climbed from CNY 45.3 billion in 2010 to CNY 330.4 billion in 2017, 2.26 times and 1.39 times greater than pension expenditure, pension payment is expanding at a much faster pace (average annual growth rate of 42.37%) than pension income (average annual growth rate of 32.82%). These figures imply that threats to the financially sustainable development of the NRPP are already on the way.
4. Projection Models
4.1. Projection Models for Insured Population
In this paper, we project population dynamics based on the cohort component method, which is widely adopted in the field of demography [41,42]. Age- and sex-specific iterative equations in matrix form play an important part in cohort component method, also known as the Leslie matrix. Before constructing the projection models of the insured population, we first build projection models for the structures of the future population.
The annual age- and sex-specific population can be presented by the following equations:
where , , , and index age, year, female, and male; denotes the age-specific TFR in year ; represents the age-specific mortality rate in year t; indexes the proportion of baby girls born in year t; represents the age-specific population in year t. In matrix form, Equations (1)–(4) can be written as
where
, , and indexes age limit.
The insured rural population is determined by multiple factors, including not only total population but also urbanization rate, pension coverage, etc. Therefore, we can express the population of insured rural residents as
where is the population of insured rural residents in year t; is the population of the insured rural labor force in year t; and is the population of pension beneficiaries in year t.
To be more specific,
where indexes the starting age to be insured; denotes the elegible pension age; represents the urbanization rate in year t; and is the pension coverage rate in year t.
4.2. Actuarial Models for Pension Sustainability
Following previous studies, in the present paper, we use current pension surpluses/deficits and accumulated pension surpluses/deficits to reflect the sustainable development ability of the NRPP [6,7]. The former indicator implies the immediate liquidity risk of the pension system, while the latter shows the long-term solvency. Both indicators involve two variables: pension income and pension expenditure. Next, we build actuarial models to indicate the financial sustainability of the NRPP by calculating pension income and expenditure.
The pension income includes government subsidies, collective subsidies, and individual contributions and can be presented as
where denotes the pension income in year t; denotes the per capita income of rural residents in year t; and , , and denote the government’s, collective’s, and individual’s pension contribution rates, correspondingly.
According to the stipulation of the NRPP, the pension payments are the sum of pension fund expenditures from both the basic social pooling account and the individual account [39]. The pension fund expenditure of the basic social pooling account in year t can be expressed as
where denotes the per capita basic social pension benefit in year t.
The annual individual account pension payments consist of two parts: the annual normal pension expenditure and the annual death-return pension expenditure. The former refers to the total pension expenditure paid by the individual pension account to living retirees in one year, while the latter refers to the total accumulated pension contribution left in individual accounts which belong to pensioners who died before their individual account pension funds were exhausted, and which are allowed to be inherited. To calculate the annual normal pension payments, we need to know the annuity received by a pensioner in the first year after retirement. When a pensioner is eligible for pension benefits in retirement year , the total pension contribution accumulated in the individual account can be calculated by
The annuity received by the retiree in his/her retirement year () is
And thus, the total normal pension expenditure in individual account () can be presented as
where denotes the total pension contribution in the individual account for one pensioner in his/her retirement year , denotes the per capita income of an x-year-old insured contributor in year , denotes the return rate of the pension fund in year t, and R denotes the number of months granting individual account pensions to insured retirees by pension stipulations.
The death-return expenditure of the individual account also consists of two parts: the return expenditure from the dead insured retirees and the dead pension contributors. Assume that an x-year old insured retiree dies in year t , the remaining number of months granting individual account pension are , and the death return pension expenditure in his/her account in year t is . Thus, the death return pension expenditure for the insured retirees who die in year t can be presented by
For those pensioners who have died before retirement, the death return pension expenditure equals the total accumulated pension contributions. Assume that an x-year-old pension contributor dies in year t and the accumulated pension contribution in his/her individual account can be presented as . The death return pension expenditure for the insured contributors who die in year t can be calculated by
The pension expenditure in year t can be expressed as
Based on previous Equations (9)–(16), we can express the current pension surpluses/deficits in year t by
and the accumulated pension surpluses/deficits in year t by
5. Scenarios and Data Assumptions
5.1. Total Fertility Rate Scenarios
Due to the strict one-child policy, China’s total fertility rate (TFR) has remained at a low level in the past two decades. Census data show that the TFR decreased from 1.22 in 2000 to 1.05 in 2015, indicating a continuously decreasing trend far below the replacement rate. Although the TFR directly calculated from census data may underestimate the real TFR, China’s low TFR is an undeniable fact and is estimated to be approximately 1.5 [43,44], which is much lower than the replacement level (2.1). The low TFR has accelerated China’s population aging process, resulting in a rapid increase in the aged population. In 2015, the population aged more than 60 reached 224 million, making up 16.3% of the total population, while in rural areas, this proportion reached 18.63%, indicating that the NRPP will face an increasing payment challenge.
To meet the challenges posed by this demographic transition, the Chinese government started to relax population control in 2013 by introducing the “selective two-child” policy to replace the “one-child” policy. The new demographic policy allows couples to parent a second child if either the husband or the wife is an only child. As of August 2015, only about 15% of the eligible couples (an estimated 11 million couples) had applied for a second child. In 2016, the Chinese government further liberalized the population control by implementing the “universal two-child” policy, allowing couples to raise an additional child without any conditions. According to Chen and Duan’s estimates, the “two-child” policy has inverted the decreasing trend of China’s TFR by promoting the parity-specific TFR at the second birth [45]. Their results show that the estimated TFR increased from 1.410 in 2015 to 1.719 in 2017, mainly attributed to the increase of the parity-specific TFR at the second child from 0.642 to 1.013. This result indicates that the positive impact of demographic policy reform is gradually emerging.
In light of the muted effect of the demographic policy reform before 2015, the TFR is presumed to remain at 1.410 with parity-specific TFR at first birth of 0.616 in 2015 as the baseline scenario, which indicates the TFR in the situation of continuously implementing the one-child policy [45]. In addition, given that women’s desire to have a second child would be raised in the context of the two-child policy, we simulate the dynamic of TFR with 15%, 30%, 50%, 70%, 90%, and 100% of couples bearing a second child as fertility scenarios 1–6.
5.2. Data Source and Assumption
(1) Initial population data. In this paper, we use the data from the 2015 1% sample census as the initial population, provided by China’s National Bureau of Statistics and indicating the characteristics of the population distribution and structure under the one-child policy [10].
(2) Sex ratio at birth. Due to gender preference, the sex ratio at birth in China is notably high: 117.96 in 2010, 114.52 in 2013, and 112.55 in 2015, which are far beyond the accepted normal range 102–107 [46]. To promote the gender balance of the population, the Chinese government put forward the National Population Development Plan (2016–2030), where the future targets for sex ratio at birth are set to be 112 in 2020 and 107 in 2030 [47]. In this paper, we assume the sex ratio at birth will fall linearly from 112.55 in 2015 to 107 in 2030 and stay constant thereafter.
(3) Survival rate. In this paper, the age- and sex-specific survival rates are obtained from the life table, which is calculated from the 2015 1% mini census data [10]. Since the impacts of changes in TFR on the financial sustainability of the NRPP are the main concern in this paper, and considering that the variation in mortality rate would disturb the relationship between pension income and payment, we assume that the survival rate remains constant in the prediction period, which makes the results more institutive and convenient for analysis and comparison.
(4) Net migration rate. According to data from China’s National Bureau of Statistics [48] and China Migrant Dynamic Surveys [49], in 2015, the population of net migration was estimated to be 1.27 million, accounting for only 0.09% of the total population (1.38 billion), and they live mostly in urban areas. Compared with the huge population, the international migrant population can be ignored [6]. In addition, China does not rely on international immigrants to meet its aging challenges. In this paper, we assume that the Chinese population is stationary and closed to international migration.
(5) Urbanization rate. Data from the China Statistical Yearbook reveal that the urbanization rate reached 56.10% in 2015. By reference to the urbanization rate of developed countries such as Australia (89.42%), Canada (81.32%), and the United Kingdom (82.59%), China will continue to undergo a rapid process of urbanization. In addition, the Chinese government set a goal for the urbanization rate to be 70% in 2030 according to the National Population Development Plan (2016–2030) [47]. Based on all this, we assume the urbanization rate will linearly increase to 70% in 2030 and 80% in 2050 and then remain unchanged during the projection period.
(6) Contribution rate. Referring to the stipulations of the NRPP, the working-age rural residents are allowed to choose one of 12 different contribution levels between CNY 100 per year and CNY 2000 per year, and the government offers the pension subsidies to the individual pension account according to the account holder’s choice [40], following the rule that larger government subsidies go with higher contribution levels. However, data from the authorities show that most enrolled rural pensioners prefer a low contribution level with an average pension contribution of CNY 196.23 in 2015, accounting for only 1.72% of the rural per capita net income [48]. In accordance with this low contribution level and referring to the provisions of the NRPP, the governmental subsidy to a rural pension contributor’s individual account is CNY 30 per year on average, 0.26% of rural per capita net income. Recent surveys on rural pension schemes also show that the rural collectives barely contribute to the NRPP due to the decline of the collective economy since China’s Opening-Up Reform in 1978 [35]. Based on all this, we assume the pension contribution rate for individuals, rural collectives, and the government will be 1.70%, 0%, and 0.25% in the long term.
(7) Coverage rate. The coverage of the NRPP expanded from 10.6% in 2009 to 75.4% in 2015 [38]. In the 13th Five-Year Plan for the Development of Human Resources and Social Security, the coverage of the NRPP was set to reach 90% in 2020 [50]. Therefore, we suppose that the contribution rate will increase linearly to 90% in 2020 and stay constant during the forecast period.
(8) Growth rate of basic social pension benefit. The Chinese government set the standard basic social pension benefit to be CNY 55 per month in 2009, which was raised to CNY 88 per month in 2018, with an annual growth rate of 5.36% on average [39,51]. Based on this, we assume the average annual growth rate of the basic pension benefit will be 5% in the long run.
(9) Initial pension enrolment age. As prescribed by the stipulations of the NRPP, rural residents aged 16 and older, excluding students in school, are eligible to participate in the pension scheme [39,40]. The 2010 census data show that only 5.14% of the rural residents aged 16 and older who had completed the 9-year compulsory public education were in school for further education. Therefore, we assume the minimum legal age for pension enrolment to be 16 and that the proportion of rural residents at school will remain unchanged in the forecast interval.
(10) Retirement age. Referring to the provisions of the NRPP, both male and female rural residents retire at 60 [39]. In this research, we set the retirement age to remain at 60 in the long term.
(11) Return rate. Based on existing studies and interest data released by China’s central bank [7,52], we assume the annual interest to be 3% in the forecast interval.
(12) Growth of rural residents’ per capita net income. Data provided by China’s National Bureau of Statistics show that the growth rate of per capita net income for rural residents was 8.89% in 2015. Considering that China is facing a slowdown in economic development and referring to previous studies [35,53], we assume the annual growth rate of rural residents’ per capita net income will remain at 8.5% before 2020 and decrease by 1% every 10 years.
6. Results Analysis
In this section, the long-term financial sustainability of the NRPP is assessed by projecting the changes of actuarial indicators from 2019 to 2080, including current pension surpluses/deficits and accumulated pension surpluses/deficits. Since the fertility assumptions in Section 5.1 include six different levels of possibility for couples to bear a second child, the method of scenario analysis is employed to evaluate and compare the impacts of demographic policy changes on the NRPP. We evaluate the financial sustainability of the rural pension scheme under two situations: (a) retaining the one-child policy (baseline scenario) or (b) implementing the two-child policy (fertility scenarios 1–6). In addition, we also run a series of sensitivity tests to examine the impact of changes in a few demographic and pension parameters on pension sustainability.
6.1. Situation 1 (Baseline Scenario): Retaining the One-Child Policy
Figure 1 and Table 1 shows the projection results for the pension fund. As can be seen, both the pension incomes and the expenditures would expand yearly in the forecast period. The pension income would rise from CNY 0.43 trillion in 2019 to CNY 2.33 trillion in 2080, while the expenditure would go up from CNY 0.33 trillion to CNY 6.61 trillion. However, the average annual growth rate of pension expenditure (5.03%) is much higher than that of pension income (2.79%) during the simulation period. This results in the occurrence of current and accumulated pension deficits in 2030 and 2042, correspondingly. Thereafter, the pension deficit would grow rapidly. In 2080, the accumulated pension deficit would reach CNY 78.80 trillion, 18.38 times the current pension deficit (CNY 4.29 trillion). The continuously enlarging pension deficit implies the accumulated financial sustainability risk of the NRPP under the one-child policy in the long term, reflecting the urgent need for positive policy measures to relieve the payment pressure of the pension system.
6.2. Situation 2: Conducting the Two-Child Policy
In this section, we investigate the impact of demographic policy reform on the financial sustainability of the NRPP under fertility scenarios 1–6, indicating possible demographic outcomes of the two-child policy. The simulation results can be found in Figure 2 and Table 2, Table 3 and Table 4. Since those second children born in 2016 will not be eligible to enroll in the pension plan until 2032, when they are 16 years old, the two-child policy will exert a time-lagged impact on the NRPP. This indicates that the trend of financial sustainability of the pension system will not be altered by the variation of the two-child policy before 2032.
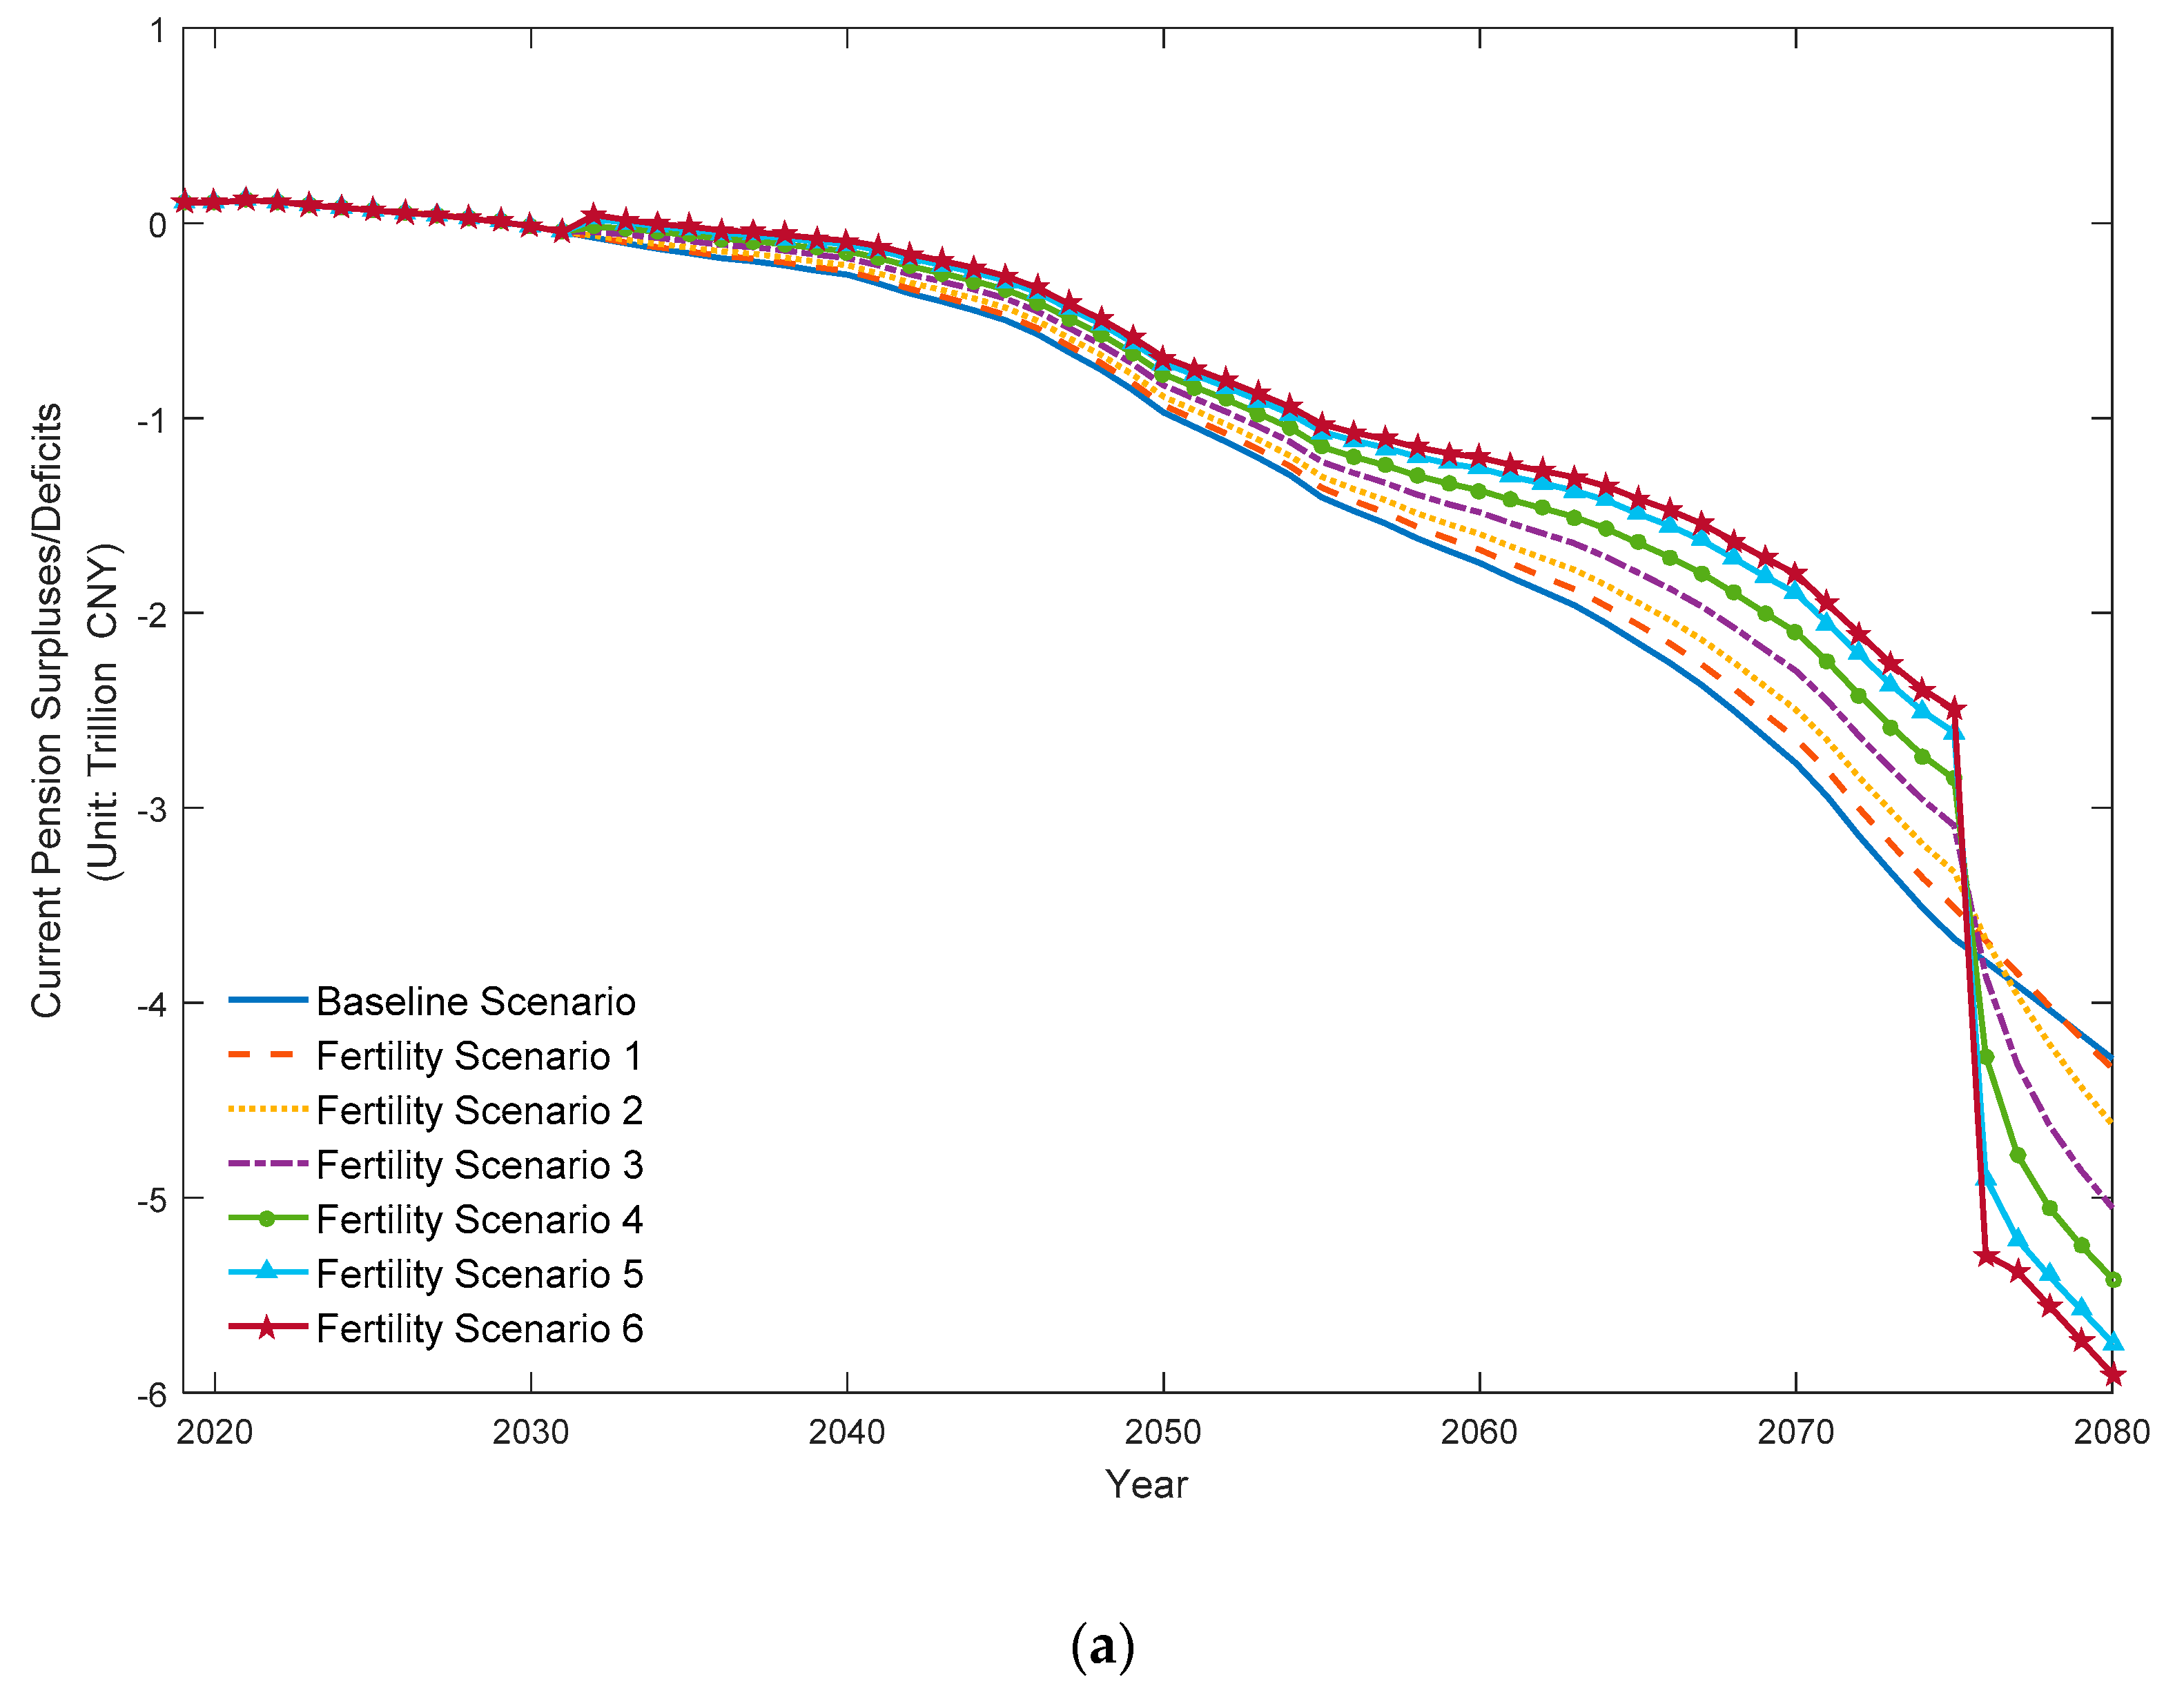
Figure 2 depicts the future development trajectory of the NRPP’s pension deficits under the new demographic policy. The results show that the pension deficits would expand yearly in the projection period. However, overall, the higher the proportion of couples having a second child, the smaller the pension deficit. The development trends of pension deficits are portrayed and encompassed by the curves of pension deficits under fertility scenarios 1 and 6, which also outline the boundaries of pension deficits’ development under all assumed fertility possibilities. Table 2 and Table 3 provide the percentage change of the pension deficit compared with the baseline scenario under various fertility assumptions. When 15% of couples deliver an additional child, the current pension deficit would reach CNY 3.51 trillion in 2075, reduced by 4.41% compared to continuously implementing the one-child policy, while the accumulated pension deficit would increase to CNY 55.99 trillion, 4.49% less than the baseline scenario. When 100% of couples opt to parent an additional child, the current and the accumulated pension deficits would reach CNY 2.49 trillion and CNY 37.72 trillion in 2075, representing a reduction of 32.07% and 35.66% from the baseline scenario, respectively.
However, the simulation results provide another picture after the first of the second-child population retire in 2076. The pension payments would make a great leap, resulting in a huge expansion and a much faster increase in pension deficits, especially under the fertility scenarios with higher proportions of couples parenting a second child. For example, if 100% of couples parented another child, the current pension deficits would climb from CNY 5.29 trillion in 2076 to CNY 5.90 trillion in 2080, an increase of 37.78–39.69% over the baseline scenario. Meanwhile, the accumulated pension deficits would expand from CNY 43.00 trillion in 2076 to CNY 65.58 trillion in 2080, 16.78–31.09% higher than under the one-child policy.
Moreover, it is noteworthy that regardless of which fertility scenario is applied, the occurrence of current pension deficits would not be delayed due to the time-lagged effect of the new fertility policy. However, the occurrence of accumulated pension deficits would be suspended. If 15% of couples had an additional child, the occurrence of the accumulated pension deficits would have a 1-year delay, and it would be a 6-year delay if 100% couples bore another child. These results (see Table 4) indicate that a lower proportion of couples delivering a second child would offer little help in either delaying the occurrence of the pension fund imbalance or relieving the pension pressure.
6.3. Sensitivity Analysis
In addition to couples’ desire for a second child, the financial sustainability of the NRPP also depends on some other variables, including parity-specific TFR at first birth, contribution rate, benefit level, and statutory retirement age, which would alter the relationship between pension income and payment and thus affect the financial sustainability of the pension system. In this section, we investigate the variations in conclusions when the NRPP is subjected to changes in these variables under fertility scenarios 1 and 6, which outline the boundaries of pension deficit outcomes of all assumed fertility scenarios.
6.3.1. Parity-Specific Total Fertility Rate at First Birth
The size of the population of second children is closely related to couples’ desire for a second child as well as the parity-specific TFR at first birth. Figure A1 presents the simulation results of raising parity-specific TFR at first birth to 0.65, 0.8, and 1.0 under fertility scenarios 1 and 6. As can be seen, raising parity-specific TFR at first birth would not delay the occurrence of pension deficit, nor would it change the trend of the widening pension gap. As the parity-specific TFR at fist birth rises and the proportion of couples that desire a second child goes up, the accumulated pension deficit is more relieved compared with merely encouraging a second child, while the current pension deficit would shrink a little. For example, in the situation of parity-specific TFR at first birth of 1.0 under fertility scenario 6, the accumulated pension deficit would be reduced by 45.33% below the baseline scenario in 2080, 28.55 percentage points higher than implementing fertility scenario 6 alone, while the current pension deficit would increase by 35.15% more than the baseline scenario, only 2.63% less than merely conducting fertility scenario 6.
6.3.2. Contribution Rate
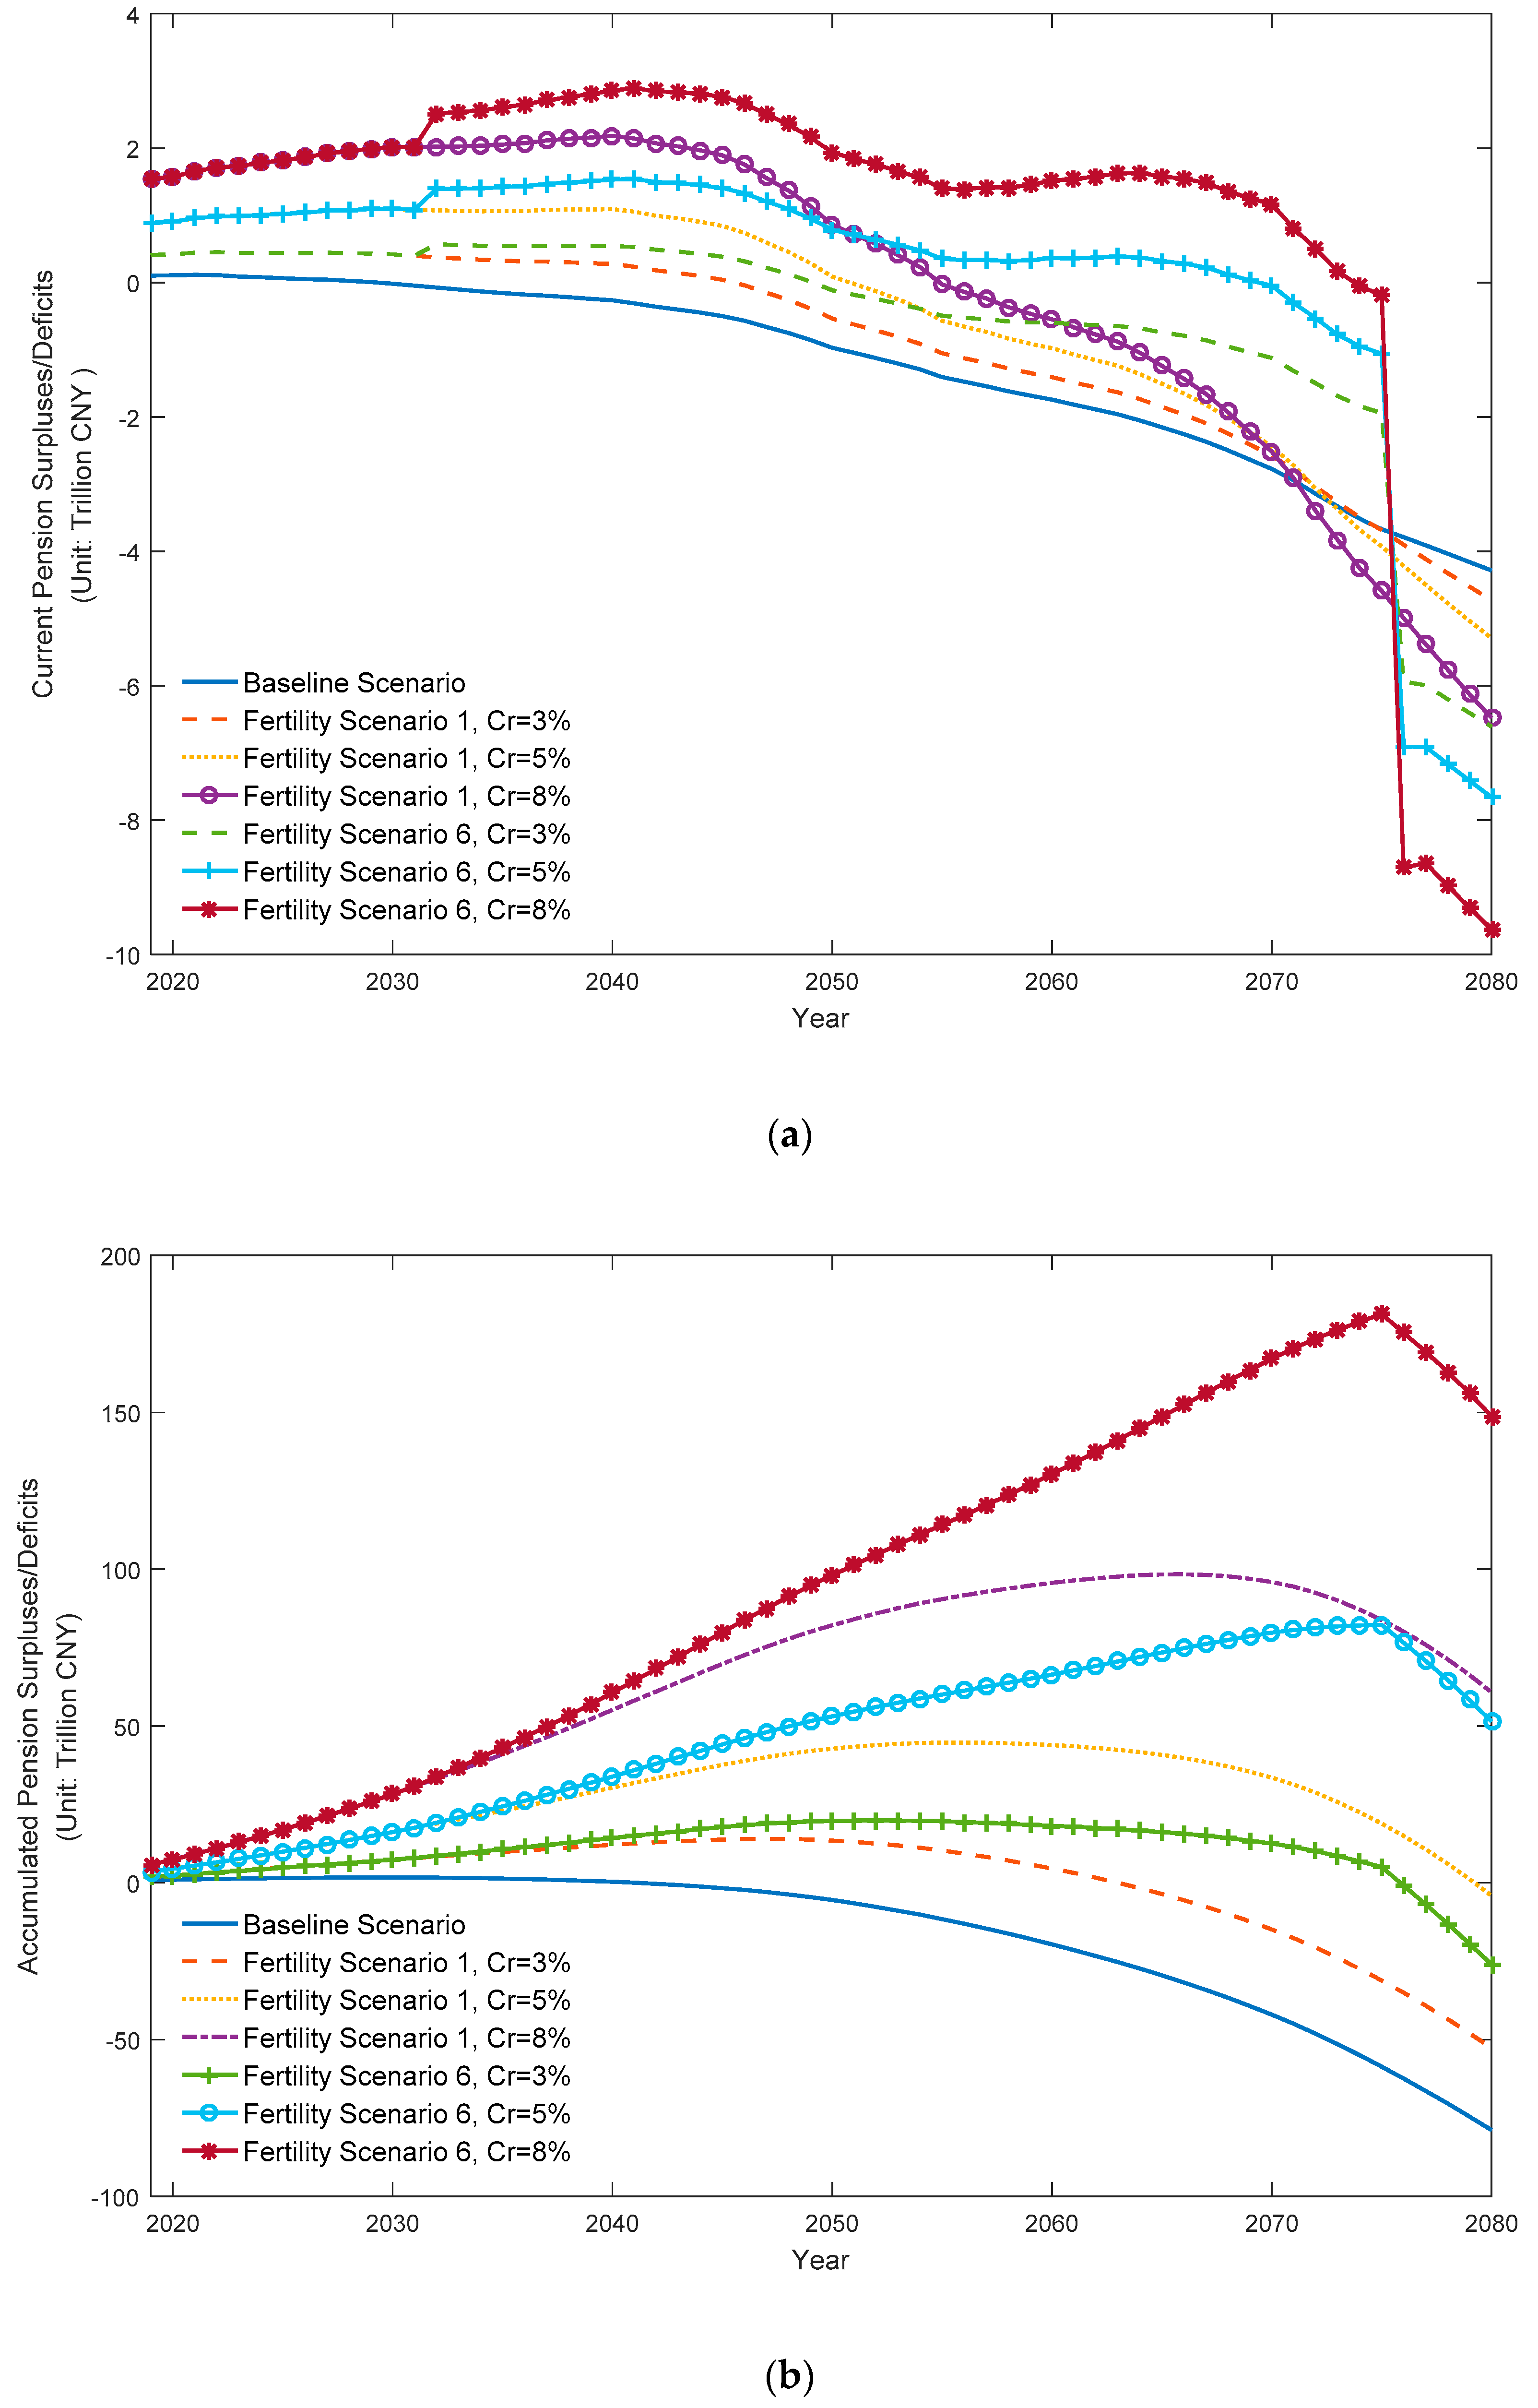
Raising the contribution rate is one common policy option to reduce the pension pressure by increasing pension income. The practical individual pension contribution rate (1.72%) of the NRPP has remained at a low level mainly due to voluntary participation, compared with China’s compulsory pension scheme for urban employees (8%) and government officials (8%). Figure A2 shows the simulation results of sustainability capacity of the NRPP under the two-child policy if the contribution rate were raised to 3%, 5%, or 8%. We can see that the pension deficits would be significantly improved before the second children retired. The current pension deficits would not turn negative until 2045 if the contribution rate rose to 3% under fertility scenario 1, and this would happen in 2076 if the contribution rate rose to 8% under fertility scenario 6. However, after that, the current pension deficit would deteriorate rapidly due to the great drop in pension revenue and the huge increase in pension payment induced by the retirement of the population of the second children. In 2080, the current pension deficit would peak at CNY 9.62 trillion with a contribution rate of 8% under fertility scenario 6, 2.24 times the deficit in the baseline scenario. On the other hand, the accumulated pension fund would stay balanced during the projection period if the contribution rate rose to 8% under fertility scenario 1 or at least 5% under fertility scenario 6.
6.3.3. Retirement Age
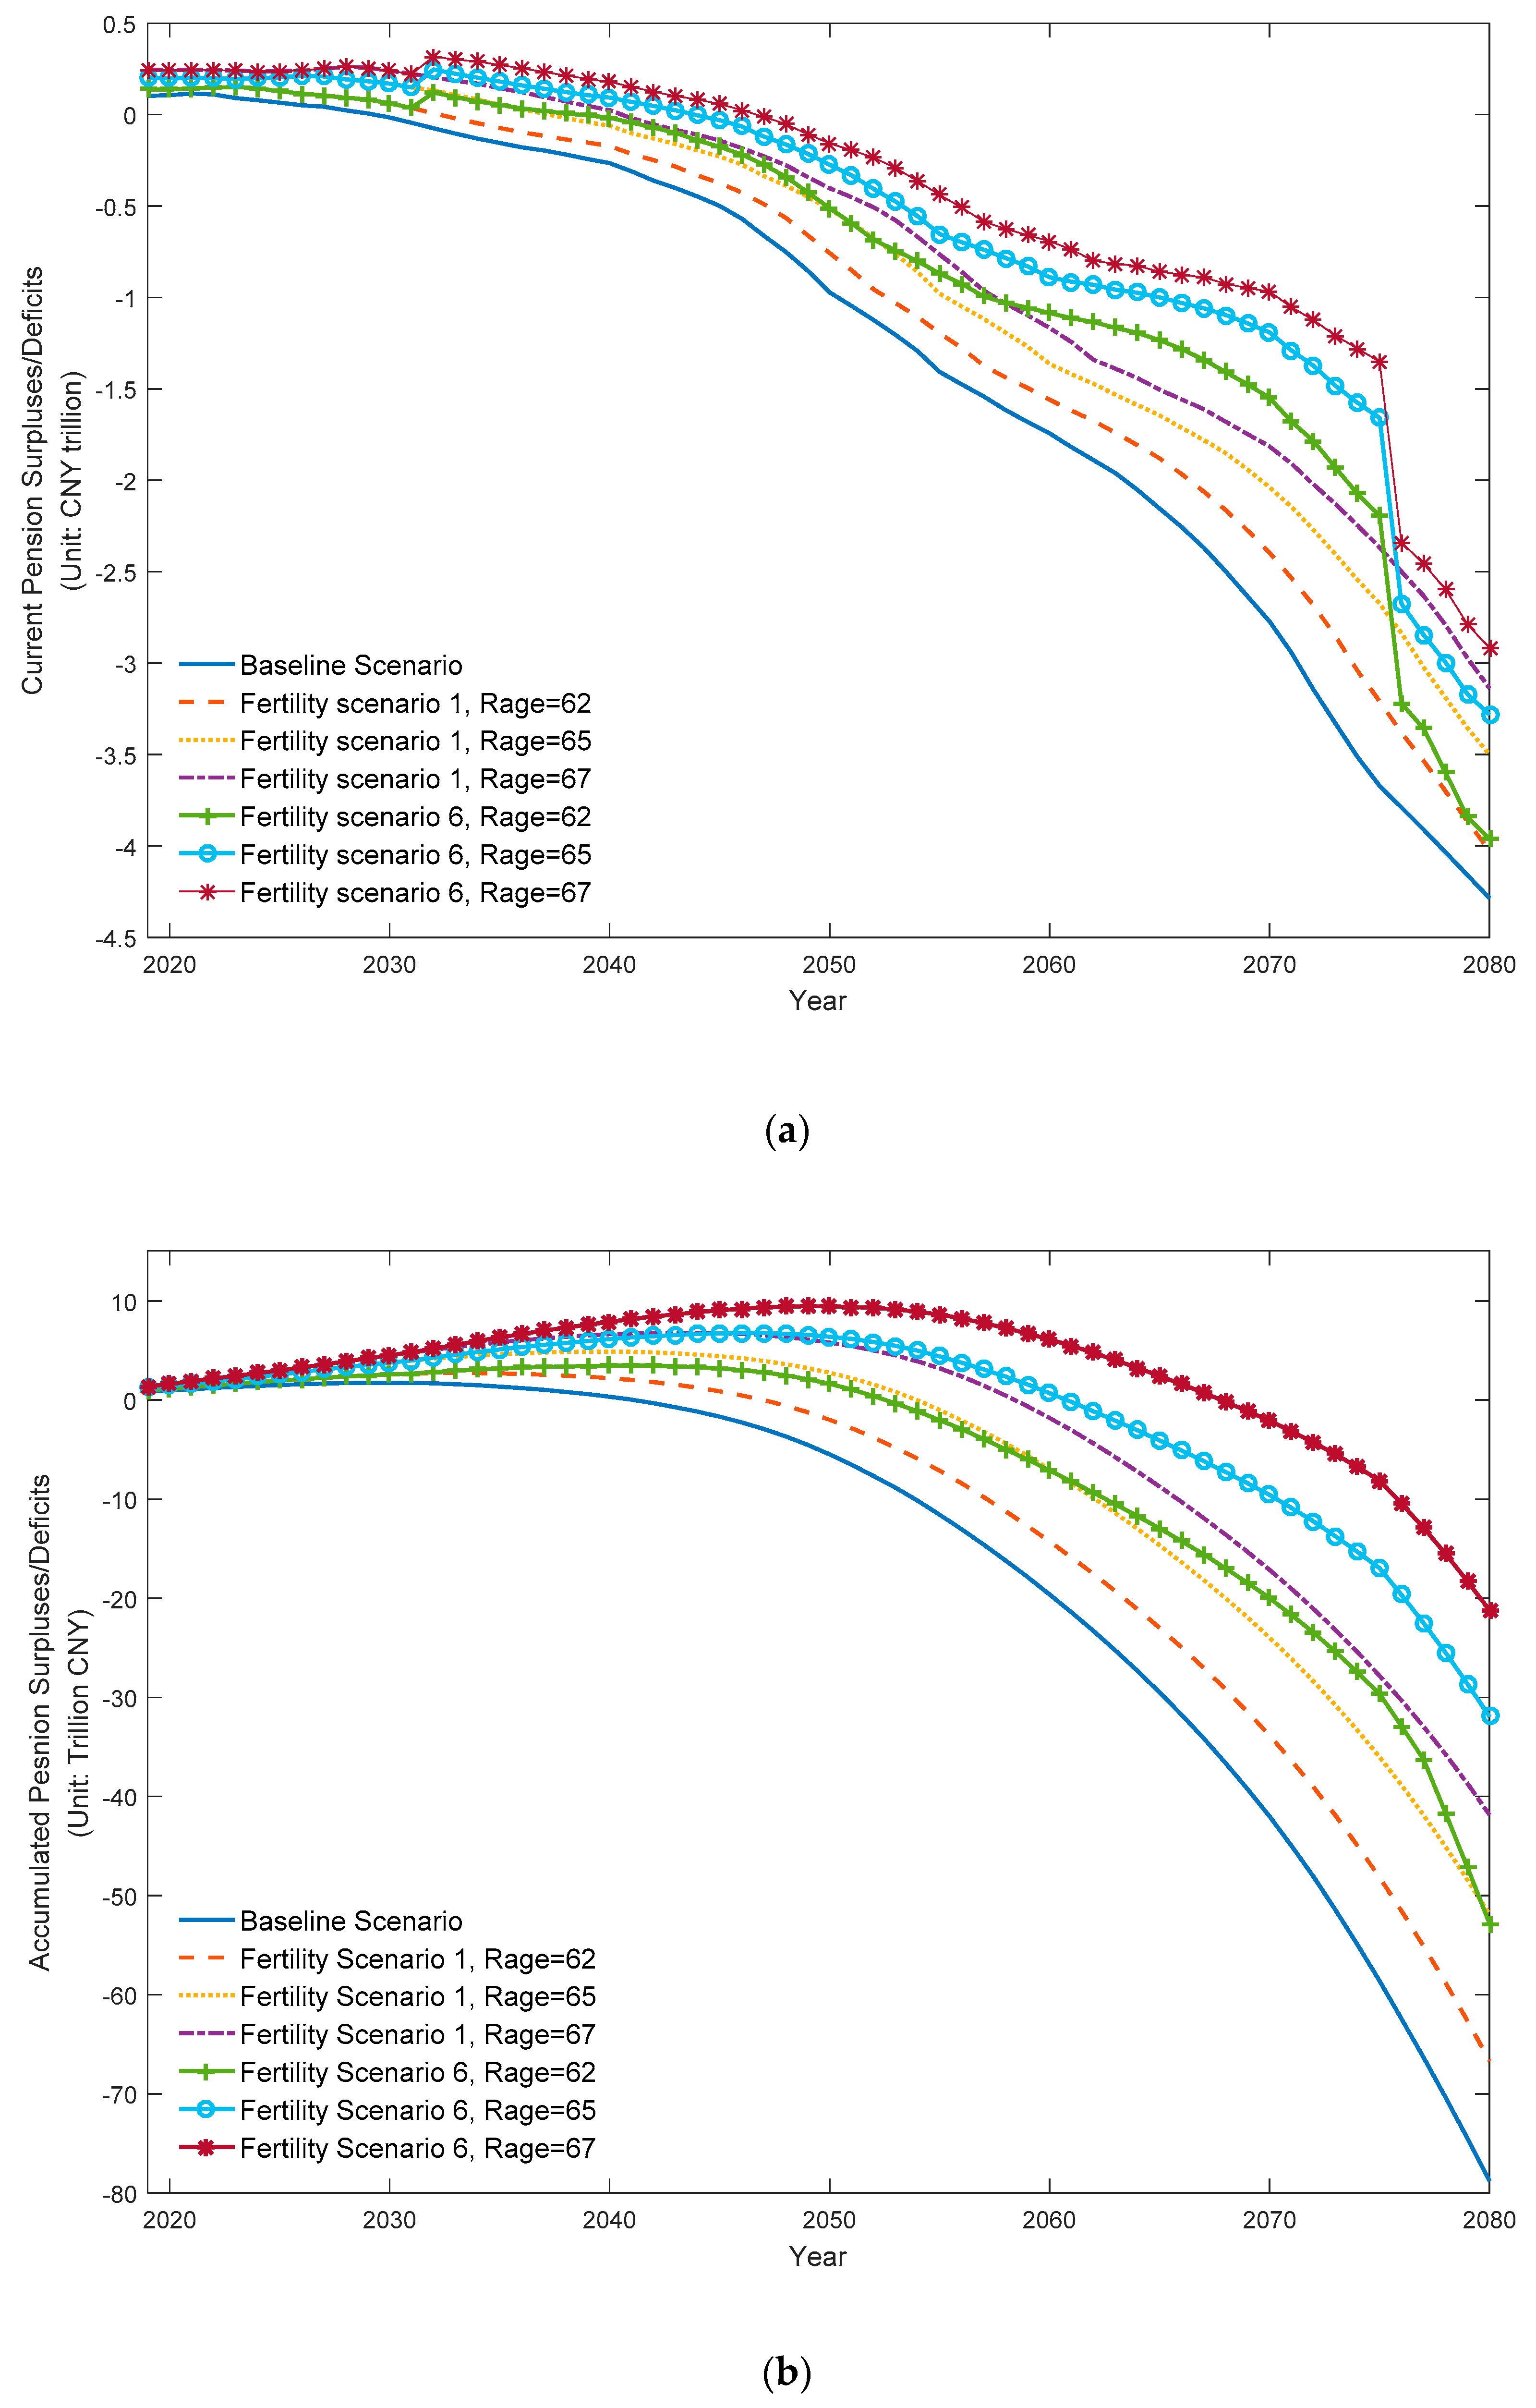
The low retirement age in China has been perceived as one important reason behind the financial sustainability imbalance of the pension system [12,13,36,54]. Figure A3 shows the projection outcomes of pension sustainability under the two-child policy when the retirement age is increased to 62, 65, or 67. As can be seen, delaying retirement would relieve the pension pressure. Under fertility scenario 1, if the retirement age were increased to 62, the current pension deficit would go into the red in 2033 and peak at CNY 4.03 trillion in 2080, 6.03% less than in the baseline scenario. Under fertility scenario 6, the current pension fund would go into deficit in 2047 with a retirement age of 67. In this situation, the current pension deficit would reach CNY 2.92 trillion in 2080, reduced by 31.89% from the baseline scenario. For the accumulated pension fund, the imbalances would occur in 2047 and 2068 under fertility scenarios 1 and 6, respectively, with 5- and 20-year delays relative to the baseline scenario. With a retirement age of 67 under fertility scenario 6, the accumulated pension deficit would reach CNY 21.21 trillion in 2080, 73.09% less than in the baseline scenario and only 32.33% of that when implementing the two-child policy (fertility scenario 6) alone. In the long run, both current and accumulated pension deficits would expand yearly, particularly quickly after the first group of second children retired in 2076.
6.3.4. Growth Rate of Pension Benefit
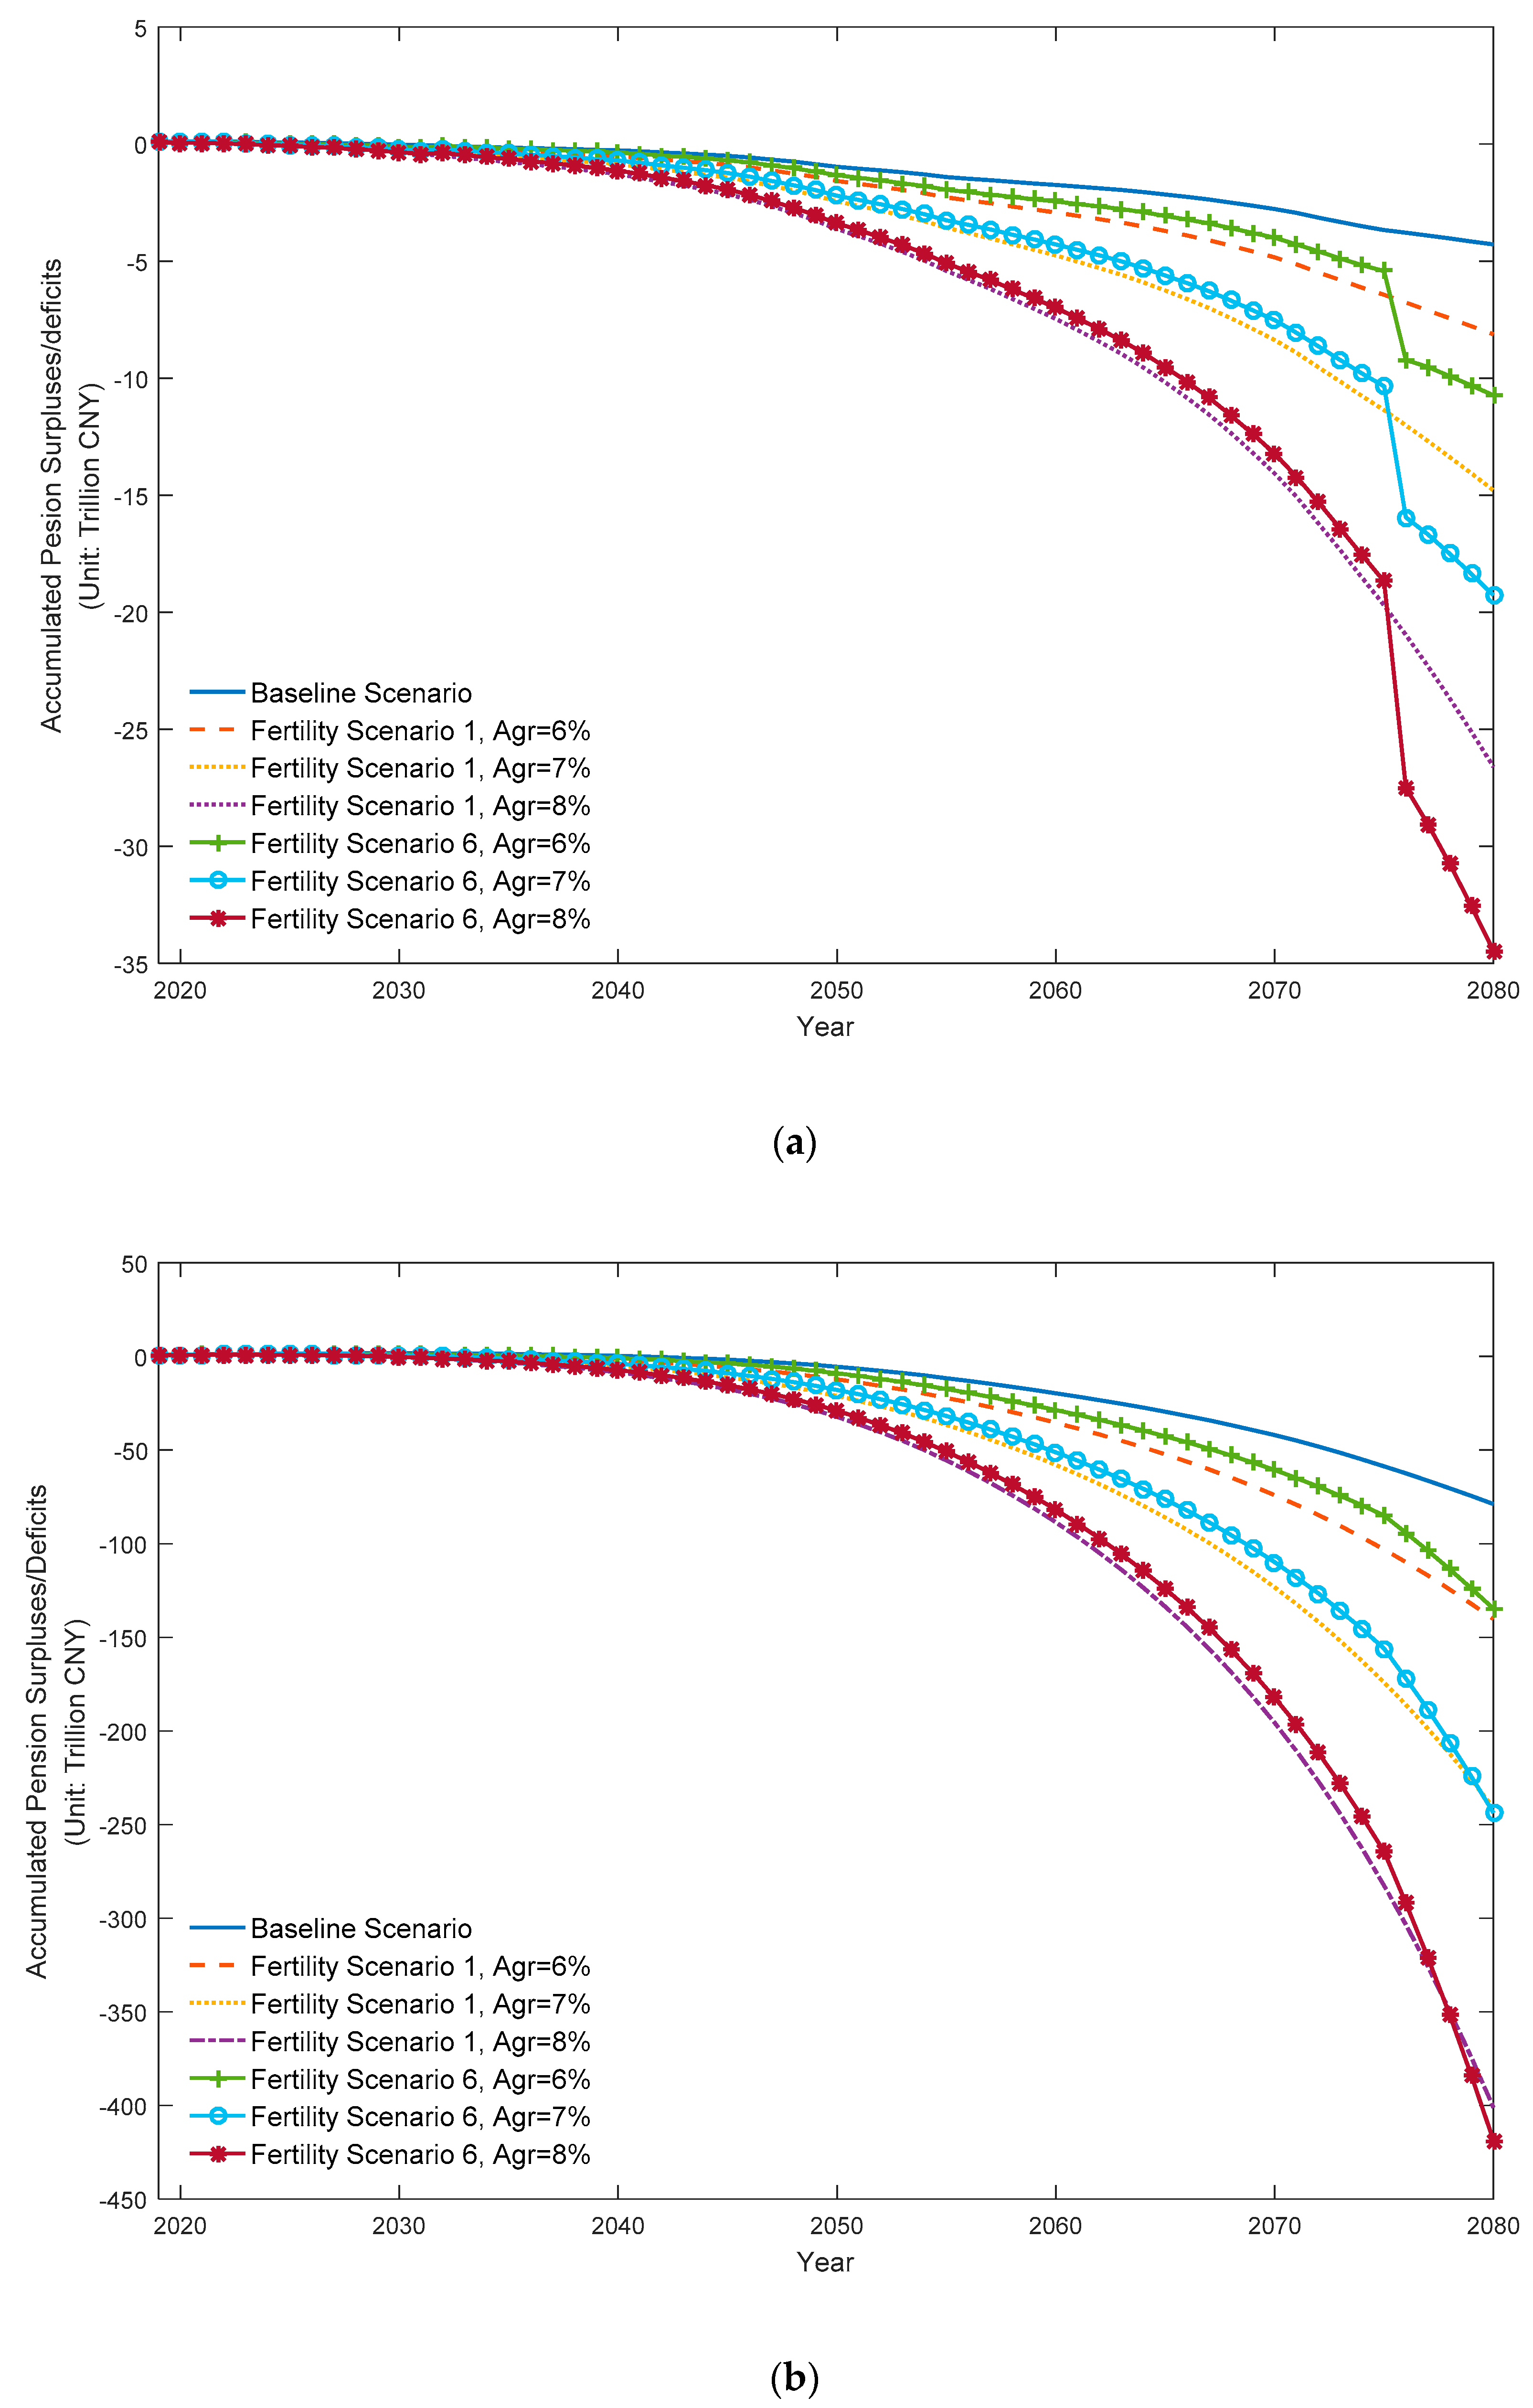
The low pension benefit level of the NRPP has received much criticism from both the public and international academia [12,13]. Ever since 2015, the pension replacement, the ratio of pension benefits to per capita net income of rural residents, has remained around 11%, which is far less than the pension replacement of urban employees (46%) and government officials (85%) [38]. To increase the pension benefit level, the Chinese government decided to build a dynamic adjustment mechanism for the NRPP in 2018 [51]. However, the policy details have not been made public. Considering elderly rural residents’ increasing demands for better economic security, we presume the annual growth rate of pension benefit will rise to 6%, 7%, or 8% under the two-child policy. Figure A4 represents the simulation results. As the average annual growth rate of pension benefit rises, both the current pension deficit and the accumulated pension deficit expand rapidly. Under fertility scenario 1, with an annual growth rate of 6%, the current and accumulated pension deficits would arrive at CNY 8.12 trillion and CNY 140.27 trillion in 2080, 1.89 times and 1.78 times as much as in the baseline scenario. Meanwhile, under fertility scenario 6 with an annual growth rate of 8%, the current and accumulated pension deficits would jump to CNY 34.46 trillion and CNY 418.70 trillion in 2080, 8.03 times and 5.31 times the deficits in the baseline scenario, respectively, and 5.84 times and 6.38 times the deficits when implementing the two-child policy (fertility scenario 6) alone. In addition, the increase in the contribution rate would lead to a significant advance in the occurrence of the pension deficit, 4–7 years ahead of the baseline scenario for the current pension deficit and 6–12 years for the accumulated pension deficit.
7. Conclusions
This paper simulated the financial sustainability of China’s NRPP and shed light on the impact of the demographic policy reform, i.e., replacing the famous one-child policy with the two-child policy. By applying the cohort component method and setting up actuarial models, we evaluated the financial sustainability of the NRPP in the period 2019–2080 under a series of assumptions on fertility variation. The remarkable findings in this paper are summarized as follows:
- The projection results indicate that the NRPP would be challenged by an increasing pension payment burden under the one-child policy. The occurrence of the current and accumulated pension deficits would happen in 2030 and 2042, respectively, which is also supported by previous research findings [9,55]. After that, the pension gap would expand yearly at a faster pace. The current and accumulated pension deficits would arrive at CNY 4.29 trillion and CNY 78.80 trillion at the end of the projection period.
- Fertility scenario analysis shows that a higher proportion of couples desiring to parent a second child would relieve more pension pressure despite a moderate policy effect and a time-lagged effect. This is similar to the conclusions in studies on the impacts of the fertility policy reform on China’s pension schemes for urban employees [6,33,56]. In addition, our simulations reveal the pension trend after the group of the second children retired in 2076 and indicates that the pension gap would be much enlarged thereafter. This outcome is rarely noticed within international academia to the best of our knowledge and deserves close attention by China’s policymakers in their future preparations.
- Sensitivity analysis reveals that, combined with the two-child policy, raising the contribution rate would offer the most help in promoting the sustainable development of the NRPP, compared to delaying retirement and lifting the parity-specific fertility rate at first birth. However, if the annual growth rate increased, the pension deficit would seriously deteriorate and occur 4–12 years earlier than in the baseline scenario. This adverse impact on pension sustainability is far from being offset by the positive effect of the demographic policy reform. Sustainability and adequacy are two sides of the same coin [36,57,58]. However, our sensitivity simulation results indicate that the government chose the former rather than the latter.
Based on the conclusions above, we suggest that, in addition to encouraging people to have more children, the Chinese government needs to implement more systematic top-down reforms, such as lifting the pooling levels of pension funds, introducing an advanced social insurance accounting system, and establishing automatic benefit adjustment mechanisms, to achieve the sustainable development targets of the NRPP [13,30,31,34].
It should be noted that this study mainly investigated the uncertainty attributed to the demographic policy reform, and this will underestimate the uncertainty of population projection because of the insufficient consideration of the changes in other demographic variables, such as changes in patterns of mortality. We need to understand that it is not the exact amounts of the pension deficits but the changes in deficit status when fertility varies that are more important. Since the main concern in this paper is the dynamics of fertility and its impacts on pension sustainability, assuming that the mortality rates are constant would make the results more visual and comparable between different scenarios. In fact, we have done some simulations with a lower mortality rate, considering Chinese people’s extended life span. Conclusions on the impacts of fertility variation remain robust. However, mortality rate would vary, accompanied by the development of society and the economy, and thus disturb the relationship between pension income and payment. From this point of view, the impact of changes in mortality patterns on pension sustainability deserves a future in-depth study.
Moreover, we did not consider the response behavior of rural individuals or the interaction between individual behavior and changes in the macro-and micro-environment. A slowing economy might alter individuals’ decisions on the number of children to have and how much to save, which would in turn affect the labor supply, the funded capital accumulation, and the economic growth. Thus, the relations between pension income and payment would be changed correspondingly [59,60,61,62,63]. The interlaced effects among individual, family, and socioeconomic variables make determining the pension plan’s sustainable capacity more complicated and deserve further exploration.
Notwithstanding limitations above, this study on the impact of the demographic policy reform on the rural pension system will provide policy examples and implications for countries under similar circumstances, especially developing nations.
Author Contributions
Conceptualization, H.W. and J.H.; Data curation, S.S.; Funding acquisition, H.W. and J.H.; Investigation, H.W.; Methodology, H.W. and S.S.; Resources, J.H.; Software, H.W.; Writing—original draft, H.W.; Writing—review & editing, H.W., J.H. and S.S.
Funding
This work was financially supported by a Humanity and Social Science Project of the Ministry of Education of China (17YJC840037) and the Fundamental Research Funds for the Central Universities (2019B37314).
Acknowledgments
We would like to thank the three anonymous reviewers for their constructive suggestions.
Conflicts of Interest
The authors declare no conflicts of interest.
Appendix A
Figure A1.
Trends of the financial sustainability of the NRPP under the two-child policy with variations in parity-specific total fertility rate. (a) Current pension surpluses/deficits; (b) Accumulated pension surpluses/deficits. Note: a denotes parity-specific total fertility rate at first birth.
Figure A1.
Trends of the financial sustainability of the NRPP under the two-child policy with variations in parity-specific total fertility rate. (a) Current pension surpluses/deficits; (b) Accumulated pension surpluses/deficits. Note: a denotes parity-specific total fertility rate at first birth.

Figure A2.
Trends of financial sustainability of the NRPP under the two-child policy with variations in pension contribution. (a) Current pension surpluses/deficits; (b) Accumulated pension surpluses/deficits. Note: denotes individual pension contribution rate.
Figure A2.
Trends of financial sustainability of the NRPP under the two-child policy with variations in pension contribution. (a) Current pension surpluses/deficits; (b) Accumulated pension surpluses/deficits. Note: denotes individual pension contribution rate.

Figure A3.
Trends of financial sustainability of the NRPP under the two-child policy with variations in retirement age. (a) Current pension surpluses/deficits; (b) Accumulated pension surpluses/deficits. Note: denotes retirement age.
Figure A3.
Trends of financial sustainability of the NRPP under the two-child policy with variations in retirement age. (a) Current pension surpluses/deficits; (b) Accumulated pension surpluses/deficits. Note: denotes retirement age.

Figure A4.
Trends of financial sustainability of the NRPP under the two-child policy with variations in the annual growth rate of pension benefit. (a) Current pension surpluses/deficits; (b) Accumulated pension surpluses/deficits. Note: denotes annual growth rate of pension benefit.
Figure A4.
Trends of financial sustainability of the NRPP under the two-child policy with variations in the annual growth rate of pension benefit. (a) Current pension surpluses/deficits; (b) Accumulated pension surpluses/deficits. Note: denotes annual growth rate of pension benefit.

References
- European Commission. Available online: https://ec.europa.eu/social/main.jsp?langId=en&catId=89&newsId=1194&furtherNews=yes (accessed on 31 July 2019).
- Meier, V.; Werding, M. Ageing and the Welfare State: Securing Sustainability; CESifo Working Paper No.2916; Center for Economic Studies and Ifo Institute: Munich, Germany, 2010. [Google Scholar]
- Barr, N. International Trends in Pension Provision. Account. Bus. Res. 2009, 39, 17–38. [Google Scholar] [CrossRef]
- Alonso-García, J.; Boado-Penas, M.D.C.; Devolder, P. Adequacy, Fairness and Sustainability of Pay-As-You-Go-Pension-Systems: Defined Benefit versus Defined Contribution. Eur. J. Financ. 2018, 24, 1100–1122. [Google Scholar] [CrossRef]
- Zheng, B. China Pension Report 2016, 1st ed.; Economic & Management Press: Beijing, China, 2016; pp. 48–64. ISBN 9787509647141. (In Chinese) [Google Scholar]
- Wang, H.; Huang, J.; Yang, Q. Assessing the Financial Sustainability of the Pension Plan in China: The Role of Fertility Policy Adjustment and Retirement Delay. Sustainability 2019, 11, 883. [Google Scholar] [CrossRef]
- Zhao, Y.; Bai, M.; Feng, P.; Zhu, M. Stochastic Assessments of Urban Employees’ Pension Plan of China. Sustainability 2018, 10, 1028. [Google Scholar] [CrossRef]
- Tian, Y.; Zhao, X. Stochastic Forecast of the Financial Sustainability of Basic Pension in China. Sustainability 2016, 8, 46. [Google Scholar] [CrossRef]
- Zeng, Y.; Zhang, X.; Liu, L. From “Selective Two-Child Policy” to “Universal Two-Child Policy”: Will the Payment Crisis of China’s Pension System be Solved? China Financ. Econ. Rev. 2017, 5, 14. [Google Scholar] [CrossRef]
- National Bureau of Statistics of China. Available online: http://www.stats.gov.cn/ (accessed on 20 January 2019).
- National Bureau of Statistics of China. Available online: http://www.stats.gov.cn/tjsj/ndsj/2016/indexch.htm (accessed on 20 January 2019).
- Guo, Y. Pension Policy Reforms in China from 2009 to 2012. China J. Soc. Work 2014, 7, 237–246. [Google Scholar] [CrossRef]
- Shen, C.; Williamson, J.B. China’s New Rural Pension Scheme: Can It Be Improved? Int. J. Sociol. Soc. Policy 2010, 30, 239–250. [Google Scholar] [CrossRef]
- Zeng, Y.; Hesketh, T. The Effects of China’s Universal Two-Child Policy. Lancet 2016, 388, 1930–1938. [Google Scholar] [CrossRef]
- Kitao, S. Fiscal Cost of Demographic Transition in Japan. J. Econ. Dyn. Control 2015, 54, 37–58. [Google Scholar] [CrossRef]
- Godínez-Olivares, H.; Boado-Penas, M.D.C.; Haberman, S. Optimal Strategies for Pay-As-You-Go Pension Finance: A Sustainability Framework. Insur. Math. Econ. 2016, 69, 117–126. [Google Scholar] [CrossRef]
- Castro, G.; Maria, J.R.; Félix, R.M.; Braz, C.R. Aging and Fiscal Sustainability in a Small Euro Area Economy. Macroecon. Dyn. 2017, 21, 1673–1705. [Google Scholar] [CrossRef]
- Lin, B.; Lin, Z.; Zhang, Y.Y.; Liu, W. The Impact of the New Rural Pension Scheme on Retirement Sustainability in China: Evidence of Regional Differences in Formal and Informal Labor Supply. Sustainability 2018, 10, 4366. [Google Scholar] [CrossRef]
- Bongaarts, J. Population Aging and the Rising Cost of Public Pensions. Popul. Dev. Rev. 2004, 30, 1–23. [Google Scholar] [CrossRef]
- Blake, D.; Mayhew, L. On the Sustainability of the UK Pension System in the Light of Population Ageing and Declining Fertility. Procedia Soc. Behav. Sci. 2015, 183, 77–84. [Google Scholar] [CrossRef]
- Stauvermann, P.J.; Kumar, R.R. Sustainability of a pay-as-you-go pension system in a small open economy with ageing, human capital and endogenous fertility. Metroeconomica 2016, 67, 2–20. [Google Scholar] [CrossRef]
- Fanti, L.; Gori, L. Fertility and PAYG Pensions in the Overlapping Generations Model. J. Popul. Econ. 2012, 25, 955–961. [Google Scholar] [CrossRef]
- Stauvermann, P.J.; Kumar, R.R. Demographic Change, PAYG Pensions and Child Policies. J. Pension Econ. Financ. 2018, 17, 469–487. [Google Scholar] [CrossRef]
- Chłoń-Domińczak, A.; Franco, D.; Palmer, E. The First Wave of NDC Reforms: The Experiences of Italy, Latvia, Poland, and Sweden. In Nonfinancial Defined Contribution Pension Schemes in a Changing Pension World; Holzmann, R., Palmer, E., Robalino, D., Eds.; The World Bank: Washington, DC, USA, 2012; pp. 31–85. [Google Scholar]
- Lisenkova, K.; Bornukova, K. Effects of Population Ageing on the Pension System in Belarus. Balt. J. Econ. 2017, 17, 103–118. [Google Scholar] [CrossRef]
- Grech, A.G. What Makes Pension Reforms Sustainable? Sustainability 2018, 10, 2891. [Google Scholar] [CrossRef]
- Moizer, J.; Farrar, S.; Hyde, M. UK State Pension Deferral Incentives and Sustainability. Appl. Econ. 2017, 50, 2356–2368. [Google Scholar] [CrossRef]
- Auerbach, A.J.; Lee, R. Welfare and Generational Equity in Sustainable Unfunded Pension Systems. J. Public Econ. 2011, 95, 16–27. [Google Scholar] [CrossRef] [PubMed]
- Alonso-García, J.; Devolder, P. Optimal Mix Between Pay-As-You-Go and Funding for DC Pension Schemes in an Overlapping Generations Model. Insur. Math. Econ. 2016, 70, 224–236. [Google Scholar] [CrossRef]
- Vidal-Meliá, C.; Ventura-Marco, M.; González, J.M.P.S. Social Insurance Accounting for a Notional Defined Contribution Scheme Combining Retirement and Long-Term Care Benefits. Sustainability 2018, 10, 2832. [Google Scholar] [CrossRef]
- Meneu Gaya, R.; Devesa Carpio, J.E.; Domínguez Fabián, I.; Encinas Goenechea, B.; Alonso Fernández, J.J. The Effects of Recent Spanish Pension Reforms on Sustainability and Pension Adequacy. Appl. Econ. 2018, 50, 2459–2468. [Google Scholar] [CrossRef]
- Coeurdacier, N.; Guibaud, S.; Jin, K. Fertility Policies and Social Security Reforms in China. IMF Econ. Rev. 2014, 62, 371–408. [Google Scholar] [CrossRef] [Green Version]
- Zeng, Y.; Zhang, R. Assessing the Impact of Liberalising the One-Child Policy on the Sustainability of China’s Pension System. China J. Soc. Work 2017, 10, 98–119. [Google Scholar] [CrossRef]
- Williamson, J.B.; Fang, L.; Calvo, E. Rural Pension Reform in China: A Critical Analysis. J. Aging Stud. 2017, 41, 67–74. [Google Scholar] [CrossRef]
- Wang, L.; Béland, D. Assessing the Financial Sustainability of China’s Rural Pension System. Sustainability 2014, 6, 3271–3290. [Google Scholar] [CrossRef]
- Salditt, F.; Whiteford, P.; Adema, W. Pension Reform in China. Int. Soc. Secur. Rev. 2008, 61, 47–71. [Google Scholar] [CrossRef]
- Farid, M.; Cozzarin, B.P. China’s Pension Reform: Challenges and Opportunities. Pensions 2009, 14, 181–190. [Google Scholar] [CrossRef]
- Wang, H.; Huang, J. Research on Fairness of Endowment Insurance System, 1st ed.; Jiangsu People’s Publishing, LTD: Nanjing, China, 2016; pp. 110–114. ISBN 978-7-214-17384-3. (In Chinese) [Google Scholar]
- The Central People’s Government of the People’s Republic of China. Available online: http://www.gov.cn/zwgk/2009-09/04/content_1409216.htm (accessed on 15 May 2019).
- The Central People’s Government of the People’s Republic of China. Available online: http://www.gov.cn/zwgk/2014-02/26/content_2621907.htm (accessed on 15 May 2019).
- Smith, S.K. Accounting for Migration in Cohort-Component Projections of State and Local Populations. Demography 1986, 23, 127–135. [Google Scholar] [CrossRef] [PubMed]
- Zeng, Y.; Land, K.C.; Wang, Z.; Gu, D. Household and Living Arrangement Projections at the Subnational Level: An Extended Cohort-Component Approach. Demography 2013, 50, 827–852. [Google Scholar] [CrossRef] [PubMed]
- Shi, R.; Chen, N.; Zheng, Q. Evaluation on the Effect of Childbearing Policy Adjuestments in China. Chin. J. Popul. Sci. 2018, 38, 114–125. (In Chinese) [Google Scholar]
- Guo, Z.; Gietel-Basten, S.; Gu, B. The Lowest Fertility Rates in the World? Evidence from the 2015 Chinese 1% Sample Census. China Popul. Dev. Stud. 2018, 2, 1–14. [Google Scholar] [CrossRef]
- Chen, W.; Duan, Y. Recent Levels and Trends of Fertility in China. Popul. Res. 2019, 43, 3–17. (In Chinese) [Google Scholar]
- Lowe, C.R.; McKeown, T. Sex Ratio at Birth. Br. Med. J. 1953, 4831, 339. [Google Scholar] [CrossRef]
- State Council of China. Available online: http://www.gov.cn/zhengce/content/2017-01/25/content_5163309.htm (accessed on 25 October 2018).
- National Bureau of Statistics of China. Available online: http://www.stats.gov.cn/tjsj/ndsj/ (accessed on 2 August 2019).
- Migrant Population Service Center of China’s National Health Commission. Available online: http://www.chinaldrk.org.cn/wjw/#/home (accessed on 2 August 2019).
- Ministry of Human Resources and Social Security of China. Available online: http://www.mohrss.gov.cn/ (accessed on 20 May 2019).
- Ministry of Human Resources and Social Security of People’s Republic of China. Available online: http://www.mohrss.gov.cn/gkml/zcfg/gfxwj/201803/t20180329_291008.html (accessed on 20 May 2019).
- Zhao, Y.; Bai, M.; Liu, Y.; Hao, J. Quantitative Analyses of Transition Pension Liabilities and Solvency Sustainability in China. Sustainability 2017, 9, 2252. [Google Scholar] [CrossRef]
- Fang, L. A Research on the Introduction of a Sustainable Mechanism for Basic Pension Benefit Indexation in China: Lessons from International Cases. Popul. J. 2018, 40, 66–77. (In Chinese) [Google Scholar]
- Calvo, E.; Williamson, J.B. Old-Age Pension Reform and Modernization Pathways: Lessons for China from Latin America. J. Aging Stud. 2008, 22, 74–87. [Google Scholar] [CrossRef] [PubMed]
- Jing, P.; Chen, M.; Hu, Q. The Moderate Benefit and Fiscal Burden of Basic Pension Insurance for Urban and Rural Residents. Public Financ. Res. 2018, 39, 66–78. (In Chinese) [Google Scholar]
- Zeng, Y.; Ling, Y.; Zhang, X. From Selective Two-Child Policy to Universal Two-Child Policy: Can the Sustainability of China’s Basic Pension Insurance Fund for Urban and Rural Residents Be Improved? Public Financ. Res. 2019, 40, 65–79. (In Chinese) [Google Scholar]
- Liu, T.; Sun, L. Pension Reform in China. J. Aging Soc. Policy 2016, 28, 15–28. [Google Scholar] [CrossRef] [PubMed]
- Hu, N.; Yang, Y. The Real Old-Age Dependency Ratio and the Inadequacy of Public Pension Finance in China. J. Popul. Ageing 2012, 5, 193–209. [Google Scholar] [CrossRef]
- Cipriani, G.P.; Pascucci, F. Pension Policies in a Model with Endogenous Fertility. J. Pension Econ. Financ. 2018, 17, 1–17. [Google Scholar] [CrossRef]
- Lugauer, S.; Ni, J.; Yin, Z. Chinese Household Saving and Dependent Children: Theory and Evidence. China Econ. Rev. 2017, 101091. [Google Scholar] [CrossRef]
- Curtis, C.C.; Lugauer, S.; Mark, N.C. Demographics and Aggregate Household Saving in Japan, China, and India. J. Macroecon. 2017, 51, 175–191. [Google Scholar] [CrossRef]
- Curtis, C.; Lugauer, S.; Mark, N.; Curtis, C.C.; Mark, N.C. Demographic Patterns and Household Saving in China. Am. Econ. J. Macroecon. 2015, 7, 58–94. [Google Scholar] [CrossRef]
- Zhao, Q.; Mi, H. Evaluation on the Sustainability of Urban Public Pension System in China. Sustainability 2019, 11, 1418. [Google Scholar] [CrossRef]
Figure 1.
Trends of pension incomes and expenditures under the one-child policy.

Figure 2.
Trends of financial sustainability of the NRPP under the two-child policy. (a) Current pension surpluses/deficits; (b) Accumulated pension surpluses/deficits.
Figure 2.
Trends of financial sustainability of the NRPP under the two-child policy. (a) Current pension surpluses/deficits; (b) Accumulated pension surpluses/deficits.


Table 1.
Trends of financial sustainability of the New Rural Pension Plan (NRPP) under the one-child policy (Trillion CNY).
Table 1.
Trends of financial sustainability of the New Rural Pension Plan (NRPP) under the one-child policy (Trillion CNY).
| Year | Pension Income | Pension Expenditure | Current Pension Surplus/Deficit | Accumulated Pension Surplus/Deficit |
|---|---|---|---|---|
| 2019 | 0.43 | 0.33 | 0.10 | 0.85 |
| 2020 | 0.44 | 0.34 | 0.11 | 0.97 |
| 2025 | 0.56 | 0.49 | 0.07 | 1.52 |
| 2030 | 0.70 | 0.71 | −0.02 | 1.75 |
| 2035 | 0.82 | 0.97 | −0.16 | 1.37 |
| 2040 | 0.98 | 1.25 | −0.27 | 0.34 |
| 2042 | 1.03 | 1.39 | −0.36 | −0.33 |
| 2045 | 1.11 | 1.61 | −0.50 | −1.67 |
| 2050 | 1.19 | 2.16 | −0.97 | −5.48 |
| 2055 | 1.32 | 2.73 | −1.41 | −11.55 |
| 2060 | 1.52 | 3.27 | −1.74 | −19.61 |
| 2065 | 1.74 | 3.89 | −2.15 | −29.49 |
| 2070 | 1.93 | 4.70 | −2.77 | −42.02 |
| 2075 | 2.06 | 5.73 | −3.67 | −58.62 |
| 2080 | 2.33 | 6.61 | −4.29 | −78.80 |
Table 2.
Percentage change in current pension deficit when implementing the two-child policy.
| Year | Baseline Scenario (Trillion CNY) | Fertility Scenarios (%) | |||||
|---|---|---|---|---|---|---|---|
| 1 | 2 | 3 | 4 | 5 | 6 | ||
| 2032 | −0.07 | 3.50 | 14.01 | 38.92 | 76.29 | 83.14 | 91.53 |
| 2035 | −0.16 | 6.10 | 19.47 | 40.34 | 60.22 | 78.63 | 87.66 |
| 2040 | −0.27 | 7.19 | 18.28 | 32.21 | 45.57 | 58.85 | 65.49 |
| 2045 | −0.50 | 5.65 | 13.03 | 22.44 | 31.74 | 41.00 | 45.62 |
| 2050 | −0.97 | 3.85 | 8.40 | 14.32 | 20.24 | 26.15 | 29.12 |
| 2055 | −1.41 | 3.48 | 7.51 | 12.92 | 18.39 | 23.89 | 26.64 |
| 2060 | −1.74 | 3.87 | 8.50 | 14.88 | 21.33 | 27.79 | 31.03 |
| 2065 | −2.15 | 4.36 | 9.62 | 16.72 | 23.80 | 30.84 | 34.35 |
| 2070 | −2.77 | 4.57 | 9.95 | 17.13 | 24.31 | 31.50 | 35.10 |
| 2075 | −3.67 | 4.41 | 9.33 | 15.82 | 22.30 | 28.81 | 32.07 |
| 2080 | −4.29 | −1.21 | −7.92 | −17.86 | −26.35 | −34.01 | −37.78 |
Note: Positive % change indicates a reduction in current pension deficits compared to the baseline scenario, while negative % change implies an enlargement; denotes the proportion of couples having a second child.
Table 3.
Percentage change in accumulated pension deficit when implementing the two-child policy.
| Year | Baseline Scenario (Trillion CNY) | Fertility Scenarios (%) | |||||
|---|---|---|---|---|---|---|---|
| 1 | 2 | 3 | 4 | 5 | 6 | ||
| 2042 | −0.33 | 46.80 | -- | -- | -- | -- | -- |
| 2043 | −0.73 | 24.33 | 66.57 | -- | -- | -- | -- |
| 2044 | −0.73 | 17.31 | 46.50 | 87.99 | -- | -- | -- |
| 2045 | −1.18 | 13.84 | 36.53 | 68.47 | -- | -- | -- |
| 2046 | −1.67 | 11.67 | 30.30 | 56.32 | 82.80 | -- | -- |
| 2047 | −2.24 | 10.11 | 25.87 | 47.71 | 69.90 | 92.53 | -- |
| 2048 | −2.90 | 8.95 | 22.60 | 41.42 | 60.49 | 79.91 | 89.75 |
| 2050 | −5.48 | 7.30 | 17.99 | 32.59 | 47.36 | 62.37 | 69.95 |
| 2055 | −11.55 | 5.37 | 12.64 | 22.50 | 32.44 | 42.51 | 47.59 |
| 2060 | −19.61 | 4.68 | 10.75 | 19.00 | 27.34 | 35.76 | 39.99 |
| 2065 | −29.49 | 4.51 | 10.25 | 18.04 | 25.90 | 33.80 | 37.77 |
| 2070 | −42.02 | 4.51 | 10.13 | 17.74 | 25.38 | 33.06 | 36.91 |
| 2075 | −58.62 | 4.49 | 9.95 | 17.28 | 24.62 | 31.97 | 35.66 |
| 2080 | −78.80 | 3.49 | 6.49 | 9.63 | 12.50 | 15.35 | 16.78 |
Note: Positive % change indicates a reduction in accumulated pension deficits compared to the baseline scenario, while negative % change implies an enlargement; denotes the proportion of couples having a second child.
Table 4.
Occurrence of pension deficit when implementing the two-child policy.
| Year | Baseline Scenario | Fertility Scenarios | ||||||||||||
|---|---|---|---|---|---|---|---|---|---|---|---|---|---|---|
| 1 | 2 | 3 | 4 | 5 | 6 | |||||||||
| ① | ② | ③ | ④ | ⑤ | ⑥ | ⑦ | ⑧ | ⑨ | ⑩ | ⑪ | ⑫ | ⑬ | ⑭ | |
| 2030 | √ | √ | √ | √ | √ | √ | √ | |||||||
| 2042 | √ | √ | ||||||||||||
| 2043 | √ | |||||||||||||
| 2044 | √ | |||||||||||||
| 2046 | √ | |||||||||||||
| 2047 | √ | |||||||||||||
| 2048 | √ | |||||||||||||
Notes: Columns ①③⑤⑦⑨⑪⑬ denote current pension surpluses/deficits; ②④⑥⑧⑩⑫⑭ denote accumulated pension surpluses/deficits; denotes the proportion of couples having a second child.
© 2019 by the authors. Licensee MDPI, Basel, Switzerland. This article is an open access article distributed under the terms and conditions of the Creative Commons Attribution (CC BY) license (http://creativecommons.org/licenses/by/4.0/).
Share and Cite
MDPI and ACS Style
Wang, H.; Huang, J.; Sun, S. Assessment of the Financial Sustainability of China’s New Rural Pension Plan: Does the Demographic Policy Reform Matter? Sustainability 2019, 11, 5110. https://doi.org/10.3390/su11185110
AMA Style
Wang H, Huang J, Sun S. Assessment of the Financial Sustainability of China’s New Rural Pension Plan: Does the Demographic Policy Reform Matter? Sustainability. 2019; 11(18):5110. https://doi.org/10.3390/su11185110
Chicago/Turabian StyleWang, Huan, Jianyuan Huang, and Shuangyue Sun. 2019. "Assessment of the Financial Sustainability of China’s New Rural Pension Plan: Does the Demographic Policy Reform Matter?" Sustainability 11, no. 18: 5110. https://doi.org/10.3390/su11185110
Note that from the first issue of 2016, this journal uses article numbers instead of page numbers. See further details here.