An Investigation of Thermal Comfort of Houses in Dry and Semi-Arid Climates of Quetta, Pakistan


1
Sustainable Building Design (SBD) Lab, Department of UEE, Faculty of Applied Sciences, Universitè de Liège, 4000 Liège, Belgium
2
Department of Architecture, Balochistan University of Information Technology, Engineering and Management Sciences (BUITEMS), Airport Road, Baleli 87100, Quetta, Pakistan
3
Faculty of Architecture and Arts, Hasselt University, 3590 Diepenbeek, Belgium
4
Department of Human and Social Systems, Institute of Industrial Science, The University of Tokyo, 4-6-1, Komaba, Meguro-ku, Tokyo 153-8505, Japan
*
Author to whom correspondence should be addressed.
Sustainability 2019, 11(19), 5203; https://doi.org/10.3390/su11195203
Submission received: 13 September 2019
/
Revised: 18 September 2019
/
Accepted: 19 September 2019
/
Published: 23 September 2019
(This article belongs to the Collection Green Building Technologies)
Abstract
:In Pakistan, reinforced concrete frame houses are the most widely used and common construction technology. In a country that experiences extreme hot and cold seasons throughout the year, buildings need to be adaptable to the climate to improve the thermal comfort of the inhabitants. Therefore, the aim of this study was to improve thermal comfort in reinforced concrete frame houses using passive design and energy efficiency measures in Quetta, Pakistan. Thermal comfort of a representative house was investigated using a building performance simulation. The building model created in EnergyPlus was validated by comparing it with on-site monitored data in both summer and winter seasons. The model was calibrated using statistical methods. Then, the calibrated model was used to perform a whole year simulation in which various orientations, ventilation, passive design, and energy efficiency strategies were applied to perform parametric analysis for the improvement of thermal comfort. The best fit-to-context thermal comfort model was selected, and the potential of bioclimatic design strategies was quantified. The results indicate that by adopting passive design strategies comfort hours can be increased from 43% to 59%. The results of the study revealed many findings which could be useful for architects and building engineers to set a future direction for improvement of indoor comfort in Quetta as well as in many other areas of Balochistan Province in Pakistan.
1. Introduction
Pakistan is a large country with a rapidly growing population of more than 207 million inhabitants in 2017 [1]. The annual rate of rural–urban migration is 3%, which is the highest in South Asia. According to the estimates of the United Nations Population Division, by 2025 nearly half of the country’s population, currently 38 percent, will live in urban areas [2]. This increasing population has brought several challenges and socio-economic problems. The provision of adequate housing remains a challenge in Pakistan where the total backlog of housing units is between 9–10 million units [3], and the housing backlog in urban areas is 3.5 to 4 million units [4]. The gap is increasing by 0.4 million units per year [5].
Climate is another important factor in Pakistan because it has impacts on water, health, energy, agriculture, biodiversity, socio-economic factors, and the building sector. Pakistan has a wide range of climatic conditions; while the highlands of Balochistan are arid and cold, the coastal areas in Sindh and Balochistan are warm and humid and Northern Sindh and Central Punjab are extremely hot and semi-arid, whereas the climate in Northern and North-Western parts of Pakistan can be cold [6]. The global climate is continuously evolving and in the last two centuries, environmental issues and climate change have become emerging problems.
Pakistan has also faced an energy crisis for the last several years. The crisis started with a shortage of energy and imbalance between demand and production. In addition, there are problems with energy transmission and distribution. The old and inefficient electricity distribution network causes line losses. During the financial year 2018–2019, distribution firms suffered 18.3 percent of line losses [7,8]. Pakistan has an irrational and increasingly unaffordable electricity generation mix of 62.1% thermal, 25.8% hydroelectric, 8.2% nuclear, and only 3.9% renewables [9]. Subsidies in the energy sector have been reduced in recent months, which has created an immense burden of utility bills on the public [10]. On the other hand, the housing sector in Pakistan is the main consumer of electricity and used nearly half of the country’s electricity, i.e., 48%, produced during the period July 2018 to March 2019 [9]. Houses in Pakistan are mainly constructed without considering the local climate and socio-cultural context. Reinforced concrete frame houses are the main and most wide-spread construction technology across the nation. Personalized active systems, such as radiant gas heaters and split air conditioners are used to provide comfortable temperatures inside houses which increase energy usage and cost.
In this study, we focus mainly on houses of Quetta as a representative of Balochistan Province. Quetta is the tenth largest city of Pakistan and the provincial capital of Balochistan, with an urban population of more than 1 million. The city of Quetta is densely populated and the average population growth rate during the period 1998–2017 was 3.05% per annum [1]. According to the Köppen-Geiger climate classification Quetta lies in a cold semi-arid climate zone (BSk). It has a semi-arid and dry climate with low humidity, mild to extremely cold winters, and hot summers. Quetta is situated outside of monsoon range, but the city receives snowfall mostly in December, January, and February. The city is also located at high altitude with an average elevation of 1680 m [11]. It has extreme weather conditions, with recorded temperatures of 42 °C in summer and −18.3 °C in winter [12], which requires context and climate-based design recommendations for best practices.
In the context of the above-stated facts, there is a need to investigate the thermal performance of existing houses and provide updated recommendations on how to design housing to achieve maximum indoor thermal comfort in hybrid buildings. Hybrid buildings fall between free-running and fully space-conditioned buildings. A review of the literature shows that there are insufficient studies that address above mentioned issue and provides recent weather data based design recommendations using building performance simulations (BPS). In Pakistan, some previous studies have investigated the relationship between the thermal comfort of the occupants and climate in residential and office buildings [6,13,14,15]. Nicol et al. performed two surveys in office buildings of five different cities in Pakistan and found a definite relationship between outdoor climatic conditions and indoor comfort in line with an adaptive approach to thermal comfort. The research also revealed wide variations in indoor temperatures in the buildings in Pakistan due to specific building designs, layout, and a limited ability to control indoor temperatures [6]. Another study focused on the residential buildings in Quetta, Pakistan and the effects of climate on indoor thermal comfort of residential buildings. Results concluded that the houses were designed and built without considering climatic conditions and were unable to withstand extreme temperatures. As a consequence, this created discomfort for the occupants [13,14]. Khan compared the traditional building designs with modern residential building designs in Pakistan. The results determined that traditional buildings performed better with regard to temperature variations, reducing the ambient temperature and offering various comfort zones to the occupants during the hot summer [15].
In Asia, various studies have been conducted focusing on comfort and thermal performance of buildings [16,17,18,19,20,21,22,23,24,25,26]. However, thermal comfort studies are significantly rare in the region of South Asia (Afghanistan, Bangladesh, Bhutan, India, the Maldives, Nepal, Pakistan, and Sri Lanka). Ahmad et al. investigated the thermal performance of a traditional house in Dhaka [16]. Singh et al. evaluated the thermal performance and comfort temperatures in vernacular buildings in India [17]. A simulation-based study was conducted to improve the thermal performance of a traditional residential house in Assam, India [18]. In another study, the effect of a cool roof on the built environment was explored in composite and hot and dry climates of India [19]. Some of the important studies conducted on thermal comfort in Southeast Asia are presented here. Nguyen et al. proposed an adaptive thermal comfort model for the hot humid climate of Southeast Asia [20]. Nguyen and Reuter investigated the thermal performance of a low-cost apartment in Danang, Vietnam [21]. Toe investigated the application of passive cooling to optimize thermal comfort in houses in Malaysia [22]. Nughoro et al. did a preliminary study of thermal comfort in single-storey terraced houses in Malaysia [23]. Feriadi et al. investigated thermal comfort in naturally ventilated houses in Indonesia [24]. Wong et al. evaluated thermal comfort in naturally ventilated public housing in Singapore [25]. Bhikhoo et al. explored passive design strategies to improve thermal comfort in low-income housing in Thailand. The study concluded that comfort can be increased by insulating roofs and adding balconies [26].
The above literature shows that there is a wide knowledge gap regarding housing and comfort in Pakistan. Hence, this study aims to improve indoor thermal comfort in common buildings in Quetta and raise awareness of climate sensitivity. The following objectives are set for this study: (1) investigation of indoor thermal comfort in existing houses and (2) identification of possible measures for the improvement of indoor thermal comfort. The paper presents the background of the study and an introduction of the study area and highlights the aim, objectives, and impact of this study. It further focuses on a literature review, reference case selection, measurements, building modelling and calibration to validate the measured and simulated data as well as parametric simulation and analysis. Comparison of four different comfort models was done to select the best fit-to-context comfort model for the climate of Quetta. The potential of bioclimatic design strategies is analyzed and the results of each strategy with the percentage of comfort improvement are presented. Finally, recommendations for future work are outlined.
With the improvement of socioeconomic conditions, it is expected that awareness regarding comfort and the need for active cooling and heating demand will increase. In this context, this study provides unique guidance for designers, builders, and owners to design and operate healthy and energy-efficient buildings. The added value of this work is not only to address issues in Quetta but to extend the results to several cities of Balochistan Province since Pakistan has a variety of climatic conditions from its north to its south; the proposed strategies are context-specific and cannot be used in other regions of the country without further investigation.
2. Methodology
A conceptual framework of study was developed that summarizes and visualizes the research methodology of this paper. As shown in Figure 1, the conceptual study framework is based on six axes which will be described in the following sections.
2.1. Reference Case Selection
A housing survey was conducted in order to identify the characteristics of existing housing in Quetta. The survey included questions on characteristics of the households (socio-demographics and household size, etc.), housing characteristics, main materials and construction type, energy, water, and waste profiling, etc. In total, 215 houses were surveyed in 32 residential areas of Quetta. Questionnaires were filled and plans were drawn by the survey team. It was found that majority of the houses (64%) were constructed using the same building materials and construction techniques. This type of house is generally called a reinforced concrete frame (RCF) house [27,28]. RCF houses are wide-spread and the most acceptable typology in Quetta as well as in other areas of Pakistan. It was also identified through the survey that most of the houses (48%) are single-storey houses with one or more families living in the same house. It was observed that passive design measures and use of insulation for comfort are uncommon in Quetta. The residents mainly rely on fans and personalized heating and cooling units for indoor thermal comfort. Considering this situation, a representative single-storey RCF house was selected for this study based on the most common typology, construction techniques, building materials, and characteristics of the households.
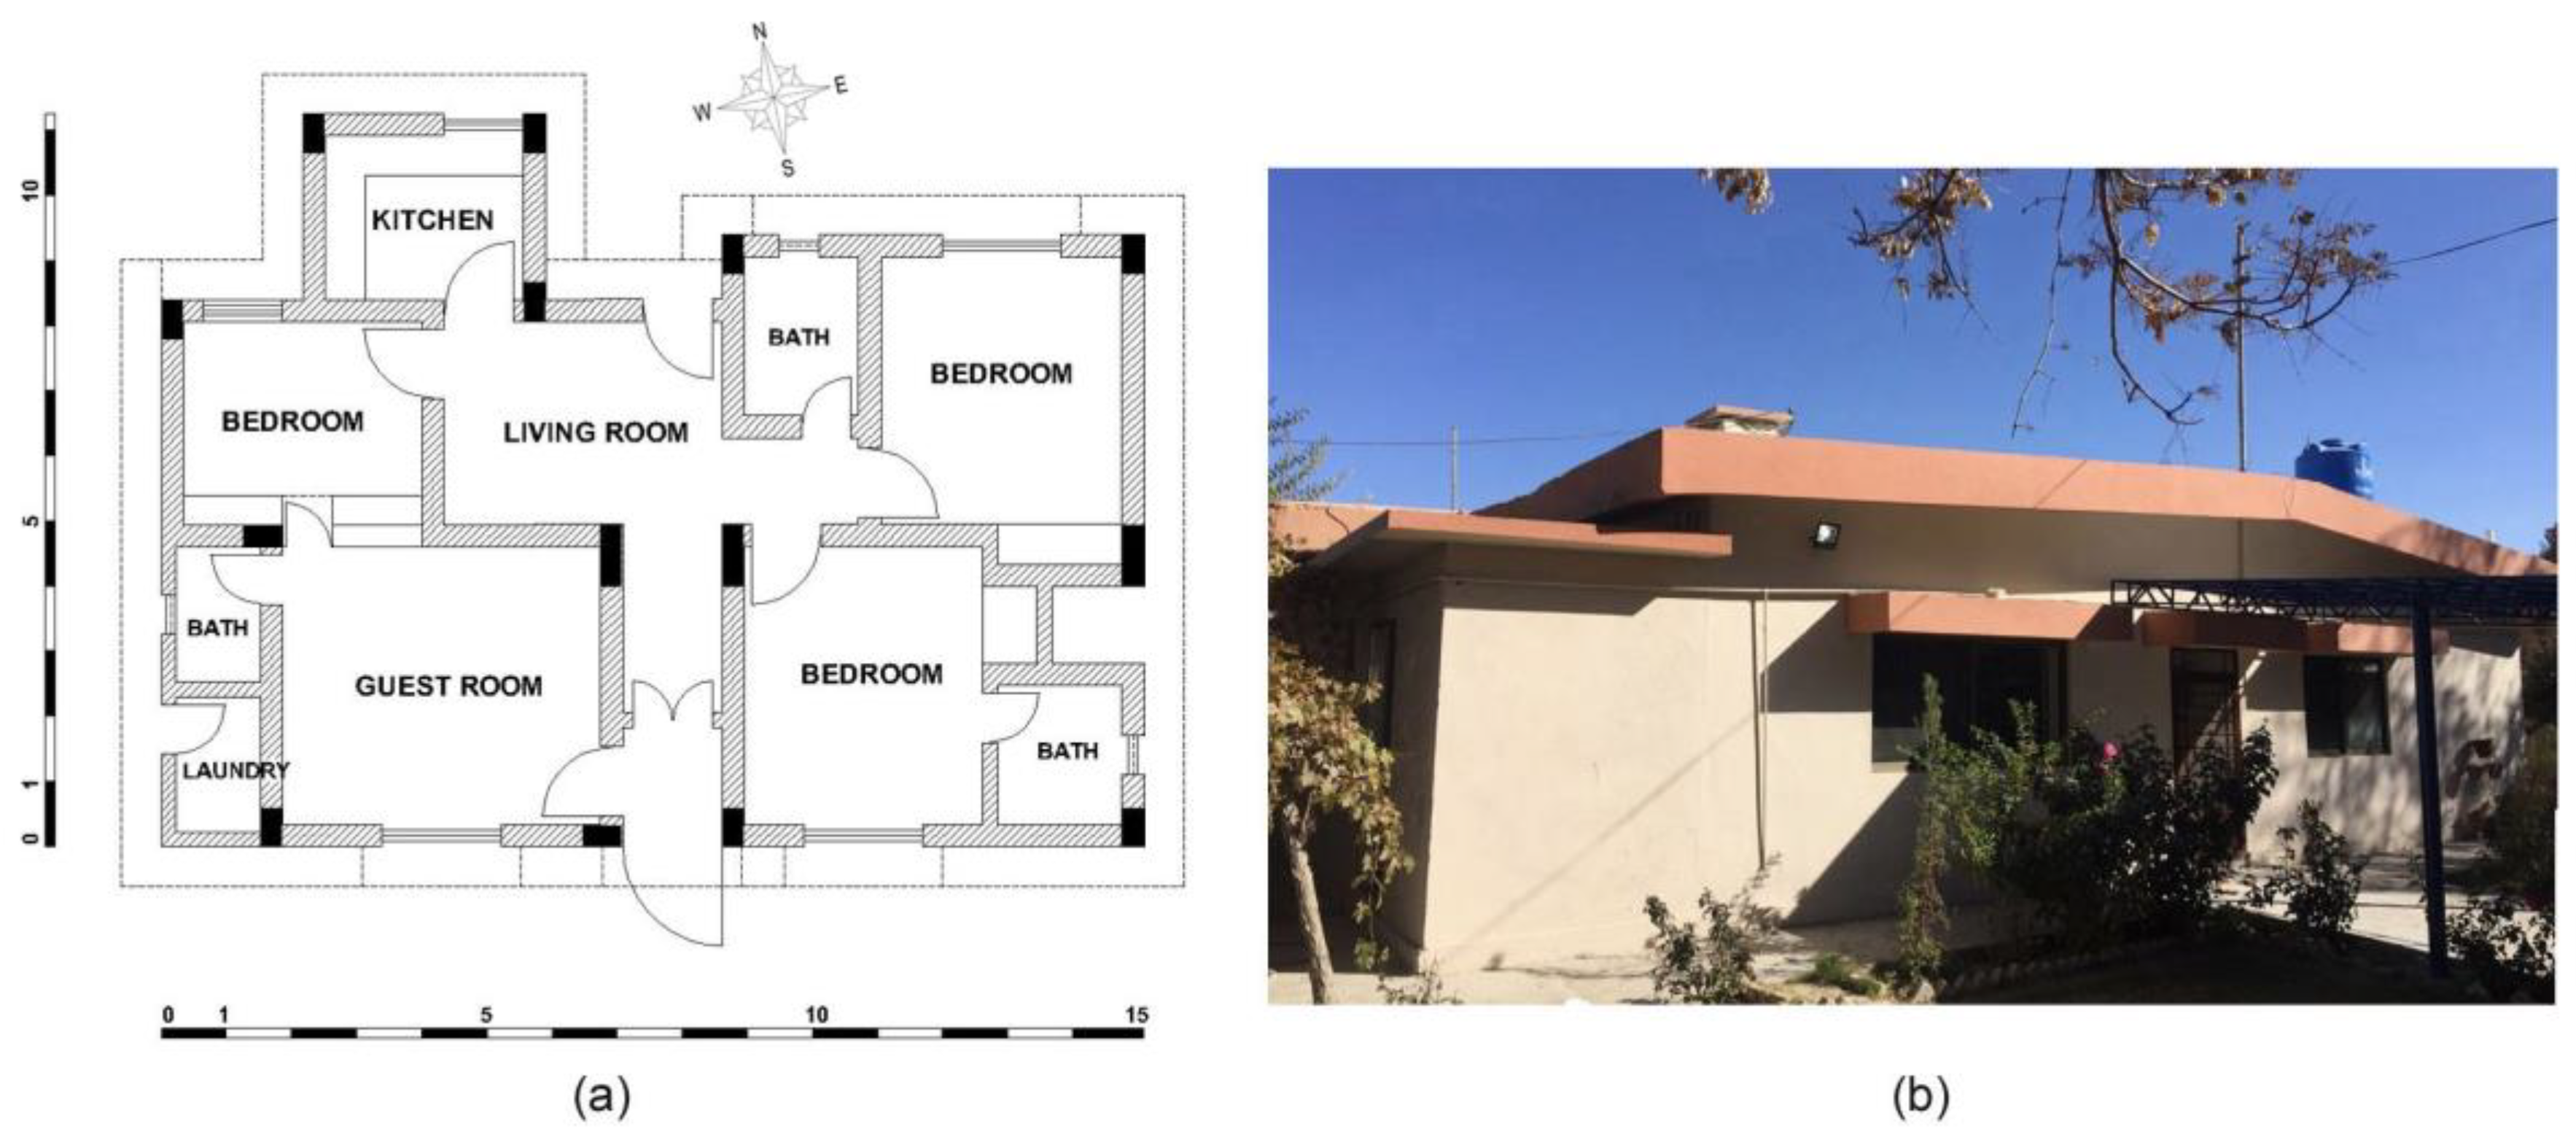
The selected reference case house is a detached single-storey house located in the north of Quetta city. This house was constructed in the late 1980s and renovated in 2017. The family consists of eight members and the house was occupied during the monitoring period. The covered area of the house is 112.6 m2 and consists of three bedrooms, a living room, a guest room, bathrooms, and a kitchen. The plan and the front view of the selected house are presented in Figure 2a,b. The selected reference case is a hybrid building, where radiant gas heaters are used for personalized heating and only the bedrooms and living room are heated. The reference case uses single glazed windows, a reinforced cement concrete (RCC) roof, and a plain cement concrete (PCC) floor, which is similar to the majority of the houses which use the RCF system [27,28]. Further descriptions of the reference case are given in Section 2.3 and Table 2.
2.2. Measurements
For this study, indoor air temperature and relative humidity were monitored simultaneously in one bedroom and the living room. Previous studies confirm that the living room or bedroom of a house can be selected as representative of the whole building. Colton et al. used the measurements taken in the main living space of an apartment as representative of the whole apartment [29]. In another study, the measurements taken in living and bedrooms of apartments were considered representative for the assessment of each apartment [30]. Therefore, the measurements done in the living room of the reference case were considered representative and were used for calibration purposes. The weather data of Quetta Weather Station was initially obtained from the Pakistan Meteorological Department (PMD). Later, this data was found inappropriate to be used for simulation. Therefore, an extrapolated weather file of Quetta was used for simulation. The temperature and humidity were monitored using a HOBO U12-012 data logger. This was a four-channel data logger with 12-bit resolution. The same equipment has been used in scientific studies performed previously [31,32,33,34]. The monitoring was done in both summer and winter for four weeks in each season, i.e., from 27th July to 23th August 2017 and 28th December 2017 to 24th January 2018. The data loggers were kept at the center of the spaces and at a height of 1.4 m to avoid any errors in measurements due to radiation from the floor and surrounding surfaces.
In addition, airflow and carbon dioxide concentration were also monitored as a part of our field study. A Testo-405 thermal anemometer was used to measure air velocity and a Testo 160 IAQ was used to measure carbon dioxide concentration. The average measured airflow was always below 0.3 m/sec, which we found significant. Hence, we included an air speed of 0.3 m/sec in all our calculations. However, this study does not focus on indoor air quality.
Table 1 presents the clothing and metabolism values calculated based on the field study. For simplification we used clothing levels of 0.4 clo for summer, 0.7 clo for winter, and a metabolism value of 0.9, rather than specifying separate values based on age and gender. Besides, local discomfort was not identified during this study due to the use of personalized heating or cooling equipment. The influence of clothing and level of metabolism did not affect the comfort calculations significantly.
2.3. Building Simulation and Modelling
A survey questionnaire was filled to collect the input data from the occupants of the house and a semi-structured interview was conducted with the head of the household to obtain more details of the various necessary inputs, such as household size; actual drawings; details of construction techniques; materials, their thermo-physical properties; and various schedules based on the occupants behaviour and occupancy, etc. The data collection included specific information related to comfort during summer and winter (clothing, activity, food type and adaptive behaviour). Input data and schedules used for the building simulation and modelling are presented in Table 2 and Appendix A and Appendix B. A few of the thermal properties of building materials used in the simulation model are based on the previous work of Saeed et al. [35] and Shaheen et al. [36]. The EnergyPlus simulation program developed by the Department of Energy of the United States was used for building simulation given its suitability and robustness [37]. A virtual model of the actual house (reference case) was created based on the actual measurements, sizes, schedules, and specification of materials which reflects the reality.
2.4. Calibration of the Simulation Model
The simulated data was calibrated by comparing with the measured data to create conditions which were most suitable for the actual measurements. The calibration method used included several steps based on the ASHRAE Standard 140-2017 and in line with previously published studies [21,38,39,40]. Firstly, to create a suitable weather input, site-specific hourly data from a baseline period had to be collected. Secondly, weather data was to be joined into a single data file for use with the EnergyPlus simulation program. However, the weather data obtained from the Pakistan Meteorological Department (PMD) was found inappropriate to be used for the simulation. Therefore, an extrapolated weather file of Quetta was used. Thirdly, all the construction and architectural details collected during the site visit were carefully entered in the simulation program. Then, the simulation was performed, and the results were extracted and compared with measured values. A graphical representation of the calibrated data was used to analyze the difference between measured and simulated data and some appropriate modifications to the model were applied. A manual calibration method was used together with statistical approaches and methods, such as the normalized mean bias error (NMBE) and coefficient of variation of root square mean error (CV(RMSE)), as reliable measures to verify the calibration. Another method used for the calibration, linear regression analysis, was used to graphically assess the accuracy and correlation; this is presented in Section 3.1.
Normalized Mean Bias Error
Coefficient of Variation of Root Square Mean Error
In the above equations, Equations (1) and (2), Np is the total number of data values, Mi (where i = 1, 2 … Np) represents the measured data, and Si (where i = 1, 2 … Np) represents the simulated data. Using these equations, a simulated model is considered calibrated when NMBE is not larger than 10% and CV(RMSE) is not larger than 30% when hourly data are used for the calibration. In this research, hourly data were used for the calibration of the simulation model.
2.5. Comfort Model and Parametric Analysis
Three actions took place at this stage: (1) selection of the comfort model, (2) sensitivity analysis, and (3) an optimized simulation model based on the results of the parametric analysis. Four comfort models were compared using the climate of Quetta, namely Fanger’s model [41] as implemented in ISO 7730 [42], the American adaptive comfort model as mentioned in ASHRAE 55 [43], the European adaptive comfort model as reported in EN 16798-1 [44], and Givoni’s model [45]. Similar to the work of Attia et al. [46], the results of the comparison allowed for the selection of the best fit-to-context model.
Firstly, the steady-state models were avoided since they neglect the effect of humidity adaptation by people and because residential and hybrid buildings are often not in a steady-state condition. Secondly, Givoni’s model was reviewed; the model proposes 30 °C and 90% relative humidity and up to 32 °C and 93% relative humidity [45]. It was found that in the dry semi-arid climate of Quetta the percentage of relative humidity remains lower than the proposed limits. Nevertheless, this study is based on small scale field surveys to justify the proposed comfort zone limits. Therefore, the ASHRAE Standard 55 adaptive comfort model was selected as it focuses on temperature rather than relative humidity. It was also found that Pakistan follows ASHRAE standards and that the existing Building Code of Pakistan (Energy Provisions-2011) is also based on ASHRAE standards [8,47].
Then, a whole year simulation was performed considering heating and without heating scenarios. In the first scenario, the existing heating units were kept on in living room and bedrooms during winter period while in second scenario heating units were kept off in all zones round the year. The most suitable comfort model was used to classify comfort hours in the reference case. Furthermore, all possible orientations were analyzed to find out which was the most ideal building orientation for the reference case. Lastly, a parametric analysis was performed by applying architectural strategies to improve comfort hours in the selected house.
2.6. Bioclimatic Design Strategies Analysis
Psychometric charts can be difficult to understand for many architects, and therefore, a simplified chart for climate analysis was used [48,49,50,51]. The chart of DeKay and Brown was used to visualize the results of the potential of bioclimatic design strategies based on the simulation results. The results are integrated with DeKay and Brown’s chart [52] to quantify the potential of bioclimatic design strategies for the improvement of thermal comfort.
3. Results
3.1. Validation of Calibration of the Simulation Model
The simulation model was calibrated for two important seasons, i.e., summer and winter. Manual calibration was selected as a method of calibration and several iterations were run for this purpose. The simulated results were matched with the monitored indoor air temperatures. Furthermore, the NMBE and CV(RMSE) equations were applied for the calibration, considering the allowable limits to satisfy both equations. In order to assess the accuracy and correlation of the calibration, linear regression analysis was performed. The correlation coefficient (R2) of the final prediction versus measurements of 0.843 in summer and 0.941 in winter was considered satisfactory to verify the calibration of the simulation model. Table 3 and Figure 3a,b and Figure 4a,b summarize and present the calibration of the simulation model for both summer and winter seasons.
3.2. Comfort Model and Parametric Analysis
The results of comparing four different comfort models can be found in Figure 5. The outdoor air temperature of the whole year is presented together with the comfort ranges of each comfort model. Fanger found that the optimal operative temperature, which satisfies most people at a given clothing and activity, ranges between 18 °C and 22 °C [41]. The temperature range in the adaptive comfort model-EN 16798-1 ranges between 29 °C in summer and 20 °C in winter; these temperatures are not suitable comfort temperatures for the climate of Quetta. Givoni’s bioclimatic model ranges 30–32°C with a relative humidity of 90–93%. Since the climate of Quetta is semi-dry and arid these ranges will not provide comfortable indoor conditions. However, the ASHRAE 55 adaptive comfort model presents comfort temperatures ranging between 22 °C in winter to 26 °C in summer with respect to the outdoor temperature. Hence, this model was found to be most suitable for the climate of Quetta.
A whole year simulation was performed to identify comfort hours using the ASHRAE-55 adaptive comfort model. This model was found to be suitable for the climate of Quetta as it focuses on temperature and considers allowable humidity of up to 100%. Figure 6a,b present the comfort hours in the reference case with heating (42.9%) and without heating (38.7%). This shows that the existing heating equipment is unable to provide optimal thermal comfort, which leads to the adaptive measures of comfort, which have been previously discussed by Mahar et al. [14]. The calculated comfort percentage was taken from the number of hours which fall under the 90% limit of the ASHRAE-55 adaptive comfort model [43].
3.2.1. Effect of the Orientation
Thermal comfort of a building also depends on its orientation. In order to find out the best possible orientation of the reference case, eight possible orientations were assumed. Figure 7 and Table 4 present the possible orientations for the selected reference case and the percentage of comfort hours for each orientation. It was found that the existing orientation of the reference case, i.e., south, is the best possible orientation for more comfort hours throughout the year.
3.2.2. Effect of Other Strategies Compared with the Reference Case
Some architectural strategies were used, and their effectiveness was examined in terms of thermal comfort. These strategies include thermal mass, insulation materials, ventilation, and changing thermal properties of the materials etc. The description of each strategy together with the corresponding comfort improvement is given in Table 5.
By applying the above strategies, comfort improvement was noticed in Cases C (1.4%), D (10.7%), and E (2.2%). Therefore, these strategies were combined for comfort improvement as shown in Cases F (13.2%) and G (14.6%). In Case H, a combination of strategies used in Cases C, D, and E, were applied together with full day ventilation in summer. The results showed the improvement of indoor thermal comfort from 42.9% to 58.5%, i.e., an increase of 15.6%, which is also presented in Figure 8.
3.3. Bioclimatic Design Strategies Analysis
DeKay and Brown’s chart [52] was used to further explore the potential for various bioclimatic design strategies. The aim was to avoid the use of psychometric charts, which are difficult to understand for many architects [48,53]. The potential of bioclimatic design strategies based on the climate of Quetta is illustrated in Figure 9. It can be seen that high thermal mass and passive solar heating can significantly improve comfort in winter. Shading, natural ventilation, and humidification are more important in summer.
Results from the optimized model (i.e., Figure 8) were plotted on DeKay and Brown’s chart. Table 6 presents the quantified values of each bioclimatic design strategy, the number of effective hours, and the comfort percentage, in a year. It was concluded that bioclimatic strategies such as passive solar heating (38.6%), shading (17.5%), high thermal mass (10.6%), natural ventilation (7.8%), and humidification (23%) can be used in the climate of Quetta. However, the effects of the combination of two or more strategies are not explored in this study.
4. Discussion
The findings of this study are discussed further in three sub-sections which include the main findings and recommendations, strengths and limitations of the study, and study implications and future research.
4.1. Main Findings and Recommendations
For this study, a reference case model was created using a representative typology. The indoor climate was monitored, and a virtual model was created, simulated, calibrated, and optimized using parametric analysis. Furthermore, the potential of bioclimatic design strategies was discovered using DeKay and Brown’s chart [52]. The results show that up to 59% of annual comfort hours (with the existing heating system) can be achieved using passive design strategies and without additional mechanical systems.
Since there are no thermal comfort models for Pakistan, four different comfort models were compared, and it was found that the ASHRAE-55 adaptive comfort model is the best fit-to-context thermal comfort model for Quetta. The potential of various bioclimatic design strategies was explored and quantified as shown in Figure 9 and Table 6. The bioclimatic analysis indicates that passive design strategies, such as passive solar heating, shading, high thermal mass, natural ventilation, and humidification, can be useful in the climate of Quetta if buildings are designed and constructed properly.
4.2. Strengths and Limitations of the Study
The strengths of this study relate to combining real monitoring datasets with an advanced building performance simulation. The study used high-quality data gathered through monitoring, questionnaires, on-site visits, and semi-structured interviews with the residents. The calibration techniques applied, follow state-of-the-art methods and are similar to the work of Nguyen et al. [21] and Fabrizio et al. [39].
This is the first study that investigates thermal comfort of buildings in the context of Quetta and Pakistan. This is in contrast to previous work (i.e., that by Nicol et al. [6], Mahar et al. [13,14], and Khan [15]) which has only focused on surveys and monitoring of indoor climate in residential and office buildings.
DeKay and Brown’s chart was used to identify and quantify the potential of bioclimatic design strategies in Quetta, taking into account the buildings’ performance. This method was also used by Attia et al. [48] and Roshan et al. [53]. DeKay and Brown’s chart simplifies the potential of various bioclimatic design strategies for the better understanding of architects compared to complex psychometric charts.
Additionally, four different comfort models were tested to identify the best-fit-context comfort model for the climate of Quetta. This was also important as there has been no comfort model previously used or adopted for Pakistan. The ASHRAE-55 adaptive comfort model was found to be the best comfort model for the climate of Quetta, which is a dry and heating-dominated climate.
On the other hand, this study has some limitations. It only focuses on one single building typology using a manual calibration method. More importantly, the study did not investigate the combined effects of different passive design measures. Therefore, further research should explore wider solution spaces and reduce study uncertainty.
4.3. Study Implications and Future Research
This study raises awareness regarding thermal comfort and allows for architects and building designers to inform their decision-making regarding design priorities and design strategy effectiveness. The study findings are helpful to create a new design guide for bioclimatic design in Quetta. In the long term, the presented results can further lead to the creation of an energy-efficiency code for Quetta city. Legislation must force permits and code-compliance certifications for renovation as well as new constructions to improve thermal comfort and energy efficiency in building stock.
Also, we should emphasize that the building construction quality of most residential houses in Quetta is poor from a thermal performance point of view. The construction market lacks the knowledge and materials to build good performing buildings. The Pakistani supply chain for green or energy-efficient construction materials and products is vacant. At the same time, our study proves that there is a very high potential to achieve good thermal comfort in dwellings by applying simple passive design measures combined with high-quality construction techniques. Our characterization of Quetta’s climate and the simulation of our case study confirm that basic thermal and solar control strategies, airtightness, and passive cooling strategies can significantly improve comfort. Therefore, future research should look at the materialization of strategies into solutions using affordable construction techniques and local materials. This can encourage developing design and construction methodologies and prototypes that can lead the transition of building stock towards being sustainable and energy-efficient.
We believe that the methodology used in this study can be transferred to other areas of Pakistan to investigate the most suitable design strategies to improve thermal comfort in different climatic zones of the country. Future research should focus on sensitivity analysis and multi-objective optimization combining comfort with cost, energy-efficiency, and carbon emissions, etc., to obtain optimal solutions for newly constructed residential buildings in Quetta.
5. Conclusions
This study aimed to investigate the potential for the improvement of indoor thermal comfort in the most common housing typology in Quetta, Pakistan. The findings are not only valuable for improving comfort in the existing building, but they can be more effective in informing designers and homeowners of new constructions.
The results confirm that adopting passive design strategies may lead to up to 59% of comfort hours (with the existing heating system) without adding other mechanical solutions, which can be explored later to achieve maximum comfort throughout the year. The climate of Quetta is heating-dominant; therefore, passive solar heating and insulation are the most important design strategies. Hence, the focus should mainly remain on comfort in the cold season. The study concludes that the ASHRAE-55 adaptive comfort model is the best fit-to-context thermal comfort model for the climate of Quetta.
Given the geographic and climatic particularity of Quetta, since it is located at a high altitude and has its own micro-climate, this is the first study that investigates thermal comfort based on local and universal knowledge. In this study, a mixed study approach was used that allowed for the verification of the climatic, physical, and behavioral reality of housing in Quetta. An advanced simulation approach was used to test and validate design recommendations for future designers. The paper provides insights for local practitioners and sheds light on the best design practices for the climate of Quetta. This study allows future researchers to go one step further and investigate solutions and technologies to achieve maximum comfort throughout the year using passive design strategies.
The following recommendations are given based on the investigation of this study for the improvement of thermal comfort in houses. The findings of this study prove that thermal comfort can be improved using passive and bioclimatic design strategies.
- (1)
- High thermal mass, passive solar heating, and insulation are recommended in the climate of Quetta for the improvement of thermal comfort, particularly in the winter season.
- (2)
- Shading, natural ventilation, and humidification will increase comfort in summer when the humidity level is very low.
- (3)
- Behavioural adaptation such as opening windows and using fans can improve comfort.
- (4)
- The ASHRAE-55 adaptive comfort model is the best fit-to-context comfort model for the climate of Quetta.
- (5)
- Passive design measures can improve comfort; however, there will be a need for an efficient active system to achieve better comfort conditions.
Author Contributions
Conceptualization, W.A.M., S.A., and G.V.; methodology, W.A.M., S.A., G.V., and M.K.S.; software, W.A.M.; validation, W.A.M. and S.A.; formal analysis, W.A.M.; investigation, W.A.M.; resources, W.A.M., S.A., and G.V.; data curation, W.A.M.; writing—original draft preparation, W.A.M.; writing—review and editing, W.A.M., S.A., G.V., and M.K.S.; visualization, W.A.M.; supervision, S.A. and G.V.; project administration, W.A.M. and S.A.; funding acquisition, W.A.M. and S.A.
Funding
The authors acknowledge the Higher Education Commission (HEC) of Pakistan for providing necessary funds and resources for the completion of the Ph.D. studies of the first author under the HRDI-UESTP Program Batch-IV with the ref. no. 50027882. This article is published with the financial support of the Fond de la Recherche Scientifique (FNRS).
Acknowledgments
The authors would like to thank Ahmad farooq Bazai, S.I. (Vice-Chancellor), and the staff and students of Balochistan University of Information Technology, Engineering and Management Sciences (BUITEMS) Quetta, for their participation and assistance in data collection. We would also like to acknowledge the Sustainable Building Design (SBD) lab for the access to the dataset and the use of monitoring equipment in this research and valuable support during the experiments and the analysis of data.
Conflicts of Interest
The authors declare no conflict of interest. The funders had no role in the design of the study; in the collection, analyses, or interpretation of data; in the writing of the manuscript, or in the decision to publish the results.
Appendix A. Thermal Zones and Thermal Properties of Building Materials (Reference Case)

Table A1.
Description of zones.
| Zone | Surface (m2) | Volume (m3) | Zone | Surface (m2) | Volume (m3) |
|---|---|---|---|---|---|
| Master bed | 15.6 | 47.24 | Bedroom 1 | 11.42 | 34.71 |
| Kid’s room | 15.36 | 46.69 | Guest room | 20.81 | 63.26 |
| Living room | 13.33 | 40.52 | Kitchen | 7.66 | 23.28 |
| Toilet 1 | 4.06 | 12.34 | Toilet 2 | 4.27 | 12.98 |
| Toilet 3 | 2.66 | 8.08 | Laundry | 2.66 | 8.08 |
Table A2.
Thermal properties of building materials. Legend: RCC, reinforced cement concrete.
| Building Element Composition | Thickness (cm) | Conductivity (W/m K) | Density (kg/m3) | Specific Heat Capacity (Wh/kg K) |
|---|---|---|---|---|
| Ep | λ | D | Cp | |
| Walls (3 layers) | ||||
| Plaster | 0.95 | 0.431 | 1250 | 1088 |
| Brick | 22.86 | 0.711 | 2000 | 836 |
| Plaster | 0.95 | 0.431 | 1250 | 1088 |
| Ceiling (4 layers) | ||||
| Plaster | 0.95 | 0.38 | 1150 | 840 |
| Bitumen | 0.95 | 0.5 | 1700 | 1000 |
| RCC slab | 10.16 | 0.753 | 2300 | 665.9 |
| Plaster | 0.95 | 0.38 | 1150 | 840 |
| Floor | ||||
| Cement mortar | 0.95 | 0.72 | 1650 | 920 |
| Concrete | 5.08 | 0.753 | 2000 | 656 |
| Aggregate | 7.62 | 1.8 | 2240 | 840 |
| Sand | 10.16 | 1.74 | 2240 | 840 |
| Earth/soil | 22.86 | 0.837 | 1300 | 1046 |
| Windows (single glazed) with clear glass | 0.63 | 1.046 | 2300 | 836.8 |
Appendix B. Lighting, Domestic Hot Water, and Occupancy Schedules (Reference Case)
Figure A1.
Lighting schedule of bedrooms.

Figure A2.
Lighting schedule of living room.

Figure A3.
Domestic hot water schedule.

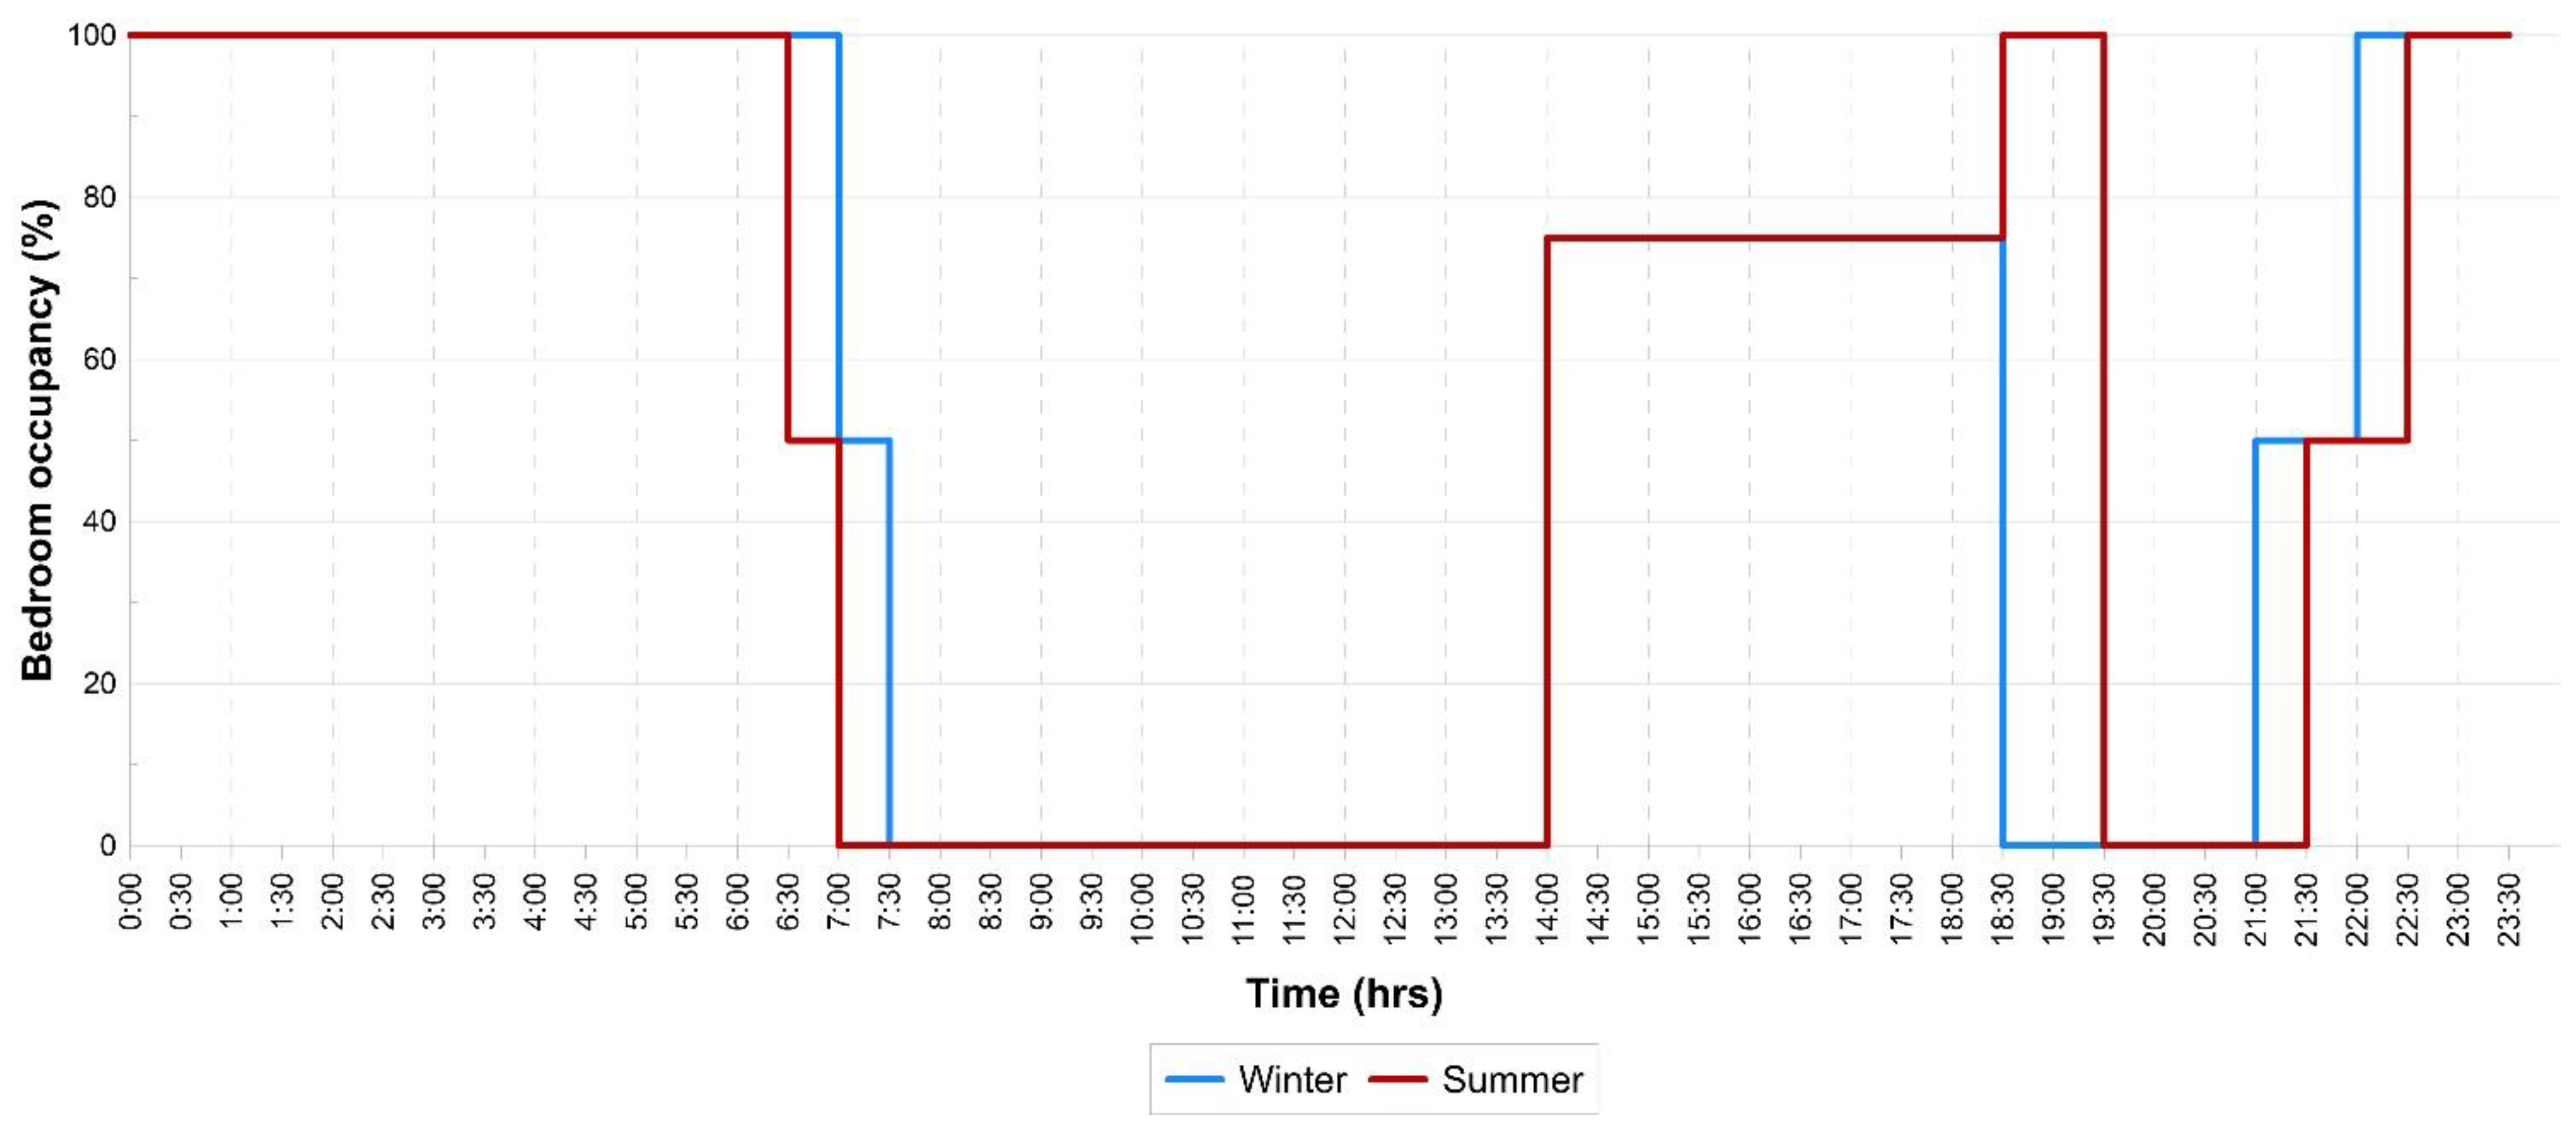
Figure A4.
Bedroom occupancy schedule.

Figure A5.
Living room occupancy schedule.

References
- Population & Housing Census. Pakistan Bureau of Statistics (PBS); Government of Pakistan: Islamabad, Pakistan, 2017.
- Kugelman, M. Urbanisation in Pakistan: Causes and Consequences; Norwegian Peacebuilding Resource Centre: Oslo, Norway, 2013. [Google Scholar]
- State Bank of Pakistan. Diagnostic Survey of Housing Finance in Pakistan; Final Report; The World Bank: Washington, DC, USA, 2015. [Google Scholar]
- Shaikh, H. Housing Inequality in Pakistan: The Case of Affordable Housing; International Growth Centre: London, UK, 2016. [Google Scholar]
- Pakistan Housing Finance Project; The World Bank: Washington, DC, USA, 2017.
- Nicol, J.F.; Raja, I.A.; Allaudin, A.; Jamy, G.N. Climatic variations in comfortable temperatures: The Pakistan projects. Energy Build. 1999, 30, 261–279. [Google Scholar] [CrossRef]
- Distribution Firms Suffer 18.3pc Line Losses This Year. Available online: https://www.dawn.com/news/1460225 (accessed on 28 January 2019).
- Mahar, W.A.; Anwar, N.U.R.; Attia, S. Building energy efficiency policies and practices in Pakistan: A literature review. In Proceedings of the 5th International Conference on Energy, Environment & Sustainable Development (EESD), Jamshoro, Pakistan, 14–16 November 2018. [Google Scholar]
- Finance Division, Government of Pakistan. Pakistan Economic Survey 2018–19; Ministry of Finance, Government of Pakistan: Islamabad, Pakistan, 2019.
- Kiani, K. New Gas Price, Pressure Factor Causing Unrest among Consumers. Available online: https://www.dawn.com/news/1462096 (accessed on 27 May 2019).
- Quetta District Development Profile. Planning & Development Department; Government of Balochistan: Quetta, Pakistan, 2011.
- Quetta Historical Temperature Data. Pakistan Meteorological Department. Available online: http://www.pmd.gov.pk/cdpc/extrems/QUETTA.htm (accessed on 27 May 2019).
- Mahar, W.A.; Amer, M.; Attia, S. Indoor thermal comfort assessment of residential building stock in Quetta, Pakistan. In Proceedings of the European Network for Housing Research (ENHR) Annual Conference 2018, Uppsala, Sweden, 27–29 June 2018. [Google Scholar]
- Mahar, W.A.; Attia, S. Indoor Thermal Comfort in Residential Building Stock: A Study of RCC Houses in Quetta, Pakistan; Sustainable Building Design (SBD) Lab, University of Liège: Liege, Belgium, 2018. [Google Scholar]
- Khan, S.M. Traditional havelis and sustainable thermal comfort. Int. J. Environ. Stud. 2016, 73, 573–583. [Google Scholar] [CrossRef]
- Ahmad, M.H.; Rashid, R. Thermal Comfort of Bangladesh Traditional House In A High Density Environment with the Worst Surroundings Condition in Dhaka City: A case study at a Bangladesh Traditional House at Gulshan in Dhaka City. In Proceedings of the Conference on Technology and Sustainability in the Built Environment (TSBE), Riyadh, Saudi Arabia, 3–6 January 2010. [Google Scholar]
- Singh, M.K.; Mahapatra, S.; Atreya, S.K. Thermal performance study and evaluation of comfort temperatures in vernacular buildings of North-East India. Build. Environ. 2010, 45, 320–329. [Google Scholar] [CrossRef]
- Singh, M.K.; Ooka, R.; Rijal, H.B.; Mahapatra, S. Building simulation based study to improve thermal performance of a traditional residential house. In Proceedings of the 5th International Conference on Human-Environment System (ICHES) 2016, Nagoya, Japan, 29 October–2 November 2016; pp. 1–10. [Google Scholar]
- Singh, M.K.; Ooka, R.; Rijal, H.B.; Bansal, N.K. The Effect of Cool Roof on Built Environment in Composite and Hot and Dry Climates of India. In Proceedings of the Society of Heating, Air conditioning and Sanitary Engineers of Japan (SHASE), Annual Conference, Kagoshima, Japan, 14–16 September 2016; pp. 73–76. [Google Scholar]
- Nguyen, A.T.; Singh, M.K.; Reiter, S. An adaptive thermal comfort model for hot humid South-East Asia. Build. Environ. 2012, 56, 291–300. [Google Scholar] [CrossRef] [Green Version]
- Nguyen, A.T.; Reiter, S. An investigation on thermal performance of a low-cost apartment in hot humid climate of Danang. Energy Build. 2012, 47, 237–246. [Google Scholar] [CrossRef]
- Toe, D.H.C. Application of Passive Cooling Techniques to Improve Indoor Thermal Comfort of Modern Urban Houses in Hot-Humid Climate of Malaysia. Hiroshima University Institutional Repository. Available online: http://ir.lib.hiroshima-u.ac.jp/00035149 (accessed on 27 May 2019).
- Nugroho, A.M.; Ahmad, M.H.; Ossen, D.R. A preliminary study of thermal comfort in single storey terraced houses in Malaysia. J. Asian Archit. Build. Eng. 2007, 6, 175–182. [Google Scholar] [CrossRef]
- Feriadi, H.; Wong, N.H. Thermal comfort for naturally ventilated houses in Indonesia. Energy Build. 2004, 36, 614–626. [Google Scholar] [CrossRef]
- Wong, N.H.; Feriadi, H.; Lim, P.Y.; Tham, K.W.; Sekhar, C.; Cheong, K.W. Thermal comfort evaluation of naturally ventilated public housing in Singapore. Build. Environ. 2002, 37, 1267–1277. [Google Scholar] [CrossRef]
- Bhikhoo, N.; Hashemi, A.; Cruickshank, H. Improving thermal comfort of low-income housing in Thailand through passive design strategies. Sustainability 2017, 9, 1440. [Google Scholar] [CrossRef]
- Mahar, W.A.; Knapen, E.; Verbeeck, G. Methodology to determine housing characteristics in less developed areas in developing countries: A case study of Quetta, Pakistan. In Proceedings of the European Network for Housing Research (ENHR) Annual Conference 2017, Tirana, Albania, 4–6 September 2017. [Google Scholar]
- Mahar, W.A.; Attia, S. An Overview of Housing Conditions, Characteristics and Existing Infrastructure of Energy, Water & Waste Systems in Quetta, Pakistan; Sustainable Building Design (SBD) Lab, University of Liège: Liege, Belgium, 2018. [Google Scholar]
- Colton, M.D.; MacNaughton, P.; Vallarino, J.; Kane, J.; Bennett-Fripp, M.; Spengler, J.D.; Adamkiewicz, G. Indoor air quality in green vs conventional multifamily low-income housing. Environ. Sci. Technol. 2014, 48, 7833–7841. [Google Scholar] [CrossRef]
- Lai, A.C.K.; Mui, K.W.; Wong, L.T.; Law, L.Y. An evaluation model for indoor environmental quality (IEQ) acceptance in residential buildings. Energy Build. 2009, 41, 930–936. [Google Scholar] [CrossRef]
- Kumar, S.; Singh, M.K. Field investigation on occupant’s thermal comfort and preferences in naturally ventilated multi-storey hostel buildings over two seasons in India. Build. Environ. 2019, 163, 106309. [Google Scholar] [CrossRef]
- Jack, N.; Yun, G.Y.; Kim, G. Prediction of indoor clothing insulation levels: A deep learning approach. Energy Build 2019, 202, 109402. [Google Scholar]
- Pingel, M.D.; Vardhan, V.; Manu, S.; Brager, G.; Rawal, R. A study of indoor thermal parameters for naturally ventilated occupied buildings in the warm-humid climate of southern India. Build. Environ. 2019, 151, 1–14. [Google Scholar] [CrossRef]
- Pathan, A.; Mavrogianni, A.; Summerfield, A.; Oreszczyn, T.; Davies, M. Monitoring summer indoor overheating in the London housing stock. Energy Build. 2017, 141, 361–378. [Google Scholar] [CrossRef]
- Saeed, F.; Ahmed, S.T.; Butt, A.Q. Simulation of electricity consumption for newly built residential buildings in Lahore. J. Res. Archit. Plan. 2013, 14, 55–60. [Google Scholar]
- Shaheen, N.; Arif, S.; Khan, A. Thermal performance of typical residential building in Karachi with different materials for construction. Mehran Univ. Res. J. Eng. Technol. 2015, 35, 189–198. [Google Scholar]
- Weytjens, L.; Attia, S.; Verbeeck, G.; Herde, A.D. The ‘Architect-friendliness’ of six building performance simulation tools: A comparative study. Int. J. Sustain. Build. Technol. Urban Dev. 2012, 2, 237–244. [Google Scholar] [CrossRef]
- ANSI/ASHRAE. Standard 140–2017—Standard Method of Test for the Evaluation of Building Energy Analysis Computer Programs; The American Society of Heating, Refrigerating and Air-Conditioning Engineers (ASHRAE): Atlanta, GA, USA, 2017. [Google Scholar]
- Pagliano, L.; Carlucci, S.; Causone, F.; Moazami, A.; Cattarin, G. Energy retrofit for a climate resilient child care centre. Energy Build. 2016, 127, 1117–1132. [Google Scholar] [CrossRef]
- Fabrizio, E.; Monetti, V. Methodologies and Advancements in the Calibration of Building Energy Models. Energies 2015, 8, 2548–2574. [Google Scholar] [CrossRef] [Green Version]
- Fanger, P.O. Thermal Comfort: Analysis and Applications in Environmental Engineering; Danish Technical Press: Copenhagen, Denmark, 1970. [Google Scholar]
- ISO. ISO 7730: Moderate Thermal Environments—Determination of the PMV and PPD Indices and Specification of the Conditions for Thermal Comfort; International Organization for Standardization: Geneva, Switzerland, 1994. [Google Scholar]
- ANSI/ASHRAE. Standard 55-2017—Thermal Environmental Conditions for Human Occupancy; ASHRAE: Atlanta, GA, USA, 2017. [Google Scholar]
- European Commission. EN 16798-1: 2009—Energy Performance of Buildings—Ventilation for Buildings; European Commission for Standardization: Geneva, Switzerland, 2009. [Google Scholar]
- Givoni, B. Man, Climate and Architecture; Elsevier: Amsterdam, The Netherlands, 1969. [Google Scholar]
- Attia, S.; Carlucci, S. Impact of different thermal comfort models on zero energy residential buildings in hot climate. Energy Build. 2015, 102, 117–128. [Google Scholar] [CrossRef] [Green Version]
- Building Code of Pakistan (Energy Provisions-2011); Pakistan Engineering Council (PEC); National Energy Conservation Centre (ENERCON); Ministry of Housing & Works: Islamabad, Pakistan, 2011.
- Attia, S.; Lacombe, T.; Rakotondramiarana, H.T.; Garde, F.; Roshan, G. Analysis tool for bioclimatic design strategies in hot humid climates. Sustain. Cities Soc. 2019, 45, 8–24. [Google Scholar] [CrossRef]
- Horan, P.; Luther, M.B. Using the psychrometric chart in building measurements. In Proceedings of the 44th Annual Conference of the Architectural Science Association, Auckland, New Zealand, 1–8 January 2010. [Google Scholar]
- Roshan, G.R.; Farrokhzad, M.; Attia, S. Defining thermal comfort boundaries for heating and cooling demand estimation in Iran’s urban settlements. Build. Environ. 2017, 121, 168–189. [Google Scholar] [CrossRef]
- Roshan, G.R.; Ghanghermeh, A.A.; Attia, S. Determining new threshold temperatures for cooling and heating degree day index of different climatic zones of Iran. Renew. Energy 2017, 101, 156–167. [Google Scholar] [CrossRef] [Green Version]
- DeKay, M.; Brown, G.Z. Sun, Wind, and Light: Architectural Design Strategies, 3rd ed.; John Wiley & Sons: Hoboken, NJ, USA, 2014. [Google Scholar]
- Roshan, G.; Oji, R.; Attia, S. Projecting the impact of climate change on design recommendations for residential buildings in Iran. Build. Environ. 2019, 155, 283–297. [Google Scholar] [CrossRef] [Green Version]
Figure 1.
Conceptual study framework.

Figure 2.
(a) Plan and (b) view of the reference case.

Figure 3.
Comparison between measured and simulated air temperatures during the monitoring period. (a) July 27th–August 23th, 2017; (b) December 28th, 2017–January 24th, 2018.
Figure 3.
Comparison between measured and simulated air temperatures during the monitoring period. (a) July 27th–August 23th, 2017; (b) December 28th, 2017–January 24th, 2018.

Figure 4.
(a,b). Linear regression analysis of calibration of simulation model for both summer and winter.
Figure 4.
(a,b). Linear regression analysis of calibration of simulation model for both summer and winter.

Figure 5.
Comparison of four comfort models for the climate of Quetta.

Figure 6.
(a) Comfort result and analysis of reference case (with heating). (b) Comfort result and analysis of reference case (without heating).
Figure 6.
(a) Comfort result and analysis of reference case (with heating). (b) Comfort result and analysis of reference case (without heating).

Figure 7.
Eight possible orientations of the same house.

Figure 8.
Comfort result and analysis of case H (a combination of all positive strategies).

Figure 9.
Bioclimatic design strategies using DeKay and Brown’s chart [52].
Figure 9.
Bioclimatic design strategies using DeKay and Brown’s chart [52].

Table 1.
The average clothing and metabolism values observed during the field study.
| Age ≤ 30 | 31 ≤ Age ≤ 50 | 51≤ | ||||
| Clothing | Male | Female | Male | Female | Male | Female |
| Summer | 0.3 clo | 0.5 clo | 0.5 clo | 0.5 clo | 0.5 clo | 0.6 clo |
| Winter | 0.8 clo | 0.8 clo | 0.8 clo | 0.8 clo | 0.8 clo | 0.9 clo |
| Metabolism | 3 | 2.6 | 2 | |||
Table 2.
Building description of the reference case (simulation model). Legend: LSGR, light to solar gain ratio; CCF, cent (100) cubic feet.
Table 2.
Building description of the reference case (simulation model). Legend: LSGR, light to solar gain ratio; CCF, cent (100) cubic feet.
| Model Input Measures | Value/Parameter(s) | |
|---|---|---|
| Envelope | Window-to-wall ratio (WWR) = (%) | 8.08S, 10.1N, 0.9EW |
| Openings (W/m2 K) | U = 5.7 | |
| Shading coefficient of glass (SC) | 0.7 | |
| Solar heat gain coefficient (SHGC) | 0.81 | |
| Light transmission (LT) | 0.88 | |
| LSGR (LT/SHGC) | 1.08 | |
| Overhangs, projection factor (PF) (S, N, EW) | 0.65, 0.81, 1.6 | |
| Wall = W/(m2 K) | U = 1.4 | |
| Wall surface absorptance, CCF | 0.6 | |
| Roof = W/(m2 K) | U = 2.9 | |
| Roof surface absorptance, CCF | 0.7 | |
| Heating and ventilation | Air tightness | 2.5 |
| Coefficient of performance (COP) | 0.85 | |
| Heating temperature set point (°C) | 23 | |
| Mechanical ventilation system | Not applicable | |
| Heating system (individual heaters) | Radiant gas heaters | |
| Heating fuel | Natural gas | |
| Daily operative hours for ventilation/heating | 12 h/day | |
| Air flow | 0.3 m/s | |
| Lighting | Installation power density (W/m2) living rooms | 20 |
| Lighting schedule | See Figure A1 and Figure A2 | |
| DHW | Period 1 (October–March) (l/m2/day) | 3.5 |
| Period 2 (April–September) (l/m2/day) | 1.2 | |
| Domestic Hot Water (DHW) schedule | See Figure A3 | |
| Occupancy | Household size | 8 persons |
| Area of the building | 112.6 m2 | |
| Density (persons/m2) | 0.07 | |
| Occupancy schedule | See Figure A4 and Figure A5 | |
| Total consumption | Average annual energy use | 49 kWh/m2 |
| Clothing/activity | Summer | 0.4 clo/1.2 |
| Winter | 0.7 clo/1.0 | |
| Metabolism level | 0.9 |
Table 3.
Validation summary of the calibration criteria of the simulation model. Legend: NMBE, normalized mean bias error; CV(RMSE), coefficient of variation of root square mean error.
Table 3.
Validation summary of the calibration criteria of the simulation model. Legend: NMBE, normalized mean bias error; CV(RMSE), coefficient of variation of root square mean error.
| Validation Criteria | Summer Indoor Air Temperature | Winter Indoor Air Temperature |
|---|---|---|
| NMBE (%) | 0.4 | 2 |
| CV(RMSE) (%) | 3 | 6 |
Table 4.
Comfort percentages of the same house with different possible orientations.
| Orientation | Result Comfort (%) | Comfort Improvement (%) |
|---|---|---|
| South | 42.9 | No |
| North | 41.2 | No |
| West | 42.3 | No |
| East | 42.5 | No |
| NW | 42.1 | No |
| NE | 42.5 | No |
| SW | 42.6 | No |
| SE | 42.8 | No |
Table 5.
Details of strategies used and their simulated performance.
| Strategies | Name | Description | Comfort Hours (%) | Comfort Improvement (%) |
|---|---|---|---|---|
| Thermal mass | Case A | The thickness of the external walls was doubled from 0.34 m to 0.6 m. This raised the thermal resistance from 0.69 to 1.17 m2 K/W. | 43.9 | Yes (1) |
| Low U-value windows | Case B | U-value of the external windows was reduced from 5.7 to 1.4 W/m2 K i.e., to double glazing. | 43.1 | Yes (0.2) |
| Low U-value windows | Case C | U-value of external windows was reduced from 5.7 to 0.7 W/m2 K i.e., to triple glazing. | 44.3 | Yes (1.4) |
| Low U-value roof | Case D | An insulated roof composed of asphalt and plasterboard. This raised the thermal resistance from 0.3 to 3.8 m2 K/W. | 53.6 | Yes (10.7) |
| Low U-value walls | Case E | Three layered external walls: concrete walls (0.1 m), R-13 mineral fiber insulation (0.1 m), and concrete walls (0.15 m). This raised the thermal resistance from 0.6 to 3.2 m2 K/W. | 45.1 | Yes (2.2) |
| Combination of strategies | Case F | Combination of Cases D and E. | 56.1 | Yes (13.2) |
| Combination of strategies | Case G | Combination of Cases C, D, and E. | 57.5 | Yes (14.6) |
| Combination of strategies and ventilation | Case H | Combination of Cases C, D, and E, and full day ventilation in summer. | 58.5 | Yes (15.6) |
Table 6.
Potential of bioclimatic design strategies based on Figure 9.
Table 6.
Potential of bioclimatic design strategies based on Figure 9.
| Principle | Strategy | Effective Hours (EH)* | Comfort (%) (EH/8760*100) |
|---|---|---|---|
| Comfort | 2340 | 26.7 | |
| Passive heating | Passive solar heating | 3390 | 38.6 |
| Solar control | Shading (orientation) | 1540 | 17.5 |
| Thermal control | High thermal mass | 930 | 10.6 |
| Passive cooling | Natural ventilation | 690 | 7.8 |
| Humidification | 2020 | 23 |
* In DeKay and Brown’s chart, the design strategies overlap, and therefore, the accumulated number of hours (percentage) exceed 8760 h (100%).
© 2019 by the authors. Licensee MDPI, Basel, Switzerland. This article is an open access article distributed under the terms and conditions of the Creative Commons Attribution (CC BY) license (http://creativecommons.org/licenses/by/4.0/).
Share and Cite
MDPI and ACS Style
Mahar, W.A.; Verbeeck, G.; Singh, M.K.; Attia, S. An Investigation of Thermal Comfort of Houses in Dry and Semi-Arid Climates of Quetta, Pakistan. Sustainability 2019, 11, 5203. https://doi.org/10.3390/su11195203
AMA Style
Mahar WA, Verbeeck G, Singh MK, Attia S. An Investigation of Thermal Comfort of Houses in Dry and Semi-Arid Climates of Quetta, Pakistan. Sustainability. 2019; 11(19):5203. https://doi.org/10.3390/su11195203
Chicago/Turabian StyleMahar, Waqas Ahmed, Griet Verbeeck, Manoj Kumar Singh, and Shady Attia. 2019. "An Investigation of Thermal Comfort of Houses in Dry and Semi-Arid Climates of Quetta, Pakistan" Sustainability 11, no. 19: 5203. https://doi.org/10.3390/su11195203
Note that from the first issue of 2016, this journal uses article numbers instead of page numbers. See further details here.