Empirical Examination of Intention to Continue to Use Smart Home Services


1
School of Business, Jinling Institute of Technology, Nanjing 211169, China
2
Electronic Commerce, Kongju National University, Kongju 32588, Korea
3
Xiamen Academy of Arts & Design, Fuzhou University, Xiamen 361000, China
4
Computer Science & Engineering, Kongju National University, Cheonan 31080, Korea
*
Authors to whom correspondence should be addressed.
Sustainability 2019, 11(19), 5213; https://doi.org/10.3390/su11195213
Submission received: 31 July 2019
/
Revised: 28 August 2019
/
Accepted: 9 September 2019
/
Published: 23 September 2019
(This article belongs to the Special Issue Selected Papers from 2019 IEEE Eurasia Conference on Biomedical Engineering, Healthcare and Sustainability (IEEE ECBIOS 2019))
Abstract
:With the continuous expansion of sub-ecological problems, it is the question of how to effectively reduce environmental pollution and improve energy efficiency that has become a major challenge. At the same time, the energy consumption of family homes accounts for a large proportion, and whether smart homes can become a part of sustainable development is getting more and more attention. Although there are hundreds of smart home products and many investors on the market, consumers are relatively less accepting of this technology. How to make consumers adopt and continue to use has become a key issue in the development of smart homes. From the perspective of consumers, this study aims first to explore the relevant factors that affect the sustainable use of smart homes, and second empirically analyze the hypothetical model by using structural equation modeling. The empirical analysis results are based on the sample data of 488 Chinese respondents with experience in smart home use. The results showed that the service quality and perceived usefulness of smart home services positively impact users’ degree of satisfaction, and a higher degree of satisfaction, in turn, contributes to users’ formation of habits. Users’ desire to continuously use smart home services is influenced by perceived usefulness, degree of satisfaction, and habit; among them, habit is the key factor affecting users’ willingness. These findings expand our understanding of users’ desire to continuously use smart homes and provide theoretical support for the sustainable development of the smart home industry.
1. Introduction
Secondary ecological problems, including climate anomalies and air pollution, have been worsening. Humans are trying to more wisely use energy in an attempt to achieve higher energy use efficiency [1]. With the growing maturity and integration of technologies, such as the Internet of Things (IOT), Artificial Intelligence (AI), and 5G, the era when household appliances provide services for people via the network has arrived, of which the smart home system, in particular, has been the subject of growing attention.
No agreement has yet been reached on the definition of a “smart home”, which mainly includes digital sensing and communications equipment [2,3]. Such equipment can realize mutual communications in an ideal smart home system. Compared with traditional household appliances that users have to manually operate and manage in terms of energy consumption, smart homes can remotely electronically control and manage smart household appliances (e.g., heaters, air-conditioners, and washing machines), as well as control and manage the current household equipment through the installation of sensors and intelligent switches (e.g., ZigBee single-line intelligent switch) [4]. The smart home system provides user-oriented practical and functional services, and the intelligent management of household energy sources to reduce users’ energy consumption and promote the sustainable development of the environment [5,6].
Smart homes, which can conveniently manage household appliances through the network, have become a new market segment for Internet communication and technology (ICT) companies to create new income sources, considering the saturation of the smartphone market. The main enterprises in the ICT ecosystem are striving to launch smart home services/products, such as Google Home (Google Corporation, Mountain View, USA) and Amazon Echo (Amazon Corporation, Seattle, USA). According to the Statista research report [7], the trading volume of the global smart home industry is projected to reach USD $15.30 billion by the year 2023, and the prospects for the future smart home market are promising [8]. However, the penetration rate of smart homes across the world was just around 7.7%, and consumers’ overall acceptance of smart home was still relatively low, which had directly influenced the sustainable development of the smart home industry [9].
Determining whether smart homes can contribute to sustainable development has gained growing attention from academic circles [6,10,11], but research into smart homes has been limited to theoretical concepts and technologies [12,13], and little attention has been given to consumers’ post-acceptance continued intention to use smart homes. Therefore, exploring how to optimize consumers’ cognition and acceptance of smart home products will have a far-reaching influence on the continued intention to use and the industrial development of users. To address this current research gap, we attempted to analyze the factors influencing consumers’ smart home use continuation intention using structural equation modeling (SEM) to provide theoretical support for the sound development of the home industry.
The rest of this paper is organized as follows: Section 2 provides a literature review and proposes the hypotheses. Section 3 outlines the methodology used in this research and data collection. Section 4 provides the empirical results of the model analysis. Finally, Section 5 concludes the study and the implications of this work.
2. Research Background and Hypotheses
2.1. Smart Home Service
Although academics have not agreed on a definition of “smart home”, the definition suggested by Gram-Hanssen and Darby has been widely accepted [14]: A smart home is a home with digital sensing and communications equipment. Based on this definition, they divided smart homes into four categories: (1) safety and control, (2) activities, (3) relation and continuity, and (4) reflection of identity and social status. As a physical network system, smart homes are connected with household networks via sensors and intelligent electric appliances, and through human–machine interaction between the Internet and intelligent electric appliances, the user-oriented intelligent network housing services can be realized [3,12,13,15,16,17].
Generally, smart home systems are composed of the IoT cloud end, smart home platform (e.g., mobile application), terminal devices (e.g., intelligent electric appliances, home gateways, and intelligent sensors), and a communications network (e.g., link layer, network layer, transmission layer, and application layer) [18]. As shown in Figure 1, intelligent sensors can achieve remote monitoring, visit, and control of household appliances and be divided into different categories according to different user needs (e.g., security guard, life assistance, health, entertainment, communications, and energy control). Smart home suppliers, through the collection and analysis of users’ household appliances, can offer personalized and intelligent services to satisfy user needs [10,18,19].
Since 2011, academic circles have investigated smart homes more frequently [20]. Technology companies, such as Google, Amazon, Samsung, and Alibaba, from different parts of the world, have been actively developing and providing integrated smart home services and products. At the same time, smart homes can analyze and recognize users’ daily use habits, thus, benefiting users with memory deficits [21]. In terms of household energy consumption, smart home services can directly help house owners reduce energy demands, automatically save energy according to increases or decreases of indoor energy consumption, and also indirectly provide real-time energy use information and bills for users [22,23,24].
Though smart homes have considerable potential and offer various benefits, issues, such as the system learning cost, safety, and service quality of suppliers, they still require further research to address consumers’ concerns affecting their continued intention to use. Therefore, while encouraging users to adopt smart home systems, scholars should study the opinions and behaviors of users after their initial acceptance of the smart home system, to effectively help suppliers to expand and optimize services.
2.2. Continuance Intention
Bhattacherjee [25,26] stated that initial acceptance is the first step for the success of an information system, and maintaining users’ continued intention to use is more critical. At different use periods, users have different demands, resulting in differences in their continuance intentions and behaviors [15,26]. The exploration of users’ continued intention to use is vital for home smart services. The smart home industry has been actively improving service quality and seeking user expansion and the continued growth of the industry [27]. Frequent use of smart homes, once users have a continued intention to use their services, is crucial to smart home suppliers’ maintenance of user engagement. The following section introduces a model that can be used to study the factors influencing the continued intention to use smart homes.
2.3. Research Hypotheses
2.3.1. Service Quality
Service quality refers to users’ perception of the extent to which suppliers can satisfy users’ needs. Parasuraman et al. [28] divided service quality into five dimensions: tangibility, reliability, responsiveness, assurance, and empathy, and the five dimensions indicate that suppliers should provide timely and efficient services for consumers to receive user recognition of service quality. Excellent service quality directly improves users’ continued intention to use and indirectly improves user satisfaction with services. Delone and Mclean held that service quality is a critical factor affecting users’ acceptance of the information system, and that high service quality positively influences user satisfaction [25,26,29,30]. Jahng and Ramamurthy [31] pointed out the importance of the system quality, information quality, and service quality in user satisfaction. The degree of fit can positively influence users’ perception of the intelligence information system. This viewpoint has been verified by Gu and Lee [16]. As an upgraded product of traditional household appliances, smart homes require users to spend time learning how to use them. During the process, complete service projects can decide users’ perceived usefulness of the service itself, which indirectly and positively influences the formation of user satisfaction. Therefore, we formed the following hypotheses:
Hypothesis 1 (H1).
Service quality significantly and positively influences the perceived usefulness of a smart home.
Hypothesis 2 (H2).
Service quality significantly and positively influences the satisfaction with a smart home.
2.3.2. Perceived Usefulness
The concept of perceived usefulness was first proposed by Davis in the technology acceptance model (TAM), defined as the ability of users to improve performance by fully using the enhanced system, thereby reflecting users’ willingness to accept [32]. The perceived usefulness has been proven to significantly and positively impact users’ initial desire to use smart home services [33], whereas the degree of satisfaction and habits play a mediating role between perceived usefulness and willingness to continuously use these services [34]. A higher degree of usefulness perceived by users contributes to a higher degree of satisfaction of users with smart home service providers [16]. This is mainly manifested as users’ positive emotional reactions to the systems through which they can improve their productivity or performance [26,32,35]. Users’ recognition of the positive role of the systems, in turn, increases their degree of satisfaction and desire to use [34,36]. In addition, some studies support that habit formation may be driven by external forces, such as cognitive misunderstanding, uncertainty, and psychological commitment, whereas users’ perception of system usefulness can effectively facilitate their habit formation [34,37]. Therefore, the following hypotheses are introduced:
Hypothesis 3 (H3).
Perceived usefulness significantly positively influences the satisfaction with a smart home.
Hypothesis 4 (H4).
Perceived usefulness significantly positively influences smart home habits.
Hypothesis 5 (H5).
Perceived usefulness significantly positively influences the intention to continue to use a smart home.
2.3.3. Satisfaction
Expectation confirmation theory (ECT) holds that users’ degree of satisfaction with use is an important factor influencing their repurchase or reuse. Bhattacherjee et al. [26] explained the willingness of information system users to continuously use by combining TAM and ECT and concluded through empirical analysis that the degree of satisfaction significantly positively impacts users’ willingness to use. Other researchers argued that favorable use experience is also a key condition for developing use habits [38], since they can increase users’ tendency to repeat the same activities [39]. With the growing accumulation of use experience, the impact of users’ degree of satisfaction on habits will increase over time [37]. Hsiao et al. [34] concluded that the degree of satisfaction and habits play a sufficient mediatory role between perceived usefulness and the desire for continuous use. Given the above, we propose the following hypotheses:
Hypothesis 6 (H6).
Satisfaction significantly and positively influences smart home habits.
Hypothesis 7 (H7).
Satisfaction significantly and positively influences the intention to continue using a smart home.
2.3.4. Habit
Habits generally reflect users’ previous use experience and are considered as one of the factors driving the repetitive behaviors of users [2,40,41]. Once users have developed the use habit, their dependence on the use will continue to increase and even be difficult to suppress [39,42]. The UTAUT 2 (Unified theory of acceptance and use of technology 2) model built by Venkatesh et al. [43] holds that users’ technology use habits directly affect their intention to use. For the use of smart home services, the stronger the IoT or smart home services use habit, the more intense the desire to continuously use them [2,43]. Wilson et al. [44] concluded that habit strength directly influences users’ desire for continuous use. Likewise, Chou et al. [45] found that habit is the continuation of users’ unintentional actions, which in turn is transformed into the automatic behaviors that positively impacts users’ desire for continuous use [46]. Therefore, this research makes the following hypothesis:
Hypothesis 8 (H8).
Habit significantly and positively influences the intention to continue to use a smart home.
2.4. Research Model
Combining the above research hypotheses, we propose a research model as shown in Figure 1.
3. Research Methodology
3.1. Questionnaire and Pre-Test
Based on a thorough review of research findings by scholars, either abroad or at home, we designed an initial questionnaire. Questions related to service quality are based on the questionnaire designs of Park and Choi [27] and Delone and Mclean [29,30]. Questions related to perceived usefulness are based on the questionnaire designs of Davis [32] and Shin et al. [33]. Questions related to user satisfaction are based on the questionnaire design of Bhattacherjee [25,26]. Questions related to user habit are based on the questionnaire designs of Venkatesh et al. [43] and Baudier et al. [2]. Questions related to continued intention to use are based on the questionnaire design of Bhattacherjee [25,26].
To ensure the feasibility and credibility of this research, experts and professors from the smart home field discussed whether any deviation existed with the questions posed in the questionnaire. From 10 March to 18 April 2019, a preliminary survey was administered to PhD candidates of Kongju National University. Under the prerequisite of maintaining the original meaning of the questions, the wordings of some questions were modified, and the final questionnaire was designed. All questions were statistically analyzed using a five-point Likert scale, where, “1” indicated “strongly disagree” and “5” indicated “strongly agree”. The measurement items specifically used in this study are listed in Appendix A.
3.2. Data Collection and Methodology
Chinese consumers with a smart home service user experience were adopted as the research object for this questionnaire. Questionnaires were administered either online or offline, from 28 March to 18 April 2019. A total of 488 valid questionnaires were collected. The questionnaire data collected were statistically analyzed using IBM SPSS v25.0 (IBM Corporation, New York, USA) and IBM AMOS v25.0 (IBM Corporation, New York, USA). Frequency analysis was first performed to quantify the demographic characteristics of the respondents. Second, confirmatory factor analysis was conducted to evaluate the internal consistency and appropriateness of the evaluation items, and appropriateness of the concepts was examined. Finally, SEM was used to verify the model’s degree of fitting and research hypotheses.
3.3. Sample Characteristics
The demographic characteristics of the questionnaire show that 56.4% respondents were male and 43.6% were female. The respondents were concentrated in two age groups: 20–29 years old (28.7%), and 30–39 years old (55.7%). In terms of academic degree, 54.3% of respondents had graduated with a bachelor’s degree, followed by 31.5% graduating with a postgraduate degree or above. In terms of professions, 48.6% of respondents were company staff, whose average monthly salary mainly ranged from 4999 to 8000 yuan (53.1%). The sample characteristics generally coincide with the actual smart home user group. Therefore, sample data were considered suitable for empirical analysis.
4. Data Analysis and Results
4.1. Measurement Model
Since research in the field of social sciences involves abstract concepts, the credibility of variables should be ensured. We adopted internal consistency to judge the credibility of variables, namely Cronbach’s α. George and Mallery [47] found that in the field of social sciences, a Cronbach’s α exceeding 0.8 indicates favorable credibility. The Cronbach’s α values of the five variables studied here are all larger than 0.8 and therefore acceptable. To examine the convergent validity of various concepts, IBM AMOS 25 was used to complete the maximum likelihood estimation. Generally, composite reliability (CR) and average variance extracted (AVE) are indicators used to evaluate the measurement model. AVE is larger than 0.5, and CR is larger than 0.7, suggesting that the sample data have a high validity [48]. As shown in Table 1, the values of AVE and CR are all acceptable, and the factor loading of all concepts is larger than 0.60, which meets the requirement of the structural convergent validity [49].
Discriminant validity shows that the largest correlation coefficient among the potential variables is 0.574, and that the square error is 0.329, which is smaller than the AVE value, meaning that the research data have high validity (Table 2.). All the results meet the requirements of the recommended value [50], implying a favorable degree of fit of the research model presented in this paper.
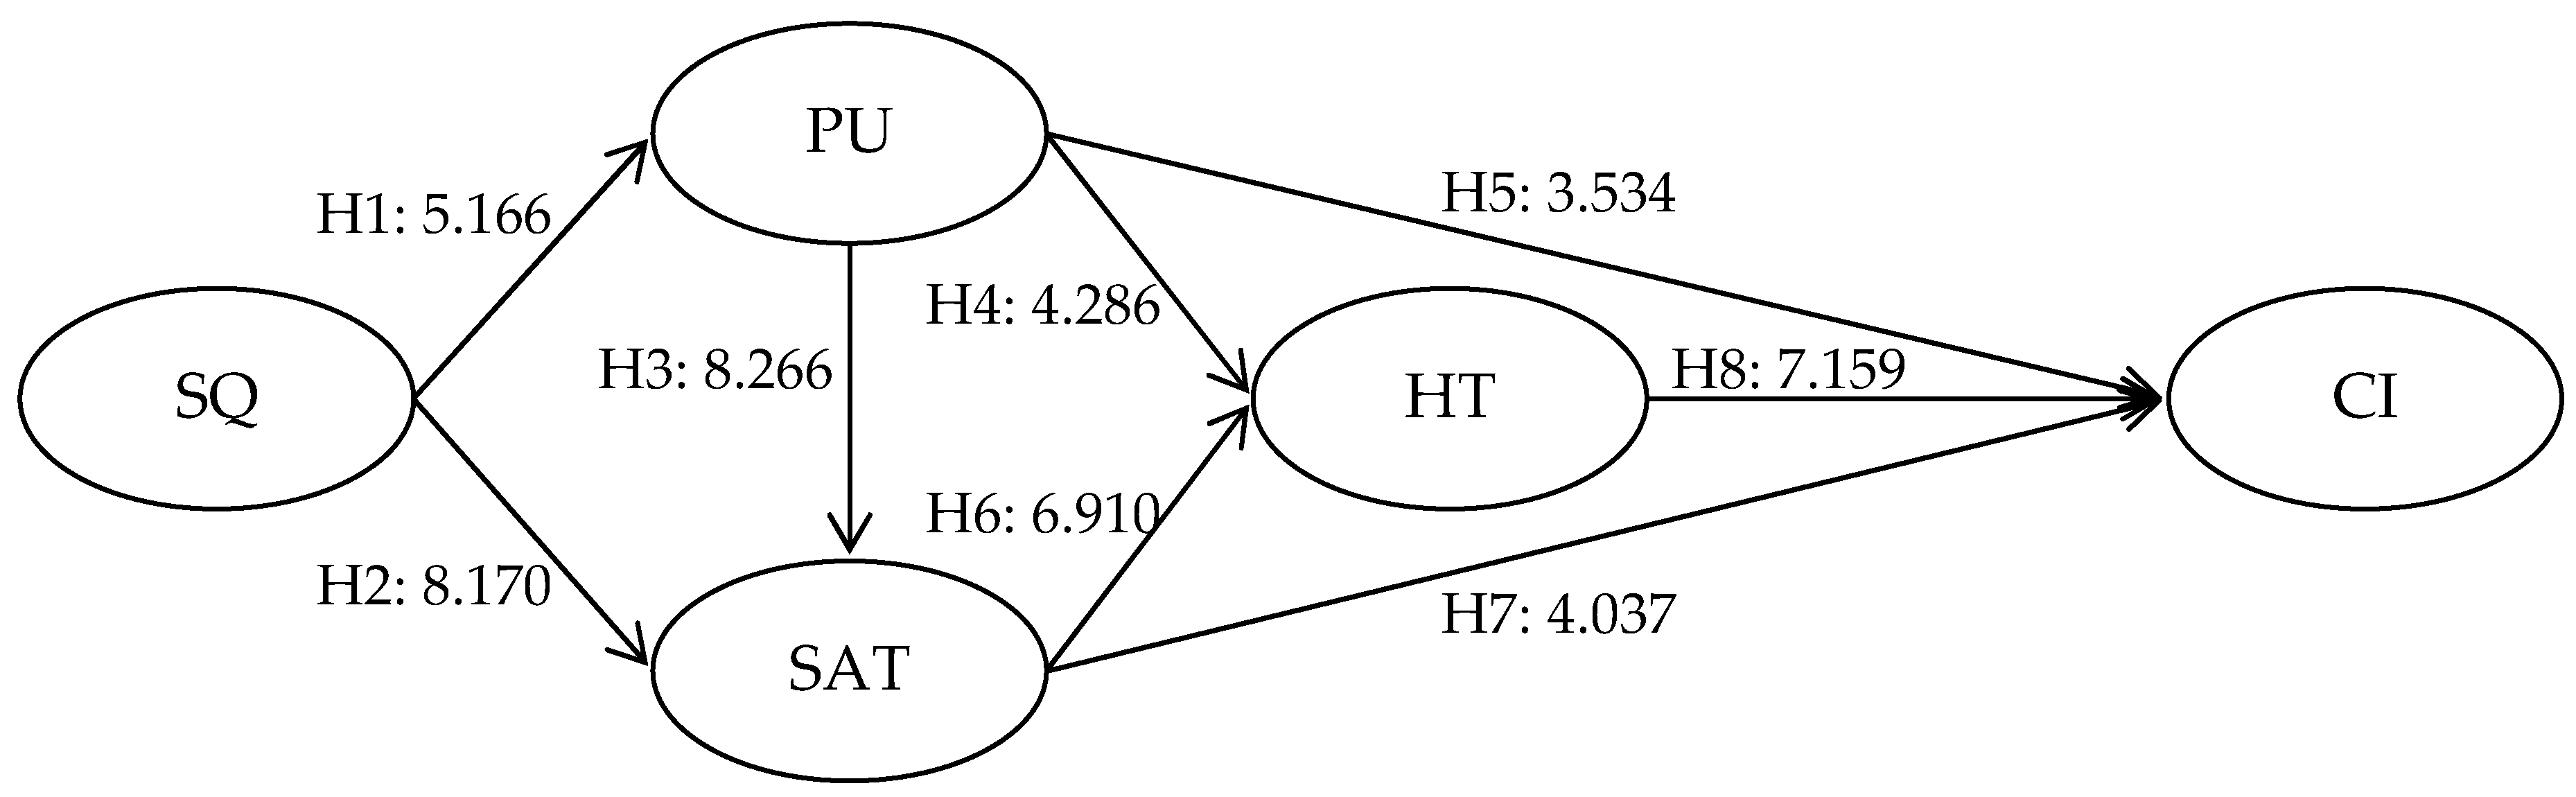
4.2. Structural Model and Hypotheses Testing
In the social sciences research findings, if a = 0.05 (95% of the confidence level), p-value < 0.05, and the value of critical ratio (C.R.) ≤ ±1.96, then the research hypothesis has a significant influence [51]. In IBM AMOS 25, the CR (critical ratio) of the regression weights is used to judge whether the research hypothesis can be accepted. The degree of fitting of the hypothesis verification model in this research is: χ2/df = 2.531, GFI = 0.930, AGFI = 0.909, NFI = 0.933, IFI = 0.959, CFI = 0.958, RMSEA = 0.056; all indexes meet requirements. The results of the empirical analysis suggest that service quality significantly and positively influences perceived usefulness (β = 5.166) and user satisfaction (β = 8.170). Service quality most strongly influences user satisfaction, and perceived usefulness has a significantly positive influence on user satisfaction (β = 8.266), user habit (β = 4.286), and continued intention to use (β = 3.534). Among them, perceived usefulness has the strongest influence on user satisfaction. User satisfaction has a significantly positive influence on user habit and continued intention to use, and the influence path coefficients are β = 6.190 and β = 4.037, respectively. We observed that user habit most strongly influences continued intention to use, and the influence path coefficient is β = 7.159. All hypotheses in this research are supported, as demonstrated in Table 3 and Figure 2.
5. Conclusions and Discussion
With the constant reform and development of smart homes, people’s energy consumption behaviors and daily lifestyles are changing. The sustainable development of smart homes depends on users’ acceptance degree of smart home services and products and tangible benefits. To better predict consumers’ user behaviors, identifying critical factors influencing users’ intentions to continue to use the smart home system is essential. On the basis of theoretical research, we built a model that can be used to study the intention to continue to use smart homes. Questionnaires were administered to smart home users to collect corresponding data. SEM was used to verify the theoretical model.
Our major research findings are as follows. First, service quality has a significantly positive influence on perceived usefulness and user satisfaction. Therefore, more attention should be given to user expectations and practical functions when service providers develop new smart homes and services or perfect the existing ones. Thus, when any problems occur in the use process, solution plans can be immediately provided. Differentiated services should be provided for different user groups, and the critical role of smart home services in increasing the convenience of daily life should be considered.
Secondly, perceived usefulness has a significantly positive impact on users’ degree of satisfaction and willingness to continue use; the degree of satisfaction also has a significantly positive impact on users’ continued use of smart home services. This finding is consistent with the conclusions reported by Bhattacherjee et al. [26] and Ambalov [15], suggesting that smart home services are the same as other technical services, and perceived usefulness and degree of satisfaction both can enhance users’ willingness to use smart home services. The structural model results suggest that the perceived usefulness of smart homes has the most significant impact on users’ degree of satisfaction compared with other research variables. As long as the use of smart home services can effectively improve users’ life or work efficiently, users will maintain a positive attitude toward the services. Therefore, service providers and application developers should consider these factors to increase users’ desire to use smart homes.
Third, perceived usefulness and satisfaction have a significantly positive influence on user habit, and user habit has a significantly positive influence on continued intention to use. This research shows that user habit has the most significant influence on continued intention to use smart home services. The practicability and usefulness of smart homes in daily life can effectively promote user habit. Compared with user perception, user satisfaction can more directly lead to the formation of user habit. Habit strength playing the most critical role in driving users’ continued intention to use has been substantiated many times [2]. Through empirical analysis, however, we found that user habit during the continued use period of a smart home can most directly exert a positive influence on users’ continued intention to use. Therefore, before launching new smart home products and services, developers can start with the most commonly used electronic devices to achieve breakthroughs. This empirical analysis results show that among the three crucial factors influencing users’ desire to use smart home services, habit is regarded as an important antecedent that drives users to use services spontaneously if they have had a certain use experience.
The main contributions of this study are as follows. First of all, this is the first empirical study to use structural equation modeling (SEM) to detect users’ desire to continuously use smart home services, thereby enriching the smart home service literature. Secondly, we focused on users’ mentalities after the actual use of smart home services. Users’ psychological perceptions of smart homes change once they have a certain use experience. Our research suggests that perceived usefulness, degree of satisfaction, and habits serve as good predictors for users’ desire to continue to use smart home services. However, users’ attitudes toward the continued use of smart home services after the initial experience and subsequent experience depend heavily on user habits, which was also confirmed by Baudier et al. [2]. This finding deserves special attention, and the influence of habit should be particularly highlighted in future research on users’ desire to continue to use smart home services.
From a practitioner’s perspective, this study highlights the importance of the development and management of smart home services. Firstly, excellent service quality is the antecedent that will help smart home services to win users’ recognition and satisfaction. Therefore, service providers should first develop a fast and effective user response mechanism to ensure that the problems occurring in the use process do not affect users’ overall experience. Smart homes are services that are based on the direct interaction of multiple smart devices with users, and these smart devices are generally commonly used by family members [52]. As a result, special attention should be given to the human–computer interaction at the beginning of smart home design. Considering the frequent communication and interactions between users and smart home devices, service providers may authenticate users, thereby reducing potential security risks and providing personalized services according to user needs. However, more in-depth research is needed to determine how to conduct multiuser authentication and how to grant different users individualized access right schemes.
Users’ functional requirements for services should be highlighted because users’ perception of product usefulness can positively influence users’ the satisfaction degree with the product and their formation of behavioral habits. Smart home services are not a single system, so service providers should adopt the smart home device communication protocol with universal standards to accommodate the ever-increasing varieties and functions of smart home devices [53]. The universal standard communication protocol promises the cooperative work between multiple devices, while users can customize the interconnecting rules between devices according to their own needs. Service providers should attach importance to the practical functioning of products in the design and development stage to meet customers’ needs. By tracking users’ frequency of use of a certain smart home service, service providers can identify which of the existing services have evolved into a user habit, thus providing personalized solutions according to user habits and improving users’ efficiency in daily life and task scheduling, with the goal of increasing the attractiveness of smart home services. The research results show that the key factor driving users’ continued use of smart home services at this stage is habit. For this reason, when launching new smart home products and services, service providers should first select frequently and daily used electronic devices’ use as a breakthrough point for product development to better help users to form use habits. A case in point is smartwatches, which can be used to work together with smart home services due to their pre-existing number of users and high-frequency daily use in an attempt to increase users’ dependence on smart home services.
This research is not without its limitations. First, this research, as is the case with any research applying the survey-based method, is vulnerable to the fixed limitations of measurement errors [54]. However, this study only focuses on Chinese consumers, leading to the possibility the findings may not be applicable to the smart home industry of other countries. Therefore, future studies shall take consumers from different countries into consideration, so as to further verify the universality of the theoretical model proposed in this study. Further, qualitative survey methods are better to be adopted to identify newly appearing acceptance conditions and dimensions and to examine the correlation among analysis factors from a deeper perspective. Second, the model introduced ignores user features and cannot be used to examine social influences and factors affecting personal innovativeness. In the future, a deeper empirical analysis should be conducted from the perspective of user features. Third, due to cultural differences among different countries, future research can integrate cultural factors into this model to gain a better understanding of users’ opinions of smart homes.
Author Contributions
W.G. and P.B. developed the idea, motivation, and research question of the paper and contributed to the discussion. W.Y.H. and J.W.K. outlined and revised the manuscript. W.G. substantially contributed to the design of this study.
Funding
This research received no external funding.
Conflicts of Interest
The authors declare no conflict of interest.
Appendix A
Service Quality
|
References
- Yergin, D. The Quest: Energy, Security, and the Remaking of the Modern World; Penguin: New York, NY, USA, 2011. [Google Scholar]
- Baudier, P.; Ammi, C.; Deboeuf-Rouchon, M. Smart home: Highly-educated students’ acceptance. Technol. Forecast. Soc. Chang. 2018, 119355. [Google Scholar] [CrossRef]
- Chan, M.; Estève, D.; Escriba, C.; Campo, E. A review of smart homes—Present state and future challenges. Comput. Methods Programs Biomed. 2008, 91, 55–81. [Google Scholar] [CrossRef] [PubMed]
- ITU. Applications of ITU-T G.9960, ITU-T G.9961 Transceivers for Smart Grid Applications: Advanced Metering Infrastructure, Energy Management in the Home and Electric Vehicles. 2010. Available online: http://www.itu.int/dms_pub/itu-t/opb/tut/T-TUT-HOME-2010-PDF-E.pdf (accessed on 22 February 2019).
- Marikyan, D.; Papagiannidis, S.; Alamanos, E. A systematic review of the smart home literature: A user perspective. Technol. Forecast. Soc. Chang. 2019, 138, 139–154. [Google Scholar] [CrossRef]
- Schill, M.; Godefroit-Winkel, D.; Diallo, M.F.; Barbarossa, C. Consumers’ intentions to purchase smart home objects: Do environmental issues matter? Ecol. Econ. 2019, 161, 176–185. [Google Scholar] [CrossRef]
- Statista. Statistics Portal: Smat Home. Available online: https://www.statista.com/outlook/279/100/smart -home/worldwide (accessed on 10 March 2019).
- Khedekar, D.C.; Truco, A.C.; Oteyza, D.A.; Huertas, G.F. Home Automation—A Fast-Expanding Market. Thunderbird Int. Bus. Rev. 2017, 59, 79–91. [Google Scholar] [CrossRef]
- Shuhaiber, A.; Mashal, I. Understanding users’ acceptance of smart homes. Technol. Soc. 2019, 58, 101110. [Google Scholar] [CrossRef]
- Balta-Ozkan, N.; Davidson, R.; Bicket, M.; Whitmarsh, L. Social barriers to the adoption of smart homes. Energy Policy. 2013, 63, 363–374. [Google Scholar] [CrossRef]
- Batalla, J.M.; Vasilakos, A.; Gajewski, M. Secure smart homes: Opportunities and challenge. ACM Comput. Surv. 2017, 50, 75. [Google Scholar] [CrossRef]
- Wilson, C.; Hargreaves, T.; Hauxwell-Baldwin, R. Smart homes and their users: A systematic analysis and key challenges. Pers. Ubiquitous Comput. 2015, 19, 463–476. [Google Scholar] [CrossRef]
- Wilson, C.; Hargreaves, T.; Hauxwell-Baldwin, R. Benefits and risks of smart home technologies. Energy Policy. 2017, 103, 72–83. [Google Scholar] [CrossRef] [Green Version]
- Gram-Hanssen, K.; Darby, S.J. “Home is where the smart is”? Evaluating smart home research and approaches against the concept of home. Energy Res. Soc. Sci. 2018, 37, 94–101. [Google Scholar] [CrossRef]
- Ambalov, I.A. A meta-analysis of IT continuance: An evaluation of the expectation-confirmation model. Telemat. Inform. 2018, 35, 1561–1571. [Google Scholar] [CrossRef]
- Gu, W.; Lee, J.H. A Study on the Use Intention of Smart Home APP based on IoT—Focusing on the China Market. e-Business Stud. 2017, 18, 195–212. [Google Scholar] [CrossRef]
- Reinisch, C.; Kofler, M.; Iglesias, F.; Kastner, W. Thinkhome energy efficiency in future smart homes. EURASIP J. Embed. Syst. 2011, 2011, 104617. [Google Scholar] [CrossRef]
- Ding, D.; Cooper, R.A.; Pasquina, P.F.; Fici-Pasquina, L. Sensor technology for smart homes. Maturitas 2011, 69, 131–136. [Google Scholar] [CrossRef] [PubMed]
- Wu, C.L.; Liao, C.F.; Fu, L.C. Service-oriented smart-home architecture based on OSGi and mobile-agent technology. IEEE Trans. Syst. Man Cybern. Part C Appl. Rev. 2007, 37, 193–205. [Google Scholar] [CrossRef]
- Hajduk, S. The concept of a smart city in urban management. Bus. Manag. Educ. 2016, 14, 34–49. [Google Scholar] [CrossRef]
- Wang, Y.S.; Tseng, T.H.; Wang, W.T.; Shih, Y.W.; Chan, P.Y. Developing and validating a mobile catering app success model. Int. J. Hosp. Manag. 2019, 77, 19–30. [Google Scholar] [CrossRef]
- Augusto, J.C.; Liu, J.; McCullagh, P.; Wang, H.; Yang, J.B. Management of uncertainty and spatio-temporal aspects for monitoring and diagnosis in a smart home. Int. J. Comput. Intell. Syst. 2008, 1, 361–378. [Google Scholar] [CrossRef]
- Paetz, A.G.; Dütschke, E.; Fichtner, W. Smart homes as a means to sustainable energy consumption: A study of consumer perceptions. J. Consum. Policy 2012, 35, 23–41. [Google Scholar] [CrossRef]
- Peters, D.; Axsen, J.; Mallett, A. The role of environmental framing in socio-political acceptance of smart grid: The case of British Columbia, Canada. Renew. Sustain. Energy Rev. 2018, 82, 1939–1951. [Google Scholar] [CrossRef]
- Bhattacherjee, A. Understanding information systems continuance: An expectation-confirmation model. MIS Q. 2001, 25, 351–370. [Google Scholar] [CrossRef]
- Bhattacherjee, A.; Perols, J.; Sanford, C. Information technology continuance: A theoretic extension and empirical test. J. Comput. Inf. Syst. 2008, 49, 17–26. [Google Scholar] [CrossRef]
- Park, S.A.; Choi, S.M. An Understanding the Factors Influencing Satisfaction and Continued Use Intention of AI speakers: Focusing on the Utilitarian and Hedonic Values. Inf. Soc. Med. 2018, 19, 159–182. (In Korean) [Google Scholar]
- Parasuraman, A.; Zeithaml, V.A.; Malhotra, A. ES-QUAL: A multiple-item scale for assessing electronic service quality. J. Serv. Res. 2005, 7, 213–233. [Google Scholar] [CrossRef]
- DeLone, W.H.; McLean, E.R. Information systems success: The quest for the dependent variable. Inf. Syst. Res. 1992, 3, 60–95. [Google Scholar] [CrossRef]
- Delone, W.H.; Mclean, E.R. Measuring e-commerce success: Applying the DeLone & McLean information systems success model. Int. J. Electron. Commer. 2004, 9, 31–47. [Google Scholar]
- Jahng, J.; Jain, H.; Ramamurthy, K. Effective design of electronic commerce environments: A proposed theory of congruence and an illustration. IEEE Trans. Syst. Man Cybern. Part A Syst. Hum. 2000, 30, 456–471. [Google Scholar] [CrossRef]
- Davis, F.D. Perceived usefulness, perceived ease of use, and user acceptance of information technology. MIS Q. 1989, 13, 319–340. [Google Scholar] [CrossRef]
- Shin, J.W.; Park, Y.; Lee, D.H. Who will be smart home users? An analysis of adoption and diffusion of smart homes. Technol. Forecast. Soc. Chang. 2018, 134, 246–253. [Google Scholar] [CrossRef]
- Hsiao, C.H.; Chang, J.J.; Tang, K.Y. Exploring the influential factors in continuance usage of mobile social Apps: Satisfaction, habit, and customer value perspectives. Telemat. Inform. 2016, 33, 342–355. [Google Scholar] [CrossRef]
- Gelderman, M. The relation between user satisfaction, usage of information systems and performance. Inf. Manag. 1998, 34, 1–11. [Google Scholar] [CrossRef]
- Ghazal, M.; Akmal, M.; Iyanna, S.; Ghoudi, K. Smart plugs: Perceived usefulness and satisfaction: Evidence from United Arab Emirates. Renew. Sustain. Energy Rev. 2016, 55, 1248–1259. [Google Scholar] [CrossRef] [Green Version]
- Chiu, C.M.; Hsu, M.H.; Lai, H.; Chang, C.M. Re-examining the influence of trust on online repeat purchase intention: The moderating role of habit and its antecedents. Decis. Support Syst. 2012, 53, 835–845. [Google Scholar] [CrossRef]
- Wang, C.; Harris, J.; Patterson, P. The roles of habit, self-efficacy, and satisfaction in driving continued use of self-service technologies: A longitudinal study. J. Serv. Res. 2013, 16, 400–414. [Google Scholar] [CrossRef]
- Thorngate, W. Must we always think before we act? Person. Soc. Psychol. Bull. 1976, 2, 31–35. [Google Scholar] [CrossRef]
- Limayem, M.; Hirt, S.G.; Cheung, C.M. How Habit Limits the Predictive Power of Intention: The Case of Information Systems Continuance. MIS Q. 2007, 31, 705–737. [Google Scholar] [CrossRef]
- Kim, S.S.; Malhotra, N.K. A longitudinal model of continued IS use: An integrative view of four mechanisms underlying postadoption phenomena. Manag. Sci. 2005, 51, 741–755. [Google Scholar] [CrossRef]
- Aarts, H.; Dijksterhuis, A.P. The automatic activation of goal-directed behaviour: The case of travel habit. J. Environ. Psychol. 2000, 20, 75–82. [Google Scholar] [CrossRef]
- Venkatesh, V.; Thong, J.Y.; Xu, X. Consumer acceptance and use of information technology: Extending the unified theory of acceptance and use of technology. MIS Q. 2012, 36, 157–178. [Google Scholar] [CrossRef]
- Wilson, E.V.; Lankton, N.K. Effects of Prior Use, Intention, and Habit on IT Continuance Across Sporadic Use and Frequent Use Conditions. Commun. Assoc. Inf. Syst. 2013, 33, 3. [Google Scholar] [CrossRef] [Green Version]
- Chou, C.H.; Chiu, C.H.; Ho, C.Y.; Lee, J.C. Understanding Mobile Apps Continuance Usage Behavior and Habit: An Expectance-Confirmation Theory. In Proceedings of the PACIS 2013, Jeju, Korea, 18–22 June 2013; p. 132. [Google Scholar]
- Amoroso, D.; Lim, R. The mediating effects of habit on continuance intention. Int. J. Inf. Manag. 2017, 37, 693–702. [Google Scholar] [CrossRef]
- George, D.; Mallery, P. IBM SPSS Statistics 23 Step by Step: A Simple Guide and Reference; Routledge: New York, NY, USA, 2016. [Google Scholar]
- Fornell, C.; Larcker, D.F. Structural equation models with unobservable variables and measurement error: Algebra and statistics. J. Mark. Res. 1981, 18, 39–50. [Google Scholar] [CrossRef]
- Anderson, J.C.; Gerbing, D.W. Structural equation modeling in practice: A review and recommended two-step approach. Psychol. Bull. 1988, 103, 411. [Google Scholar] [CrossRef]
- Hu, L.T.; Bentler, P.M. Cutoff criteria for fit indexes in covariance structure analysis: Conventional criteria versus new alternatives. Struct. Equ. Model. 1999, 6, 1–55. [Google Scholar] [CrossRef]
- Hair, J.F., Jr.; Hult, G.T.M.; Ringle, C.; Sarstedt, M. A Primer on Partial Least Squares Structural Equation Modeling (PLS-SEM); Sage: Thousand Oaks, CA, USA, 2016. [Google Scholar]
- Lee, B.; Kwon, O.; Lee, I.; Kim, J. Companionship with smart home devices: The impact of social connectedness and interaction types on perceived social support and companionship in smart homes. Comput. Hum. Behav. 2017, 75, 922–934. [Google Scholar] [CrossRef]
- Yang, H.; Lee, H.; Zo, H. User acceptance of smart home services: An extension of the theory of planned behavior. Ind. Manag. Data Syst. 2017, 117, 68–89. [Google Scholar] [CrossRef]
- Gefen, D.; Straub, D. A practical guide to factorial validity using PLS-Graph: Tutorial and annotated example. Commun. Assoc. Inf. Syst. 2005, 16, 5. [Google Scholar] [CrossRef]
Figure 1.
Research model. SQ: service quality, PU: perceived usefulness, SAT: satisfaction, HT: habit, and CI: continuance intention.
Figure 1.
Research model. SQ: service quality, PU: perceived usefulness, SAT: satisfaction, HT: habit, and CI: continuance intention.
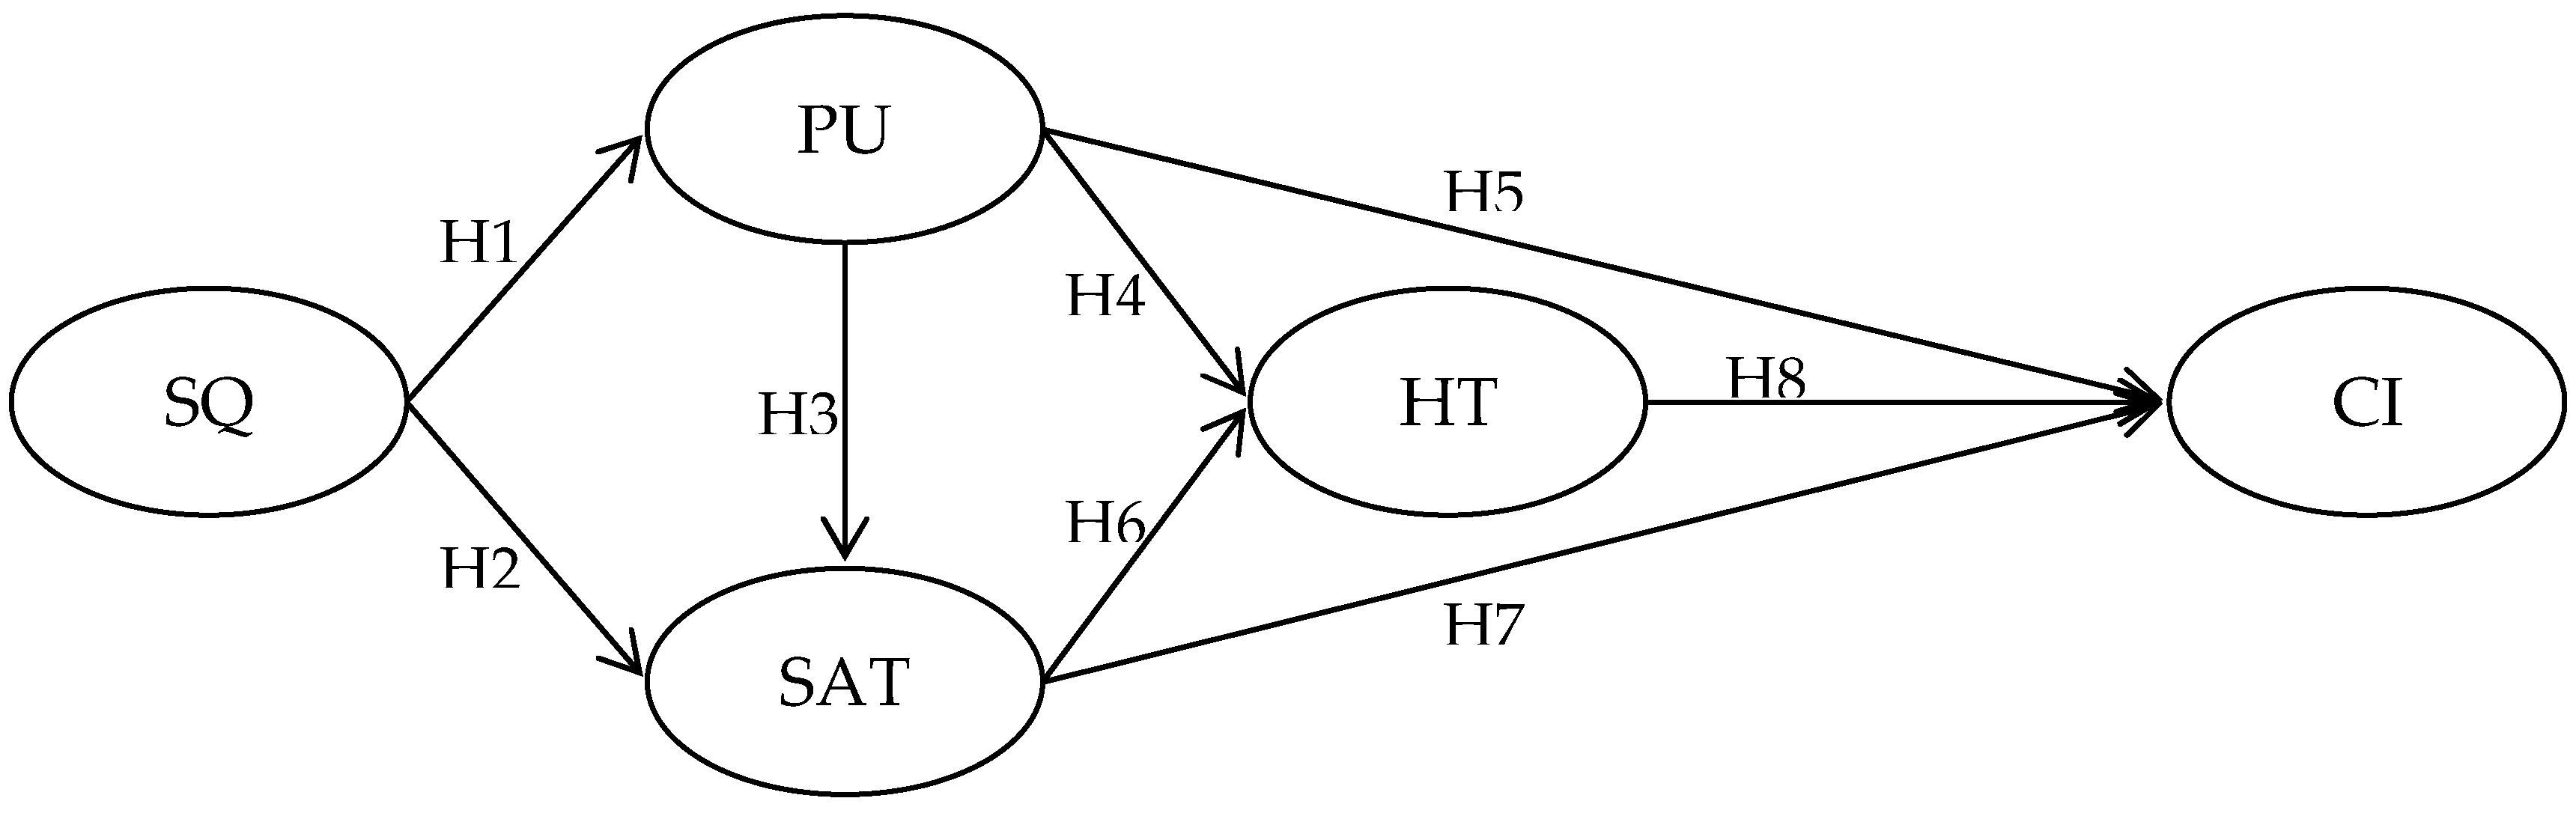
Figure 2.
Results of the research model. Note. SQ: service quality, PU: perceived usefulness, SAT: satisfaction, HT: habit, CI: continuance intention.
Figure 2.
Results of the research model. Note. SQ: service quality, PU: perceived usefulness, SAT: satisfaction, HT: habit, CI: continuance intention.


Table 1.
Convergent validity and reliability.
| Construct | Item | Factor Loading | SMC | CR | AVE | Cronbach’s α |
|---|---|---|---|---|---|---|
| SQ | SQ1 | 0.763 | 0.582 | 0.862 | 0.609 | 0.861 |
| SQ2 | 0.766 | 0.587 | ||||
| SQ3 | 0.817 | 0.599 | ||||
| SQ4 | 0.774 | 0.668 | ||||
| PU | PU1 | 0.762 | 0.581 | 0.856 | 0.598 | 0.856 |
| PU2 | 0.757 | 0.573 | ||||
| PU3 | 0.806 | 0.650 | ||||
| PU4 | 0.768 | 0.590 | ||||
| SAT | SAT1 | 0.781 | 0.610 | 0.877 | 0.641 | 0.876 |
| SAT2 | 0.847 | 0.718 | ||||
| SAT3 | 0.761 | 0.580 | ||||
| SAT4 | 0.811 | 0.658 | ||||
| HT | HT1 | 0.830 | 0.689 | 0.899 | 0.690 | 0.899 |
| HT2 | 0.863 | 0.746 | ||||
| HT3 | 0.797 | 0.635 | ||||
| HT4 | 0.832 | 0.691 | ||||
| CI | CI1 | 0.848 | 0.719 | 0.913 | 0.723 | 0.911 |
| CI2 | 0.886 | 0.785 | ||||
| CI3 | 0.840 | 0.705 | ||||
| CI4 | 0.826 | 0.683 |
Note: CR = composite reliability; AVE: average variance extracted; SMC: squared multiple correlation. SQ: service quality, PU: perceived usefulness, SAT: satisfaction, HT: habit, CI: continuance intention.
Table 2.
Discriminant validity.
| Construct | SQ | PU | SAT | HT | CI |
|---|---|---|---|---|---|
| SQ | 0.609 | ||||
| PU | 0.258 | 0.598 | |||
| SAT | 0.492 | 0.524 | 0.641 | ||
| HT | 0.560 | 0.446 | 0.495 | 0.690 | |
| CI | 0.470 | 0.470 | 0.498 | 0.574 | 0.723 |
Note: Bold numbers on the diagonal indicate the AVE of latent constructs. SQ: service quality, PU: perceived usefulness, SAT: satisfaction, HT: habit, CI: continuance intention.
Table 3.
Influence paths and hypotheses results.
| Hypothesis | Path | Estimate | S.E. | C.R. | p-Value | Result |
|---|---|---|---|---|---|---|
| H1 | SQ → PU | 0.280 | 0.054 | 5.166 | *** | Supported |
| H2 | SQ → SAT | 0.427 | 0.052 | 8.170 | *** | Supported |
| H3 | PU → SAT | 0.428 | 0.052 | 8.266 | *** | Supported |
| H4 | PU → HT | 0.267 | 0.062 | 4.286 | *** | Supported |
| H5 | PU → CI | 0.245 | 0.069 | 3.534 | *** | Supported |
| H6 | SAT → HT | 0.422 | 0.061 | 6.910 | *** | Supported |
| H7 | SAT → CI | 0.282 | 0.070 | 4.037 | *** | Supported |
| H8 | HT → CI | 0.443 | 0.062 | 7.159 | *** | Supported |
Note: SQ: service quality, PU: perceived usefulness, SAT: satisfaction, HT: habit, CI: continuance intention. *** p < 0.001.
© 2019 by the authors. Licensee MDPI, Basel, Switzerland. This article is an open access article distributed under the terms and conditions of the Creative Commons Attribution (CC BY) license (http://creativecommons.org/licenses/by/4.0/).
Share and Cite
MDPI and ACS Style
Gu, W.; Bao, P.; Hao, W.; Kim, J. Empirical Examination of Intention to Continue to Use Smart Home Services. Sustainability 2019, 11, 5213. https://doi.org/10.3390/su11195213
AMA Style
Gu W, Bao P, Hao W, Kim J. Empirical Examination of Intention to Continue to Use Smart Home Services. Sustainability. 2019; 11(19):5213. https://doi.org/10.3390/su11195213
Chicago/Turabian StyleGu, Wei, Peng Bao, Wenyuan Hao, and Jaewoong Kim. 2019. "Empirical Examination of Intention to Continue to Use Smart Home Services" Sustainability 11, no. 19: 5213. https://doi.org/10.3390/su11195213
Note that from the first issue of 2016, this journal uses article numbers instead of page numbers. See further details here.