Regional Impacts of Climate and Land Cover on Ecosystem Water Retention Services in the Upper Yangtze River Basin


1
Institute of Mountain Hazards and Environment, Chinese Academy of Sciences, Chengdu 610041, China
2
University of the Chinese Academy of Sciences, Beijing 100049, China
*
Author to whom correspondence should be addressed.
Sustainability 2019, 11(19), 5300; https://doi.org/10.3390/su11195300
Submission received: 21 July 2019
/
Revised: 21 September 2019
/
Accepted: 22 September 2019
/
Published: 26 September 2019
Abstract
:Water retention is an important factor in ecosystem services, owing to its relationships with climate and land-cover change; however, quantifying the independent and combined impacts of these variables remains a challenge. We use scenario analysis and the InVEST model to assess individual or combined impacts of climate and land cover on water retention in the Upper Yangtze River Basin. Water retention decreased from 1986 to 2015 at a rate of 2.97 mm/10a in response to increasing precipitation (3.94 mm/10a) and potential evapotranspiration (16.47 mm/10a). The rate of water retention change showed regional variability (from 68 to −18 mm/a), with some eastern regions experiencing an increase and most other regions experiencing a decrease. Farmland showed the highest decrease (10,772 km2), with land mainly converted into forest (58.17%) and shrub land (21.13%) from 2000 to 2015. The impact of climate change (−12.02 mm) on water retention generally was greater than the impact of land cover change (−4.14 mm), at the basin scale. Among 22 climate zones, 77.27% primarily were impacted by climate change; 22.73% primarily were impacted by land cover change. Our results demonstrate that both individualistic and integrated approaches toward climate and vegetation management is necessary to mitigate the impacts of climate change on water resources.
1. Introduction
Ecosystem services are the beneficial contributions of ecosystems to human societies [1]. These services are grouped into diverse categories, with water retention considered to be one of the most important owing to its direct impact [2,3]. Findings from the Millennium Assessment indicate that global freshwater consumption has exceeded supply by 5–25% over the past 50 years. As a result, global water retention services have been affected, and their decline poses a challenge for achieving some of the Sustainable Development Goals (SDG) [4]. Water retention is, therefore, one of the main focus areas in current sustainability research., To meet the requirement of “enhance the benefits to all from biodiversity and ecosystem services,” for example, national ecological assessments (NEA) have been performed in eight European countries where fresh water supports crucial ecosystem services [5]. Similarly, China has identified water retention as a key factor in its recently completed 10-year ecological assessment [6]. The Future Earth Project, launched in 2014 by the International Council for Science and the International Social Science Council, jointly led by the United Nations Educational, Scientific and Cultural Organization (UNESCO) and the United Nations Environment Programme (UNEP), among other high profile organizations, plans to prioritize fresh water, clean air, and food [7].
Water retention services are processed as the ecosystem redistributes precipitation through interception, accumulation, and evapotranspiration; climate and land cover are the main factors influencing these processes. Climate change is considered a primary influence on the terrestrial eco-hydrological cycle. Many studies have discussed the impact of climate change on the hydrological cycle, water resources, and water disasters [8,9], but relatively few have examined the independent or combined impacts of climate change and land change on ecosystem services in the Upper Yangtze River Basin (UYRB). A recent review demonstrated the detrimental impacts of climate change on ecosystem services, with the supply of freshwater being affected most heavily [10].
Water retention has become a particular focus of research within the framework of ecosystem services. A recent modeling study demonstrated that precipitation and potential evapotranspiration were the main climatic factors directly affecting ecosystem water retention in the source region of the Yellow River [11]. Accordingly, research on the Qinghai–Tibet Plateau revealed that the decrease in precipitation and increase of land evapotranspiration in some areas from 1982 to 2003 weakened the water retention capacity at the source of the Yarlung Zangbo River [12]. Similarly, analysis of the water supply in the Sanjiangyuan District demonstrated that both change in climate and land-use caused a decline of the regional surface current capacity from 1980 to 2005 [13]. It also was demonstrated that land-use change significantly affected ecosystem water cycles and, thus, affected ecosystem services [14]. Research also has focused on future land-use change impacts on water retention services. Different land-use patterns impacted on the ecosystem water retention capacity in Jiangxi Province from 2001 to 2030 based on the Conversion of Land Use and its Effects modelling framework (CLUE) model simulation analysis [15], for example. A recent study established a water retention service network model based on Bayesian networks and water balance principles to predict the future distribution probability of different land-use scenarios and water retention services in 2050 [16].
Owing to the uncertainty of climate change, and the long-term variability of vegetation dynamics, water retention services often are highly variable. Distinguishing between the impacts of climate and land cover on water retention is particularly important for adaptive management [17]. Research in this discipline has been carried out in numerous watersheds around the globe, including the analysis of effects of climate and land-use on surface water extent dynamics in Australia’s Murray–Darling Basin [18], on the water yield of the Tona watershed [19], on water resources and soil erosion in the Dano catchment in south–western Burkina Faso [20], on the water resources in the eastern Baltic Sea [21], on the combined impacts of future land-use and climate on water resources and quality of the Thames River basin in the southern UK [22], and the analysis of land-use change may exacerbate the climate change impacts on water resources in the Upper Ganges river basin in northern India [23]. All of these studies assessed the independent or combined effects of climate and land-use impacts, but none assessed their contributions to or regional differences in the impacts on water retention services. Given the uncertainty of climate change, comparisons between different regions are necessary. Currently, regional comparisons between studies are not feasible as existing studies use different evaluation methods.
The upper Yangtze River Basin (UYRB)—from the plateau to the basin—has an area of 1 million km2 in western China. The region spans multiple climate zones and is rich in biodiversity. It is both an important ecological protection area and an important economic zone in western China. Under the influence of global climate change, it is unclear how ecosystem water retention services will change in the region. During this study, we focus on the UYRB and adopt a unified assessment method for multiple climate zones to compare the independent and comprehensive contributions of climate and land-use on water retention. Considering the important ecological status of the UYRB, the results of this study provide valuable data for environmental protection and development decisions in the Yangtze River Economic Belt.
2. Materials and Methods
2.1. Study Area
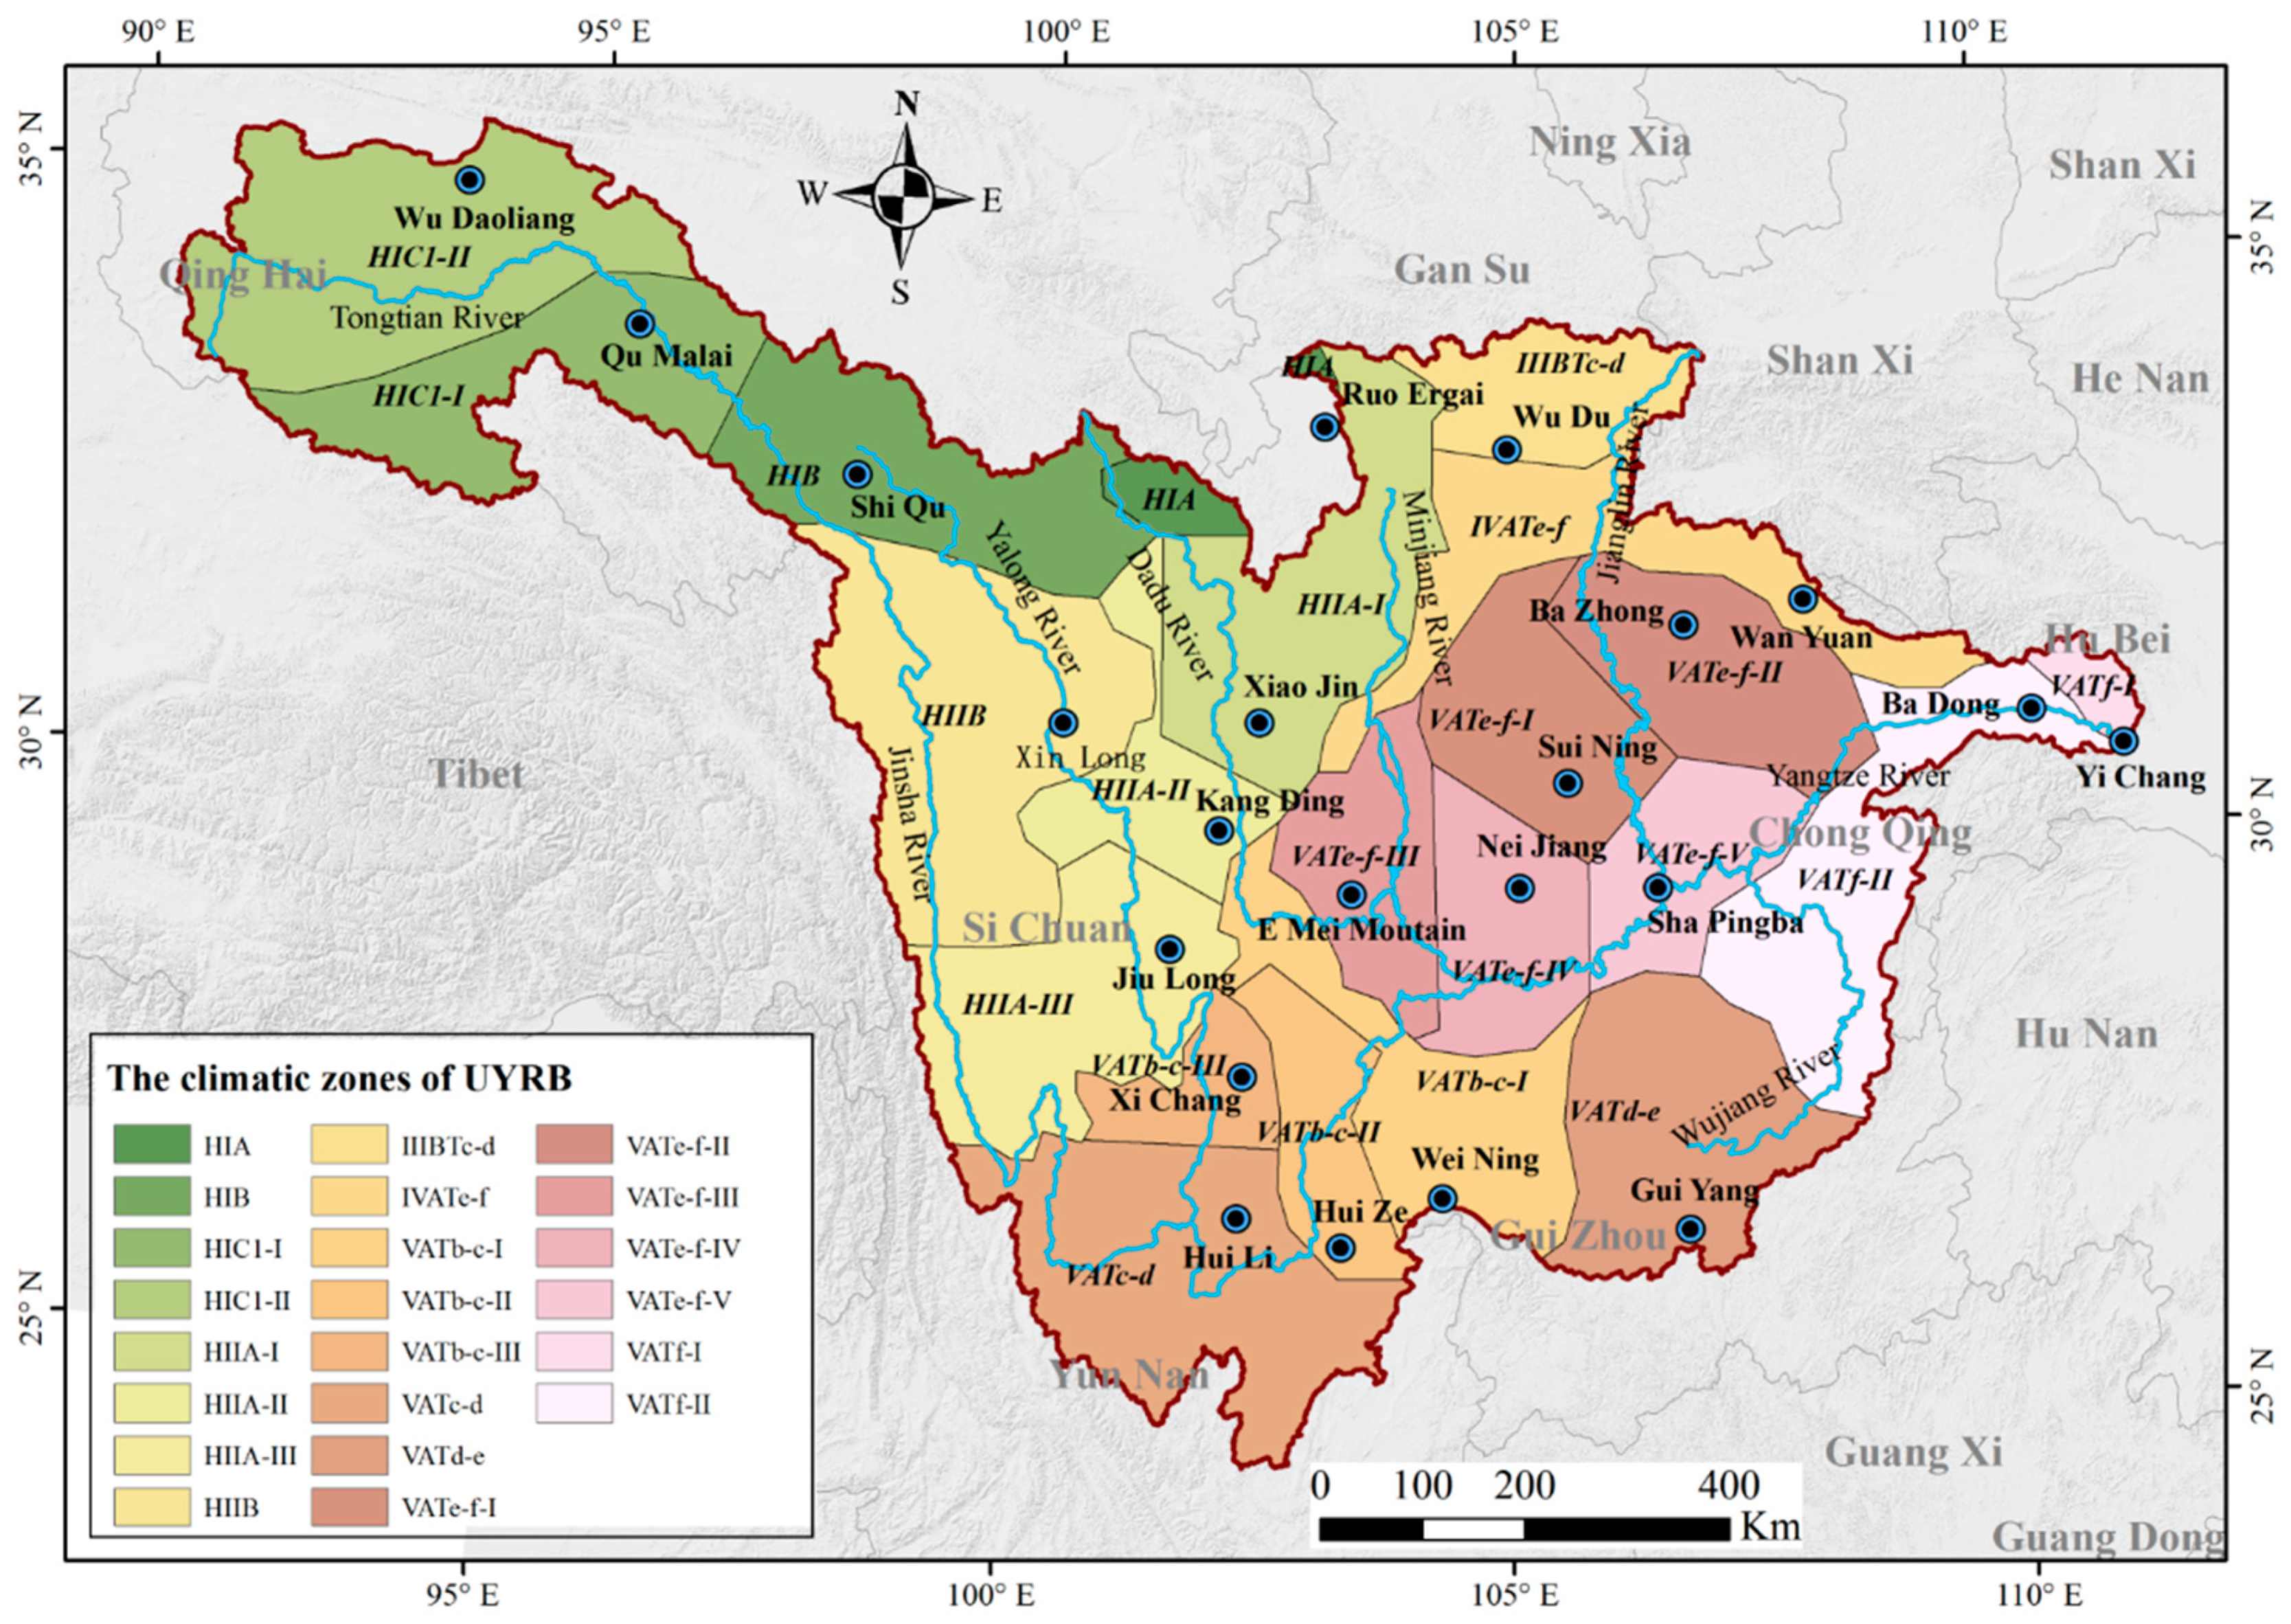
The UYRB is located in inland western China. The main stream of the Upper Yangtze River—from its source to the city of Yichang—has a length of 4511 km and accounts for 70% of the total length of the Yangtze River. The administrative division covers nine provinces in southwestern China (Figure 1), and the drainage area is 1.05 × 10⁶ km2, accounting for 59% of the entire Yangtze River basin. The tributaries in the area cumulatively account for a drainage area of more than 50,000 km2, including the Yalong River, the Dadu River, the Lancang River, the Jialing River, and the Wujiang River. The mean annual runoff of the study area is 277.8 billion m3. The UYRB has a complex terrain and a diverse climate. Precipitation decreases from east to west. The average annual precipitation in the eastern region ranges from 800–1500 mm, and that in the western plateau is 200–800 mm. The study area has a total population of approximately 203 million people with a large contingent of ethnic minorities from Tibet, Yunnan, and Guizhou. The overall economic development of the UYRB is relatively low, except for the developed urban agglomerations of Chengdu, Guizhou, and Guiyang.
2.2. Data
The meteorological and land-use data used in this study are shown in Table 1. Meteorological station data were obtained from the China Meteorological Science Data Sharing Service Network and cover the study area as well as 22 surrounding meteorological stations from 1986 to 2015. Meteorological data from these 22 meteorological stations, including temperature and precipitation, were interpolated using the inverse distance weighting method (IDW) to generate surface data; the interpolation is 91% similar to the results of previous studies [24,25]. We obtained land cover data from the national 10-year ecological environment remote sensing survey, which is divided into six categories: farmland, forest, grassland, shrub land, wetland, and artificial surface.
2.3. Scenario Analysis to Quantify the Impacts of Climate and Land Cover Change on Water Retention
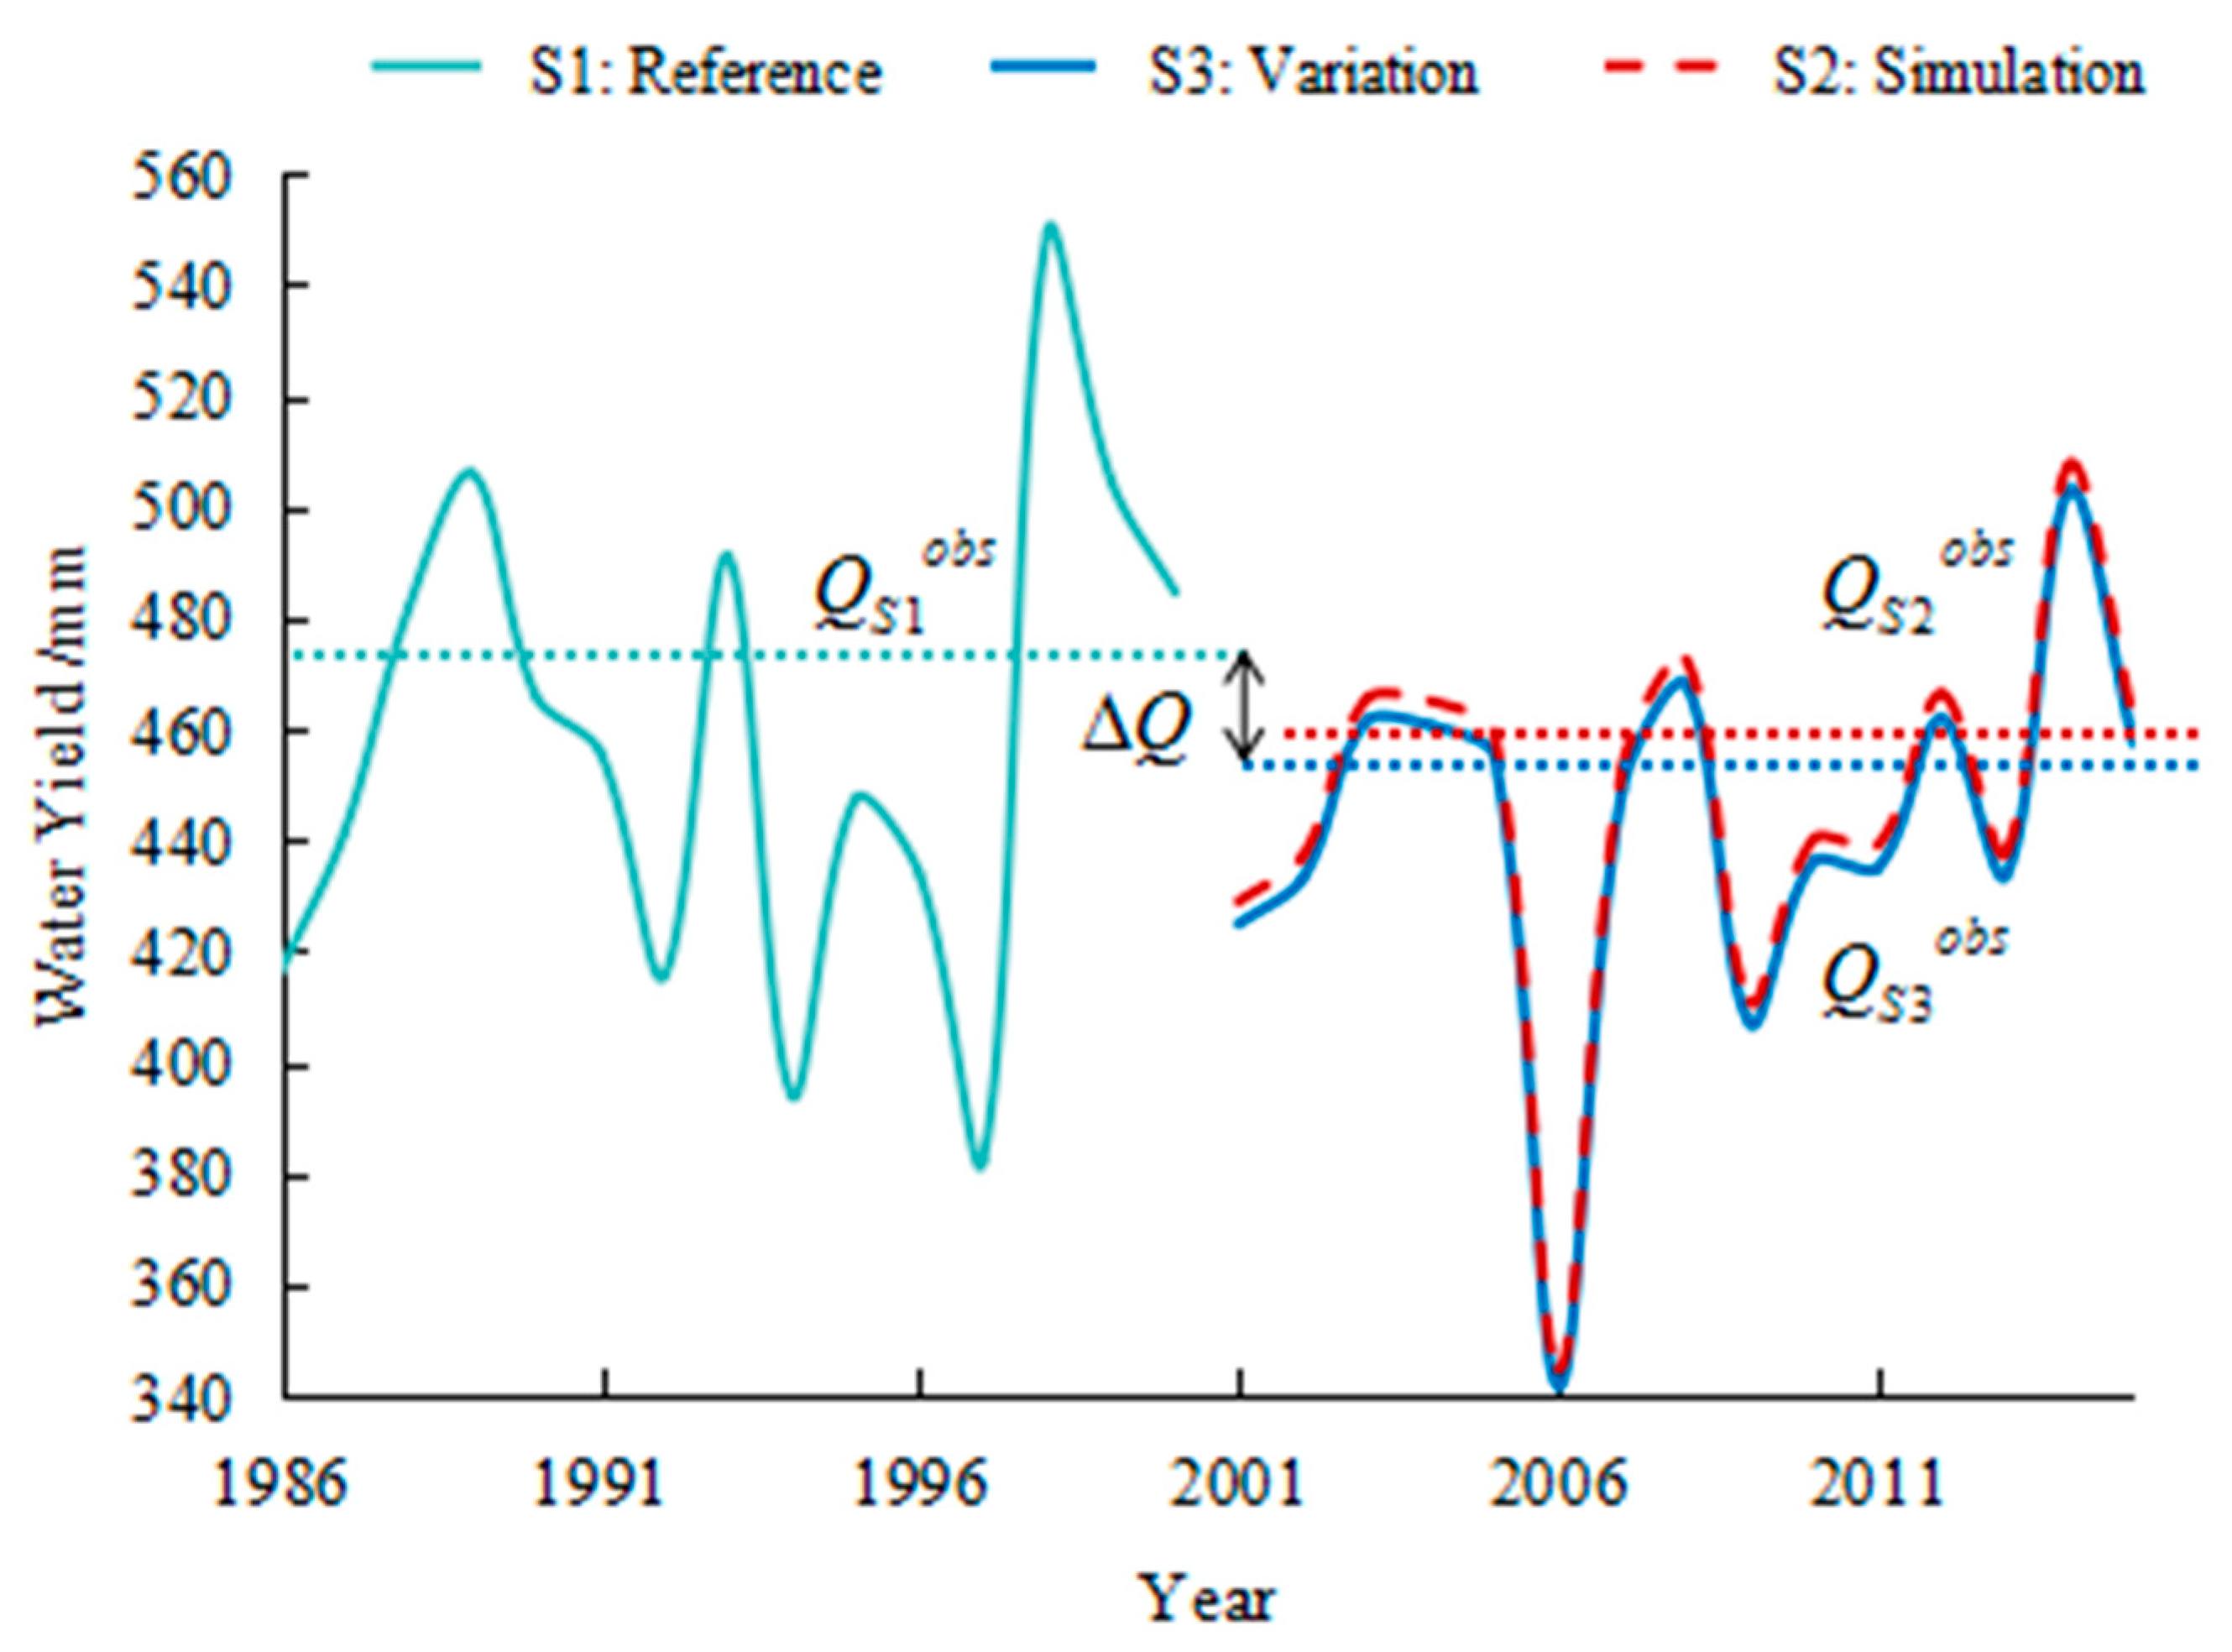
This study used scenario analysis to assess the impact of climate and land-use change on water retention [26]. Scenario 1 (S1) used land cover data from 2000 and annual climate data from 1986 to 2000. Scenario 2 (S2) used land cover data from 2000 and annual climate data from 2001 to 2015. Scenario 3 (S3) used land cover data from 2015 and annual climate data from 2001 to 2015 (Table 2). The difference between S2 and S1 indicates the independent impact of climate change on water retention, and the difference between S3 and S2 represents the change in water retention due to land cover change alone. The difference between S3 and S1 represents the combined impacts of climate and land cover change on water retention services.
The relative impacts of climate change and/or land cover change on water retention change were calculated using Equations (1)–(3):
where is the impact of climate change on water retention change; is the impact of land cover change on water retention change; is the combined impact of climate change and land cover change; , , represents the water retention value in the S1, S2, S3 scenarios respectively, and , , are the average annual value of , , respectively.
2.4. Water Retention Model
Extensive research has been carried out on water retention services [27]. Methods for assessing water retention include: (1) water balance [28]; (2) precipitation storage; (3) the Soil and Water Assessment Tool (SWAT) model; and (4) the InVEST (Integrated Valuation of Ecosystem Services and Tradeoffs tool) model. Among them, the InVEST model ignores the influence of groundwater and the algorithm of the hydrological cycle is simplified, which leads to certain limitations and affects the accuracy and uncertainty of the estimation results [29]. Despite this, however, it has a clear structure, low data requirements, and only considers the input and output of water, which means that the water retention is the difference between precipitation and evapotranspiration and other consumption; it uses a series of physical processes, such as soil infiltration and surface runoff, to estimate the water retention [30,31]. The InVEST model is currently the most widely used ecosystem service function assessment model, especially in water retention assessment [32,33].
During this study, we assessed the ecosystem water supply using the InVEST water yield model to calculate water retention. Using climate and land-use data, the model calculated runoff for each grid in the basin based on the principle of water balance. Water retention in this study was defined as rainfall minus evapotranspiration for each grid unit, which is only an indicator for assessing the amount of surface water, regardless of water quality. The balance between rainfall and evaporation is influenced by soil characteristics, surface cover (land-use type or vegetation cover), and additional meteorological elements. The calculation principle is as follows:
where Yjx is the annual water retention; Px is the annual average rainfall of the grid unit (x); and AETxj is the annual average evapotranspiration of grid unit (x) on land-use type (j) expressed as:
where the ratio of evapotranspiration to rainfall is based on the approximation algorithm proposed by Zhang et al. using the Budyko curve, known as the Zhang coefficient [34]. The Budyko drying index of the grid element (x) on the land-use type (j) is given by , which is defined as the ratio of potential evapotranspiration to rainfall [35];
where k (or ETk) is the crop coefficient, which is the ratio of evapotranspiration (ET) to the reference (potential) evapotranspiration (ET0) in different developmental stages, and:
where Z is the Zhang coefficient, which is a constant that characterizes the seasonal characteristics of precipitation. The value is between 1 and 10; when precipitation mainly is concentrated in winter, it is close to 10, and when precipitation mainly is concentrated in summer or is seasonally distributed, its value is close to 1. AWCx is the available water, which is determined by soil texture, soil depth, and root depth, and is used to indicate the total amount of water that can be used by plants for growth. To correct the ratio of the available water volume to the expected precipitation in the vegetation year, Zhang [34] defines the Zhang coefficient as a non-physical parameter that characterizes the natural climate-soil properties, and:
where MaxSoilDepth is the maximum soil depth, RootDepth is the root depth, PAWCx is the vegetation available water, which is dimensionless and has values between 0 and 1, calculated from soil texture [31].
2.5. Potential Evapotranspiration (ET0) Calculation
Actual evapotranspiration is obtained directly from crop evapotranspiration and multiplied by the empirical crop coefficient (Kc). The 56 Penman–Monteith formula (PM) of the Food and Agriculture Organization of the United Nations (FAO) is the most widely used reference for crop evapotranspiration; it considers aerodynamic impedance and the underlying surface parameters and is based on the theory of energy balance and water vapor diffusion. It is expressed as:
where Rn is the net radiation in MJm–2d–1; G is the soil heat flux MJm–2d–1; is the dry and wet gauge constant in kPa/°C; T is the average temperature at the height of 2 m in °C; Δ is the saturated water vapor pressure–temperature curve slope in kPa/°C; u2 is the wind speed at 2 m height in m/s; es is the saturated water vapor pressure in kPa, and ea is the actual water vapor in kPa.
The crop coefficient (Kc) reflects the difference between the actual crop and the reference crop, as determined by crop height, surface albedo, canopy resistance, and soil evaporation. The FAO recommends the piecewise single-valued average method to determine the crop coefficient, which categorizes the changes in crop coefficient during the entire growth period into four stages and applies three crop coefficient values: Kcini, Kcmid, and Kcend. Seen in the initial growth period, the crop coverage rate from seeding to surface crop is close to 10% and the corresponding crop coefficient is Kcini. During the rapid development period, from a surface crop coverage rate of 10% to 70% or 80%, the corresponding crop coefficient rises linearly from Kcini to Kcmid. Observed in the mid-fertility period, from full coverage to maturity, leaves begin to turn yellow and the corresponding crop coefficient is Kcmid. During maturity, from leaf yellowing to physiological maturity or harvest, the corresponding crop coefficient decreases linearly from Kcmid to Kcend. Regarding forests, the leaf area index is usually applied to represent the crop coefficient [36].
2.6. Climate Zone
2.7. Statistical Analysis
We used the Pearson correlation to determine the correlation coefficient between the different climate factors and water retention.
To separate the effects of climate change and land cover on water retention, we first obtained the raster layer of the average annual water yield of each pixel (1 km × 1 km) in the study area for each of the three scenarios. We then calculated the difference between each scenario using the grid calculator in ArcGIS.
To statistically analyze the change of land cover in the study area, we referred to the land cover transition matrix [38] (Table 4) to analyze the quantitative structural characteristics of land cover change and the direction of land cover change in a region of two periods based on land cover area.
Rows in Table 4 represent the land-use type at the time T1, and columns represent land-use type at the time T2. Pij, in Equation (10), represents the area converted from land-type i to land-type j during T1–T2 and S, in Table 4, represents the total area of the study area.
where is the difference between the area converted from land-type i to land-type j and the area converted from land-type j to land-type i during T1–T2; when > 0, the final change is from land-type i to land-type j, and the amount of conversion is ; when < 0, the final change is from land-type j into land-type i, and the amount of conversion is ; is the proportion of conversion between land-type i and land-type j to the total change of land-type i or j.
3. Results
3.1. Climate Change
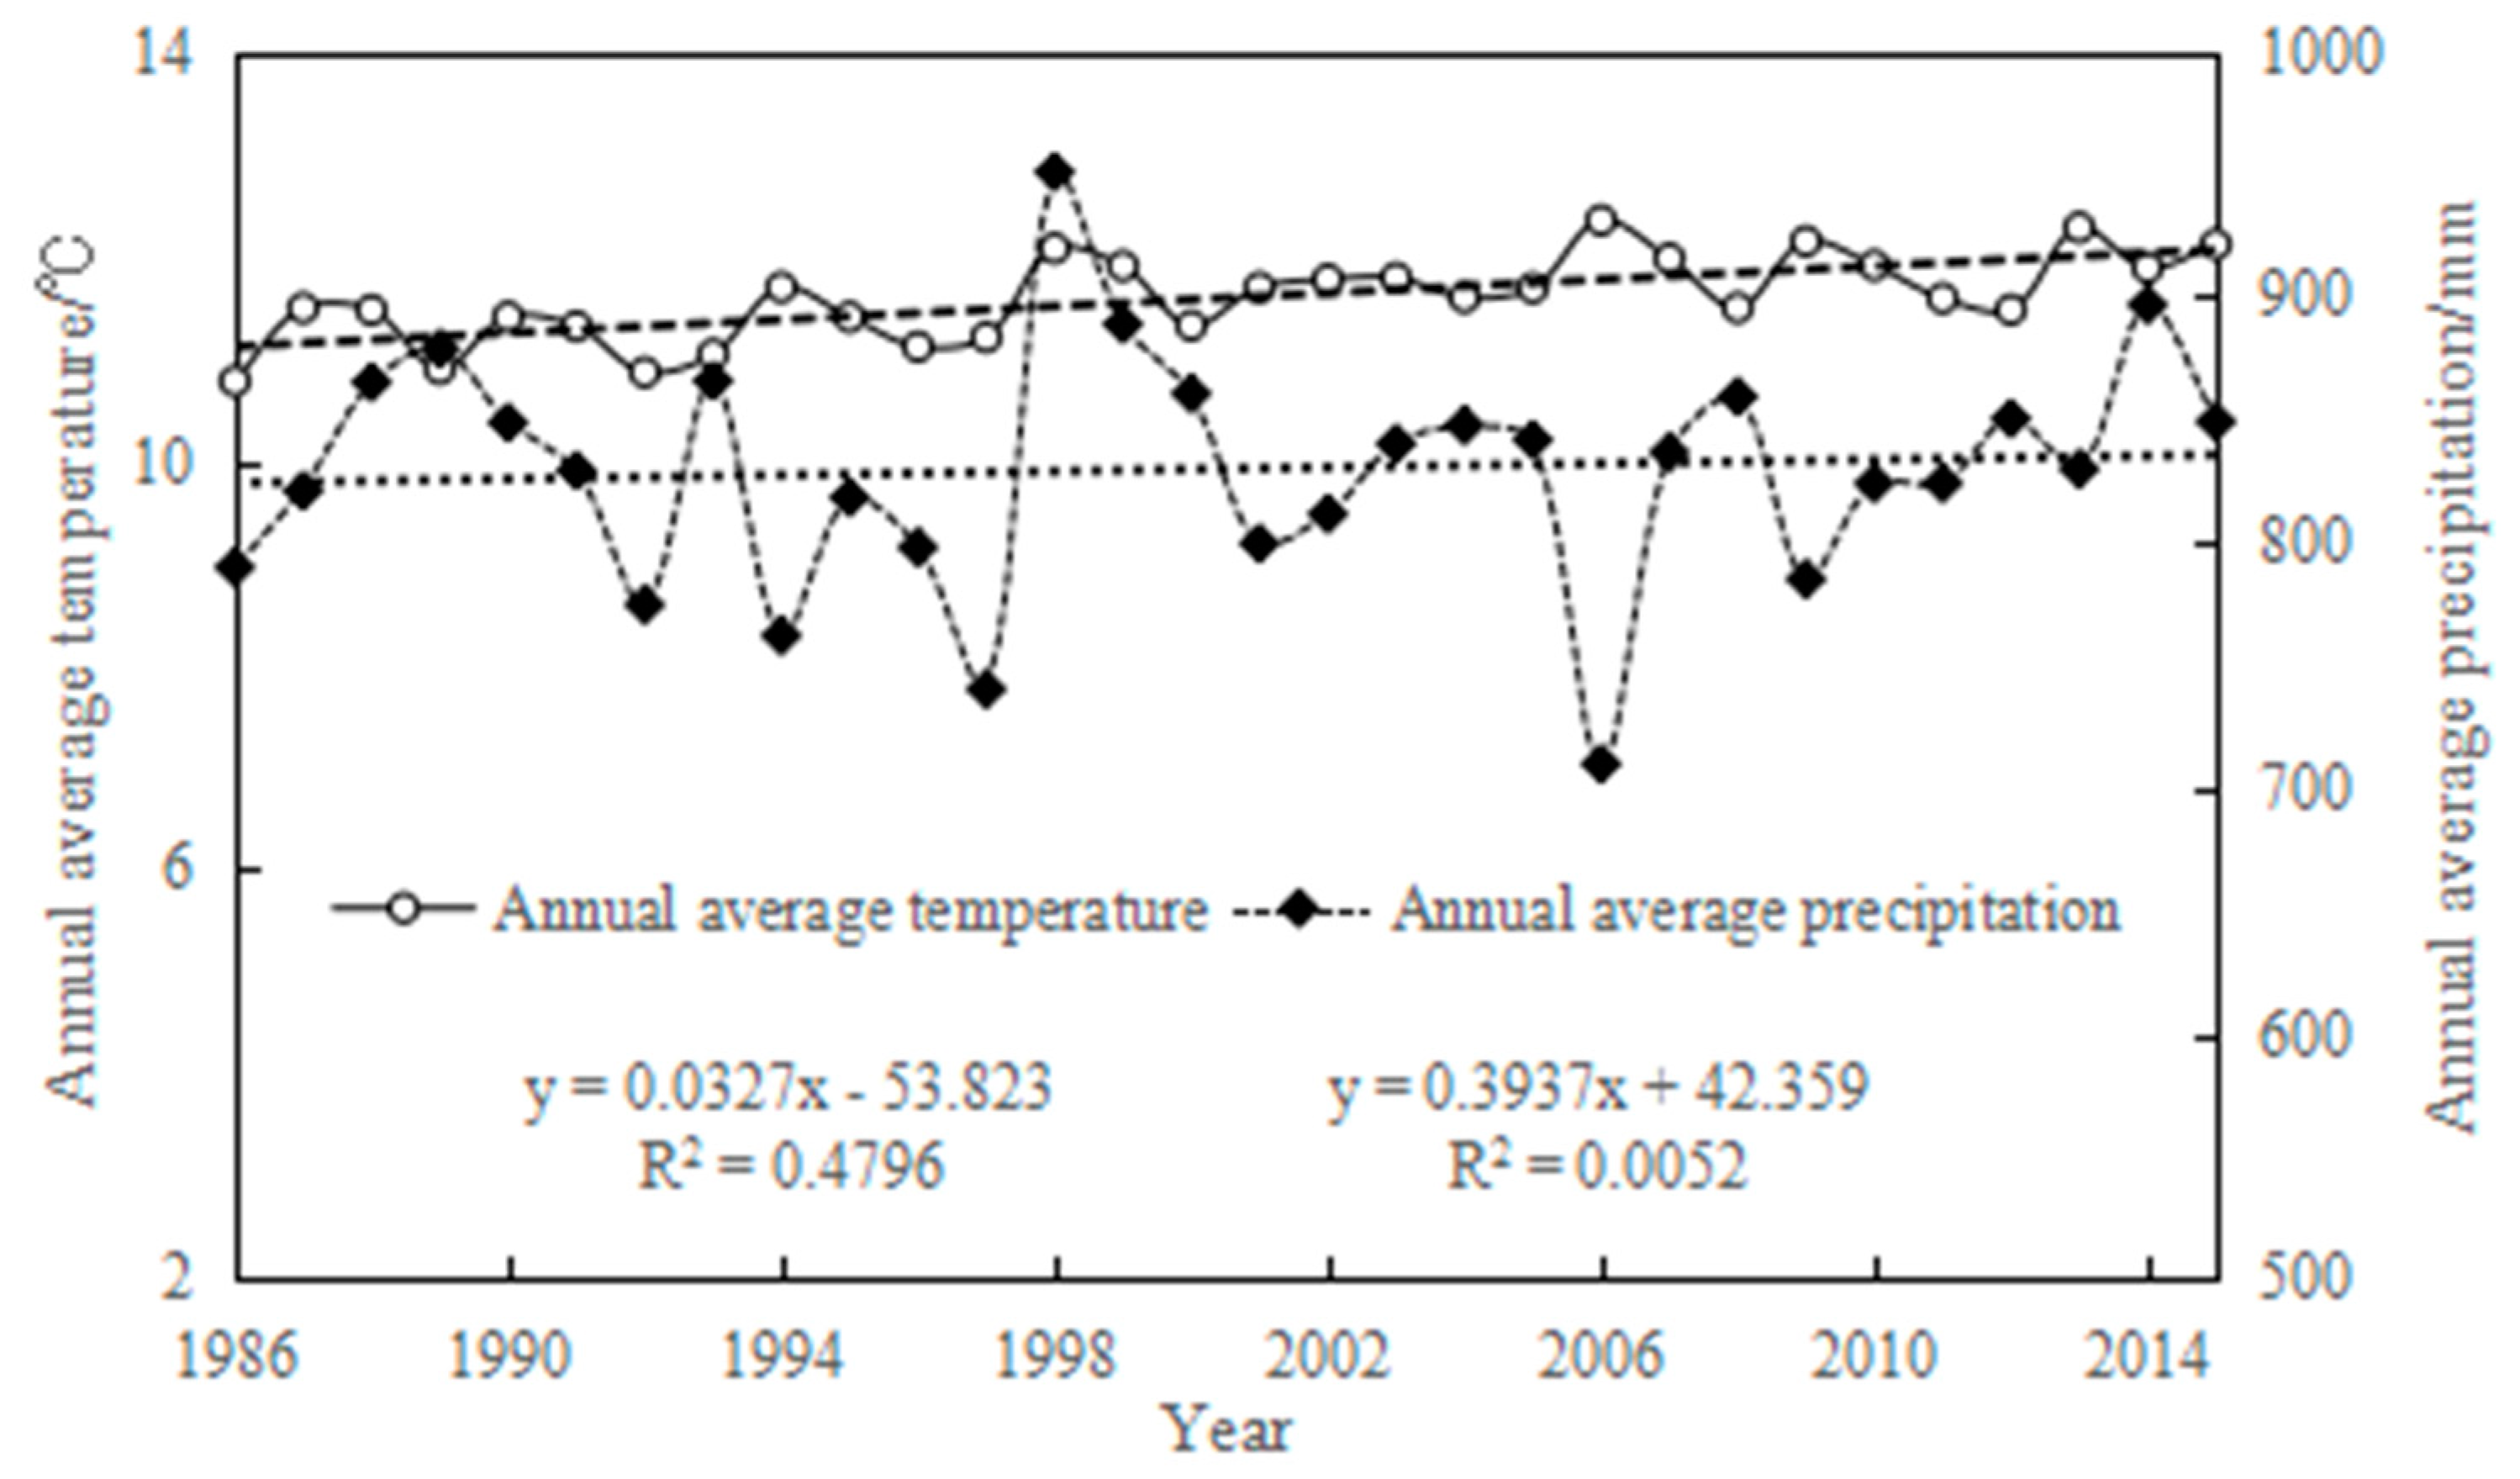
Overall, climate in the UYRB is warm and humid with fluctuating temperatures and precipitation. The lowest annual average temperature was observed in 1986 at 10.77 °C, and the highest annual average temperature was observed in 2006 at 12.35 °C. The average annual precipitation has increased over the past 30 years (Figure 3); the highest annual precipitation was observed in 1998 (950.71 mm) and the lowest annual precipitation was observed in 2006 (709.86 mm).
The HIC1-II zone experienced both the lowest average annual precipitation (117.47 mm) and the lowest average annual temperature at −1.73 °C from 1986 to 2015. The highest average annual precipitation was observed in the VATf-II zone (975.68 mm; Figure 4a), and the highest temperature was observed in the VATe-f-V zone (17.73 °C; Figure 4b). The annual precipitation variation of the VATe-f-II zone fluctuated the most, with a range of 161.68 mm, and the HIC1-II zone had the lowest fluctuation in annual precipitation variation, with a range of 37.06 mm. The annual temperature variation of the HIC1-I zone fluctuated the most, with a range of 0.61 °C, and HIIA-I and HIIA-II zone had the least fluctuation in annual temperature variation, with a range of 0.42 °C.
3.2. Land-Cover Change
The main land cover types in the study area are forests, grasslands, and farmlands. Farmland ecosystems are concentrated within the Sichuan Basin; however, a large number of scattered farmland areas also are located in the upper reaches of the Jialing River basin in the north and on the Yunnan-Guizhou Plateau in the south. Natural ecosystems, such as forests and grasslands, account for 60.20% of the study area (Figure 5).
Observing data from 2000, forest ecosystems accounted for 31.61% of the total area of the UYRB, followed by grassland ecosystems (27.74%), farmland ecosystems (21.37%), shrubland ecosystems (16.84%), and wetland ecosystems (2.44%). During 2015, forest ecosystems accounted for 32.23% of the area, followed by grassland ecosystems (27.97%), farmland ecosystems (20.16%), shrubland ecosystems (17.10%), and wetland ecosystems (2.54%). Therefore, from 2000 to 2015, forest ecosystems saw the greatest increase (by 5527 km2 or 1.96%), followed by shrubland ecosystems (2370 km2 or 1.58%), and grassland ecosystems (1999 km2 or 0.8%); farmland ecosystem areas showed the greatest decrease (by 10,772 km2 or 5.66%; Table 5).
The areas of the farmland and forest changed the most from 2000 to 2015, while changes in other land-types were relatively small. All told, 45,304, 20,270, and 11,456 km2of the farmland was replaced by forests, shrubland and grasslands, respectively; conversely 39,038, 17,994, and 9787 km2 of forests, shrubland and grasslands were replaced by farmland. As such, the decrease in farmland was due mainly to conversion into forests (6266 km2 or 58.17%), shrubland (2276 km2 or 21.13%), and grasslands (1669 km2 or 15.49%). The increase in forested land area was mainly from farmlands (88.09%) and shrublands (0.76%). The increase in shrubland area was mainly from farmlands (80.14%) and grasslands (11.58%). The increase in grassland area was mainly from farmlands (62.82%) and forests (21.11%). The increase in wetland areas was mainly from farmlands (52.33%), forests (21.64%) and shrublands (16.88%).
3.3. Spatiotemporal Variation Characteristics of Water Yield
We applied the ArcGIS watershed extraction method to divide the UYRB into eight major river basins (Figure 6). The upper reaches of the Jinsha River accounted for the largest proportion of the study area (21.65%), followed by the Jialing River basin (16.31%), the Wujiang River basin (8.87%), and the Tuojiang River basin (2.63%). Average water retention values in the Wujiang River basin and the Tuojiang River basin were 670.29 mm and 660.36 mm, respectively. The Yalong River basin had the lowest water retention value (384.56 mm). Through analysis of water retention contribution to the UYRB, we found the highest contribution from the Jialing River basin (17.13%) followed by the Minjiang River basin at (16.04%). The Tuojiang River basin had the lowest contribution (3.84%).
We analyzed hydrological sites of the main tributaries of the UYRB using the 2015 simulation results. The largest error was observed in the upper reaches of the Jinsha River, for which the simulation results were 35.96% higher than the observed values according to the subtraction value (Table 6). The smallest error was observed in the Yalong River basin, for which the simulation results were 14.54% lower than the observed values. Since we only were able to obtain observable values for 5 sub-watersheds, and the average errors were below 25%, these results indicate that the water retention assessment findings meet the research requirements.
Our results show higher water retention in the southeast relative to the northwest of the UYRB, with the highest water retention (1050 mm) observed in the central Emeishan region (Figure 7). The water retention values in Sichuan, Chongqing, and Guizhou were mostly more than 600 mm, while most of the study area (such as Gansu and Qinghai) did not exceed 300 mm. We observed an increase in water retention in the southeastern part of the region, in data from 1986 to 2015, and a decrease in water retention in most other regions (Figure 7). The largest average changes in water retention were observed in Guizhou, Qinghai, Chongqing, and other regions, while the remaining areas showed small interannual variability. Considering the basin scale, the largest rate of change was observed in the Chuanjiang River basin and the Wujiang River basin. The average annual water retention in the UYRB, from 1986 to 2015, ranged from 340.47 to 549.31 mm, and the total water amount ranged from 3347.16 to 542.026 billion m3. The observed decrease in water retention is not significant (Figure 7), and the inter-annual variability is relatively stable. The annual average water retention reduction rate was 2.97 mm every 10 years (2.97 mm/10a), and the peak of water retention occurred in 1998. We observed the largest increase in water retention in 1998, reaching 166.87 mm, and the lowest water retention in 2006. The maximum reduction in water retention was observed from 2005 to 2006 (118.81 mm).
3.4. Impact of Climate and Land Cover on Water Yield
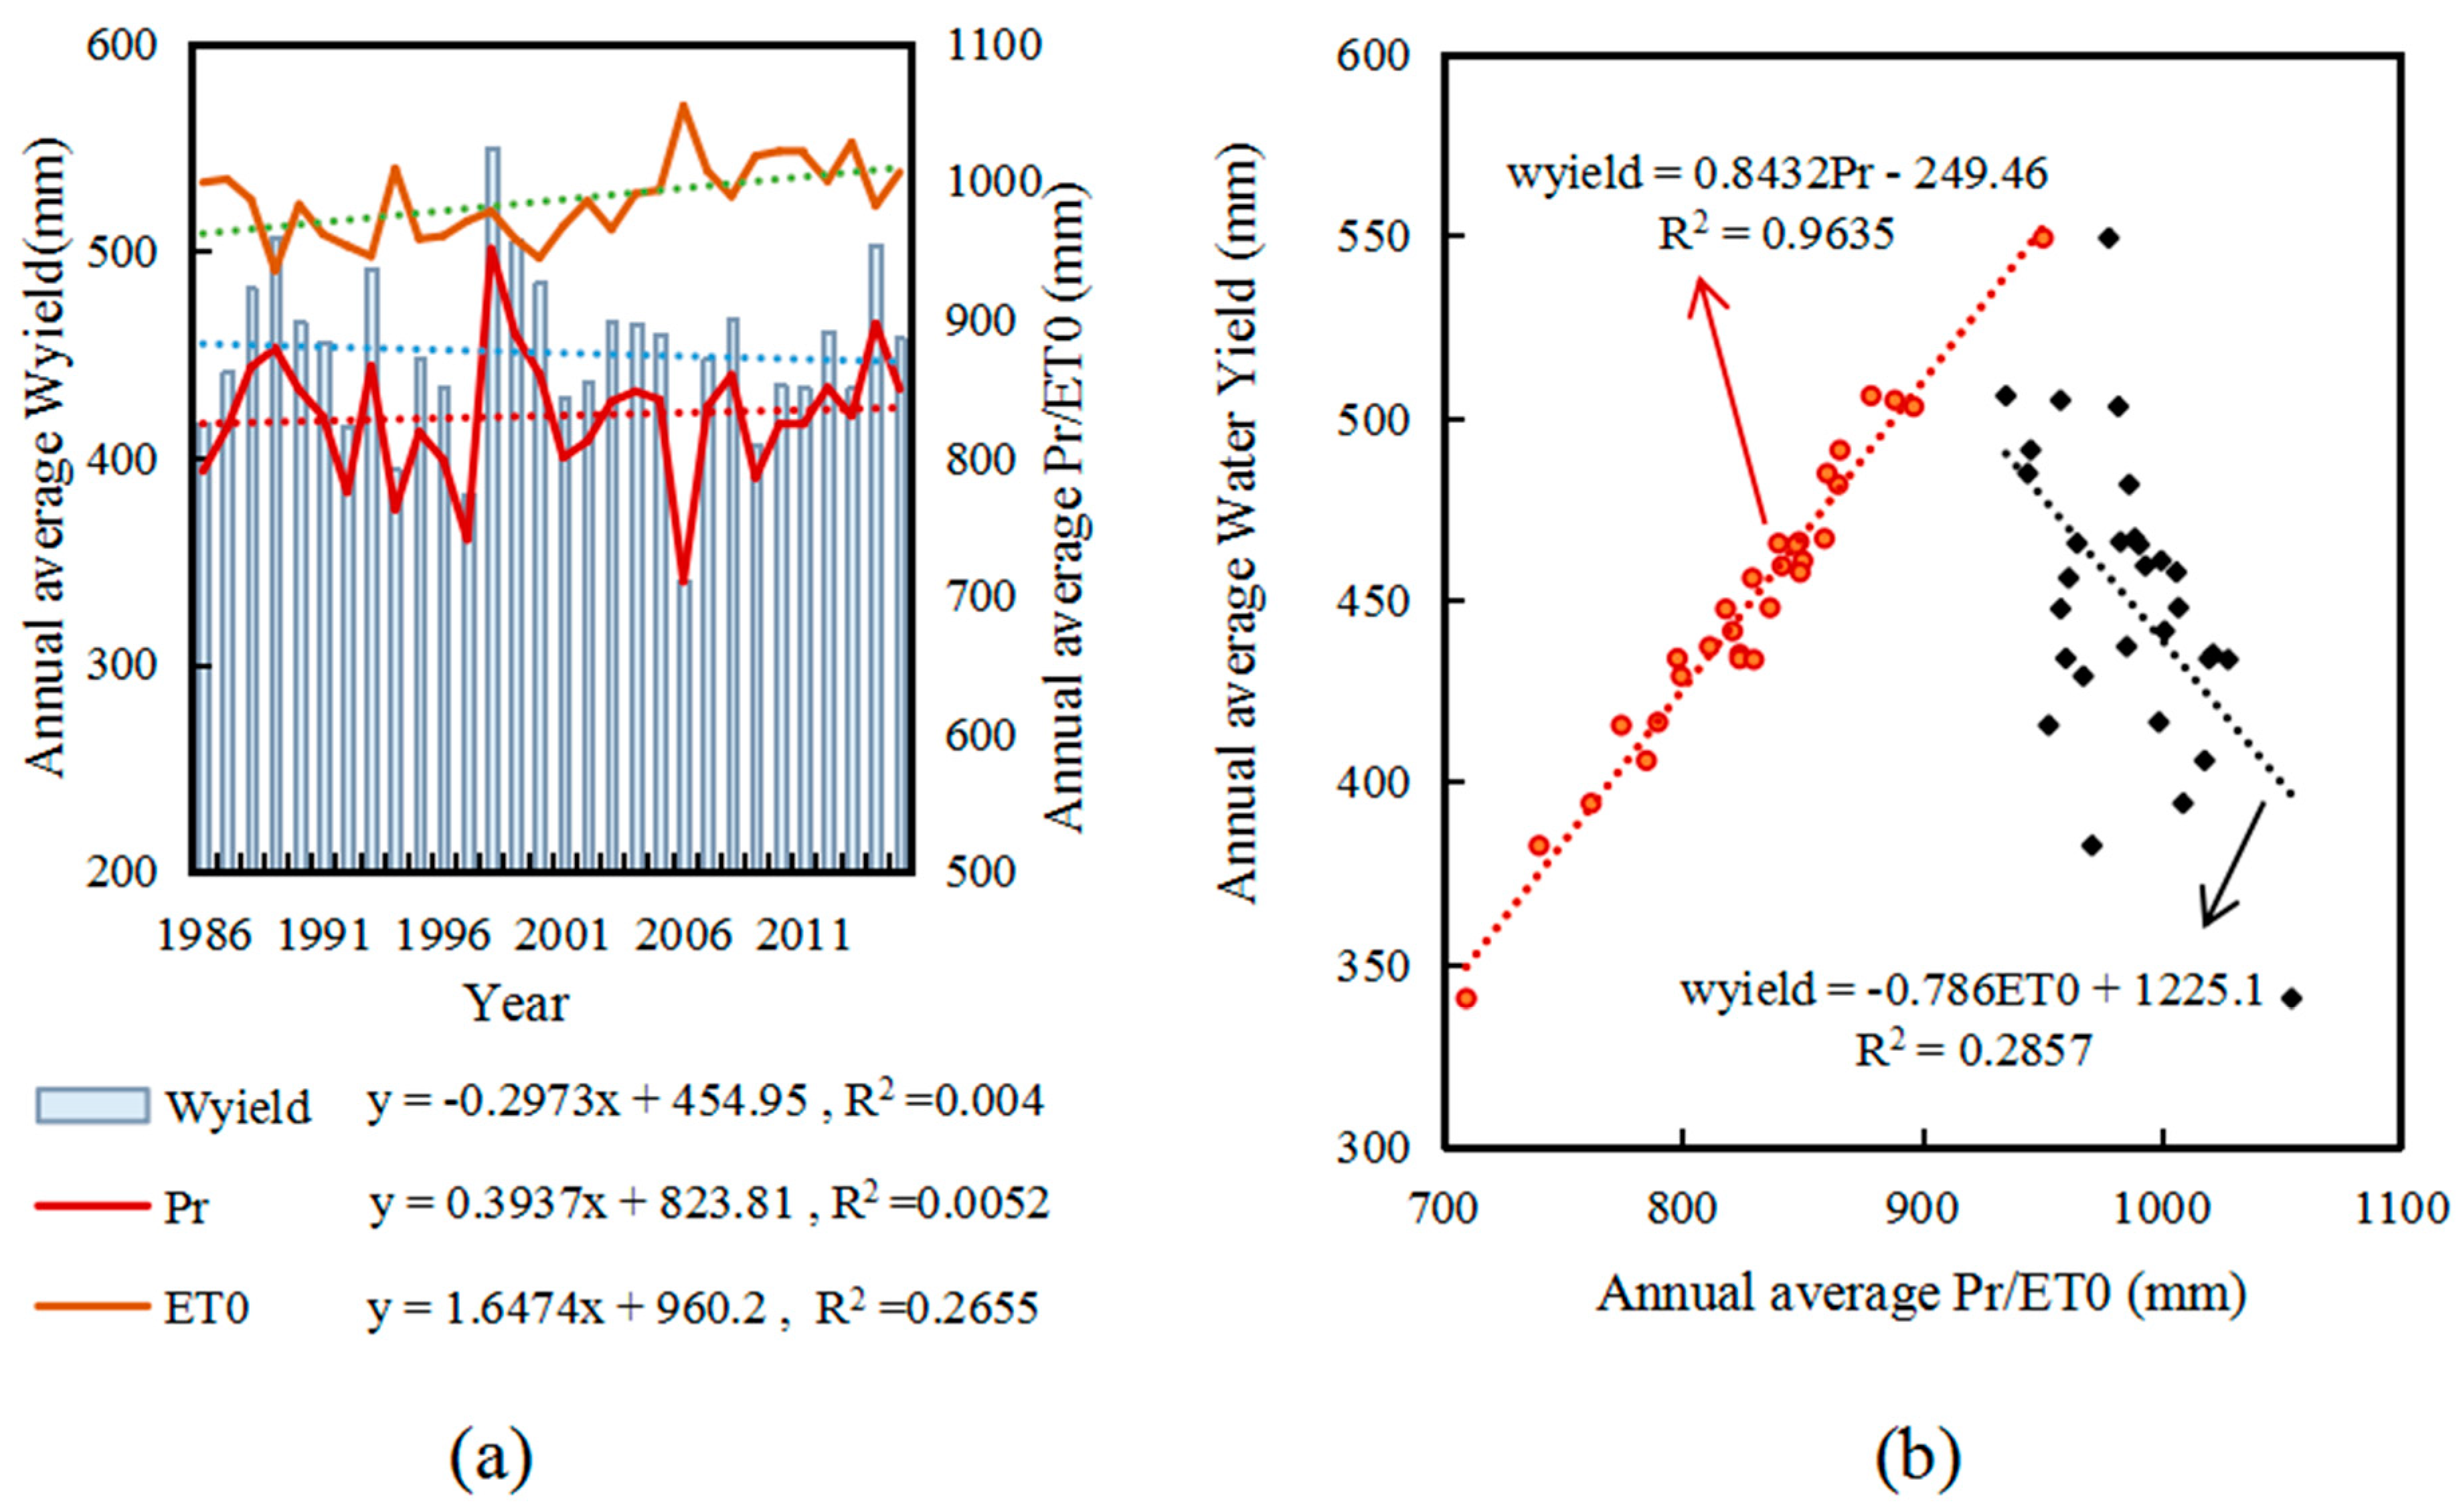
Over the past 30 years, precipitation in the UYRB has ranged from 709.86 to 950.71 mm, and ET0 between 935.18 and 1054.44 mm (Figure 8a,b). Regression analysis shows that ET0 in the UYRB has increased significantly over the past 30 years (p < 0.01; Figure 8). We also observed a less obvious increase in annual precipitation and a slight decrease in annual water retention, The average annual ET0 in the UYRB was 985.74 mm from 1986 to 2015; the maximum ET0 occurred in 2006 (1054.44 mm), the minimum occurred in 1989 (935.18 mm), and the average annual growth rate was 16.47 mm/10a. The highest annual precipitation was observed in 1998, reaching 950.71 mm. The lowest annual precipitation was observed in 2006 at 709.86 mm. The rate of increase in annual precipitation was 3.94 mm/10a.
A significant positive correlation between water retention and annual precipitation (R = 0.982, p < 0.01) and a significant negative correlation between water retention and ET0 (R = −0.535, p = 0.002) was observed (Figure 8b). Precipitation is evidently the dominant factor influencing water retention in the UYRB. However, evapotranspiration of vegetation also plays an important role in effectively regulating the redistribution of precipitation.
We used the five types of land-use as statistical units to calculate the average water conservation of different land-use types. Our results demonstrate the highest water retention in farmland ecosystems (704.47 mm), followed by forest ecosystems (474.07 mm), shrubland ecosystems (413.00 mm), grassland ecosystems (347.20 mm), and wetland ecosystems (281.72 mm; Table 7). All told, farmland and forest ecosystems contributed the highest water resources at 28.72% and 28.56%, respectively, and wetland ecosystems contributed the lowest resource at only 1.50%.
According to the calculation results of three different scenarios (Figure 9), the average annual water retention in the reference period () was 458.01 mm; the average annual water retention in the variation period () was 441.85 mm; the average annual water retention in the simulation period () was 445.99 mm.
The impacts of climate and land-use change were quantified using Equations (1)–(3). The change in both land cover and climate resulted in a 16.16 mm decrease in water retention; a 4.14 mm decrease can be attributed to land cover change, while climate change reduced water retention by 12.02 mm. Our annual assessment value suggests that the climate change impact on water retention is greater than the impact of land cover change. However, when we considered local spatial differences, we find that the impacts of climate change and land cover change on water retention differ (Figure 10). Only under the impact of climate change did we find that water retention change had significant spatial differences (Figure 10a). We observed a significant increase in water retention in HIC1-II zone (+33.71 mm), HIC1-I zone (+27.57 mm) and IVATe-f zone (+4.13 mm), for example, while significant decreases were observed in the VATe-f-Vzone (−33.04 mm) and VATe-f-IIIzone (−20.83 mm). Under the impact of land cover change alone, regional differences in water retention change were not obvious (Figure 10b) and would reduce the obvious regional differences caused by climate change when superimposing the combined impacts of both (Figure 10c). Under the combined influence, water retention in the HIC1-II zone increased by 30.01 mm, that in the HIC1-I zone increased by 13.74 mm, and that in the IVATe-f zone increased by 1.92 mm.
The relative changes of climate and land cover differed in different climate zones and, thus, their contributions to water retention change were also different. The largest reduction in water retention was found in the VATc-d climatic zone (60.80 mm; Figure 10d), 97% of which was caused by climate change. The largest increase in water retention was found in the HIC1-II climatic zone (30.01 mm), 90% of which was caused by climate change. Generally, the impact of climate change on water retention was greater than the impact of changing land-use, but local variability was observed. Water retention in 17 of the 22 climatic zones was affected by climate change. The remaining five meteorological zones showed insignificant changes in water retention, and the impact of land-use change was greater than that of climate change, particularly for zones IIIBTc- d and HIA, where changes in land cover contributed to more than 90% of the change in water retention. Among the 22 climate zones, more were impacted mainly by climate change (77.27%) than were impacted mainly by land cover change (22.73%). The water retention value of the IIIBTc-d zone was −5.01 mm, 5.57 mm of which was reduced by land cover change where 50.38% of the land had been converted to forests and shrublands during the 15 year period. The area affected by climate change corresponded to the area that experienced significant changes in precipitation, and regional climate differences were reflected mainly in precipitation; changes in precipitation in areas with obvious climate change included the HIC1-II zone (37.06 mm), IVATe-f zone (114.14 mm) and VATe-f-Vzone (137.89 mm); however, temperature changes in these areas were relatively small—HIC1-II zone (0.59 °C), IVATe-f zone (0.47 °C) and VATe-f-Vzone (0.51 °C). A significant positive correlation (R = 0.882) was observed between water retention and precipitation caused by climate change. These findings suggest that climate change has an impact on water retention processes on longer timescales and over larger areas, while land cover change has smaller scale impacts over shorter timescales.
4. Discussion
4.1. Regional Variability
The results of this study show that increasing potential evapotranspiration is the dominant climatic factor influencing water retention reduction, while precipitation only exerts a local influence. The degree of influence between the two climatic factors also varies depending on whether conditions are wet or dry, which agrees with recent climate change research in the source area of the Yellow River [11]. Some studies have shown that the impact of climate change on runoff is more pronounced than that of land cover change [39]. Conversely, other studies have shown that human activities play a major role in water flow changes [40]. Measurements of watershed elasticity and decomposition in the Wuding River basin demonstrate that both human activity and climate change contribute to the effects of flow changes (by 65% and 35%, respectively) [41], for example. Our results show significant regional variability in the impacts of climate and land cover change on water retention services [42]. The temporal impacts of climate change are more pronounced than the spatial observations. Since different land types show large differences in their water retention capacity on a local scale, changes in land cover will have significant impacts on water retention.
The diverse geomorphological and climatic conditions in the UYRB result in large regional differences in water retention. Similar research has been carried out in other regions of the world. Remote sensing data from Australia’s Murray–Darling basin found significant regional variability in water retention, with climate change accounting for 70% of the variability [18]. The combined effects of climate and land-use change also were assessed using SWAT in a small Columbian watershed of less than 200 km2 [19]; the results indicated that climate and land-use change determine water yield within this watershed. A similar study in a small West African watershed discovered that land cover amplified climate change impacts on water retention [20]. The impact of future climate change on the tributaries of the Ganges River was found to accelerate the impacts of changing land cover on water retention [23]. Alternately, combined effects of land cover and climate change on water retention were not observed in the vicinity of the Baltic Sea, where the impacts of forest cover on runoff and water resources were assessed over a 40-year period [21]. Existing research has focused on climate and land-use change and their impacts on water resources, and most studies have demonstrated regional variations in the contributions of climate and land-use change to water retention. However, the regions examined in these studies are far less complex than the UYRB, both in scope and regional complexity, owing to the high climatic and geomorphological variability of the UYRB.
4.2. Adaptive Management
Owing to the high level of uncertainty, climate change poses a significant challenge to the future provision of water retention services [43]. Since there is a time lag between the adoption of climate change mitigation goals and their achievement, adaptive management is necessary to address climate change impacts on water retention capacity [44]. Altering land cover is a direct and effective way of adapting to climate change. Land protection can mitigate the degradation of ecosystem services caused by climate change [45]. The Chinese government has implemented many conservation projects and measures that have played an active role in ecosystem protection [46]. Since 2000, conservation projects such as returning farmland to forests and the implementation of forest protection measures have influenced changes in land cover and accelerated the conversion of shrubland and farmland to forests. Although water resources have declined slightly over the years, water and soil purification have improved significantly owing to these conservation interventions [47].
Land cover is easier to predict and manage relative to climate change. To a certain extent, land cover management can mitigate the impacts of climate change on river basin hydrology by altering the characteristics and water resource availability of the watershed [47]. The results of this study demonstrate the combined effect of both climate and land cover change on water retention on a regional scale, thereby providing a basis for an integrated approach toward river basin management. Owing to the highly varied geomorphology and climatology of mountain basins, the degree of impact from climate change varies significantly between regions. Climate change in some regions has a more dominant impact than land-use, while in other areas, land cover contributes >70% of the change in water retention. As most land cover change projects, such as returning farmland to forests, only occurred in local areas, and there were no large-scale overall changes, land cover changes in local areas were relatively large and had a greater impact on water retention. However, climate change on a long-term scale or a large spatial extent was more obvious [48] and, thus, the impact of land cover change on water retention change was greater than the impact of climate change.
4.3. Limitations
To assess the relative impacts of climate change and land cover change on water retention, we implemented scenario analysis using climate and land cover data as independent variables, similar to the residual trend method [45]. However, climate factors influence not only the hydrological cycle through their impact on precipitation and potential evapotranspiration but, also, watershed characteristics and land cover patterns through the effect of runoff [49]. Some other studies have used the Budyko framework to assess the impacts of climate and land-use change on water resources [50]. This framework uses a multi-year average of variables to separate the contribution of climate change and human activities on long-term runoff patterns. Additionally, further uncertainty can arise depending on each study’s chosen baseline period, which influences the individual effects of climate and land cover on hydrology [51].
5. Conclusions
Water retention is considered an important ecosystem service due to its impact on freshwater availability. Climate change has been shown to both directly and indirectly affect water retention capacity. During this study, we analyzed the impacts of both climate change and land cover on water retention in the UYRB—a river basin that has varied climate and rich biodiversity. We used the InVEST model to assess ecosystem water supply and scenario analysis to determine the relative contributions of climate change and land-use on water retention. Our results demonstrate that climate change has a greater impact on water retention services for larger watersheds than land cover change. Water retention fell by 16.16 mm, while land-use change and climate contributed 25.6% and 74.4%, respectively. However, five among 22 climate zones were impacted mainly by land cover change (22.73%), which indicated the effects of land cover can exceed those of climate change on water retention at smaller spatial scales. Owing to the uncertainty of climate change, land management can be an important measure to minimize future climate change impacts on water supply. A tailored and integrated approach on a regional scale toward climate and land-use management in different regions can mitigate effectively the impacts of climate change on ecosystem services.
Author Contributions
Data curation, Y.G.; Formal analysis, P.X.; Funding acquisition, P.X.; Investigation, Y.G.; Methodology, B.F.; Project administration, P.X.; Resources, B.F.; Supervision, B.F.; Validation, Y.G.; Visualization, Y.G.; Writing – original draft, P.X.; Writing – review & editing, B.F.
Funding
This study was sponsored by the Natural Science Foundation of China: Coupled relationship and regulation mechanism between rural livelihoods and ecosystem services in the Three Gorges Reservoir Area (No. 41371539), The Science and Technology Service Network Initiative of Chinese Academy of Sciences (No. KFJ-STS-ZDTP) and Chinese Academy of Sciences project: Land Development Patterns Optimization of Mountainous Areas in Southwest China (No. Y7K2260263). The authors hereby would like to express their thanks.
Conflicts of Interest
The authors declare no conflict of interest.
References
- MEA. Millennium Ecosystem Assessment: Ecosystems and Human Well-Being: A Framework for Assessment; Island Press: Washington, DC, USA, 2003. [Google Scholar]
- Costanza, R. Ecosystem services: Multiple classification systems are needed. Conserv. Biol 2008, 141, 350–352. [Google Scholar] [CrossRef]
- Fisher, B.; Turner, R.K.; Morling, P. Defining and classifying ecosystem services for decision making. Ecol. Econ. 2009, 68, 643–653. [Google Scholar] [CrossRef] [Green Version]
- MEA. Millennium Ecosystem Assessment. Ecosystems and Human Well-Being: Synthesis; Island Press: Washington, DC, USA, 2005. [Google Scholar]
- Schroter, M.; Albert, C.; Marques, A. National Ecosystem Assessments in Europe: A Review. BioScience 2016, 66, 813–828. [Google Scholar] [CrossRef] [Green Version]
- Ouyang, Z.; Zheng, H.; Xiao, Y.; Polasky, S.; Liu, J.; Xu, W.; Wang, Q.; Zhang, L.; Xiao, Y.; Rao, E.; et al. Improvements in ecosystem services from investments in natural capital. Science 2016, 352, 1455–1459. [Google Scholar] [CrossRef]
- Future, E. Future Earth Initial Design; International Council for Science (ICSU): Paris, France, 2013. [Google Scholar]
- Piao, S.; Ciais, P.; Huang, Y.; Shen, Z.; Peng, S.; Li, J.; Zhou, L.; Liu, H.; Ma, Y.; Ding, Y.; et al. The impacts of climate change on water resources and agriculture in China. Nature 2010, 467, 43–51. [Google Scholar] [CrossRef]
- Arnell, N.W.; Lloyd-Hughes, B. The global-scale impacts of climate change on water resources and flooding under new climate and socio-economic scenarios. Clim. Chang. 2014, 122, 127–140. [Google Scholar] [CrossRef]
- Runting, R.K.; Bryan, B.A.; Dee, L.E.; Maseyk, F.J.F.; Mandle, L.; Hamel, P.; Wilson, K.A.; Yetka, K.; Possingham, H.P.; Rhodes, J.R. Incorporating climate change into ecosystem service assessments and decisions: A review. Glob. Chang. Biol. 2016, 23, 28–41. [Google Scholar] [CrossRef]
- Yin, Y.H.; Wu, S.H.; Zhao, D.S.; Dai, E.F. Ecosystem water conservation changes in response to climate change in the Source Region of the Yellow River from 1981 to 2010. Geogr. Res. 2016, 35, 49–57. [Google Scholar]
- Nie, Y.H.; Gong, B.; Li, Z. The spatial-temporal variations of water conservation capacity in Qinghai-Tibet Plateau. Earth Sci. Front. 2010, 17, 373–377. [Google Scholar]
- Pan, T.; Wu, S.H.; Dai, E.F.; Liu, Y.J. Spatiotemporal variation of water source supply service in Three Rivers Source Area of China based on InVEST model. Chin. J. Appl. Ecol. 2013, 24, 183–189. [Google Scholar]
- Fu, B.J.; Zhang, L.W. Land-use change and ecosystem services: Concepts, methods and progress. Prog. Geogr. 2014, 33, 441–446. [Google Scholar]
- Guo, Y.F. Land Use Change and Its Influence on Water Conservation Service Based on CLUE in Jiangxi Province. Master’s Thesis, Anhui Normal University, Hefei, China, 2011. [Google Scholar]
- Zeng, L.; Li, J.; Li, T.; Yang, X.N.; Wang, Y.Z. Optimizing spatial patterns of water conservation ecosystem service based on Bayesian belief networks. Acta Geogr. Sin. 2018, 73, 1809–1822. [Google Scholar]
- Ray, D.; Bathgate, S.; Moseley, D.; Taylor, P.; Nicoll, B.; Pizzirani, S.; Gardiner, B. Comparing the provision of ecosystem services in plantation forests under alternative climate change adaptation management options in Wales. Reg. Environ. Chang. 2015, 15, 1501–1513. [Google Scholar] [CrossRef]
- Tulbure, M.G.; Broich, M. Spatiotemporal patterns and effects of climate and land use on surface water extent dynamics in a dryland region with three decades of Landsat satellite data. Sci. Total Environ. 2019, 658, 1574–1585. [Google Scholar] [CrossRef]
- Villamizar, S.R.; Pineda, S.M.; Carrillo, G.A. The Effects of Land Use and Climate Change on the Water Yield of a Watershed in Colombia. Water 2019, 11, 19. [Google Scholar] [CrossRef]
- Op de Hipt, F.; Diekkruger, B.; Steup, G.; Yira, Y.; Hoffmann, T.; Rode, M.; Naschen, K. Modeling the effect of land use and climate change on water resources and soil erosion in a tropical West African catch-ment (Dano, Burkina Faso) using SHETRAN. Sci. Total Environ. 2019, 653, 431–445. [Google Scholar] [CrossRef]
- Tamm, O.; Maasikamae, S.; Padari, A.; Tamm, T. Modelling the effects of land use and climate change on the water resources in the eastern Baltic Sea region using the SWAT model. Catena 2018, 167, 78–89. [Google Scholar] [CrossRef]
- Hutchins, M.G.; Abesser, C.; Prudhomme, C.; Elliott, J.A.; Bloomfield, J.P.; Mansour, M.M.; Hitt, O.E. Combined impacts of future land-use and climate stressors on water resources and quality in groundwater and surface waterbodies of the upper Thames river basin, UK. Sci. Total Environ. 2018, 631, 962–986. [Google Scholar] [CrossRef]
- Tsarouchi, G.; Buytaert, W. Land-use change may exacerbate climate change impacts on water resources in the Ganges basin. Hydrol. Earth Syst. Sci. 2018, 22, 1411–1435. [Google Scholar] [CrossRef]
- Wang, Y.Q.; Yang, X.L.; Ren, L.L.; Zhang, M.R. Variation trend analysis of temperature, precipitation and drought in upper Yangtze River Basin. Yangtze River 2017, 48, 39–44. [Google Scholar]
- Hong, G.P.; Xiao, Y.; Chen, L.H. Evaluation and projection of climate change over the Upper Yangtze River in sres scenarios. Resour. Environ. Yangtze Basin 2013, 22, 894–899. [Google Scholar]
- Zhang, L.; Cheng, L.; Chiew, F.; Fu, B.J. Understanding the impacts of climate and landuse change on water yield. Curr. Opin. Environ. Sustain. 2018, 33, 167–174. [Google Scholar] [CrossRef]
- Green, P.A.; Vörösmarty, C.J.; Harrison, I.; Farrell, T.; Sáenz, L.; Fekete, B.M. Freshwater ecosystem services supporting humans: Pivoting from water crisis to water solutions. Glob. Environ. Chang. 2015, 34, 108–118. [Google Scholar] [CrossRef]
- Leh, M.D.K.; Matlock, M.D.; Cummings, E.C.; Nalley, L.L. Quantifying and mapping multiple ecosystem services change in West Africa. Agr. Ecosyst. Environ. 2013, 165, 6–18. [Google Scholar] [CrossRef]
- Vigerstol, K.L.; Aukema, J.E. A comparison of tools for modeling freshwater ecosystem services. J. Environ. Manag. 2011, 92, 2403–2409. [Google Scholar] [CrossRef]
- Hoyer, R.; Chang, H. Assessment of freshwater ecosystem services in the Tualatin and Yamhill basins under climate change and urbanization. Appl. Geogr. 2014, 53, 402–416. [Google Scholar] [CrossRef]
- Tallis, H.T.; Ricketts, T.; Guerry, A.D. InVEST 2.4.1 User’s Guide; The Natural Capital Project: Stanford, CA, USA, 2011. [Google Scholar]
- Trisurat, Y.; Eawpanich, P.; Kalliola, R. Integrating land use and climate change scenarios and models into assessment of forested watershed services in Southern Thailand. Environ. Res. 2016, 147, 611–620. [Google Scholar] [CrossRef]
- Chen, L.; Xie, G.; Zhang, C.; Pei, S.; Fan, N.; Ge, L.; Zhang, C. Modeling ecosystem water supply services across the. Lancang River basin. J. Resour. Ecol. 2011, 2, 322–327. [Google Scholar]
- Zhang, C.Q.; Li, W.H.; Zhang, B.; Liu, M.C. Water yield of Xitiaoxi River Basin based on InVEST modeling. J. Resour. Ecol. 2012, 3, 50–54. [Google Scholar]
- Zhang, L.; Dawes, W.R.; Walker, G.R. Response of mean annual evapotranspiration to vegetation changes atchment scale. Water Resour. Res. 2001, 37, 701–708. [Google Scholar] [CrossRef]
- Allen, R.L.; Pereira, D.R.; Smith, M. Crop Evapotranspiration Guidelines for Computing Crop Water Requirements; FAO: Rome, Italy, 1998. [Google Scholar]
- Zheng, J.Y.; Yin, Y.H.; Li, B.Y. A New Scheme for Climate Regionalization in China. Acta Geogr. Sin. 2010, 65, 3–12. [Google Scholar]
- Zhu, D.L. Methods for Detecting Land Use Changes Based on the Land Use Transition Matrix. Resour. Sci. 2010, 32, 1544–1550. [Google Scholar]
- Mekonnen, D.F.; Duan, Z.; Rientjes, T.; Disse, M. Analysis of combined and isolated effects of land-use and land-cover changes and climate change on the upper Blue Nile River basin’s streamflow. Hydrol. Earth Syst. Sci. 2018, 22, 6187–6207. [Google Scholar] [CrossRef]
- Zhao, G.J.; Tian, P.; Mu, X.M.; Jiao, J.Y.; Wang, F.; Gao, P. Quantifying the impact of climate variability and human activities on streamflow in the middle reaches of the Yellow River basin, China. J. Hydrol. 2014, 519, 387–398. [Google Scholar] [CrossRef]
- Liang, W.; Bai, D.; Jin, Z.; You, Y.C.; Li, J.X.; Yang, Y.T. A Study on the Streamflow Change and its Relationship with Climate Change and Ecological Restoration Measures in a Sediment. Concentrated Region in the Loess Plateau, China. Water Resour. Manag. 2015, 29, 4045–4060. [Google Scholar] [CrossRef]
- Zhou, G.; Wei, X.; Chen, X.; Zhou, P.; Liu, X.; Xiao, Y.; Sun, G.; Scott, D.F.; Zhou, S.; Han, L.; et al. Global pattern for the effect of climate and land cover on water yield. Nat. Commun. 2015, 6, 5918. [Google Scholar] [CrossRef] [PubMed]
- Marquès, M.; Bangash, R.F.; Kumar, V.; Sharp, R.; Schuhmacher, M. The impact of climate change on water provision under a low flow regime: A case study of the ecosystems. services in the Francoli river basin. J. Hazard. Mater. 2013, 263, 224–232. [Google Scholar] [CrossRef]
- Long, T.T.; Duong, C.C.; Steen, P.V.D.; Lens, P.N.L. Exploring the potential for wastewater reuse in agriculture as a climate change adaptation measure for Can Tho City, Vietnam. Agric. Water Manag. 2013, 128, 43–54. [Google Scholar]
- Huang, L.; Liao, F.H.; Lohse, K.A.; Larson, D.M.; Fragkias, M.; Lybecker, D.L.; Baxter, C.V. Land conservation can mitigate freshwater ecosystem services degradation due to climate change in a semiarid catchment: The case of the Portneuf River catchment, Idaho, USA. Sci. Total Environ. 2019, 651, 1796–1809. [Google Scholar] [CrossRef]
- Zhai, J.; Liu, Y.P.; Hou, P.; Xiao, T.; Cao, G.Z. Water Conservation Service Assessment and Its Spatiotemporal Features in National Key Ecological Function Zones. Adv. Meteorol. 2016, 2016, 5194091. [Google Scholar] [CrossRef]
- Wenhua, Q.; Hongran, L.; Quanfa, Z.; Kerong, Z. Forest restoration efforts drive changes in land-use/land-cover and water-related ecosystem services in China’s Han River basin. Ecol. Eng. 2019, 126, 64–73. [Google Scholar]
- Gonzalez, Z.D.; Erazo, B.; Lloret, P.; Bievre, D.B.; Steinschneider, S.; Dangles, O. Linking global climate change to local water availability: Limitations and prospects for a tropical mountain watershed. Sci. Total Environ. 2019, 650, 2577–2586. [Google Scholar] [CrossRef] [PubMed]
- Shi, H.Y.; Chen, J. Characteristics of climate change and its relationship with land use/cover change in Yunnan Province, China. Int. J. Climatol. 2018, 38, 2520–2537. [Google Scholar] [CrossRef]
- Jiang, C.; Xiong, L.; Wang, D.; Liu, P.; Guo, S.; Xu, C.Y. Separating the impacts of climate change and human activities on runoff using the Budyko-type equations with time-varying parameters. J. Hydrol. 2015, 522, 326–338. [Google Scholar] [CrossRef]
- Zhang, L.; Nan, Z.; Yu, W.; Zhao, Y.; Xu, Y. Comparison of baseline period choices for separating climate and land use/land cover change impacts on watershed hydrology using distributed hydrological models. Sci. Total Environ. 2018, 622, 1016–1028. [Google Scholar] [CrossRef] [PubMed]
Figure 1.
Location of UYRB.

Figure 2.
Climate division of UYRB.

Figure 3.
Distribution of annual average temperature and precipitation over UYRB.

Figure 4.
Average annual precipitation and temperature change in climatic zone from 1986 to 2015.
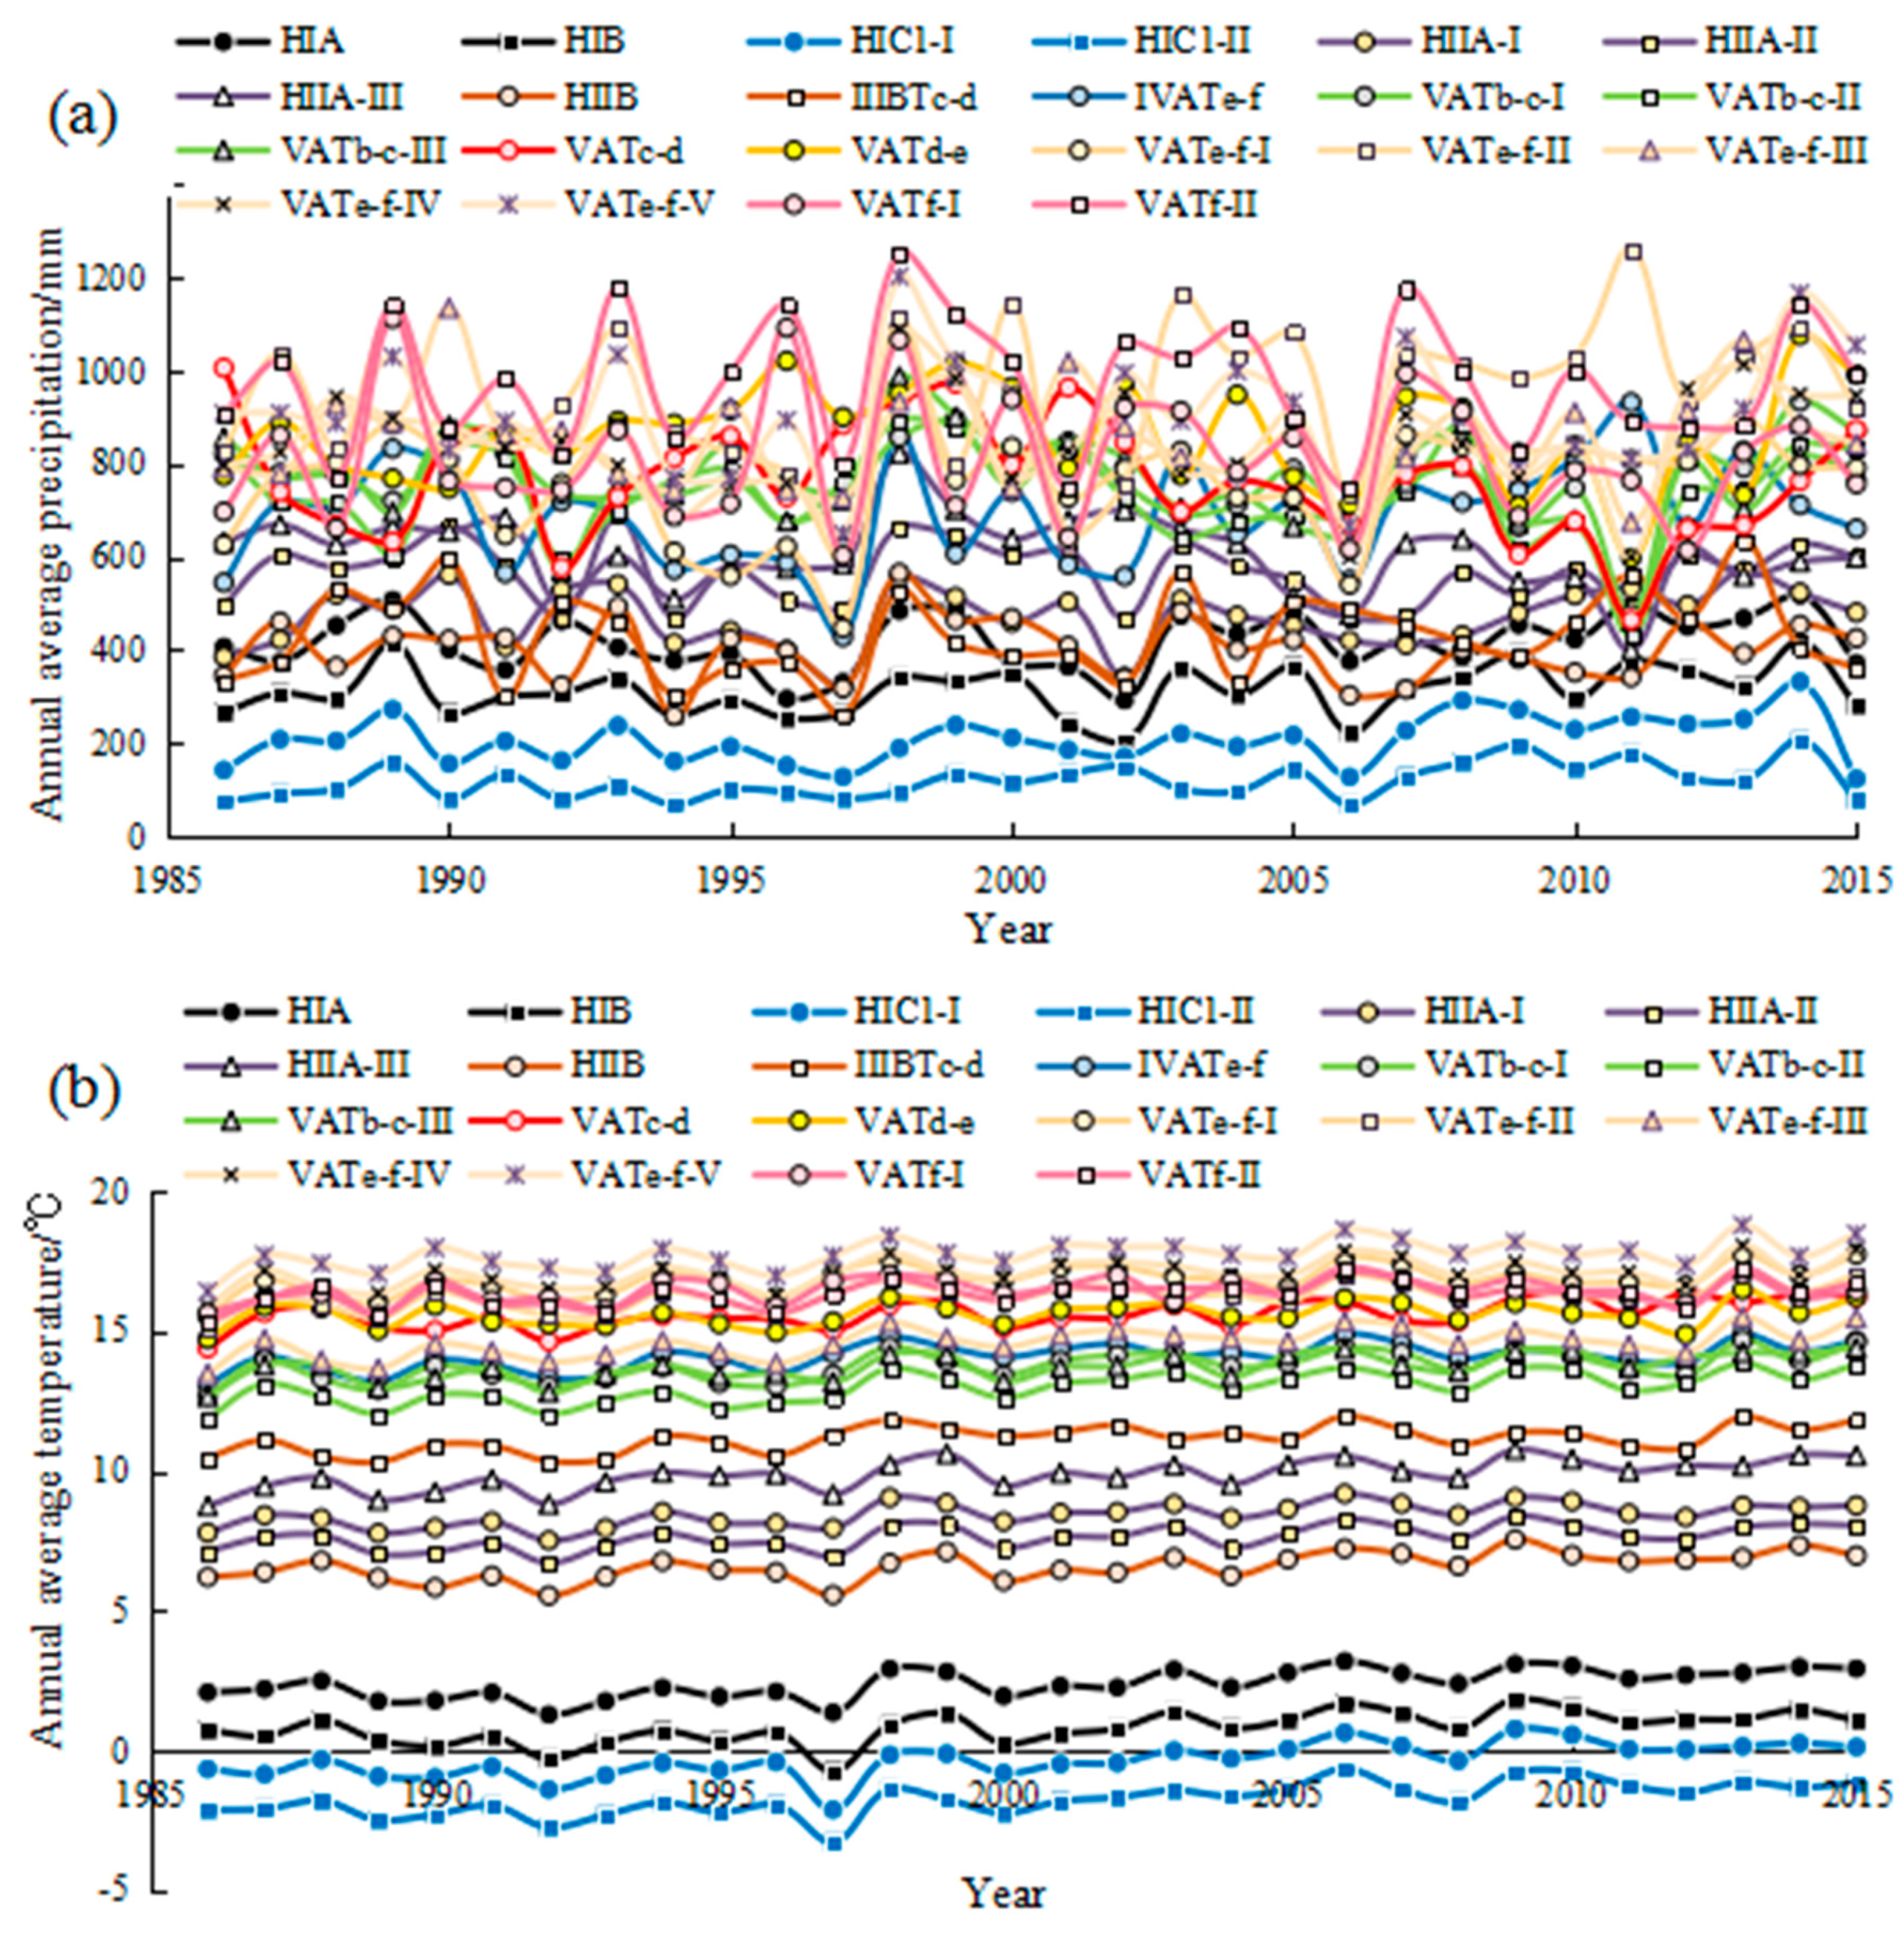
Figure 5.
Land cover in UYRB from 2000 to 2015.

Figure 6.
Subwatershed of UYRB.

Figure 7.
Water conservation in UYRB: (a) years of average; (b) annual average change.

Figure 8.
Inter-annual variation and correlation of water conservation and precipitation, ET0.

Figure 9.
Changes in water retention in different scenarios.

Figure 10.
Spatial differences of water retention changes: (a) Impacts of climate change alone; (b) Impacts of land change alone; (c) Impact of integrated changes; (d) Impact rate of climate change on water retention.
Figure 10.
Spatial differences of water retention changes: (a) Impacts of climate change alone; (b) Impacts of land change alone; (c) Impact of integrated changes; (d) Impact rate of climate change on water retention.


Table 1.
Data requirements and sources for water yield modeling.
| Data | Label | Description | Data Source |
|---|---|---|---|
| Annual average precipitation | Pr | Spatial resolution at 1 km × 1 km | Interpolation of meteorological station data |
| Annual average temperature | Tem | Spatial resolution at 1 km × 1 km | Interpolation of meteorological station data |
| Reference evapotranspiration | ET0 | Spatial resolution at 1 km × 1 km | Calculated by using the FAO 56 Penman–Monteith formula |
| Soil depth | -- | Minimum of restricting layer depth and root depth; converted to 1 km × 1 km raster | Data from China’s 1:1 million soil database and purchased from the Nanjing Institute of Soil Science, Chinese Academy of Sciences |
| Plant available water content | PAWC | The fraction of water in soil that is available to plants; converted to 1 km × 1 km raster | Calculated based on soil texture |
| Land-use/land cover | LULC | reclassified by 5 categories (farmland, forest, shrub, grassland, wetland); converted to 1 km × 1 km raster | Data from the national ten-year ecological environment remote sensing survey |
| Evapotranspiration coefficient | ETK | Calculated by referencing the United Nations FAO crop coefficient | |
| Catchment polygons | -- | Upper Yangtze river catchment boundaries | Extracted by Arcgis |
| Observable values | -- | Verify the accuracy of the assessment results | Extracted from the Sichuan hydrological statistics and purchased by the Sichuan Provincial Hydrographic Bureau |
Table 2.
Scenario setting.
| Scenario | Climate | Land-Cover | Description |
|---|---|---|---|
| S1 | 1986–2000 | 2000 year | Baseline |
| S2 | 2001–2015 | 2000 year | Land cover remains unchanged, climate change |
| S3 | 2001–2015 | 2015 year | Climate and land cover change simultaneously |
Table 3.
Climate Zone of UYRB.
| Code | Climate Zone | Annual Average Precipitation (mm) | Annual Average Temperature (℃) |
|---|---|---|---|
| HIA | Zoige plateau subfrigid humid zone | 416.92 | 2.39 |
| HIB | Guolu Naqu sub-humid and subfrigid zone | 312.19 | 0.82 |
| HIC1-I | Qumalai plateau semi-arid and subfrigid zone | 206.24 | –0.33 |
| HIC1-II | Wudaoliang plateau sub-arid and subfrigid zone | 117.47 | –1.73 |
| HIIA-I | Kangding plateau temperate humid zone | 469.81 | 8.43 |
| HIIA-II | Xiaojin plateau temperate humid zone | 566.13 | 7.63 |
| HIIA-III | Jiulong plateau temperate humid zone | 607.79 | 9.86 |
| HIIB | Central and northern of the Hengduan Mountains temperate and semi-humid zone | 401.07 | 6.58 |
| IIIBTC-d | southern Loess plateau warm temperate zone | 432.49 | 11.14 |
| IVATe-f | Qinba mountainous northern subtropical humid zone | 688.79 | 14.08 |
| VATb-c-I | Weining mountainous subtropical humid zone | 779.19 | 13.74 |
| VATb-c-II | Huize mountainous subtropical humid zone | 738.06 | 12.98 |
| VATb-c-III | Xichang mountainous subtropical humid zone | 753.27 | 13.72 |
| VATc-d | Middle Yunnan mountainous mid-subtropical humid zone | 767.14 | 15.59 |
| VATd-e | Guizhou plateau mountainous subtropical humid zone | 861.46 | 15.60 |
| VATe-f-I | Suining subtropical humid zone | 763.75 | 16.84 |
| VATe-f-II | Bazhong subtropical humid zone | 947.13 | 16.24 |
| VATe-f-III | Emeishan subtropical humid zone | 854.47 | 14.58 |
| VATe-f-IV | Neijiang subtropical humid zone | 839.67 | 17.07 |
| VATe-f-V | Shapingba subtropical humid zone | 902.85 | 17.73 |
| VATf-I | Yichang mountainous subtropical humid zone | 807.44 | 16.41 |
| VATf-II | Badong mountains subtropical humid zone | 975.68 | 16.36 |
Table 4.
A sample of land cover transition matrix.
| T1 | A1 | A2 | . . . | An | Total | |
|---|---|---|---|---|---|---|
| T2 | ||||||
| A1 | P11 | P21 | . . . | Pn1 | P11+P21+...+Pn1 | |
| A2 | P12 | P22 | . . . | Pn2 | P11+P22+...+Pn2 | |
| . . | . . | . . | . . | . . | . . | |
| An | P1n | P2n | . . . | Pnn | P1n+P2n+...+Pnn | |
| total | P11+P12+...+P1n | P21+P22+...+P2n | . . . | Pn1+Pn2+...+Pnn | S | |
Table 5.
Land cover change (km2), 2000–2015.
| 2000 | Grassland | Farmland | Shrubland | Forest | Wetland | Total | |
|---|---|---|---|---|---|---|---|
| 2015 | |||||||
| Grassland | 180,089 | 11,456 | 29,268 | 20,181 | 8288 | 249,282 | |
| Farmland | 9787 | 110,292 | 17,994 | 39,038 | 2561 | 179,672 | |
| Shrubland | 29,597 | 20,270 | 55,049 | 46,593 | 937 | 152,446 | |
| Forest | 19,620 | 45,304 | 46,647 | 174,217 | 1490 | 287,278 | |
| Wetland | 8190 | 3122 | 1118 | 1722 | 8508 | 22,660 | |
| total | 247,283 | 190,444 | 150,076 | 281,751 | 21,784 | 891,338 | |
Table 6.
Validation of water retention simulation.
| Sub-Watershed | Observable Value (mm) | Estimated Value (mm) | Error (%) |
|---|---|---|---|
| Upper Jingsha river basin | 140 | 190.35 | 35.96 |
| Yalong jiang | 450 | 384.56 | −14.54 |
| Mingjiang and tuojiang | 500 | 589 | 17.80 |
| Jialingjiang | 380 | 474.44 | 24.85 |
| Wujiang | 550 | 670.29 | 21.87 |
Table 7.
Water retention (mm) of land cover, 2000–2015.
| Land Cover | In 2000 Year | In 2015 Year |
|---|---|---|
| Grassland | 355.30 | 339.10 |
| Farmland | 690.09 | 718.85 |
| Shrub | 448.82 | 377.18 |
| Forest | 507.97 | 440.16 |
| Wetland | 331.04 | 232.40 |
© 2019 by the authors. Licensee MDPI, Basel, Switzerland. This article is an open access article distributed under the terms and conditions of the Creative Commons Attribution (CC BY) license (http://creativecommons.org/licenses/by/4.0/).
Share and Cite
MDPI and ACS Style
Xu, P.; Guo, Y.; Fu, B. Regional Impacts of Climate and Land Cover on Ecosystem Water Retention Services in the Upper Yangtze River Basin. Sustainability 2019, 11, 5300. https://doi.org/10.3390/su11195300
AMA Style
Xu P, Guo Y, Fu B. Regional Impacts of Climate and Land Cover on Ecosystem Water Retention Services in the Upper Yangtze River Basin. Sustainability. 2019; 11(19):5300. https://doi.org/10.3390/su11195300
Chicago/Turabian StyleXu, Pei, Yingman Guo, and Bin Fu. 2019. "Regional Impacts of Climate and Land Cover on Ecosystem Water Retention Services in the Upper Yangtze River Basin" Sustainability 11, no. 19: 5300. https://doi.org/10.3390/su11195300
Note that from the first issue of 2016, this journal uses article numbers instead of page numbers. See further details here.