Evaluation Model and Empirical Study on the Competitiveness of the County Silicon Crystal Industry

1
Research Center of Spatial Planning and Human-Environment System Simulation, China University of Geosciences, Wuhan 430074, China
2
Department of Geography, School of Geography and Information Engineering, China University of Geosciences, Wuhan 430074, China
3
Department of Logistics, School of Business, Huaihua University, Hunan 10548, China
4
Wuhan Geological Survey Center of China Geological Survey, Wuhan 430205, China
*
Author to whom correspondence should be addressed.
Sustainability 2019, 11(19), 5360; https://doi.org/10.3390/su11195360
Submission received: 3 September 2019
/
Revised: 20 September 2019
/
Accepted: 24 September 2019
/
Published: 27 September 2019
Abstract
:The silicon crystal industry is an emerging industry that uses silicon ore to obtain crystalline silicon and silicon micropower through processing. The China silicon crystal industry generally suffers from poor market supervision and low added-value products, which decreases the industry’s competitiveness and affects overall economic development. This study used the SWOT–PEST model to analyze the internal and external factors, constructed the county competitiveness evaluation index system with four dimensions and 20 variables, and used the gray correlation evaluation model to conduct empirical research on data on the competitiveness of the silicon crystal industry in Suichuan and in another three counties. Compared with the industrial competitiveness in the other three counties, the competitiveness in Suichuan County is still relatively low, but it has been increasing rapidly in recent years. The silicon crystal industry in Suichuan County has great advantages, such as resource endowment, energy, and policy support. The main factors affecting the competitiveness of the silicon crystal industry in Suichuan County are the number of brands, the situation of foreign exports, and the output of silicon products. Therefore, Suichuan County should adjust the silicon crystal industry based on these evaluation results to promote the sustainable development of this industry.
1. Introduction
The continued growth of energy production and consumption has led to an increasingly prominent environmental problem [1]. In this context, the new energy industry with silicon ore as an important raw material has gradually matured, mainly in the form of product diversification and industrial chain integration. To support this development, governments around the world have formulated relevant policies [2,3]. As the new energy and carbon-based alternative material, silicon contributes to alleviate the shortage of fossil resources and develop semiconductors and high-tech industries [4,5,6]. It was developed earlier in the United States and has formed a mature industry chain. Thus, the silicon crystal industry in China developed later than that in the United States, and it is currently in a period of vigorous development [1,2]. However, at the same time, many problems of the silicon industry in China have been exposed, such as backward technology, vague management concepts, and unclear market positioning [7,8,9]. These problems deeply reflect that the internal structure of the domestic silicon industry needs to be adjusted and that the industry urgently needs to be upgraded. Product competitiveness analysis is required before industry adjustments and upgrades [9,10]. Competition evaluation can not only make the industry better self-positioned but also help the industry to better analyze its internal and external environment, thus promoting the emergence of new technologies and new products, such as semiconductor manufacturing, fiber optics, communications, and computer technology [11,12,13]. In recent years, with the continuous development of technology, silicon resources have become a reserve resource for national security strategy and a focused industry for national defense industry competition [14,15]. The competitiveness of the silicon crystal industry in the academic world has been extensively studied, but an in-depth discussion on the correlation between various influencing factors in the county on the silicon crystal industry has not yet been reported [16,17].
Before the 21st century, most academic research on the silicon crystal industry was performed from a national and provincial perspective [18,19,20]. Regarding this perspective, Yonghua Shou et al. studied the development of the world silicon crystal industry, introduced information on the production of polysilicon in developed countries, such as Japan and the United States, introduced the defects in the production technology of silicon crystals in detail, and predicted the development trend of silicon materials [21]. Muller’s research on the technical treatment of polysilicon materials, with the breakthrough of technical barriers, aided the rapid development of the solar industry [18]. The above researchers conducted empirical research on the silicon crystal industry, but they neglected to study those relevant to county-level regions. The county is the smallest unit of industrial economic activity and has important practical significance. With the development of technology and the improvement of scientific research, researchers have begun conducting research on the county-level silicon crystal industry [22,23]. Baolian Tang and Wenyi Jia introduced, in detail, the production status and existing problems of silicon deep processing products in Donghai County and analyzed their industrial competitiveness. They found that this county’s silicon crystal industry is already in the industrial agglomeration stage, recognizing that industrial clusters are an important way to upgrade the county’s silicon crystal industry [22,24]. Yang Yu studied the silicon crystal industry in Fengyang County, Anhui Province, and analyzed the development of the silicon crystal industry in the county from two different perspectives: supply chain and government management [25]. Although there is some research on the county silicon crystal industry, it is mainly limited to problem discovery, a single qualitative status analysis, or based on a single county analysis, without discussing the correlation between various factors in different counties. Limited studies are available regarding the silicon crystal industry in Suichuan County. Therefore, comprehensive studies regarding these are required. This study was performed to address the research gaps and to better evaluate the county silicon crystal industry competitiveness and the degree of association between different influencing factors. Innovatively, we combined the grey correlation and SWOT-PEST models to systematically analyze the level of competitiveness of the county silicon crystal industry. The grey correlation model has not been previously used for a competitive evaluation of the county silicon crystal industry.
As one of the important areas for the revitalization of the former Central Soviet Area (Southern Jiangxi Province, South China), Suichuan was supported by the state’s policies for the Red Revolution. Silicon is one of the four dominant minerals in Suichuan County. The current output value of the silicon crystal industry is relatively small in the county, but it has abundant resources, rapid development, and increasing industry contribution value. How to effectively utilize the advantages of resource endowment, seize the opportunity, and rationally layout the silicon crystal industry is an urgent problem. Based on this situation, the Suichuan County Government has proposed its industrial development goals: “Developing new material industries such as increasing processing of silicon ore and to build a 10 billion industrial cluster by 2020.” To achieve this goal, it is inevitable to explore the competitiveness of the silicon crystal industry [10]. This study compares the competitiveness of the silicon crystal industry in the eastern regions of China and four counties in the central region to fully understand the environmental advantages of the silicon crystal industry in Suichuan County, thereby promoting the sustainable development of the county and providing certain guiding significance for the industrial development planning of the region.
2. Materials and Methods
2.1. Study Area
Suichuan County is located in the southwest Ji’an City of Jiangxi Province, South China (113°56′51″ E–114°45′45″ E, 25°28′32″ N–26°42′55″ N; Figure 1). The total area of the county is 3414.17 km2, the natural conditions in the territory are superior and the resources are abundant. The study area is a structurally eroded landform with a maximum relative height difference of 727 m. The terrain in the area is generally high in the west and low in the east. The direction of the mountain is like a “W” and it is distributed from north to south. The area has a subtropical climate—mild and abundant rainfall. Silicon is one of the four dominant minerals in the county, mainly distributed in the western townships of the county. A map was generated using ArcGIS 10.2 (http://www.esri.com/software/arcgis, ESRI, Redlands, California, CA, USA). The data are mainly derived from the distribution map of the Suichuan Silicon Mine.
2.2. Data Sources
The data were obtained from statistical yearbooks, county-level government departments, China Nonferrous Metals Industry Association, and silicon crystal enterprises in various counties. The data for 2017, 2013, and 2009 are relatively complete and representative. Therefore, the data on these three years are selected for this research.
2.3. Methods
2.3.1. SWOT–PEST Model
The SWOT analysis method is applicable to the fields of enterprise management and strategic decision making [26,27]. The principle is to compare and analyze the internal and external factors of the enterprise, identify its advantages, seize opportunities, improve the disadvantages, and eliminate threats, thus providing a theoretical reference for strategy formulation and planning development. The PEST model is a strategic analysis method to improve the enterprise’s adaptability to the internal and external environments [28]. The PEST analysis method not only evaluates the external environment of the development of the silicon crystal industry, it can also reveal its shortcomings and provide theoretical support for optimizing resources and other configurations [29].
SWOT–PEST is a new strategic analysis model [30]. Through the SWOT analysis of the political, economic, social, and technological factors in PEST, the key factors affecting the development of the silicon crystal industry are selected and developed. Through qualitative analysis, the silicon crystal industry development potential evaluation system is established, and relevant models are used for quantitative research.
2.3.2. Grey Relational Model
The grey correlation model helps analyze the degree of correlation between factors [31,32]. It overcomes the mathematical analysis methods such as regression and factor analyses and it also requires the linear relationship between sequences and the lack of sequence correlation between them. It also overcomes the shortcomings of the quantitative analysis and observes regional competitiveness.
In this study, the analysis method of local relevance in gray correlation degree is adopted. A specific sequence is taken as a reference sequence. Since the original data size is different, the method of analysis of the degree of local relevance can help select the optimal data on each factor as the reference sequence, and then perform the correlation function with the comparison sequence to avoid the difference of data standardization.
(1) Parameter and comparison sequence
The maximum value of each impact factor is used to form the parameter sequence. Donghai County in the Jiangsu Province, Fengyang County in the Anhui Province, Yongxiu County in the Jiangxi Province and Suichuan County in the Jiangxi Province are selected for comparative analysis; 20 indicator data for 2017, 2013, and 2009 are also selected to form a valid evaluation sequence [33,34].
Let the reference sequence be and the comparison sequence be . According to the following formula,
(2) Data processing
Since the measurement of each impact factor in the evaluation system is different, the data cannot be compared and calculated before it is processed. Therefore, the original data need to be standardized before the quantitative analysis of the data. This study uses SPSS 17.0 (SPSS Inc., Chicago, IL, USA) software to perform standardization.
(3) Generate the difference list
The value of the normalized influence factor is calculated as a difference. The absolute value of each, the maximum difference of each column and the minimum difference of each column are included in the corresponding difference list, and then the maximum difference and the minimum difference are calculated. The maximum difference is . The minimum difference is ∆max = 1.2753, ∆min = 2.9758 [35].
(4) Calculate the correlation coefficient
To calculate the correlation coefficient, we use the correlation formula proposed by Deng Julong [36].
The process of the quantitative analysis of the resolution coefficient is as follows:
Then, this can be converted to obtain Equation (5).
The is the resolution coefficient, and 0 < μ < 1. The smaller the value of μ, the greater the resolution. In general, μ = 0.5 is set, mainly to make the value calculated by the correlation coefficient less than 1 [37]. In the early days, most researchers set μ = 0.5, but in real life, the resolution coefficient is dynamic, not a fixed value, and the value of the resolution coefficient has a greater influence on the order of gray correlation. Therefore, the reference sequence and the comparison sequence should be comprehensively analyzed. If the reference sequence and the comparison sequence have abnormal values, the correlation coefficient can reduce the influence of the resolution coefficient on the correlation degree. In order to eliminate the influence of the absolute difference on the integrity of the degree of association, the system residual sequence is grouped and the mean value of each group of residuals is calculated. Finally, the maximum value is calculated to avoid the correlation coefficient, thereby increasing the distribution interval of the degree of association. According to Equation (5), the resolution coefficient of the influence factor can be calculated, and the average value of the resolution coefficient of the influence factor is 0.3770 as the resolution coefficient of this study.
(5) Calculate the overall relevance
Since the amount of comparison sequence and reference sequence data is large and the degree of association is different, the value of the correlation coefficient is different. To prevent the data information from being too scattered, it is more conducive to the comparison of the degree of association. It is necessary to assign the correlation coefficient of each factor to the weight and calculate the totality [38]. In this study, all variables are given the same weight, and this is used as a reflection of the degree of association between the comparison sequence and the reference sequence (Equation (6)).
(6) Ranking of relevance
After calculating the overall degree of correlation between the manipulation sequence and the comparison sequence, the values are sorted according to the size of the value; the greater the degree of correlation , the greater the impact of this factor on the local industry competitiveness. The correlation degree of each period and each region is also different; the greater the degree of relevance, the stronger the competitiveness of the region during the period, and the weaker the opposite [39].
3. Results and Discussion
3.1. Qualitative Analysis Based on the SWOT–PEST Model
The SWOT–PEST model [30] is used to qualitatively analyze the development environment of the silicon crystal industry in Suichuan County. The analysis results are shown in Figure 2. Suichuan County has good mineral and water resources, strong government policy support, increasing investment, policy dividends in the Central Soviet Area, and a consolidated industrial base. However, there are certain disadvantages. For example, the silicon crystal industry in Suichuan County has a high-purity piezoelectric crystal and silicon micro-powder industrial chain, mainly based on primary processing; with low added-value products and mineral rights and management, there are problems such as poor implementation; the introduction of leading enterprises is difficult; production linkages between enterprises are not close; the external environment of the industry needs to be improved, and there is a lack of technical talents since the county is not attractive to talents.
In recent years, studies on the silicon crystal industry have been performed in other counties in China. It has been found that the environment, advantages, and opportunities related to the development of the silicon crystal industry in different counties are different. The counties in the eastern coastal areas have the advantages of talents, scientific research, and a strong industrial base, and the silicon crystal industry has developed better in these areas [12,22]. The counties located in the central region have formed industrial clusters by creating characteristic industries, and the momentum of industrial development is strong [25]. In Suichuan County, because of the strong investment of the government, the entry of relevant silicon crystal enterprises has enabled the development of the county silicon crystal industry.
Qualitative analysis will inevitably have certain subjectivity. In order to evaluate the competitiveness of the county silicon crystal industry more systematically and objectively, we have adopted a quantitative method.
3.2. Quantitative Analysis Based on the Grey Correlation Model
3.2.1. Establishing an Indicator System
This study focused on the evaluation methods and systems developed by Jin Bei [40] and Jia Ruoxiang [41] to evaluate the competitiveness of different industries. Considering the availability of data, four-level indicators are designed, namely industrial agglomeration (X1–X6), industrial competition (X7–X12), industrial innovation capability (X13–X16) and industrial sustainability (X17–X20), and the description of each indicator by level as shown in Table 1.
3.2.2. Correlation Calculation
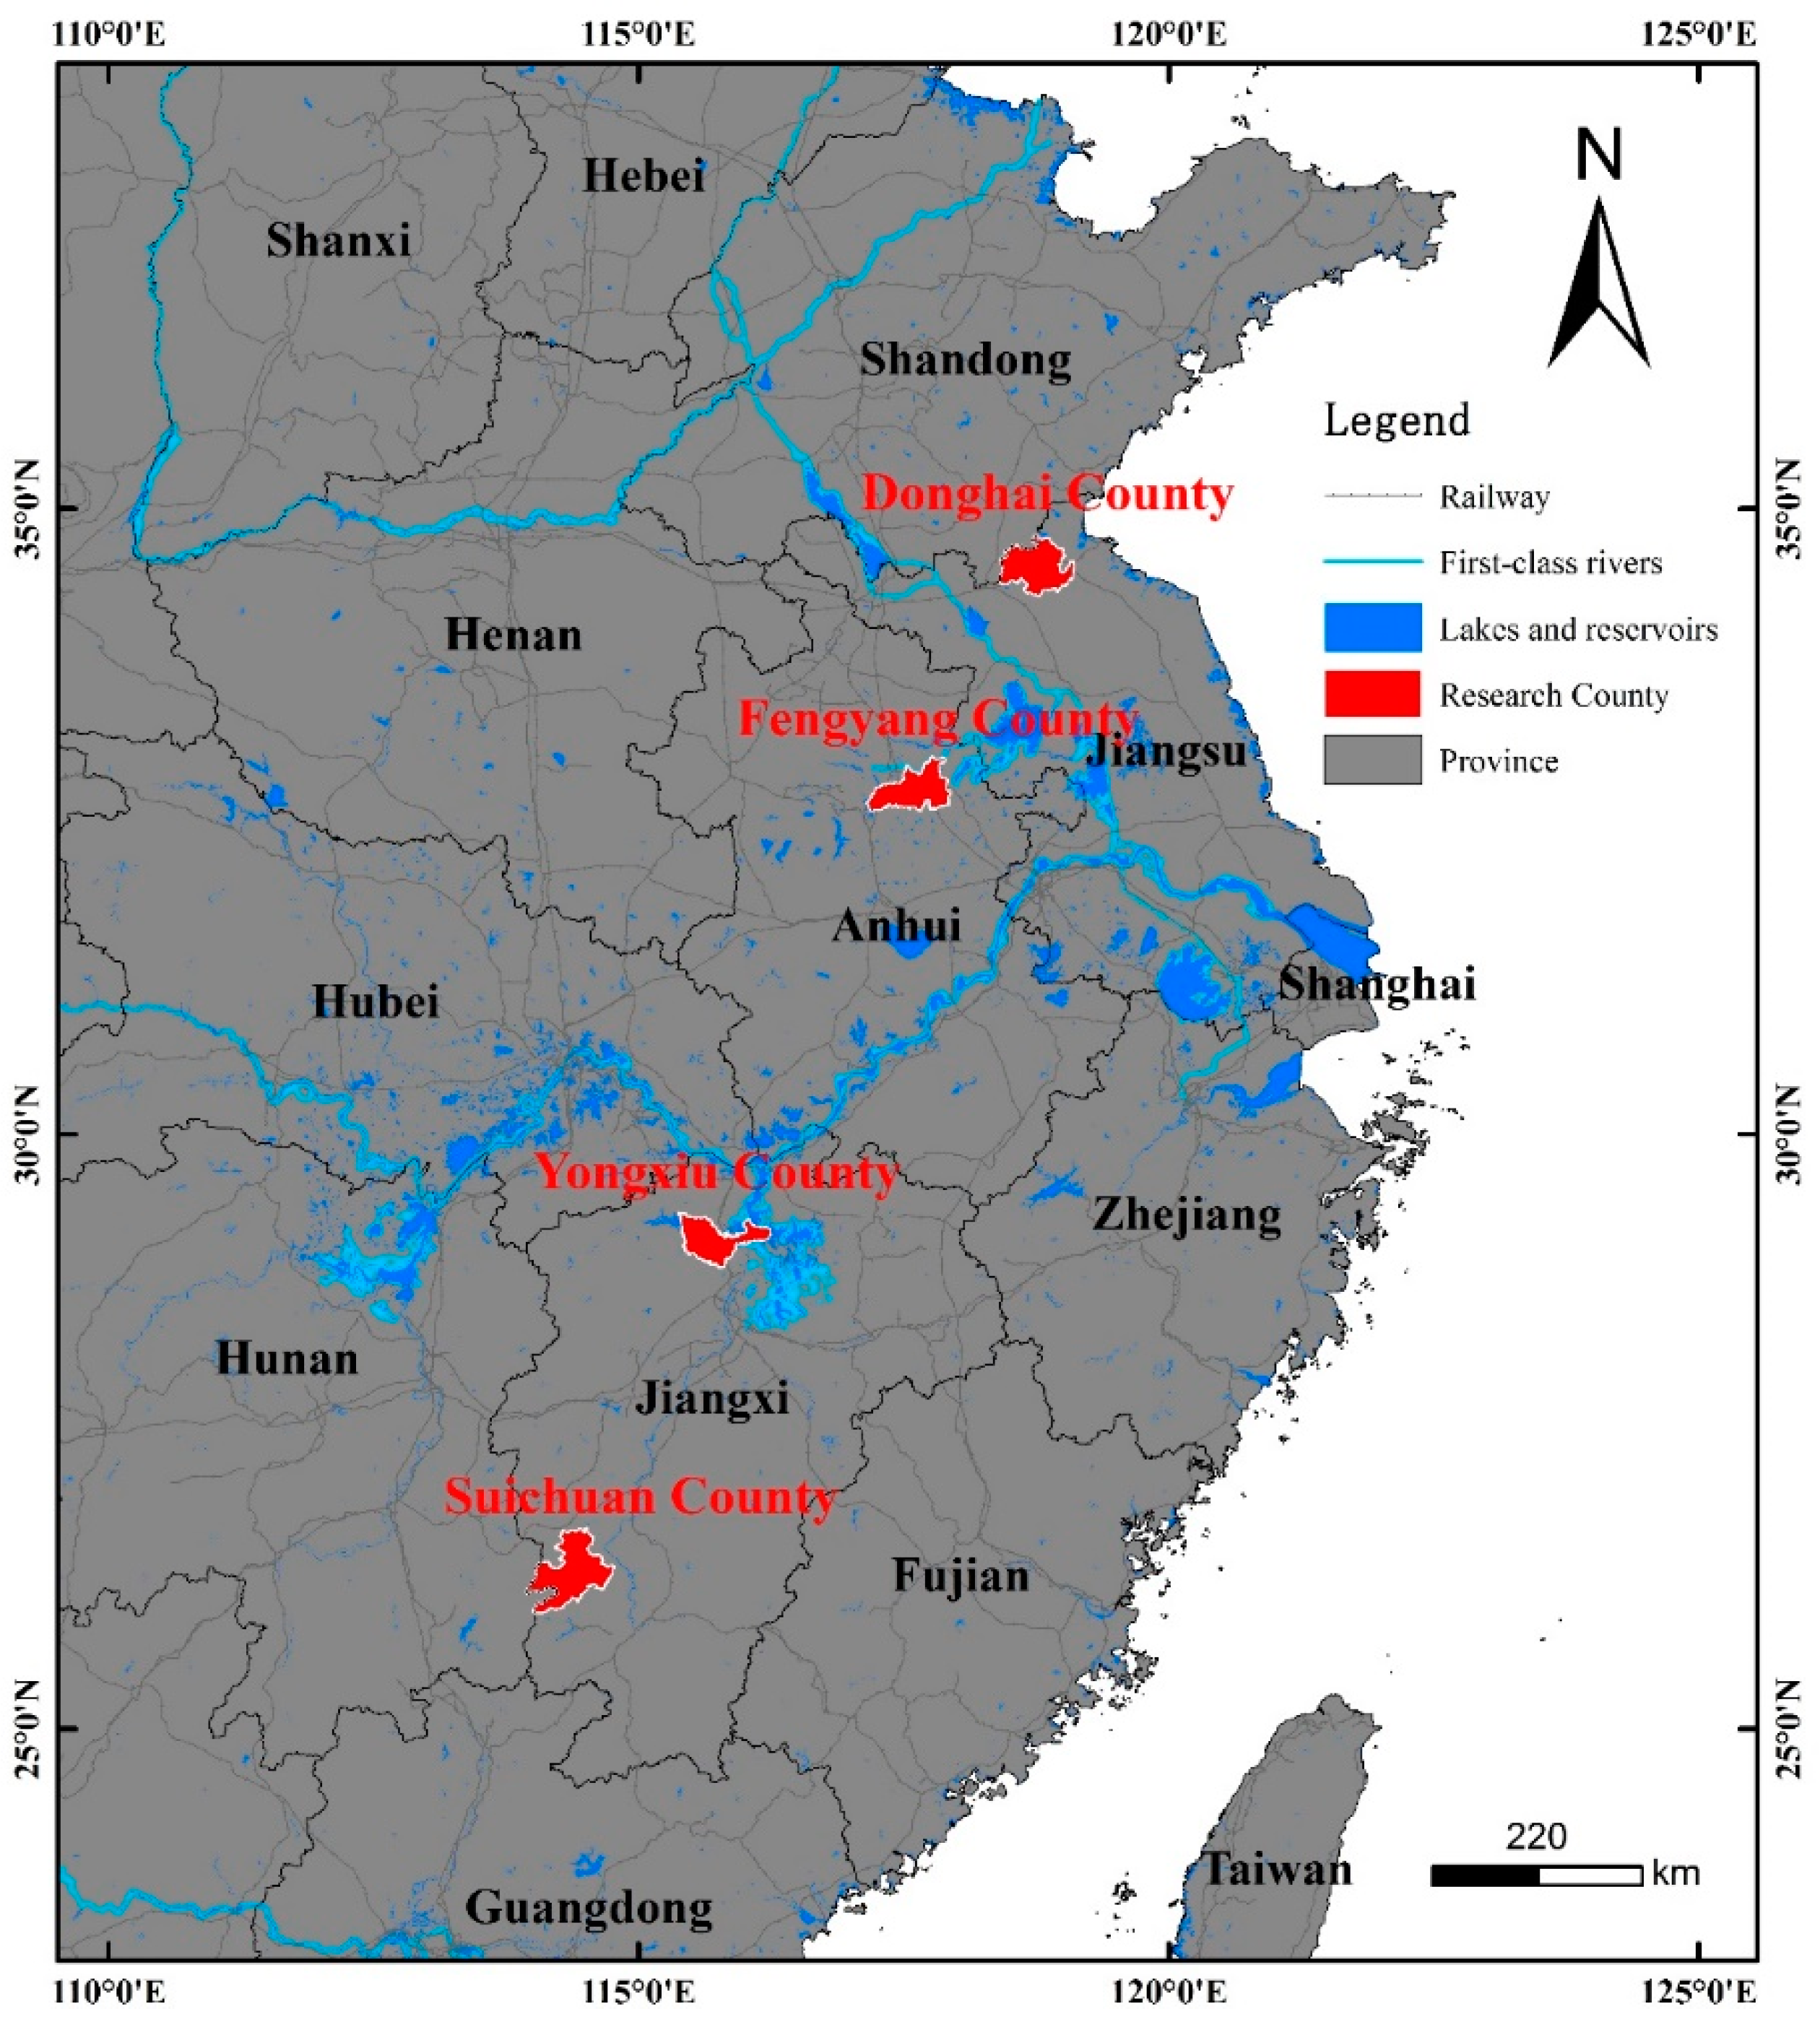
We selected Suichuan County in the Jiangxi Province as the object of study and compared the competitiveness of its silicon crystal industry with the competitiveness in Yongxiu, Donghai, and Fengyang Counties. Donghai County is located in the northern part of the Jiangsu Province. It is the latest county in China to develop the silicon crystal industry, and its industrial chain is perfect. Fengyang County is in the northeastern part of the Anhui Province with good traffic conditions and good industrial development foundation. Yongxiu County is located in the Jiangxi Province, closer to the provincial capital Nanchang, with a good water supply and land transportation. Suichuan County is located in the southwestern part of the Jiangxi Province and is closer to the Beijing-Kowloon Railway Taihe Station (Figure 3). The data were mainly derived from the distribution map of China’s counties.
The maximum value of each index after standardization is selected as the reference sequence, X0 = (1.6467, 2.7398, 2.8258, 1.7709, 1.9818, 2.6848, 1.2398, 2.2158, 1.7414, 1.4537, 2.5156, 2.4926, 2.8250, 2.9974, 1.2780, 1.9905, 2.4088, 2.0462, 0.7982, 2.6150). The standardized data were imported into the MATLAB function calculation, and the correlation coefficient table of Suichuan and the other three counties is obtained respectively, as shown in Table 2. These raw data are mainly reports from the county-level government and silicon crystal enterprises in various counties (“Development research report of China silicon industry”, “Che Yuan’ao Quartzite Mine,” “Playing the advantages of silicon resources, promoting the development of the silicon industry,” and “Huayun census geology” detailed reports).
By combing the relevant references, it was found that Donghai County has been vigorously developing its silicon crystal industry since the 1980s and 1990s. There are many enterprises, and the silicon crystal industry has a reasonable layout. It was one of the earliest counties in the domestic silicon crystal industry [23,24,25]. Fengyang County is a county that developed a strong silicon crystal industry in the central region in the middle of this century [26]. Based on abundant silicon ore resources, the county built a complete industrial chain of silicon crystal glass to create a characteristic industry on a large production scale. Yongxiu County is a county within Jiangxi Province that relied on its good geographical location and nearby research institutes to vigorously develop its organic silicon crystal industry and form industrial activities. Its development path is also worth studying. Compared with the other three counties, Suichuan County has a relatively remote geographical location and. However, with the strong support and guidance of the local government, large-scale enterprises have settled in Suichuan County, which will allow the development and perfection of the county’s silicon crystal industry.
This study will assign the same weight value to the influence factor correlation coefficient of the above table since it is difficult to objectively assign the factors of regional industrial competitiveness. Even the expert scoring method is subjective and affects relevance. Therefore, the result and order of the coefficients are assigned the same weight value. According to the average of the correlation coefficients of each factor, the comprehensive correlation coefficient (the degree of correlation of each factor to the regional industrial competitiveness) is obtained; the greater the value, the greater the impact on industrial competitiveness. Table 3, which is based on Table 2, shows that in the evaluation of regional industrial competitiveness, the degree of industrial competition has the greatest impact on the improvement of industrial competitiveness, followed by the ability of industrial innovation.
According to the function formula, the correlation coefficient for the years of 2017, 2013, and 2009 for the four counties can be calculated, as shown in Table 4. According to Table 4, the correlation coefficient of Suichuan County is relatively low. However, in the past ten years, the speed of industrial competitiveness has increased each year. The development is rapid, and the industrial base is becoming continuously stronger.
3.3. Qualitative and Quantitative Comprehensive Empirical Analysis
3.3.1. Overall Analysis
Suichuan County is X4, X9, X10, X11, and X12. The main reason for the low level of competitiveness is that there are no leading enterprises and well-known brands. The production volume of products and the scale of export are small. The foreign investment in the silicon crystal industry is not large, resulting in a low added value of the industry. The contribution of economic development is also low. In the other three counties, X8, X9, X10, X11, and X13 are highly correlated. It is difficult for the silicon crystal industry to grow by relying only on the primary processing of silicon products. X3 and X18 have the lowest correlation with the competitiveness of the regional silicon crystal industry compared to other factors. This is due mainly to the following factors. Currently, many production processes can be performed by machines and workers play a supervisory role; core technical talent affects competitiveness rather than ordinary workers; resources are only one of the external factors, not the internal reason enterprises enhance their core competitiveness.
Based on the comprehensive correlation coefficient of the four first-level indicators, the existing competitiveness of the local industry (the scale of enterprises in the region, the market shares of products, and the investment of foreign investors in the region) can reflect the level of industrial development in the region and outside. The degree of industrial competitiveness, innovation, sustainable development, and degree of agglomeration are relevant to the regional industrial competitiveness. Although the correlation coefficient of industrial agglomeration degree is low, it does not indicate that its impact on industrial competitiveness is small. Nonetheless, in some areas, the agglomeration benefits also have critical value. If the threshold value is exceeded, it will have negative benefits.
3.3.2. Stage Analysis
In 2017, Table 4 illustrates that the correlation coefficient of Donghai County is the highest, followed by Yongxiu County. This indicates that the competitiveness of the silicon crystal industry in Donghai County is relatively high. These results are in agreement with the findings of Jia et al. [25], who used the diamond model from Porter to analyze the silicon industry in Donghai County and concluded that Donghai County has certain competitive advantages for the development of the silicon industry. Donghai County developed as a result of high-quality crystal resources. The initial size of the company is different, the silicon crystal products are mixed, the quality is uneven, and the market management is chaotic. With an annual output value of hundreds of billions, its method of enhancing the competition is worthy of reference in Suichuan County. Yongxiu County is the only county that developed organic silicon earlier. It aims to enlarge and strengthen organic silicon and introduce upstream and downstream related enterprises. The Silicone Park, the Chengnan Industrial Park, and the Yinhe Industrial Park have good infrastructure, and strong research and government support. Therefore, these parks make the development of the silicon crystal industry in Yongxiu County among the best. The competitiveness of the silicon crystal industry in Fengyang County is smaller than in Yongxiu County. In recent years, Qinghai, Gansu, Xinjiang, Yunnan, and other places have produced high-quality float glass by relying on abundant mineral resources and low-cost energy resources. This, as well as the glass varieties required by other industries, has greatly reduced the market of the traditional glass industry in Fengyang. In recent years, the government has given great importance to the development of the silicon crystal industry. The county’s industrial base is relatively weak. However, in order to introduce large-scale enterprises to settle in and develop the local economy, the county government has planned an industrial park, improved infrastructure, and opened the transportation routes in the surrounding cities, and implemented active taxation and talent introduction policies. Therefore, in recent years, the industry has developed at a faster pace and its competitiveness has also increased fast.
In 2013, the competitiveness of the silicon crystal industry in Fengyang and Donghai Counties was higher than in Yongxiu and Suichuan Counties. According to Yu et al. [26], Fengyang County formulated a detailed silicon (glass) industry plan in 2008 and implemented active resource support. Strategic measures, such as policy guidance, talent pooling, technology leadership, park construction, industrial clusters, market development, and industrial support, formulate the short-, medium-, and long-term development goals, clearly indicate the development of industry, and comprehensive planning have considerably promoted the silicon crystal industry in Fengyang County. The level of industry competitiveness was the highest in 2013.
In 2009, only one large-scale enterprise was introduced in Suichuan County. Silicon crystal is mainly processed by primary processing. The main product is quartz sand. The mining volume is small, and the output and product prices are low; therefore, it offers little contribution to the regional economy. Donghai County is the earliest development of silicon crystal industry. Yongxiu and Fengyang Counties developed in the early 21st century. Each region chooses to develop different industrial chains, but they have been created based on domestic and international markets. The development model and experience of these three counties can inspire the improvement of the competitiveness of the silicon crystal industry in Suichuan County.
3.3.3. Analysis of Industrial Competitiveness in Suichuan County
The correlation coefficient of the competitiveness of the silicon crystal industry in Suichuan County increased from 0.5078 in 2009 to 0.6063 in 2017. Although the industry competitiveness in Suichuan County is lower than in other counties, its development level is continuously improving. The gap in the development of the crystal industry is shrinking. As can be seen in Table 4, brand quantity, export status, the production of silicon products, the added value of silicon crystal industry and foreign investment affect the competitiveness of the industry in Suichuan County. Based on the field research, there is no well-known brand in Sichuan County. The output of the products, the added value of the silicon crystal industry and the number of foreign exports are increasing each year. Additionally, the increasing development of the industry has led foreign companies to invest and build factories in China.
We found that 2009 was the initial stage of the development of the silicon crystal industry in Suichuan County. The enterprises introduced during this period were vigorously building production lines, plant equipment, and obtaining exploration rights. Therefore, there was no large-scale production activity. Nonetheless, in the past few years, the primary processing type of industry output has increased, and the industry has absorbed more rural surplus labor. This has greatly increased the per capita income level. The two large-scale enterprises introduced in 2013 have already started production. Therefore, there are three large-scale enterprises in the county. The main productions of quartz plates and silicon micro-powders are sold at home and abroad. In 2017, the Suichuan County Government invested a large amount of funds to hold business meetings, improve industrial parks, and actively exchange with foreign countries. It has introduced nearly 10 supporting enterprises in the silicon crystal industry. With the completion and commissioning of foreign companies, the scale and output of the silicon crystal industry have greatly improved. Therefore, the competitiveness of the silicon crystal industry from 2013 to 2017 is faster than from 2009 to 2013, and the industry is more competitive.
3.4. Suggestions
The development and efficient use of silicon resources are due to the local economic development and industrial structure transformation and upgrading process. The improvement of industry competitiveness not only needs to take advantage of the current favorable policy environment, it also needs to adapt to local conditions, thereby breaking through the problems that restricts the development of the silicon crystal industry at the county level. In order to shorten the gap with the industrial competitiveness of other regions, the development of the industry should achieve four points: (1) guiding the integration of resources and creating distinctive brands; (2) consolidating the industry base and improving the industry layout; (3) strengthening supervision management, and creating an investment environment; (4) encouraging technological innovation and introducing new talents.
4. Conclusions
In this study, we learned about the internal and external environment of the silicon crystal industry in Suichuan County by establishing the SWOT–PEST model. Moreover, we compared the competitiveness of the silicon crystal industry in the eastern regions of China and the four counties in the central region. The 20 specific indicators can generally reflect the industrial competitiveness of the region, and the correlation degree of each factor is calculated according to the gray correlation model. Research indicates that the main factors affecting the competitiveness of the silicon crystal industry in Suichuan County are five factors (X4, X9, X10, X11 and X12). The closer the value is to 1, the closer the impact factor is to the industrial competitiveness, and the result is more consistent with the actual situation. We believe that the research results from the study are of great importance for expanding the application scope of “the grey relational” model, improving the overall value-added ability of the silicon crystal industry value chain, and promoting the sustainable development of the industry. Meanwhile, they also provide certain guidelines for the industrial development planning of the region. The industrial competitiveness of Suichuan County can be improved by creating high-quality brands, actively breaking through technical problems, improving product quality and output, and increasing export volume.
Assuredly, there are still some limitations of this study. When the gray correlation model is used for data analysis, the resolution coefficient is not analyzed. Only the average of the resolution coefficients of 20 influence factors is selected, which means that 0.3770 is used as the resolution coefficient in this study. The accuracy of the resolution coefficient is higher than 0.5, but it has an effect on the subsequent correlation coefficient. In terms of weight assignment, there is no analysis of the different assignment methods since the scoring method and other assignment methods have the disadvantage of subjectivity. Therefore, the weight values of the four first-level indicators are assigned the same coefficient. If different weight coefficients are used, there may be some discrepancies with the current results. The accuracy of the results is different for different methods. However, in general, the assignments are the same and the results are not very different from other methods. In future research, these variables need to be introduced into the model for further verification. We will continue to pay attention to disclosures of latest data and further research on related issues in the future.
Author Contributions
Conceptualization, Y.P.; Data curation, Y.P. and K.P.; Formal analysis, Y.P., M.Z. and C.H.; Funding acquisition, H.P. and M.Z.; Investigation, H.P.; Methodology, Y.P., K.P. and J.Z.; Project administration, H.P.; Software, Y.P. and K.P.; Validation, C.H.; Writing—original draft, Y.P. and J.Z.; Writing—review & editing, Y.P.
Funding
This work was supported by the National Natural Science Foundation of China (Grant No. 41877297), the Fundamental Research Funds for the Central Universities, China University of Geosciences (Wuhan) (CUGQY1950), the City Geological Survey of Guangzhou (DD20190219).
Acknowledgments
We thanked Jiu Ye for drawing Figure 2. Special thanks are given to the Enago that helped us polish our language of this papers.
Conflicts of Interest
The authors declare no conflict of interest.
References
- Liu, J.; Lin, X. Empirical analysis and strategy suggestions on the value-added capacity of photovoltaic industry value chain in China. Energy 2019, 180, 356–366. [Google Scholar] [CrossRef]
- Sun, Z.; To, S.; Yu, K.M. Feasibility investigation on ductile machining of single-crystal silicon for deep micro-structures by ultra-precision fly cutting. J. Manuf. Process. 2019, 45, 176–187. [Google Scholar] [CrossRef]
- Zhang, Y.; Hu, Y.; Zeng, H.; Zhong, L.; Liu, K.; Cao, H.; Li, W.; Yan, H. Silicon carbide recovered from photovoltaic industry waste as photocatalysts for hydrogen production. J. Hazard. Mater. 2017, 329, 22–29. [Google Scholar] [CrossRef]
- Ansari Dezfoli, A.R.; Hwang, W.; Augusto, J.; Shukur, A.K.; Tzeng, S. Modeling of poly-crystalline silicon ingot crystallization during casting and theoretical suggestion for ingot quality improvement. Mat. Sci. Semicond. Proc. 2016, 53, 36–46. [Google Scholar] [CrossRef]
- Bye, G.; Ceccaroli, B. Solar grade silicon: Technology status and industrial trends. Sol. Energy Mat. Sol. Cells 2014, 130, 634–646. [Google Scholar] [CrossRef]
- Kim, C.U.; Yu, J.C.; Jung, E.D.; Choi, I.Y.; Park, W.; Lee, H.; Kim, I.; Lee, D.; Hong, K.K.; Song, M.H.; et al. Optimization of device design for low cost and high efficiency planar monolithic perovskite/silicon tandem solar cells. Nano Energy 2019, 60, 213–221. [Google Scholar] [CrossRef]
- Tang, Y.; Sun, H.; Yao, Q.; Wang, Y. The selection of key technologies by the silicon photovoltaic industry based on the Delphi method and AHP (analytic hierarchy process): Case study of China. Energy 2014, 75, 474–482. [Google Scholar] [CrossRef]
- Wang, H.X.; Xu, J.L.; Sheng, L.X. Study on the comprehensive utilization of resources city kitchen waste in China. Energy 2019, 173, 263–277. [Google Scholar] [CrossRef]
- Kanda, H.; Shibayama, N.; Uzum, A.; Umeyama, T.; Imahori, H.; Chiang, Y.; Chen, P.; Nazeeruddin, M.K.; Ito, S. Facile fabrication method of small-sized crystal silicon solar cells for ubiquitous applications and tandem device with perovskite solar cells. Mater. Today Energy 2018, 7, 190–198. [Google Scholar] [CrossRef]
- Zhang, P.; Qin, G.; Wang, Y. Risk Assessment System for Oil and Gas Pipelines Laid in One Ditch Based on Quantitative Risk Analysis. Energies 2019, 12, 981. [Google Scholar] [CrossRef]
- Chen, P. Analysis of the Industrial Status of Global Silicon Wafers. Mark. Anal. 2017, 34, 15–24. [Google Scholar]
- Gu, J.; Hu, H. On the Upgrade of Resource-Dependent Industrial Clusters-Based on the Development of Silicon Resources Industry of Donghai County. Ind. Econ. Res. 2007, 2, 57–63. [Google Scholar]
- Stuckelberger, M.; Biron, R.; Wyrsch, N.; Haug, F.; Ballif, C. Review: Progress in solar cells from hydrogenated amorphous silicon. Renew. Sustain. Energy Rev. 2017, 76, 1497–1523. [Google Scholar] [CrossRef]
- Ciszek, T.F. Photovoltaic materials and crystal growth research and development in the Gigawatt era. J. Cryst. Growth 2014, 393, 2–6. [Google Scholar] [CrossRef]
- Tseng, F.; Hsieh, C.; Peng, Y.; Chu, Y. Using patent data to analyze trends and the technological strategies of the amorphous silicon thin-film solar cell industry. Technol. Forecast Soc. 2011, 78, 332–345. [Google Scholar] [CrossRef]
- Wu, Z.; Xu, Q.L.; Nie, P.C. The Competitiveness and Economic Contribution of China’s Emerging Strategic Industries-Taking photovoltaic industry as an example. J. Xi’an Jiaotong Univ. Soc. Sci. 2013, 33, 15–21. [Google Scholar]
- Petersen, K.E. Dynamic micromechanics on silicon: Techniques and devices. IEEE Trans. Electron Devices 1978, 25, 1241–1250. [Google Scholar] [CrossRef]
- Muller, J.C.; Martinuzzi, S. Multicrystalline silicon material: Effects of classical and rapid thermal processes. J. Mater. Res. 1998, 13, 2721–2731. [Google Scholar] [CrossRef]
- Santos, M.F.M.; Fujiwara, E.; Schenkel, E.A. Processing of quartz lumps rejected by silicon industry to obtain a raw material for silica glass. Int. J. Miner. Process. 2015, 135, 65–70. [Google Scholar] [CrossRef]
- Borghi, M.; Castellan, C.; Signorini, S. Nonlinear silicon photonics. J. Opt. 2017, 9, 200–215. [Google Scholar] [CrossRef]
- Shou, Y. Progress in silicon materials. Color. Smelt. 1982, 5, 37–42. [Google Scholar]
- Tang, B.; Mo, X.; Wang, X. Current Status and Development Suggestions of Silicon Deep Processing in the East China Sea. Chem. Miner. Process. 2003, 32, 8–10. [Google Scholar]
- Gu, S. Development of Silicon Industry in Donghai County, Jiangsu Province Based on SCP Paradigm. Ind. Econ. 2018, 18, 160–161. [Google Scholar]
- Jia, W.; Tang, D. Analysis of Competitiveness of Silicon Industry in Donghai County—Based on Analysis of Porter Diamond Model. Jiangsu Bus. Theory 2009, 6, 142–144. [Google Scholar]
- Yu, Y.; Hao, S.; Chen, Y.; Xiao, H. Study on the Low-carbon Economy Development of Silicon Industrial Clusters in Fengyang County. Heilongjiang Agric. Sci. 2013, 28, 135–138. [Google Scholar]
- Kim, Y.; Park, J. A Sustainable Development Strategy for the Uzbekistan Textile Industry: The Results of a SWOT-AHP Analysis. Sustainability 2019, 11, 4613. [Google Scholar] [CrossRef]
- Pesce, M.; Shi, C.; Critto, A.; Wang, X.; Marcomini, A. SWOT Analysis of the Application of International Standard ISO 14001 in the Chinese Context. A Case Study of Guangdong Province. Sustainability 2018, 10, 3196. [Google Scholar] [CrossRef]
- Cai, Q.; Cai, Y.; Wen, Y. Spatially Differentiated Trends between Forest Pest-Induced Losses and Measures for Their Control in China. Sustainability 2019, 11, 73. [Google Scholar] [CrossRef]
- Laizer, H.C.; Chacha, M.N.; Ndakidemi, P.A. Farmers’ Knowledge, Perceptions and Practices in Managing Weeds and Insect Pests of Common Bean in Northern Tanzania. Sustainability 2019, 11, 4076. [Google Scholar] [CrossRef]
- Li, K. Based on the Perspective of Shared Economy Research on the Countermeasures of Urban Shared Bicycle Development. City Traffic. 2017, 3, 1005. [Google Scholar]
- Liu, S.; Yang, Y.; Xie, N.; Forrest, J. New progress of Grey System Theory in the new millennium. Grey Syst. Theory Appl. 2016, 6, 2–31. [Google Scholar] [CrossRef]
- Hongyan, Y. The Construction Project Bid Evaluation Based on Gray Relational Model. Procedia Eng. 2011, 15, 4553–4557. [Google Scholar] [CrossRef] [Green Version]
- Wang, W.; Yang, C.; Wang, J. Evaluation on Coal Industry Competitive Power base on Grey System Theory. Coal Eng. 2010, 7, 113–116. [Google Scholar]
- Deng, L.; Xu, B.; He, W. Research on Industrial Competitiveness Evaluation in China: Status and Outlook. Sci. Technol. Manag. Res. 2015, 35, 50–55. [Google Scholar]
- Xue, W.; Dong, W. Grey Relevance Analysis of Influencing Factors for China’s Dependence on Foreign Trade. Int. Econ. Trade Res. 2008, 24, 4–9. [Google Scholar]
- Deng, J. The Grey Control System. J. Huazhong Inst. Technol. 1982, 3, 9–18. [Google Scholar]
- Wei, Y.; Gao, Y.; Zeng, K. Limitations of Deng’s Incidence Degree and Evolution of Relational Axioms. Acta Anal. Funct. Appl. 2015, 17, 391–399. [Google Scholar]
- Zheng, J.; Wen, C. Mean-quantization Algorithm for Gray Correlation Degree. J. Hangzhou Dianzi Univ. 2010, 30, 165–168. [Google Scholar]
- Dong, Y.; Duan, Z. A New Determination Method for Identification Coefficient of Grey Relational Grade. J. Xi’an Univ. Archit. Technol. 2008, 4, 589–592. [Google Scholar]
- Jin, B. On the Identification and Discovery Logic of Realmeconomics. Chin. Ind. Econ. 2019, 11, 5–23. [Google Scholar]
- Jia, R.; Liu, Y. A Comparative Study on Industrial Competitiveness—A Case Study of Manufacture Industries in Eastern Coastal Provinces and Municipalities of China. Prog. Geogr. 2003, 22, 195–202. [Google Scholar]
Figure 1.
Location of Suichuan County.
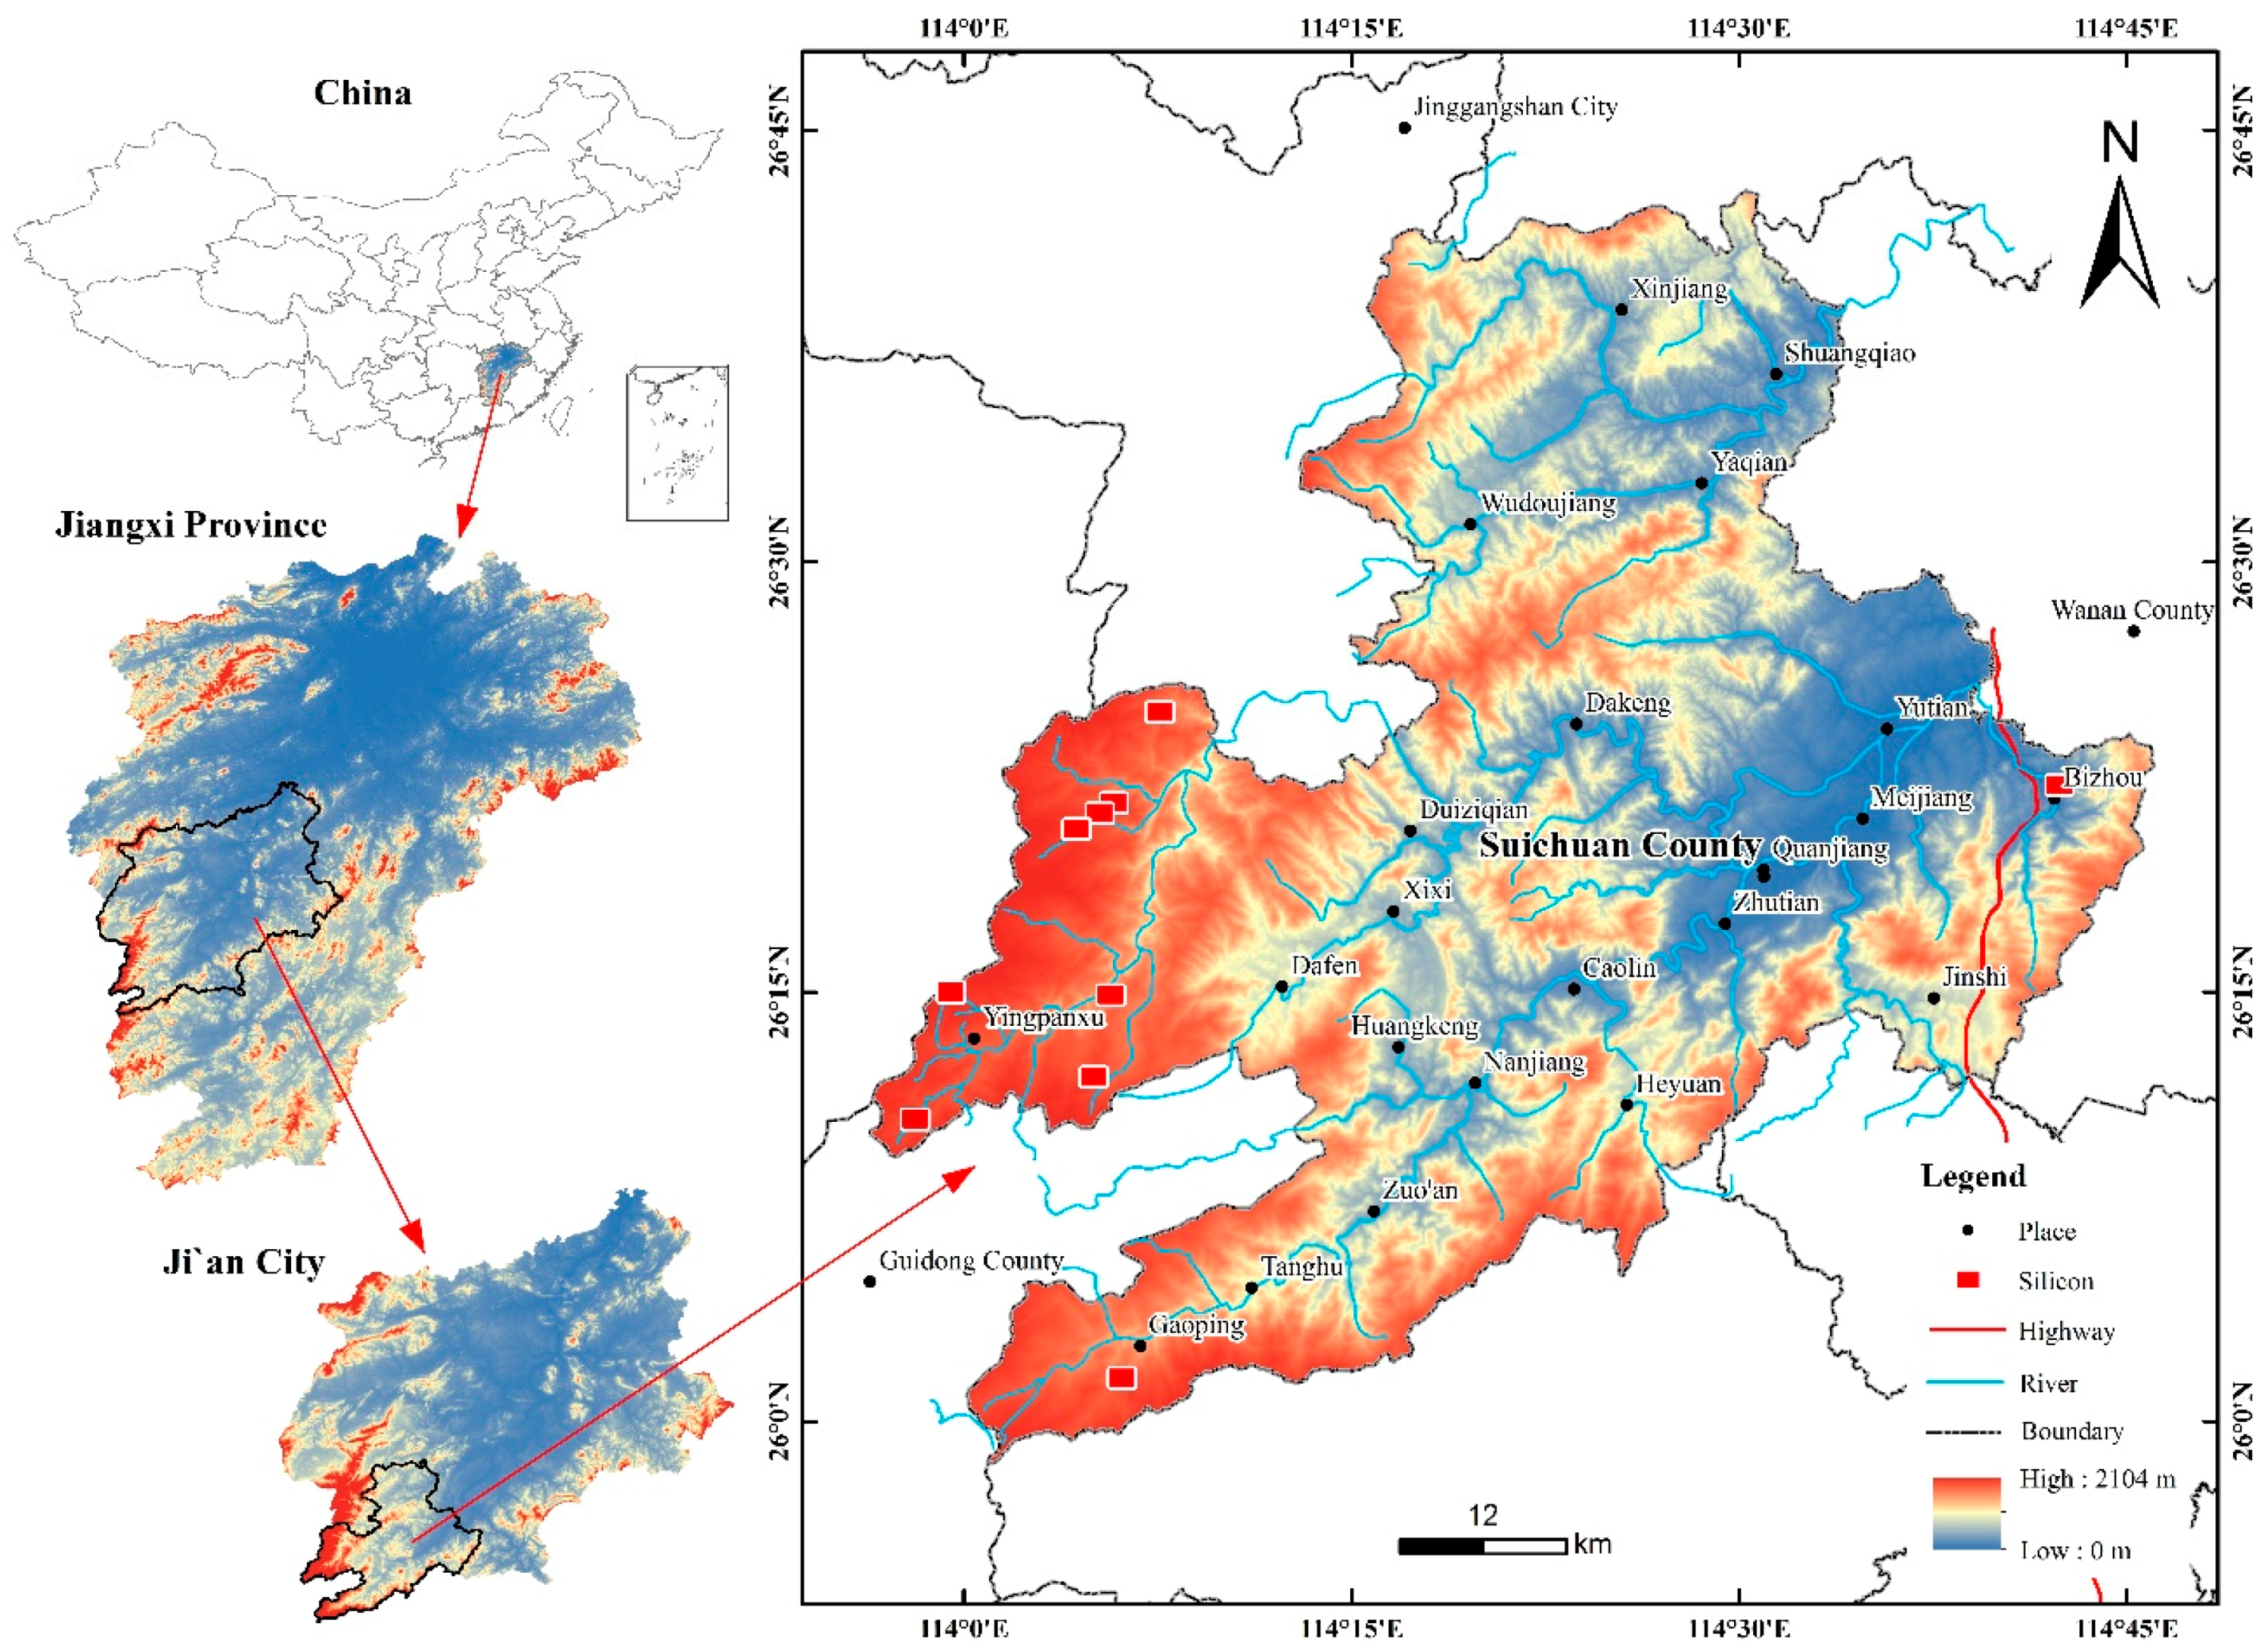
Figure 2.
Analysis of the SWOT–PEST model of silicon crystal industry in Suichuan County.

Figure 3.
Location of Donghai, Fengyang, and Yongxiu Counties.

Table 1.
Silicon crystal industry competitiveness evaluation index system.
| Primary Indicator | Indicator Codes | Secondary Indicators | Interpretation of Secondary Indicators | Units |
|---|---|---|---|---|
| Industrial agglomeration | X1 | Number of enterprises above designated size (X1) | Number of silicon crystal enterprises (X1) | - |
| X2 | Silicon crystal industry annual output value (X2) | Annual output value of silicon crystal industry (X2) | (100 million yuan) | |
| X3 | Number of employees in the silicon crystal industry (X3) | Personnel engaged in the silicon crystal industry (X3) | (ten thousand people) | |
| X4 | Silicon crystal industry added value (X4) | The annual output value of the silicon crystal industry this year − the annual output value of the silicon crystal industry (X4) | (100 million yuan) | |
| X5 | Number of supporting companies (X5) | Number of companies providing services to the upstream and downstream of the silicon industry chain (X5) | - | |
| X6 | Total output value of supporting enterprises (X6) | Annual output value of enterprises providing services in the upstream and downstream of the silicon crystal industry chain (X6) | (100 million yuan) | |
| Industrial competition | X7 | Market share (X7) | The county’s silicon crystal products occupy the domestic market (X7) | (%) |
| X8 | Scale enterprise growth rate (X8) | X8: The number of large-scale enterprises this year—the number of large-scale enterprises last year / the number of enterprises last year (X8) | (%) | |
| X9 | Number of brands (X9) | Number of corporate brands in the industry (X9) | - | |
| X10 | County export value (X10) | Foreign trade exports (X10) | (100 million US dollars) | |
| X11 | Annual output of silicon crystal products (X11) | The finished product of silicon crystal products (X11) | (cubic meters) | |
| X12 | Foreign investment situation (X12) | Foreign investment amount (X12) | (100 million yuan) | |
| Industrial innovation capability | X13 | Science and technology annual research and development costs (X13) | Technology research and development investment costs (X13) | (100 million yuan) |
| X14 | Number of scientific and technological innovation talents (X14) | Science and technology talents engaged in research and development in the county (X14) | - | |
| X15 | Number of scientific research institutions (X15) | The number of institutions including enterprise R&D centers and cooperation platforms with universities (X15) | - | |
| X16 | Number of patents (X16) | The number of patents applied by the county during the year (X16) | - | |
| Industrial sustainability | X17 | Government funding (X17) | silicon crystal industry and infrastructure construction (X17) | (100 million yuan) |
| X18 | Annual mining of silicon resources (X18) | Provided silicon ore (X18) | (ten thousand tons) | |
| X19 | Average annual salary of employees (X19) | Average annual salary of employees (X19) | (ten thousand yuan) | |
| X20 | Years of exploitation of silicon resources (X20) | The amount of silicon ore resources mined in the year (X20) | (years) |
Table 2.
Correlation coefficient table for Suichuan, Donghai, Fengyang, and Yongxiu Counties in 2017, 2013, and 2009.
Table 2.
Correlation coefficient table for Suichuan, Donghai, Fengyang, and Yongxiu Counties in 2017, 2013, and 2009.
| Impact Factors | 2017 | 2013 | 2009 | Comprehensive Correlation Coefficient of Suichuan | Comprehensive Correlation Coefficient of Others | |||||||||
|---|---|---|---|---|---|---|---|---|---|---|---|---|---|---|
| Suichuan County | Donghai County | Fengyang County | Yongxiu County | Suichuan County | Donghai County | Fengyang County | Yongxiu County | Suichuan County | Donghai County | Fengyang County | Yongxiu County | |||
| X1 | 0.4519 | 0.9068 | 0.5363 | 0.3911 | 0.3767 | 0.5364 | 0.7584 | 0.4169 | 0.4504 | 0.5390 | 0.4892 | 0.6798 | 0.4263 | 0.5838 |
| X2 | 0.5526 | 0.9207 | 0.6575 | 0.4368 | 0.5858 | 0.6908 | 0.5436 | 0.4650 | 0.5308 | 0.5729 | 0.4849 | 0.4729 | 0.5564 | 0.5828 |
| X3 | 0.3747 | 0.3439 | 0.2999 | 0.7185 | 0.2972 | 0.9184 | 0.3541 | 0.6519 | 0.6641 | 0.4547 | 0.2942 | 0.5808 | 0.4453 | 0.5129 |
| X4 | 0.6845 | 0.3861 | 0.4978 | 0.6778 | 0.7175 | 0.9715 | 0.8821 | 0.5927 | 0.6127 | 0.3137 | 0.5776 | 0.4381 | 0.6716 | 0.5930 |
| X5 | 0.4748 | 0.5802 | 0.8466 | 0.6959 | 0.4215 | 0.4244 | 0.9086 | 0.5319 | 0.4572 | 0.6390 | 0.4230 | 0.5774 | 0.4512 | 0.6252 |
| X6 | 0.5420 | 0.7161 | 0.3785 | 0.6985 | 0.4680 | 0.4710 | 0.4714 | 0.8521 | 0.2195 | 0.4106 | 0.2998 | 0.6299 | 0.4098 | 0.5475 |
| X7 | 0.3242 | 0.4852 | 0.5310 | 0.6699 | 0.4429 | 0.5114 | 0.5980 | 0.6424 | 0.2969 | 0.6402 | 0.5567 | 0.6318 | 0.3547 | 0.5852 |
| X8 | 0.5351 | 0.9986 | 0.6828 | 0.5947 | 0.9824 | 0.8332 | 0.8268 | 0.7453 | 0.4824 | 0.8789 | 0.9696 | 0.5046 | 0.6666 | 0.7816 |
| X9 | 1.0000 | 1.0000 | 1.0000 | 1.0000 | 1.0000 | 1.0000 | 1.0000 | 1.0000 | 1.0000 | 1.0000 | 1.0000 | 1.0000 | 1.0000 | 1.0000 |
| X10 | 0.9873 | 0.3497 | 0.8127 | 0.9057 | 0.6740 | 0.8744 | 0.9849 | 0.9654 | 0.6734 | 0.8619 | 0.8207 | 0.8229 | 0.7782 | 0.8220 |
| X11 | 0.6406 | 0.9899 | 0.9482 | 0.7391 | 0.6779 | 0.8134 | 0.7805 | 0.6911 | 0.6815 | 0.8114 | 0.7552 | 0.7882 | 0.6667 | 0.8130 |
| X12 | 0.9371 | 0.7713 | 0.4273 | 0.7841 | 0.6099 | 0.9007 | 0.6378 | 0.6770 | 0.4597 | 0.7519 | 0.9833 | 0.5163 | 0.6689 | 0.7166 |
| X13 | 0.7616 | 0.9807 | 0.4724 | 0.6226 | 0.6179 | 0.8669 | 0.9232 | 0.6681 | 0.4516 | 0.8033 | 0.8875 | 0.5033 | 0.6104 | 0.7476 |
| X14 | 0.7515 | 0.4911 | 0.9381 | 0.6206 | 0.2746 | 0.5327 | 0.2751 | 0.5565 | 0.3360 | 0.4167 | 0.9334 | 0.6478 | 0.4540 | 0.6013 |
| X15 | 0.6678 | 0.9599 | 0.7316 | 0.4044 | 0.3441 | 0.7111 | 0.5660 | 0.3985 | 0.6454 | 0.9667 | 0.6725 | 0.7911 | 0.5524 | 0.6891 |
| X16 | 0.6354 | 0.5750 | 0.9871 | 0.3317 | 0.2074 | 0.4633 | 0.6569 | 0.3170 | 0.6240 | 0.8069 | 0.8235 | 0.9161 | 0.4889 | 0.6531 |
| X17 | 0.5303 | 0.3529 | 0.7876 | 0.5799 | 0.4328 | 0.7104 | 0.9416 | 0.6146 | 0.2972 | 0.8400 | 0.4283 | 0.3552 | 0.4201 | 0.6234 |
| X18 | 0.3773 | 0.9406 | 0.3969 | 0.5999 | 0.3719 | 0.4491 | 0.4561 | 0.6679 | 0.3181 | 0.4872 | 0.3434 | 0.8025 | 0.3558 | 0.5715 |
| X19 | 0.6018 | 0.9389 | 0.5085 | 0.7579 | 0.6286 | 0.4879 | 0.5865 | 0.5003 | 0.3765 | 0.4636 | 0.5591 | 0.4886 | 0.5356 | 0.5879 |
| X20 | 0.2956 | 0.3865 | 0.6625 | 0.9924 | 0.3765 | 0.4234 | 0.5174 | 0.8107 | 0.5778 | 0.2920 | 0.5710 | 0.7678 | 0.4166 | 0.6026 |
Table 3.
Correlation degree coefficient values for each indicator level and their ranking.
| Primary Indicator | Comprehensive Correlation Coefficient | Relevance Ranking |
|---|---|---|
| Industrial agglomeration | 0.5540 | 4 |
| Industrial competition | 0.7621 | 1 |
| Industrial innovation capability | 0.6362 | 2 |
| Industrial sustainability | 0.5553 | 3 |
Table 4.
Correlation coefficient for each county in 2017, 2013, and 2009.
| Years | Suichuan County | Donghai County | Fengyang County | Yongxiu County |
|---|---|---|---|---|
| 2017 | 0.6063 | 0.7037 | 0.6552 | 0.6611 |
| 2013 | 0.5454 | 0.6795 | 0.6834 | 0.6383 |
| 2009 | 0.5078 | 0.6475 | 0.6436 | 0.6457 |
© 2019 by the authors. Licensee MDPI, Basel, Switzerland. This article is an open access article distributed under the terms and conditions of the Creative Commons Attribution (CC BY) license (http://creativecommons.org/licenses/by/4.0/).
Share and Cite
MDPI and ACS Style
Pan, Y.; Peng, K.; Peng, H.; Zhang, J.; Zeng, M.; Huang, C. Evaluation Model and Empirical Study on the Competitiveness of the County Silicon Crystal Industry. Sustainability 2019, 11, 5360. https://doi.org/10.3390/su11195360
AMA Style
Pan Y, Peng K, Peng H, Zhang J, Zeng M, Huang C. Evaluation Model and Empirical Study on the Competitiveness of the County Silicon Crystal Industry. Sustainability. 2019; 11(19):5360. https://doi.org/10.3390/su11195360
Chicago/Turabian StylePan, Yujie, Ke Peng, Hongxia Peng, Jing Zhang, Min Zeng, and Changsheng Huang. 2019. "Evaluation Model and Empirical Study on the Competitiveness of the County Silicon Crystal Industry" Sustainability 11, no. 19: 5360. https://doi.org/10.3390/su11195360
Note that from the first issue of 2016, this journal uses article numbers instead of page numbers. See further details here.