Study on Clustering of Free-Floating Bike-Sharing Parking Time Series in Beijing Subway Stations

1
Beijing Key Laboratory of Traffic Engineering, College of Metropolitan Transportation, Beijing University of Technology, Beijing 100124, China
2
Beijing Transportation Information Center, Beijing 100073, China
*
Author to whom correspondence should be addressed.
Sustainability 2019, 11(19), 5439; https://doi.org/10.3390/su11195439
Submission received: 26 June 2019
/
Revised: 23 September 2019
/
Accepted: 28 September 2019
/
Published: 30 September 2019
Abstract
:In recent years, the free-floating bike-sharing (FFBS) system has become a significant mode of travel to satisfy urban residents’ travel demands. However, with the rapid development of FFBS, many problems have arisen, among which the parking problem is the most prominent. To solve the FFBS parking problem around urban subways, firstly, the time series of FFBS parking pattern and subway station classification in Beijing were constructed based on parking intensity, showing a significant spatial distribution of subway stations with different intensity levels. Second, a hierarchical clustering method based on dynamic time warping (DTW) was proposed to cluster the FFBS parking time series. Subway stations in Beijing were grouped into 11 clusters, and the clustering purity reached 0.939, which achieved the expected effect. Then, the peak and off-peak period features of time series were extracted to discuss the clustering results. Finally, a two-level early-warning index for monitoring FFBS was constructed, which took the real-time parking quantity and land use capacity of FFBS into consideration. And FFBS parking management strategies for different early-warning indices were put forward. It is very important for the sustainable development of FFBS and cities.
1. Introduction
With the development of motorized traffic, air pollution and traffic congestion have become increasingly prominent [1]. To promote sustainable development of transportation, many efforts have been made, one of which was the bike-sharing program. The bike-sharing program is now widely accepted as a nonmotorized transportation solution which is of great importance to alleviate traffic problems in cities [2,3]. There are mainly three types of bike-sharing programs, including the public bike-sharing system (PBS), free-floating bike-sharing system (FFBS) and closed campus bike-sharing system (CBS) [4]. PBS (Figure 1a) is often run or subsidized by the government, involving massive docking station constructions, whilst FFBS is a newer form [5], which has been developing rapidly in China since 2016.
FFBS (Figure 1b) that is represented by OFO and MOBIKE has emerged in China at the right moment as a result of the mobile Internet. FFBS are completely sponsored and operated by enterprises. It has overcome the limit of fixed sites, that is, people can rent or return bikes anywhere. Each bike can be located by a Global Positioning System (GPS) module in its smart lock. Users can rent bikes by scanning a QR code (A kind of two-dimensional code) (Figure 1c) with the help of a smartphone. Within a short time, large numbers of bikes were launched by numerous enterprises to seize market share. As of early 2019, there had been eight FFBS companies operating in Beijing, with over 1.9 million shared bikes in use, and the average daily use frequency of shared bikes reached approximately 2,000,000 times [6].
In addition to the advantages of flexible mobility, emission reductions, physical activity benefits, reduced congestion, non-fuel use, individual financial savings and support for multimodal transport connections [7], FFBS also has the features of digital registration, mobile payment, low cost, and real-time refundable deposit. It provides a better solution to the problem of first/last mile of public transportation and meets residents’ need for short-distance travel in cities. More importantly, the proportion of bicycle trips in Beijing has doubled since the emergence of FFBS [8]. It arouses residents’ enthusiasm for bicycles which is undoubtedly the key to promote green travel. [9].
However, with the mass influx of shared bikes into cities, various urban management problems have become increasingly significant. The parking problem of FFBS is particularly remarkable. Due to the advantages of connecting with public transportation, most shared bikes are concentrated around the subway stations, making insufficient spaces more crowded (Figure 2). Excessive shared bikes encroach on the spaces for pedestrians and bicycles, causing lots of problems, such as interference with normal traffic order, which seriously affects the sustainable development of both FFBS and cities. Figure 3 shows the status of the FFBS parking situation in Beijing. As a controversial thing, FFBS has attracted attention from all sectors of society. To promote the sustainable development of FFBS, some laws and regulations have been formulated, but the objectives have not yet been clearly defined. Thus, so far there is still a lack of theoretical guidance relating to the management of FFBS parking for city managers.
The aim of this study is to reveal the potential law of FFBS parking patterns around subway stations, which can help city managers to understand the parking problems more clearly. Meanwhile, in this study, a method framework relating to FFBS parking monitoring and early warning is also put forward; consequently, the disadvantages of each enterprise can be made up during the process of independent operation, and the government’ regulatory function can be exerted.
The rest of this paper is arranged as follows. A literature review is in Section 2. The methodology used in this research is introduced in Section 3. The data collection is described in Section 4, including preprocessing, construction, and clustering of time series based on FFBS parking patterns. A method framework for FFBS parking monitoring is proposed in Section 5. Conclusions are presented in Section 6.
2. Literature Review
2.1. Study on Bike-Sharing and FFBS
As the FFBS literature is still very limited, some of the earlier bike-sharing experiences are also drawn upon here. To explore the "formula for success" of bike-sharing, some researches have been carried out from the perspective of users’ satisfaction. Nikitas [10,11] and Fishman [12] analyzed the motivations and barriers to the use of bike-sharing. Morton [13] assessed the service quality perceived by members and their overall satisfaction with the scheme. Undoubtedly, it is useful to optimize the service by focusing on users’ satisfaction; however, it is not sustainable in the pursuit of increasing users’ numbers without considering environmental-friendliness.
In fact, FFBS’s interaction with the environment is quite controversial. Scholars began to pay attention to the practical problems that FFBS has to face, such as parking disorder and unbalanced distribution of bikes. Nikitas [14] pointed out that oversupply is a fatal reason for OFO’s launch failure in the UK. Similarly, unlimited bikes supply, unbalanced parking, and parking disorder resulted in common challenges to the FFBS in China, which became worse around subway stations [6,15].
Numerous studies have been conducted to solve the problems, and the idea of bike scheduling for unbalanced parking has been put forward. Jiang [16] and Chang [17] proposed a deep innovative learning model to predict the most possible destinations for users. Luo et al. [18] defined a new scheduling method and scheduling criteria to divide users into actively scheduling and passively scheduling users, thereby seeking optimal scheduling points. Wu [19] and Parkes [20] presented a rebalancing scheme based on customer incentives for FFBS. Dell’Amico [21] studied the rebalancing problem from the perspective of the lowest scheduling cost.
Except for bike rebalancing, some researches focus on the monitoring of shared bikes. Zhang first proposed a methodological framework to support electric fence planning for FFBS [22]. Li et al. set up an FFBS supervision and service platform based on high-precision Beidou satellite location technology and electronic fencing [23]. How to solve effectively the FFBS parking problem around the subway stations based on the monitoring platform? Li [24] collected data from MOBIKE in Nanjing, China, and analyzed the activity patterns of FFBS near local metro stations by clustering method. It was a new attempt, but unfortunately, further parking monitoring methods were not proposed in their study, with only MOBIKE data collected, which was a part of the total FFBS data.
In summary, the sustainability of FFBS has been gradually paid attention to by the public, with the focus still on users’ satisfaction. Although there was some progress in monitoring practical problems (especially in the parking around the metro), no feasible monitoring and early warning methods were proposed.
Therefore, a monitoring and early warning method for FFBS parking around subway stations was investigated in this study to fill in these gaps, including: (1) to establish a time series of FFBS parking patterns around subway stations such as Beijing; (2) to select appropriate similarity measurement and cluster methods to cluster the parking patterns; (3) to propose a framework for FFBS parking monitoring and early warning based on different parking patterns, all of which will be important to the sustainable development of FFBS.
2.2. Study on Time Series Clustering
A sequence composed of a series of nominal symbols from a particular alphabet is usually called a temporal sequence, and a sequence of continuous real-valued elements is known as a time series [25]. Due to the advancement of information devices, time-series data observed in real time in various fields, such as finance, communication, medicine, health, and transportation, are used in each field. Time series data mining includes query by content, anomaly detection, motif discovery, prediction, clustering, classification, and segmentation [26,27]. Since time series clustering is performed without prior information, it is used for exploratory data analysis [28]. Clustering is especially important in time series analysis because hidden patterns can be detected by finding clusters of similar time series [28].
Many studies on transportation based on time series models have been reported. Esfahani et al. investigated a speed time series of vehicles on a section of a highway in the city of Isfahan, Iran [29]. Wang et al. developed a road traffic characteristic time series clustering model to analyze the relationship between urban road traffic characteristics and road grade based on existing taxi trajectory data [30]. Li [24] established a time series of FFBS activity patterns and analyzed the activity patterns of FFBS near local metro stations. The rules of time variation can be explored by clustering the time series of FFBS parking patterns. This is very important for the mining of parking characteristics of shared bikes around different subway stations. There are three aspects to be considered when clustering time series, including clustering method, distance measurement method, and clustering algorithm.
Firstly, clustering methods need to be selected. Many methods for time series clustering have been proposed, which can be categorized into three types, including raw-data-based, feature-based, and model-based approaches [31]. Methods that cluster raw time series data directly are known as raw-data-based methods, such as those proposed by Košmelj [32], in which a relocation clustering procedure developed for static data is modified. Feature-based and model-based approaches first convert raw time series data into a feature set or a set of model parameters, and appropriate clustering methods are used. Considering that the data set used in our study is enough, and the cluster of time series with similar shape is expected, the raw-data-based approach was chosen in this study.
Secondly, time series clustering is realized by similarity measurement. Similar time series are found by similarity matching, which is the process of calculating the similarity among the whole time series using a similarity measure. The theoretical issue of time series similarity/dissimilarity search was proposed by Agrawal et al. [33]. Similarity measurement relies on distance measurement largely. Different measures can be applied to test the distance between time series. Different distance measures have been designed for specifying similarities between time series. Hausdorff distance [28], modified Hausdorff distance [28], Hidden Markov model-based distance [34], Dynamic Time Warping (DTW) [35,36], Euclidean distance (ED) [37], Euclidean distance in a principal component analysis subspace, and longest common subsequence [28] are the most popular distance measurement methods used for time series data. Studies show that the most popular similarity measures in time series clustering are ED and DTW [30]. By the way of shape-based time series, DTW can not only eliminate the matching defect of ED point-to-point and achieve one-to-many matching of data points through bending time to measure time series of unequal length, but also has strong robustness to the deviation and amplitude change of time series [38]. It was proved to be more accurate than the ED [39,40].
Finally, among the numerous clustering algorithms, hierarchical clustering has great visualization power in time series clustering, so it is used to a great extent. Additionally, compared with most algorithms, hierarchical clustering does not require the number of clusters as an initial parameter, which is a well-known and outstanding feature of this algorithm. Meanwhile, it is also a strength in time series clustering, because it is usually hard to define the number of clusters in real-world problems [28].
Therefore, considering the clustering requirements of shape similarity in this study and the advantages of the DTW method, the DTW method is selected to measure the similarity based on the original data, and the hierarchical analysis algorithm is adopted to realize the clustering of time series in MATLAB.
3. Methodology
The DTW approach works as follows.
Suppose there are two time series Q and C, whose data lengths are n and m, respectively:
In the distance matrix between the two time series, a set of continuous matrix elements defining the anisotropic relationship between them is called the curved path. (see Figure 4 and Figure 5)
The curved path meets the following conditions [41]:
(1) Boundedness, that is, .
(2) Boundary conditions: and ; the starting and ending elements of the curved path are the two ends of the diagonal elements of the distance matrix.
(3) Continuity: given the condition , the condition b − b must be satisfied, that is, the elements in the curved path are continuous with each other.
(4) Monotonicity: given the condition , the condition b − b must be satisfied, that is, path w must pass through point (i, j) and at least one of the points (i, j), (i − 1, j), or (i, j − 1), forcing the curved path to be monotonic on the time axis.
In order to reduce the computational complexity of dynamic time bending distance, improve the computational speed, and avoid the occurrence of an ill-conditioned bending path, it is necessary to limit the walking area of the bending path, that is, to limit the bending path to the diagonal near the start and end points [42].
From the perspective of distance matrix D, there are multiple solutions of the curved path used for distance calculation. Only the path with the smallest distance is noted, which is selected as the measure of similarity. Therefore, the dynamic time bending distance is obtained as follows:
4. Data Collection and Analysis
4.1. Data Acquisition
The base dataset for research includes FFBS rental data (eight FFBS operators) of 297 subway stations in Beijing from June to August in 2018 (Figure 6), which is statistically granular per 5 min (Table 1). The data were obtained from the monitoring platform of the shared bike operation of the Beijing municipal commission of transport. According to the platform statistics, most of the shared bikes are parked in a 300 m radius centered by the subway, and the numbers of rented () and returned () shared bikes within that radius are counted in the data.
4.2. Time Series Preprocessing
Since this paper aims to study the parking pattern of FFBS, it is necessary to establish a time series relating to parking quantity. It is worth noting that this study is based on the assumption that the initial parking quantity of shared bikes is 0 at the beginning of a day, and the cumulative parking quantity (N) of shared bikes at time t (1) can be calculated as follows (see Figure 7). The object of clustering research is the time series composed of the cumulative parking volume per 5 min (Due to the consistency in parking time series of shared bikes in the same subway station on different working days, data on August 1, 2018, were selected for analysis).
4.3. Time Series Analysis and Clustering
Data normalization is done to eliminate clustering errors caused by data scale differences. Besides, the actual original time series have some rules that need to be explored. Therefore, before data normalization, the spatial distribution of subway stations with different FFBS parking intensities is analyzed. Here, the parking intensity in subway station area I refers to the larger value between the absolute value of the maximum and the absolute value of the minimum in the time series (extreme positive value represents the FFBS parking demand, and extreme negative value represents the FFBS dispatching parking demand).
The stations were grouped into seven levels according to the intensity of FFBS parking: I ≤ 200, 200 < I ≤ 400, 400 < I ≤ 800, 800 < I ≤ 1000, 1000 < I ≤ 1200, I > 2000 (Figure 10).
The spatial distribution of subway stations with different shared parking intensities through a geographic information system (GIS) is visualized, as shown in Figure 11, where different colors represent different intensities. Significant patterns are revealed. Subway stations with the lowest intensity (green, I ≤ 200) are mostly distributed at the end of the network in the suburbs, due to fewer shared bikes placed in the suburbs. Stations with the highest intensity (orange, 1200 < I ≤ 2000; red, I > 2000) are mostly distributed in the important node and hub stations of the network. However, there are few such stations in the core area (Dongcheng and Xicheng districts). This is because the core area is located in the center of Beijing, where land use is tight and parking space is limited.
Time series after preprocessing were clustered via hierarchical clustering based on DTW distance, and the clustering results are presented as a dendrogram, as shown in Figure 12. Clustering works best when k = 11. The individual clustering results are shown in Figure 13. The computing time is 33.88 s, which is longer than that of Euclidean distance by 10.1 s (23.78s), and the clustering purity is 0.939, which is higher than that of the Euclidean distance by 5.51% (0.890). The spatial distribution of subway stations with different clusters through GIS is visualized, as shown in Figure 14.
4.4. Cluster Result Analysis
First, from the overall trend of time series (FFBS parking pattern), the above 11 clusters can be divided into four categories, including continuous descending, concave, convex, and irregular, as shown in Table 2. The results show that the number of continuous descending stations is the largest, accounting for more than half of the total. In such stations, the supply of shared bikes is always lower than the demand. The second highest is the convex and concave stations, where the supply and demand of shared bikes are relatively balanced. However, no obvious rule is found in irregular stations compared with other clusters, even if they are taken as the same cluster.
To explain the specific characteristics of the FFBS parking time series, three key periods were extracted, including morning peak, off-peak and evening peak. The start time, end time, and curve slope of the three periods for different clusters were calculated. The results show that there are significant differences in the indices of the three key periods for the time series of FFBS parking in different subway stations. During the morning rush hour, most stations show a rapid increase or decrease in parking volume between 6:00 a.m. and 10:00 a.m., but the second type of stations start later in the morning, with the shortest duration (Figure 15). The slope of the time curve is uneven, and it is seen that stations of clusters 7 and 8 have the highest slope (absolute value) (Figure 16).
5. FFBS Parking Monitoring
From the results of clustering, the parking situation of FFBS around the subway is not what we expected. When there is no initial parking in a day, the accumulative amount for the day is mostly negative. That is to say, without intervention, the demand for FFBS in most subway stations is far greater than the supply. The pooling problem is often the result of excessive scheduling to meet users’ demands. Therefore, to solve this problem more effectively, the idea of considering land use capacity is put forward. In September 2017, the Beijing municipal commission of transport issued Technology and service specification for bike-sharing system and the Guideline for setting bicycle parking area, which covers permission and prohibition rules for setting bicycle parking areas around metros. Based on these regulations, the FFBS parking area was delimited, which were then collected and accessed by the monitoring platform of FFBS. Therefore, the parking area around subway stations can be obtained through the monitoring platform (Figure 17).
Initially, the subway stations with low parking intensity (≤200) were analyzed, which probably did not need intervention. To analyze the reasons for the low parking intensity of these stations, the daily cumulative rental and return volume of shared bikes were calculated, and the maximum M of the two was taken as the measurement standard, as shown in Figure 18. The results show that the occurrence and attraction of bike-sharing in these subway stations are indeed small, which is not the result of the rental–return balance. Because these sites are in the suburbs, where there is enough space to accommodate 200 bikes, no intervention is required. The following discussion is only for stations with parking intensity greater than 200.
As the problem of parking congestion is determined by both parking quantity and carrying capacity, a parking warning index T by considering the relationship between parking quantity P and parking capacity C is defined, and then the corresponding response strategy is given. Capacity C must be given after actual measurement due to different land use conditions of each subway station (It can be obtained directly through monitoring in Beijing). When calculating the capacity within a radius of 300 m around the station, the capacity is divided into two levels according to the floor area of shared bikes under different parking conditions, and :
where refers to the parking capacity when the shared bike parking area is calculated in standard parking spaces, refers to the total parking area within a 300 m radius around the subway, and refers to the standard designed parking area of shared bikes ( = 0.6 m × 2 m).
where refers to the parking capacity when the shared bike parking area is calculated by manually arranging parking spaces, refers to the total parking area within a 300 m radius around the subway, refers to the standard designed parking area of shared bikes ( = 0.36 m × 1.2 m), and refers to the parking area of shared bikes when ( = 1.67 × ) is manually arranged.
where T refers to the early-warning index of FFBS parking around the subway, and P refers to the actual number of FFBS parking spaces within a radius of 300 m around the station. In the above section, subway stations are divided into 11 clusters according to the time series of FFBS parking quantity.
A schematic is shown in Figure 19, and a two-level indicator is used to give early warning of FFBS parking conditions around the subway. When T < 1.00, the capacity can meet the standard parking demand without manual intervention. When 1.00 ≤ T < 1.67, bikes are required to be arranged manually to make the arrangement of shared bikes more compact to meet the parking demand. When T > 1.67, it is necessary to dispatch shared bikes between regions or set up temporary storage warehouses to prevent the accumulation of bikes. The corresponding measurements should be started immediately when T reaches the threshold value, and the measurement should be terminated immediately when T falls below the threshold value.
6. Conclusions
FFBS parking is a prominent problem in urban governance in China. In this paper, time series of parking quantity of FFBS in one day were constructed by using the data of rental and return of shared bikes within a radius of 300 m around the subway, and cluster analysis was carried out on time series of 297 subway stations in Beijing using the analytic hierarchy process based on DTW distance. The main contributions and conclusions of this paper are as follows:
First, before clustering, subway stations in Beijing were classified based on FFBS parking intensity, and the spatial distribution of subway stations with different intensities was visualized through geographic information systems. Significant features were found, that is, transfer hub stations and stations close to the city center showed a greater FFBS parking intensity, while stations in the outer suburbs were less. This is consistent with reality. Generally, due to the vast area in the suburbs, it is more difficult to operate and maintain shared bikes, so they are usually focused on the central area by enterprises [6,24].
Second, a hierarchical clustering method based on dynamic time warping was proposed in this paper to cluster the FFBS parking time series. Using actual operational data, 297 subway stations in Beijing were grouped into 11 clusters with a clustering purity of 0.939, 5.51% higher than that of the method used by Li et al., which proved the effectiveness of the clustering method [24,37].
Then, the 11 clusters of time series were taken as a whole and local feature analysis was conducted (peak and off-peak). It was found that clusters with different characteristics could be roughly divided into four categories, among which the continuous descending type of station accounted for the majority, so it was different from expectations [9,43]. The results showed that most FFBS parking problems were not caused by users’ parking, but by excessive scheduling, which can be completely solvable. However, due to insufficient understanding of problems, the government used to be too lenient in the management of enterprises. The importance of government regulation for the sustainable development of FFBS is emphasized in the conclusion part of this paper.
Finally, based on the land parking capacity and the real-time parking quantity of FFBS, along with the floor space of shared bikes under different parking conditions, a two-level early-warning index of FFBS parking monitoring was constructed, and corresponding strategies were put forward to provide new ideas for the governance of urban FFBS parking problems. The method framework proposed in this paper can make up for the disadvantages caused by the independent operation of each enterprise in the current situation, thus making the government play a better role in the supervision of the bike parking problem. Also, its advantage in application is increasingly significant since the real-time bike-sharing monitoring has been widely implemented in more and more cities in China.
The primary limitations of this study lie in the following: (1) Due to the limitation of non-open access to data of the FFBS monitoring platform, the framework proposed in this paper has not been verified on the platform; (2) Although the clustering of parking patterns based on time series was carried out in this paper, the exploration of clustering results and causes was not discussed in detail, which will be carried out in future work.
Author Contributions
Conceptualization, D.X.; Data curation, D.X.; Formal analysis, D.X.; Investigation, J.W.; Methodology, Y.B. and J.R.; Project administration, Y.B. and J.R.; Resources, J.W.; Supervision, B.Y.; Writing—original draft, D.X.
Funding
This research received no external funding.
Conflicts of Interest
The authors declare no conflict of interest.
References
- Heinen, E.; Maat, K.; Wee, B.V. The role of attitudes toward characteristics of bicycle commuting on the choice to cycle to work over various distances. Transp. Res. D Transp. Environ. 2011, 16, 102–109. [Google Scholar] [CrossRef]
- Chen, M.; Wang, D.; Sun, Y.; Waygood, E.O.D.; Yang, W. A comparison of users’ characteristics between station-based bikesharing system and free-floating bikesharing system: Case study in Hangzhou, China. Transportation 2018, 45, 1–16. [Google Scholar] [CrossRef]
- Yan, X.; Handy, S.L.; Mokhtarian, P.L. Factors associated with proportions and miles of bicycling for transportation and recreation in six small US cities. Transp. Res. D Transp. Environ. 2010, 15, 73–81. [Google Scholar]
- Shaheen, S.; Christensen, M. Shared-Use Mobility Summit: Retrospective of North America’s First Gathering on Shared-Use Mobility; Transportation Sustainability Research Center: Richmond, CA, USA, 2014. [Google Scholar]
- Pal, A.; Zhang, Y. Free-floating bike sharing: Solving real-life large-scale static rebalancing problems. Transp. Res. Part C Emerg. Technol. 2017, 80, 92–116. [Google Scholar] [CrossRef]
- Wang, J.C.; Ouyang, S.S. Disequilibrium of bicycle-sharing in rail transit station areas in Beijing. J. Transp. Syst. Eng. Inf. Technol. 2019, 19, 214–221. [Google Scholar]
- Shaheen, S.; Guzman, S.; Zhang, H. Bikesharing in Europe, the Americas, and Asia. In Proceedings of the 89th Annual Meeting of the Transportation Research Board, Washington, DC, USA, 1 January 2010; pp. 159–167. [Google Scholar]
- Qiao, P.Y. Big Data on Cycling Jointly Released by Mobike and Beijing Evening News. 2017. Available online: http://www.xinhuanet.com//itown/2017-04/26/c_136237422.htm (accessed on 15 August 2019).
- Jiang, Q.; Ou, S.J.; Wei, W. Why shared bikes of free-floating systems were parked out of order? A preliminary study based on factor analysis. Sustainability 2019, 11, 3287. [Google Scholar] [CrossRef]
- Nikitas, A. Understanding bike-sharing acceptability and expected usage patterns in the context of a small city novel to the concept: A story of ‘Greek Drama’. Transp. Res. Part F Traffic 2018, 56, 306–321. [Google Scholar] [CrossRef]
- Nikitas, A.; Wallgren, P. The paradox of public acceptance of bike sharing in Gothenburg. Civ. Eng. Eng. Sustain. 2015, 169, 101–113. [Google Scholar] [CrossRef]
- Fishman, E.; Washington, S.; Haworth, N.; Watson, A. Factors influencing bike share membership: An analysis of Melbourne and Brisbane. Transp. Res. A Policy Pract. 2015, 71, 17–30. [Google Scholar] [CrossRef] [Green Version]
- Morton, C. Appraising the market for bicycle sharing schemes: Perceived service quality, satisfaction, and behavioural intention in London. Case Stud. Transp. Policy 2018, 6, 102–111. [Google Scholar] [CrossRef] [Green Version]
- Nikitas, A. How to save bike-sharing: An evidence-based survival toolkit for policy-makers and mobility providers. Sustainability 2019, 11, 3206. [Google Scholar] [CrossRef]
- Shi, J.G.; Si, H.; Wu, G.; Su, Y.; Lan, J. Critical factors to achieve dockless bike-sharing sustainability in china: A stakeholder-oriented network perspective. Sustainability 2018, 10, 2090. [Google Scholar] [CrossRef]
- Liu, Z.Y.; Shen, Y.Y.; Zhu, Y.M. Where will dock less shared bikes be stacked—Parking hotspots detection in a new city. In Proceedings of the 24th ACM SIGKDD International Conference on Knowledge Discovery & Data Mining, London, UK, 19–23 August 2018; pp. 566–575. [Google Scholar]
- Chang, P.; Wu, J.; Xu, Y.H.; Zhang, M.; Lu, X.Y. Bike sharing demand prediction using artificial immune system and artificial neural network. Methodol. Appl. 2019, 23, 613–626. [Google Scholar] [CrossRef]
- Luo, Y.J.; Dou, W.F.; Yan, H.; Liu, L.Y.; Lu, S.Y. An automated planning and scheduling method of shared bikes based on reward and punishment mechanism. In Proceedings of the 17th International Symposium on Distributed Computing and Applications for Business Engineering and Science, Wuxi, China, 19–23 October 2018; pp. 276–279. [Google Scholar]
- Wu, R.; Liu, S.; Shi, Z. Customer incentive rebalancing plan in free-float bike-sharing system with limited information. Sustainability 2019, 11, 3088. [Google Scholar] [CrossRef]
- Parkes, S.D.; Marsden, G.; Shaheen, S.A.; Cohen, A.P. Understanding the diffusion of public bike sharing systems: Evidence from Europe and North America. J. Transp. Geogr. 2013, 31, 94–103. [Google Scholar] [CrossRef]
- Dell’Amico, M.; Iori, M.; Novellani, S.; Subramanian, A. The bike sharing rebalancing problem with stochastic demands. Transp. Res. B Meth. 2018, 118, 362–380. [Google Scholar] [CrossRef]
- Zhang, Y.P.; Lin, D.; Mi, Z.F. Electric fence planning for dock less bike-sharing services. J. Clean. Prod. 2019, 206, 383–393. [Google Scholar] [CrossRef]
- Li, K.; Xiao, J.H. The design and implementation of sharing bicycle government regulation and service platform based on location service. GNSS World China 2018, 43, 73–76. [Google Scholar]
- Li, Y.; Zhu, Z.; Guo, X. Operating characteristics of dockless bike-sharing systems near metro stations: Case study in Nanjing city, China. Sustainability 2019, 11, 2256. [Google Scholar] [CrossRef]
- Sun, X. Analysis and application of the global characteristics cluster. Stat. Thinktank 2009, 114, 55–59. [Google Scholar]
- Esling, P.; Agon, C. Time-Series Data Mining. ACM Comput. Surv. 2012, 45, 12. [Google Scholar] [CrossRef]
- Ahn, J.; Lee, J. Clustering algorithm for time series with similar shapes. KSII Trans. Internet Inf. Syst. 2018, 12, 3112–3127. [Google Scholar]
- Aghabozorgi, S.; Shirkhorshidi, A.S.; Wah, T.Y. Time-series clustering—A decade review. Inf. Syst. 2015, 53, 16–38. [Google Scholar] [CrossRef]
- Esfahani, R.K.; Shahbazi, F.; Akbarzadeh, M. Three-phase classification of an uninterrupted traffic flow: A k-means clustering study. Transp. B Transp. Dyn. 2019, 7, 546–558. [Google Scholar] [CrossRef]
- Wang, J.C.; Wu, J.Y.; Ni, J.H.; Chen, J.; Xi, C.B. Relationship between urban road traffic characteristics and road grade based on a time series clustering model: A case study in Nanjing, China. Chin. Geogr. Sci. 2018, 28, 1048–1060. [Google Scholar] [CrossRef]
- Liao, T.W. Clustering of time series data—A survey. Pattern Recogn. 2005, 38, 1857–1874. [Google Scholar] [CrossRef]
- Košmelj, K.; Batagelj, V. Cross-sectional approach for clustering time varying data. J. Classif. 1990, 7, 99–109. [Google Scholar] [CrossRef]
- Agrawal, R.; Faloutsos, C.; Swami, A.N. Efficient similarity search in sequence databases. In Lecture Notes in Computer Science, Proceedings of the International Conference on Foundations of Data Organization and Algorithms, Chicago, IL, USA, 13–15 October 1993; Springer: Berlin/Heidelberg, Germany, 1993; Volume 46, pp. 69–84. [Google Scholar]
- Smyth, P. Clustering sequences with hidden Markov models. In Proceedings of the 10th Annual Conference on Neural Information Processing Systems (NIPS), Denver, CO, USA, 3–5 December 1996; pp. 648–654. [Google Scholar]
- Sakoe, H.; Chiba, S. A dynamic programming approach to continuous speech recognition. In Proceedings of the 7th International congress on acoustics, Budapest, Hungary, 18 August 1971; pp. 65–69. [Google Scholar]
- Sakoe, H.; Chiba, S. Dynamic programming algorithm optimization for spoken word recognition. IEEE Trans. Acoust. Speech Signal Process. 1978, 26, 43–49. [Google Scholar] [CrossRef]
- Faloutsos, C.; Ranganathan, M.; Manolopoulos, Y. Fast subsequence matching in time series databases. Sigmod. Record. 1994, 23, 419–429. [Google Scholar] [CrossRef]
- Cánovas, J.S.; Guillamón, A.; Ruiz-Abellón, M.C. Using permutations for hierarchical clustering of time series. Entropy 2019, 21, 306. [Google Scholar] [CrossRef]
- Yi, B.K.; Faloutsos, C. Fast time sequence indexing for arbitrary Lp norms. In Proceedings of the 26th International Conferenceon Very Large Data Bases, San Francisco, CA, USA, 10–14 September 2000; pp. 385–394. [Google Scholar]
- Vlachos, M.; Kollios, G.; Gunopulos, D. Discovering similar multidimension altrajectories. In Proceedings of the 18th International Conference on Data Engineering, San Jose, CA, USA, 26 February–1 March 2002; pp. 673–684. [Google Scholar]
- Li, H.L.; Liang, Y.; Wang, S.C. Review on dynamic time warping in time series data mining. Control Dec. 2019, 33, 1035–1353. [Google Scholar]
- Berndt, D.; Clifford, J. Using dynamic tune warping to find patterns in sequences working notes of the knowledge discovery in databases workshop. Knowl. Inf. Syst. 1994, 35, 9–370. [Google Scholar]
- Fishman, E.; Washington, S.; Haworth, N. Bike share: A synthesis of the literature. Transp. Rev. 2013, 33, 148–165. [Google Scholar] [CrossRef]
Figure 1.
Bike-sharing program in China. PBS: public bike-sharing; FFBS: free-floating bike-sharing.
Figure 1.
Bike-sharing program in China. PBS: public bike-sharing; FFBS: free-floating bike-sharing.

Figure 2.
FFBS parking hot spots in Beijing.

Figure 3.
Status of FFBS parking in Beijing.
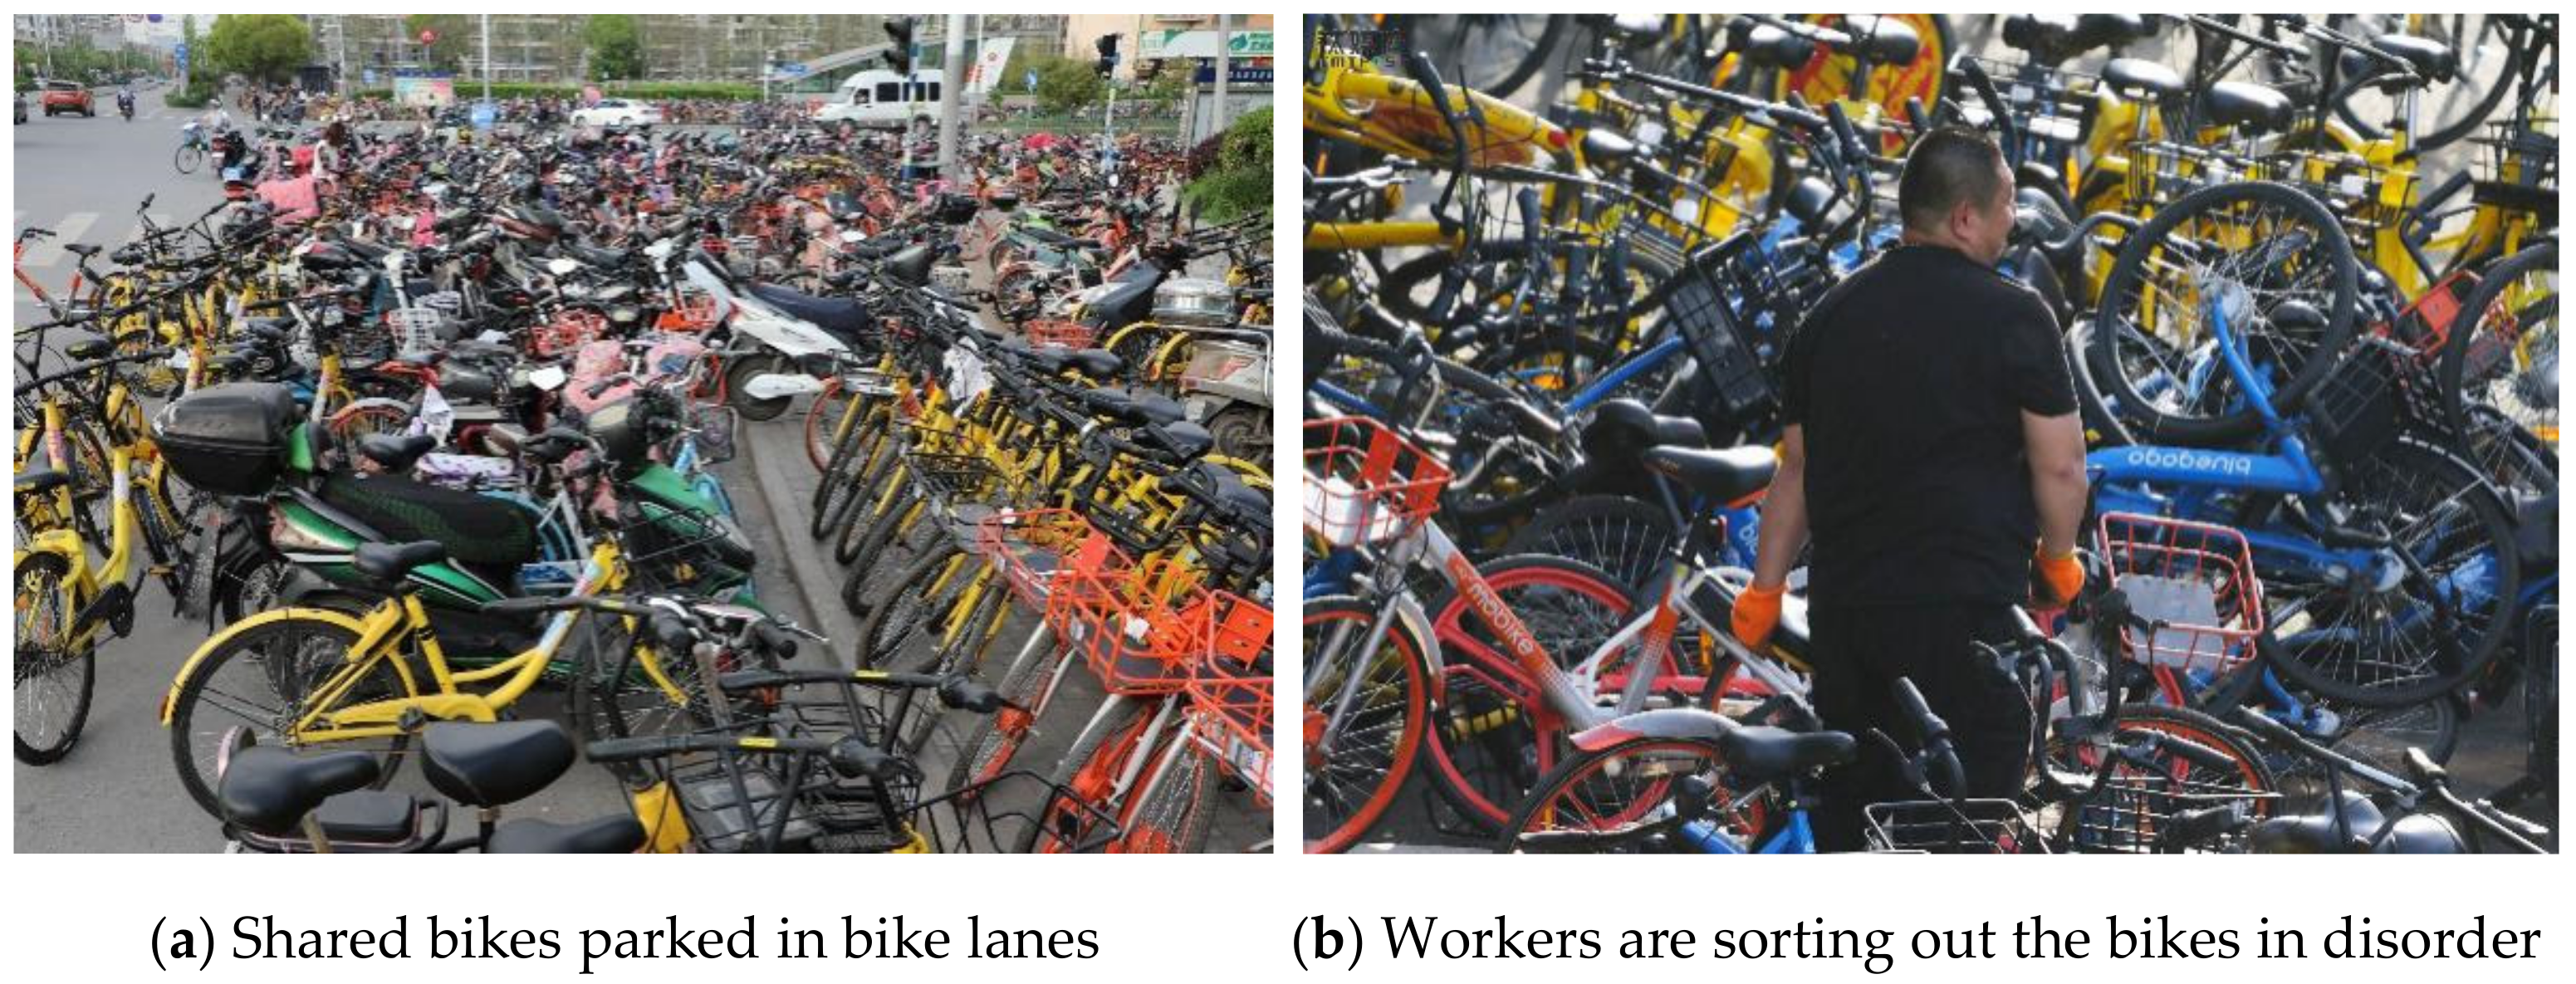
Figure 4.
Examples of dynamic time warping (DTW).

Figure 5.
Warping between two time series.

Figure 6.
Schematic map of Beijing subway stations.

Figure 7.
Construction of time series.
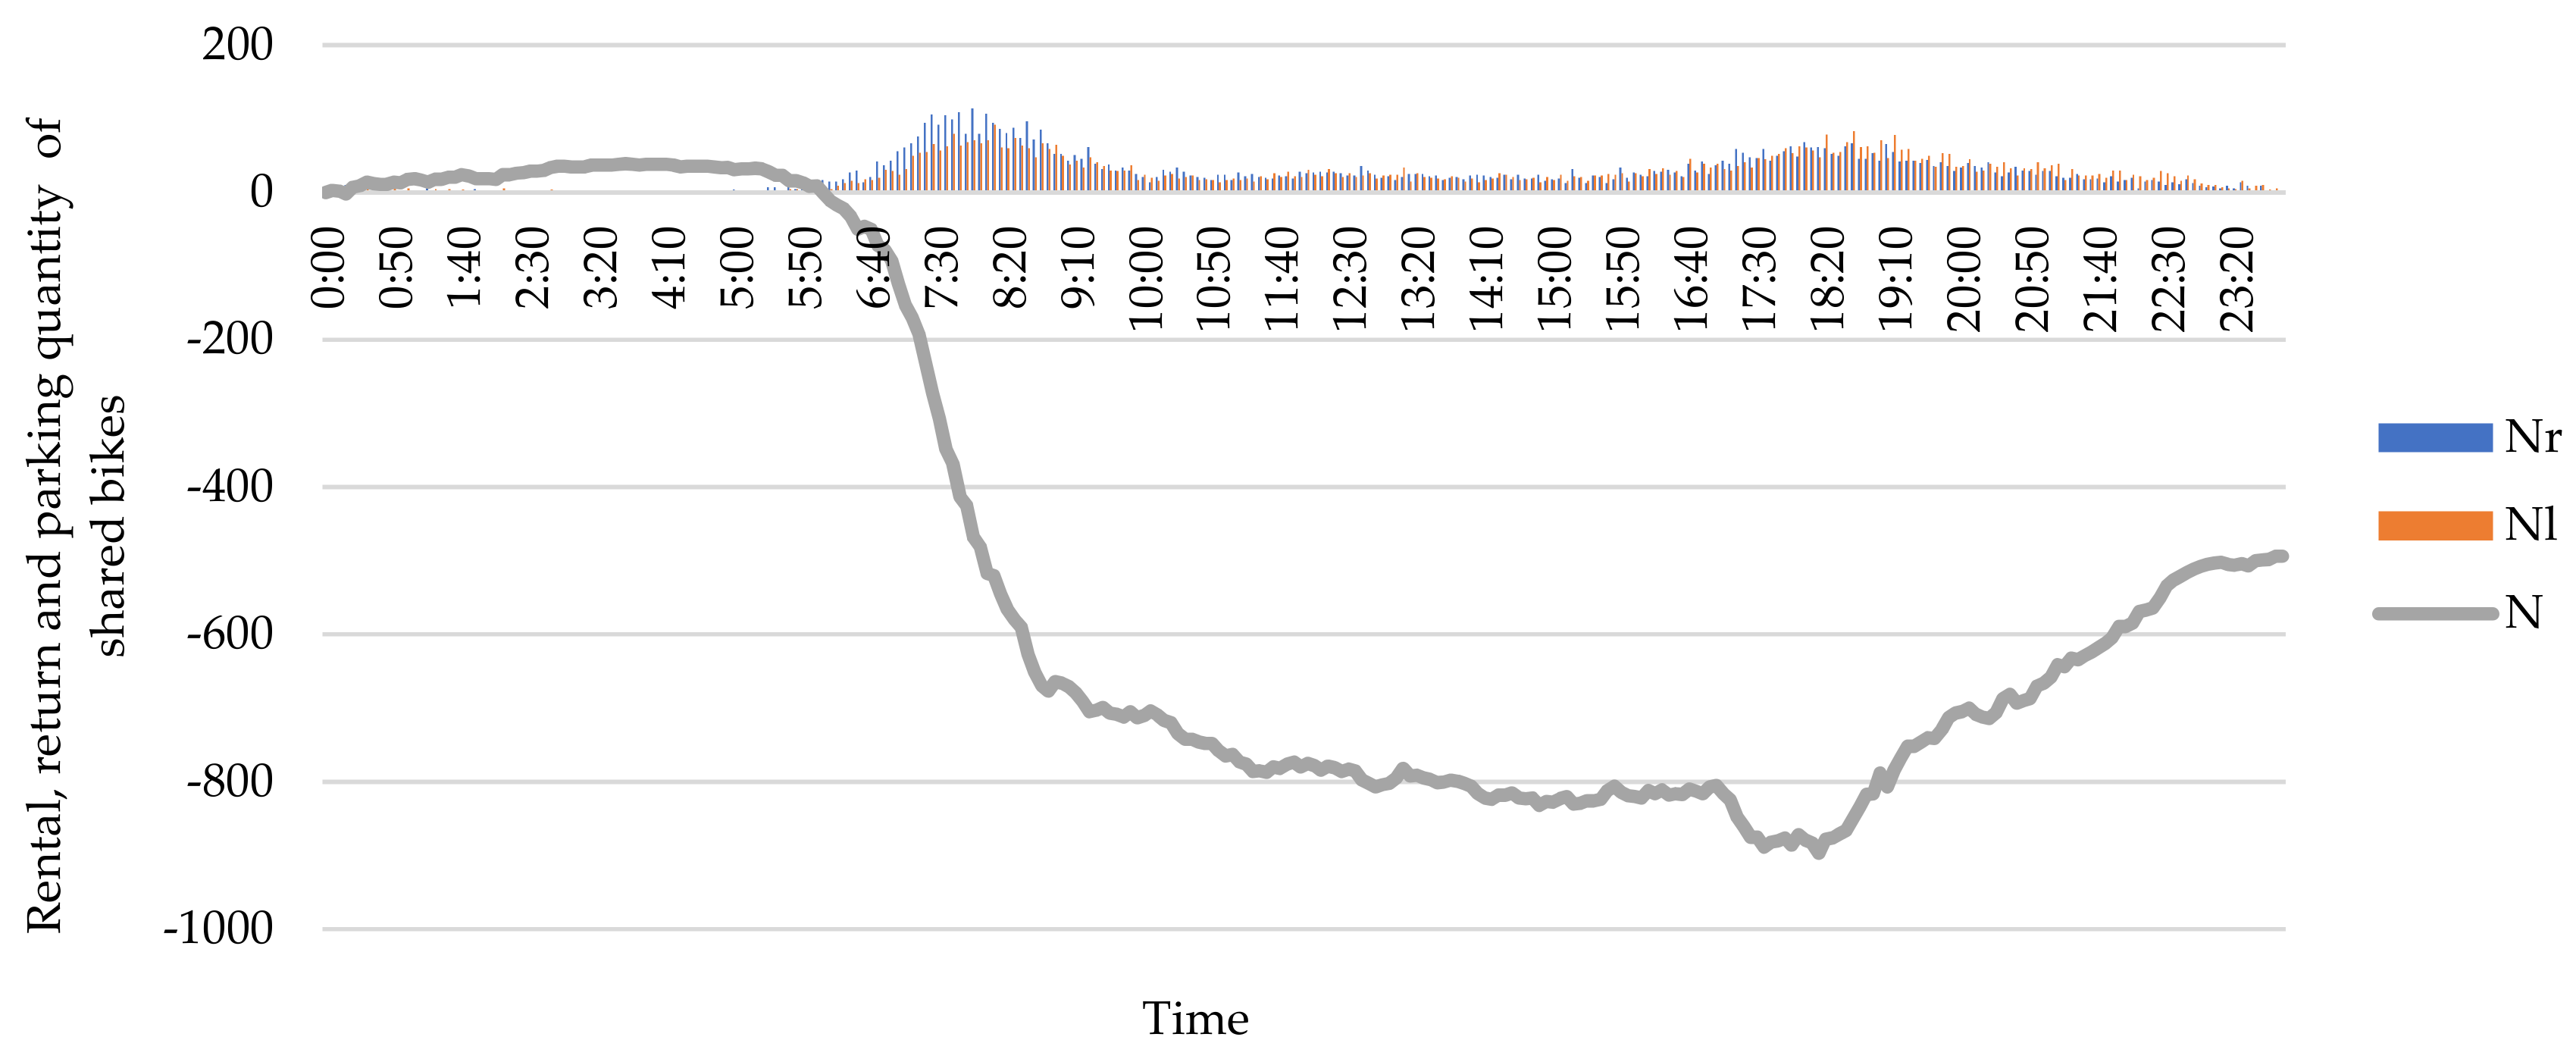
Figure 8.
Time series filtering.
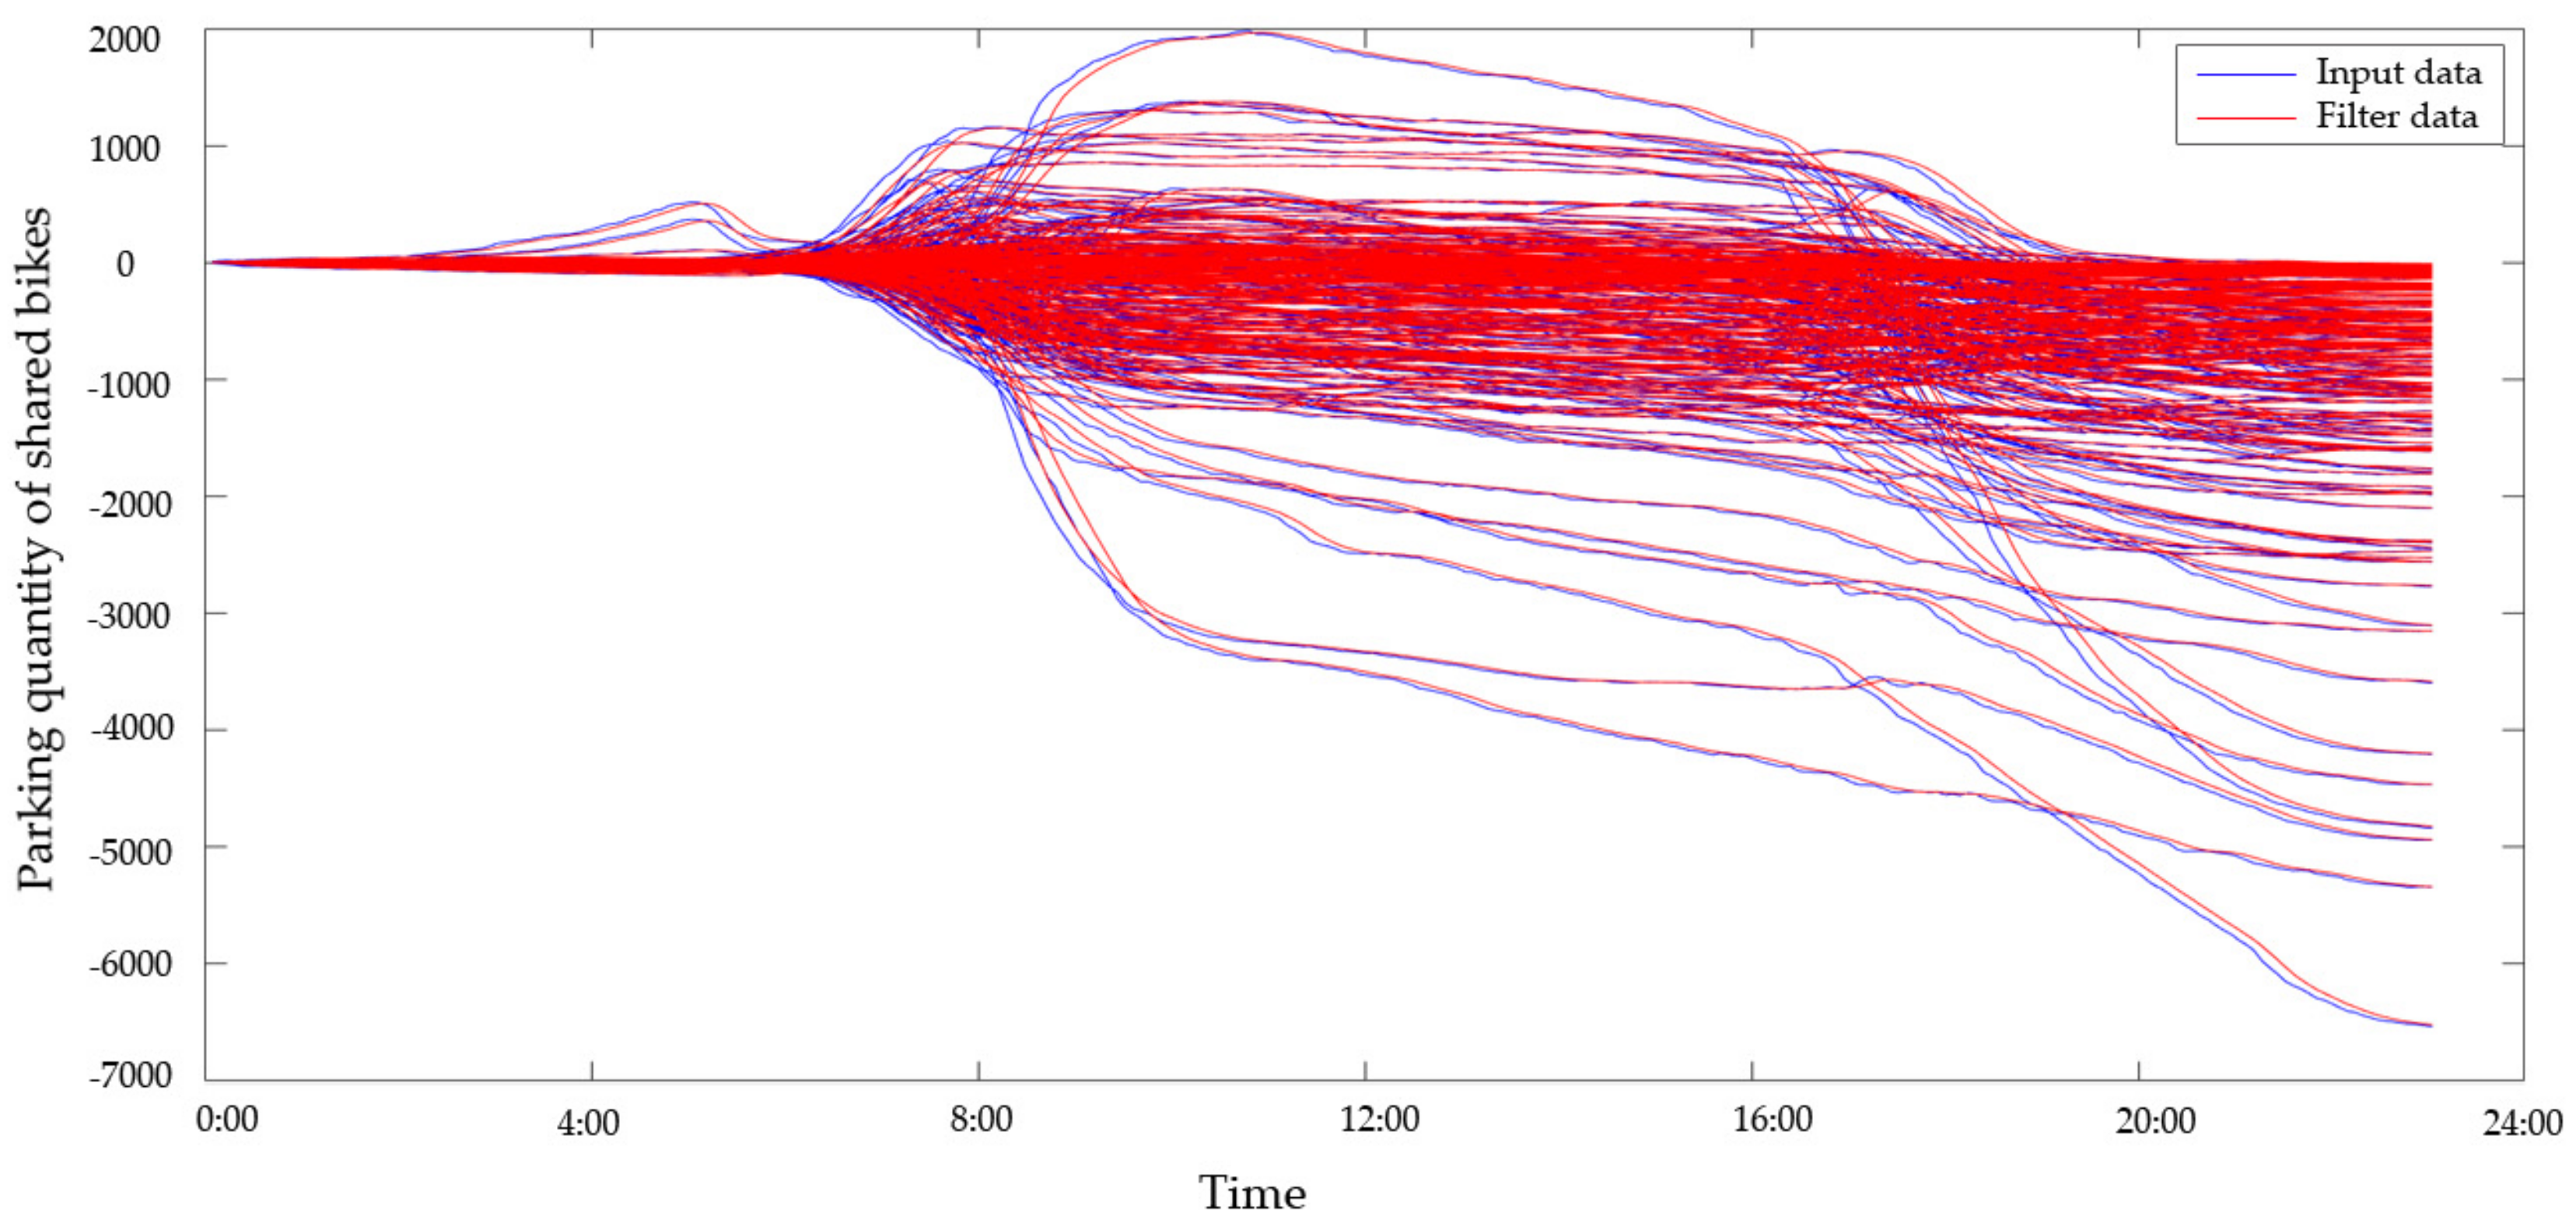
Figure 9.
Data standardization.
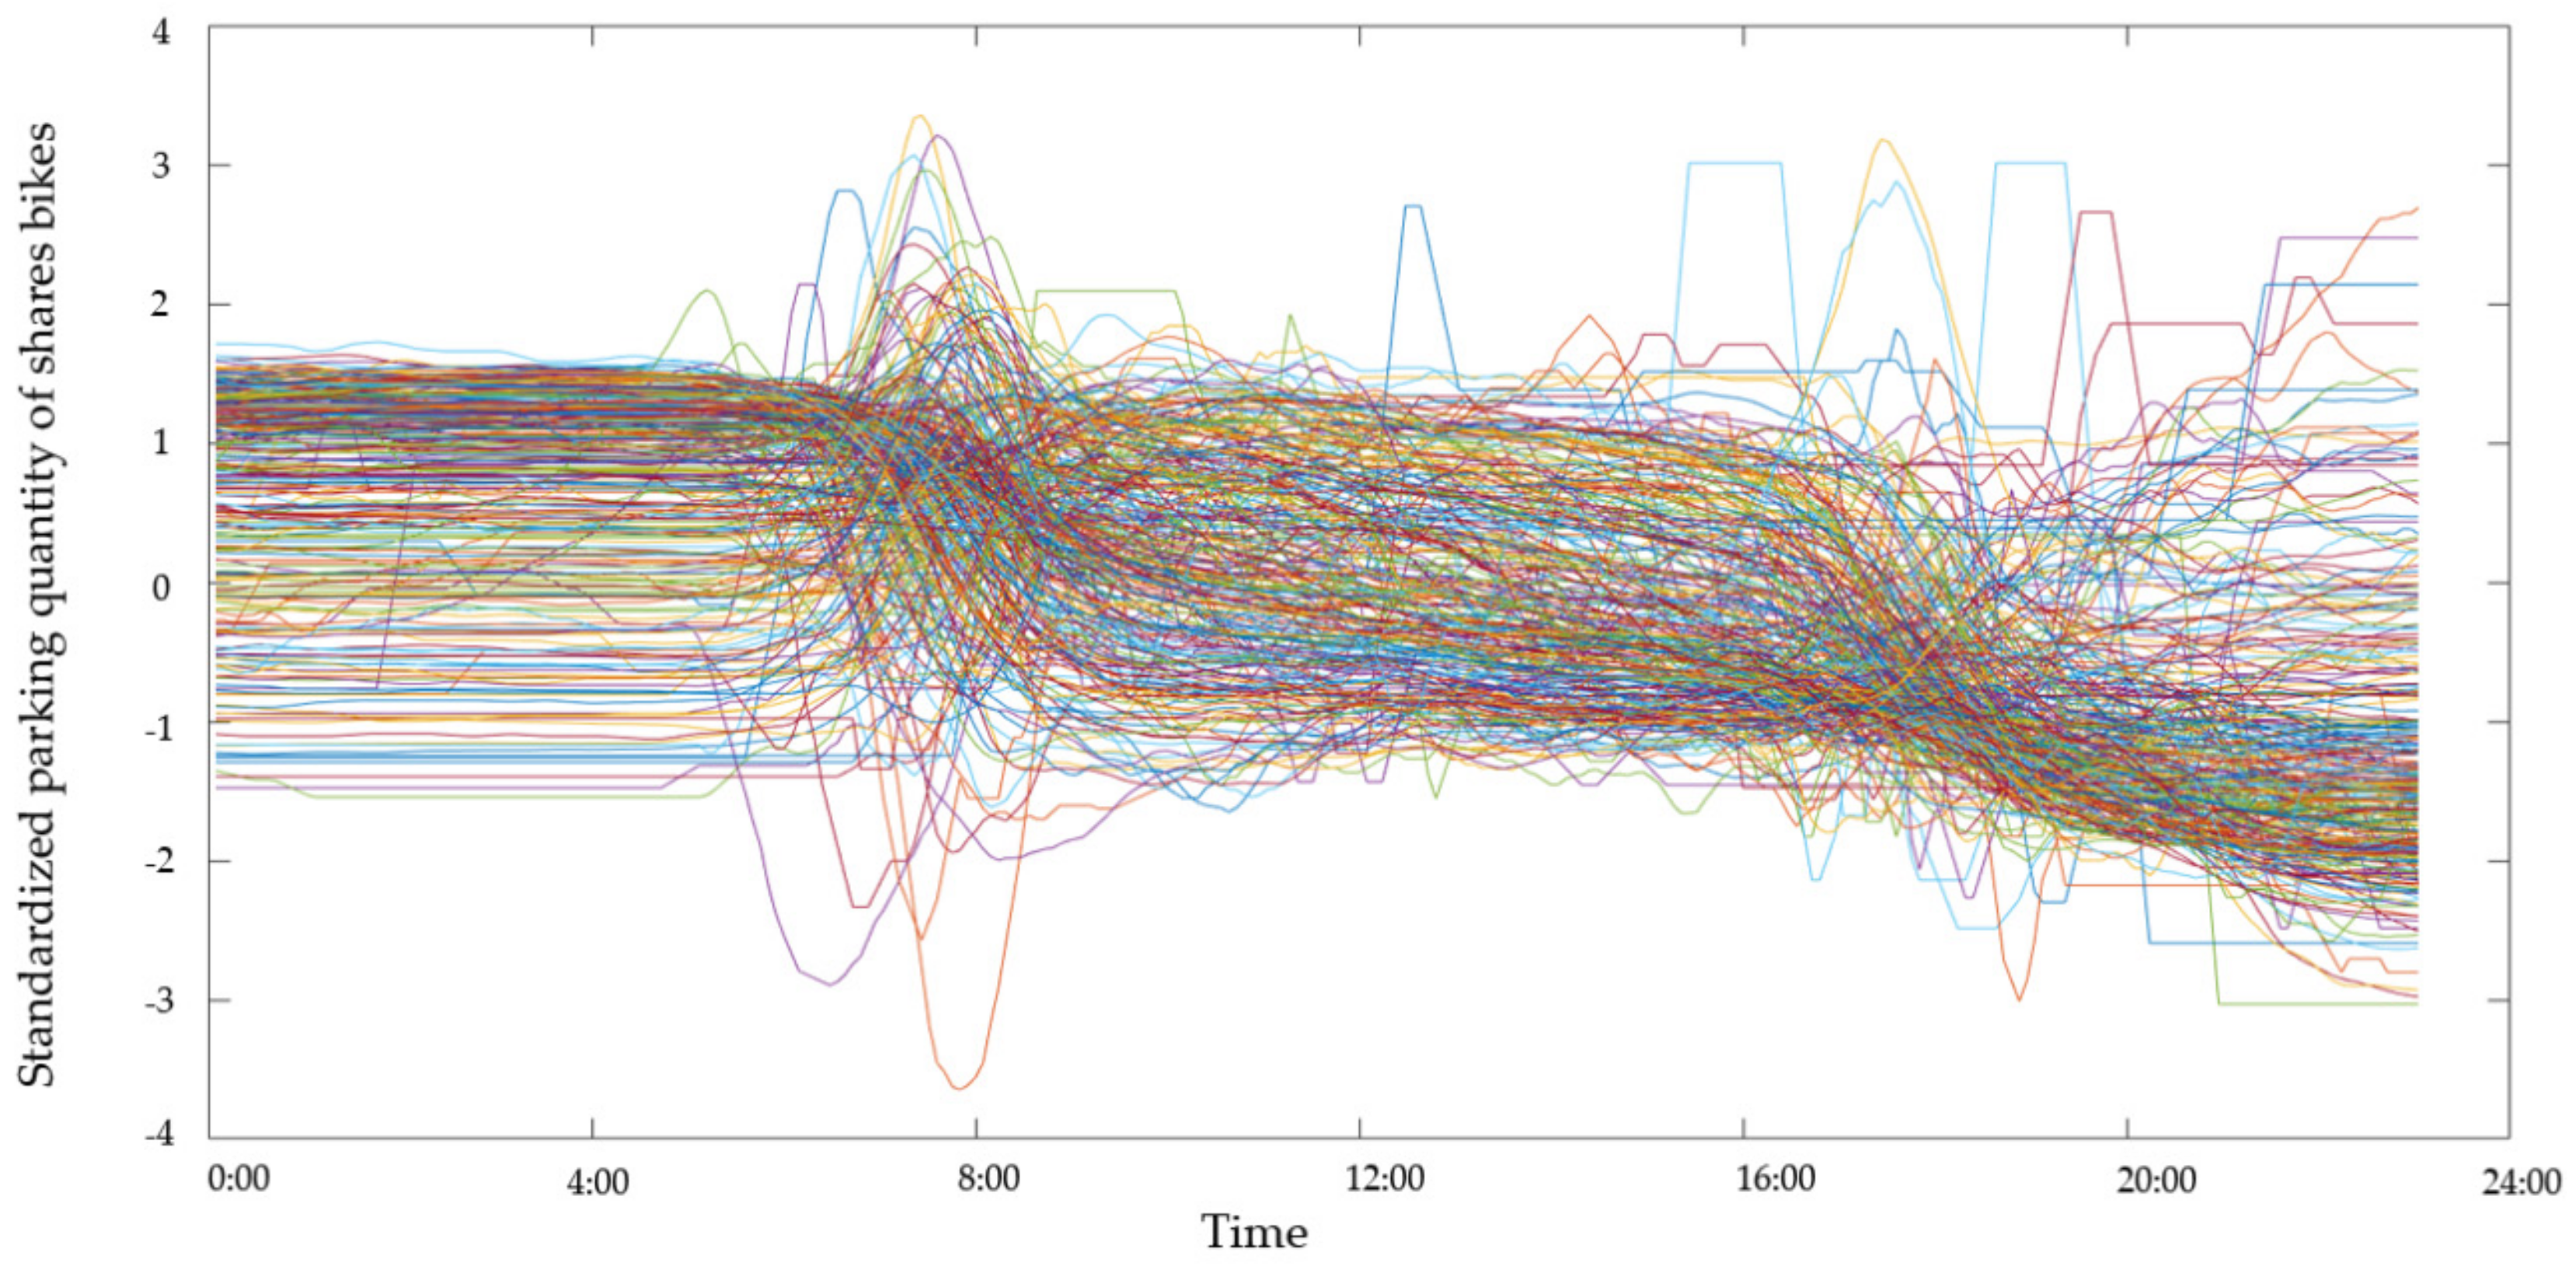
Figure 10.
Station classification based on FFBS parking intensity.

Figure 11.
Spatial distribution of subway stations with different intensities.
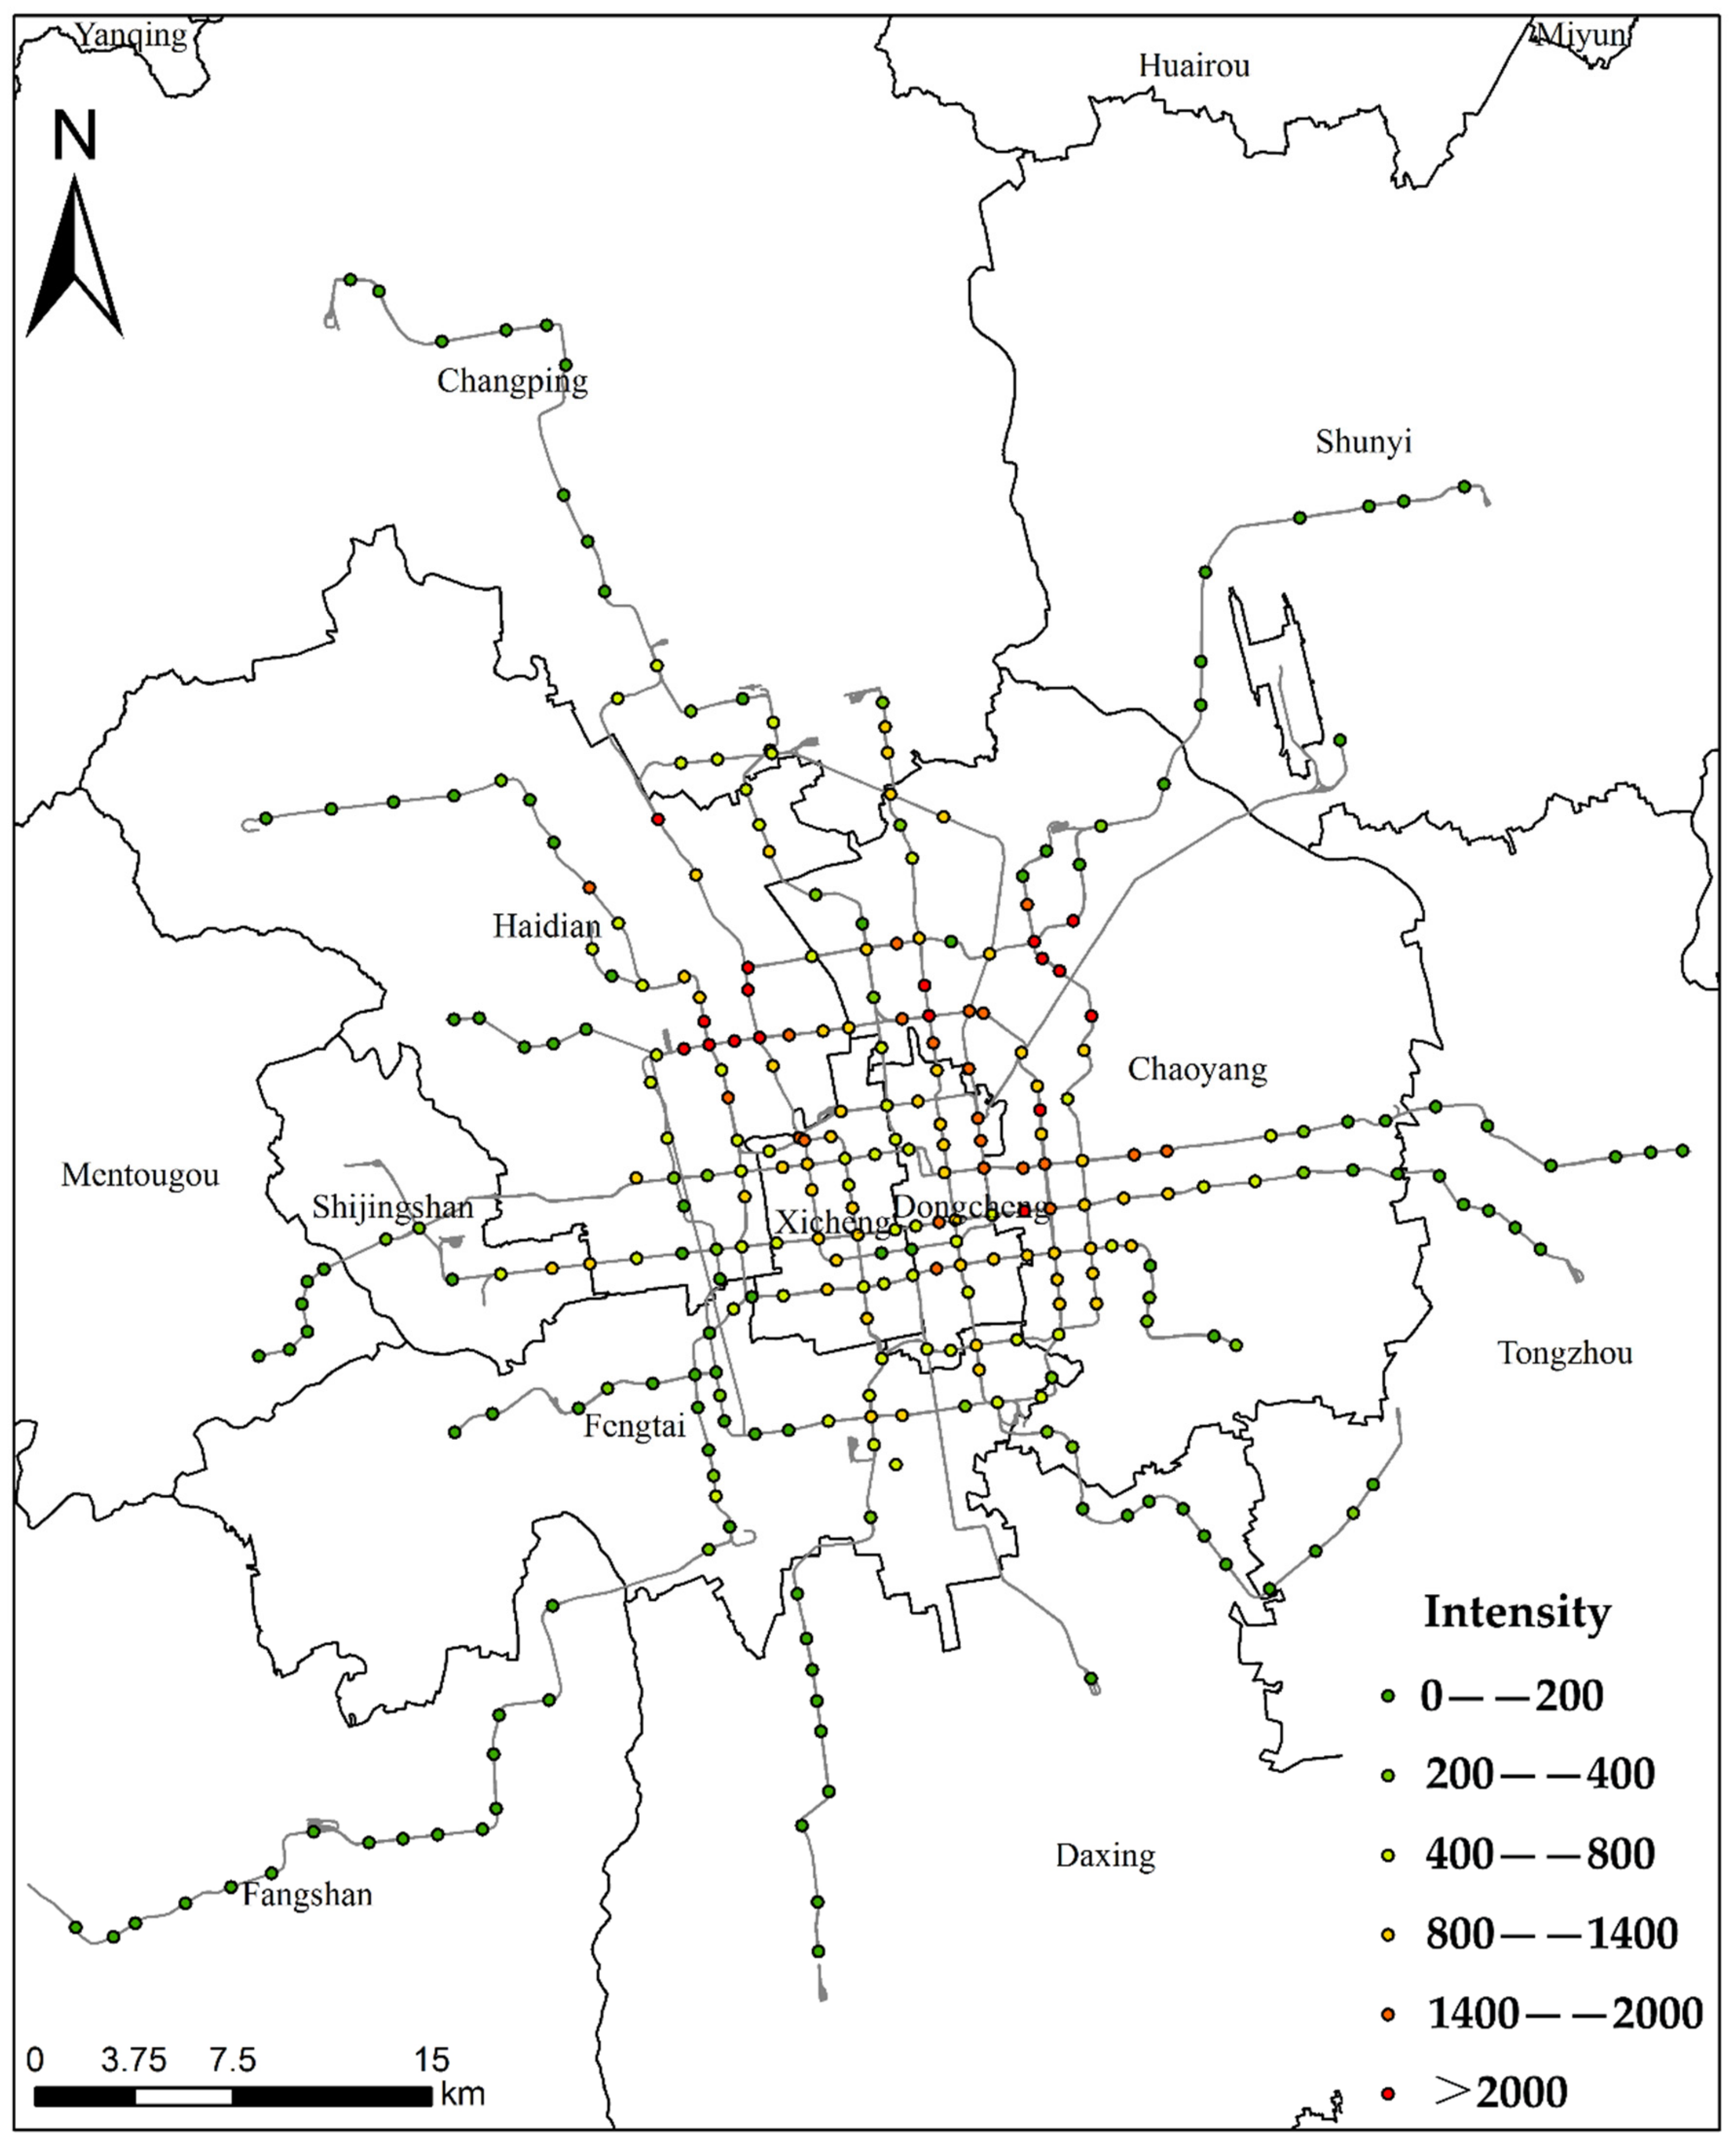
Figure 12.
Dendrogram of clustering results.
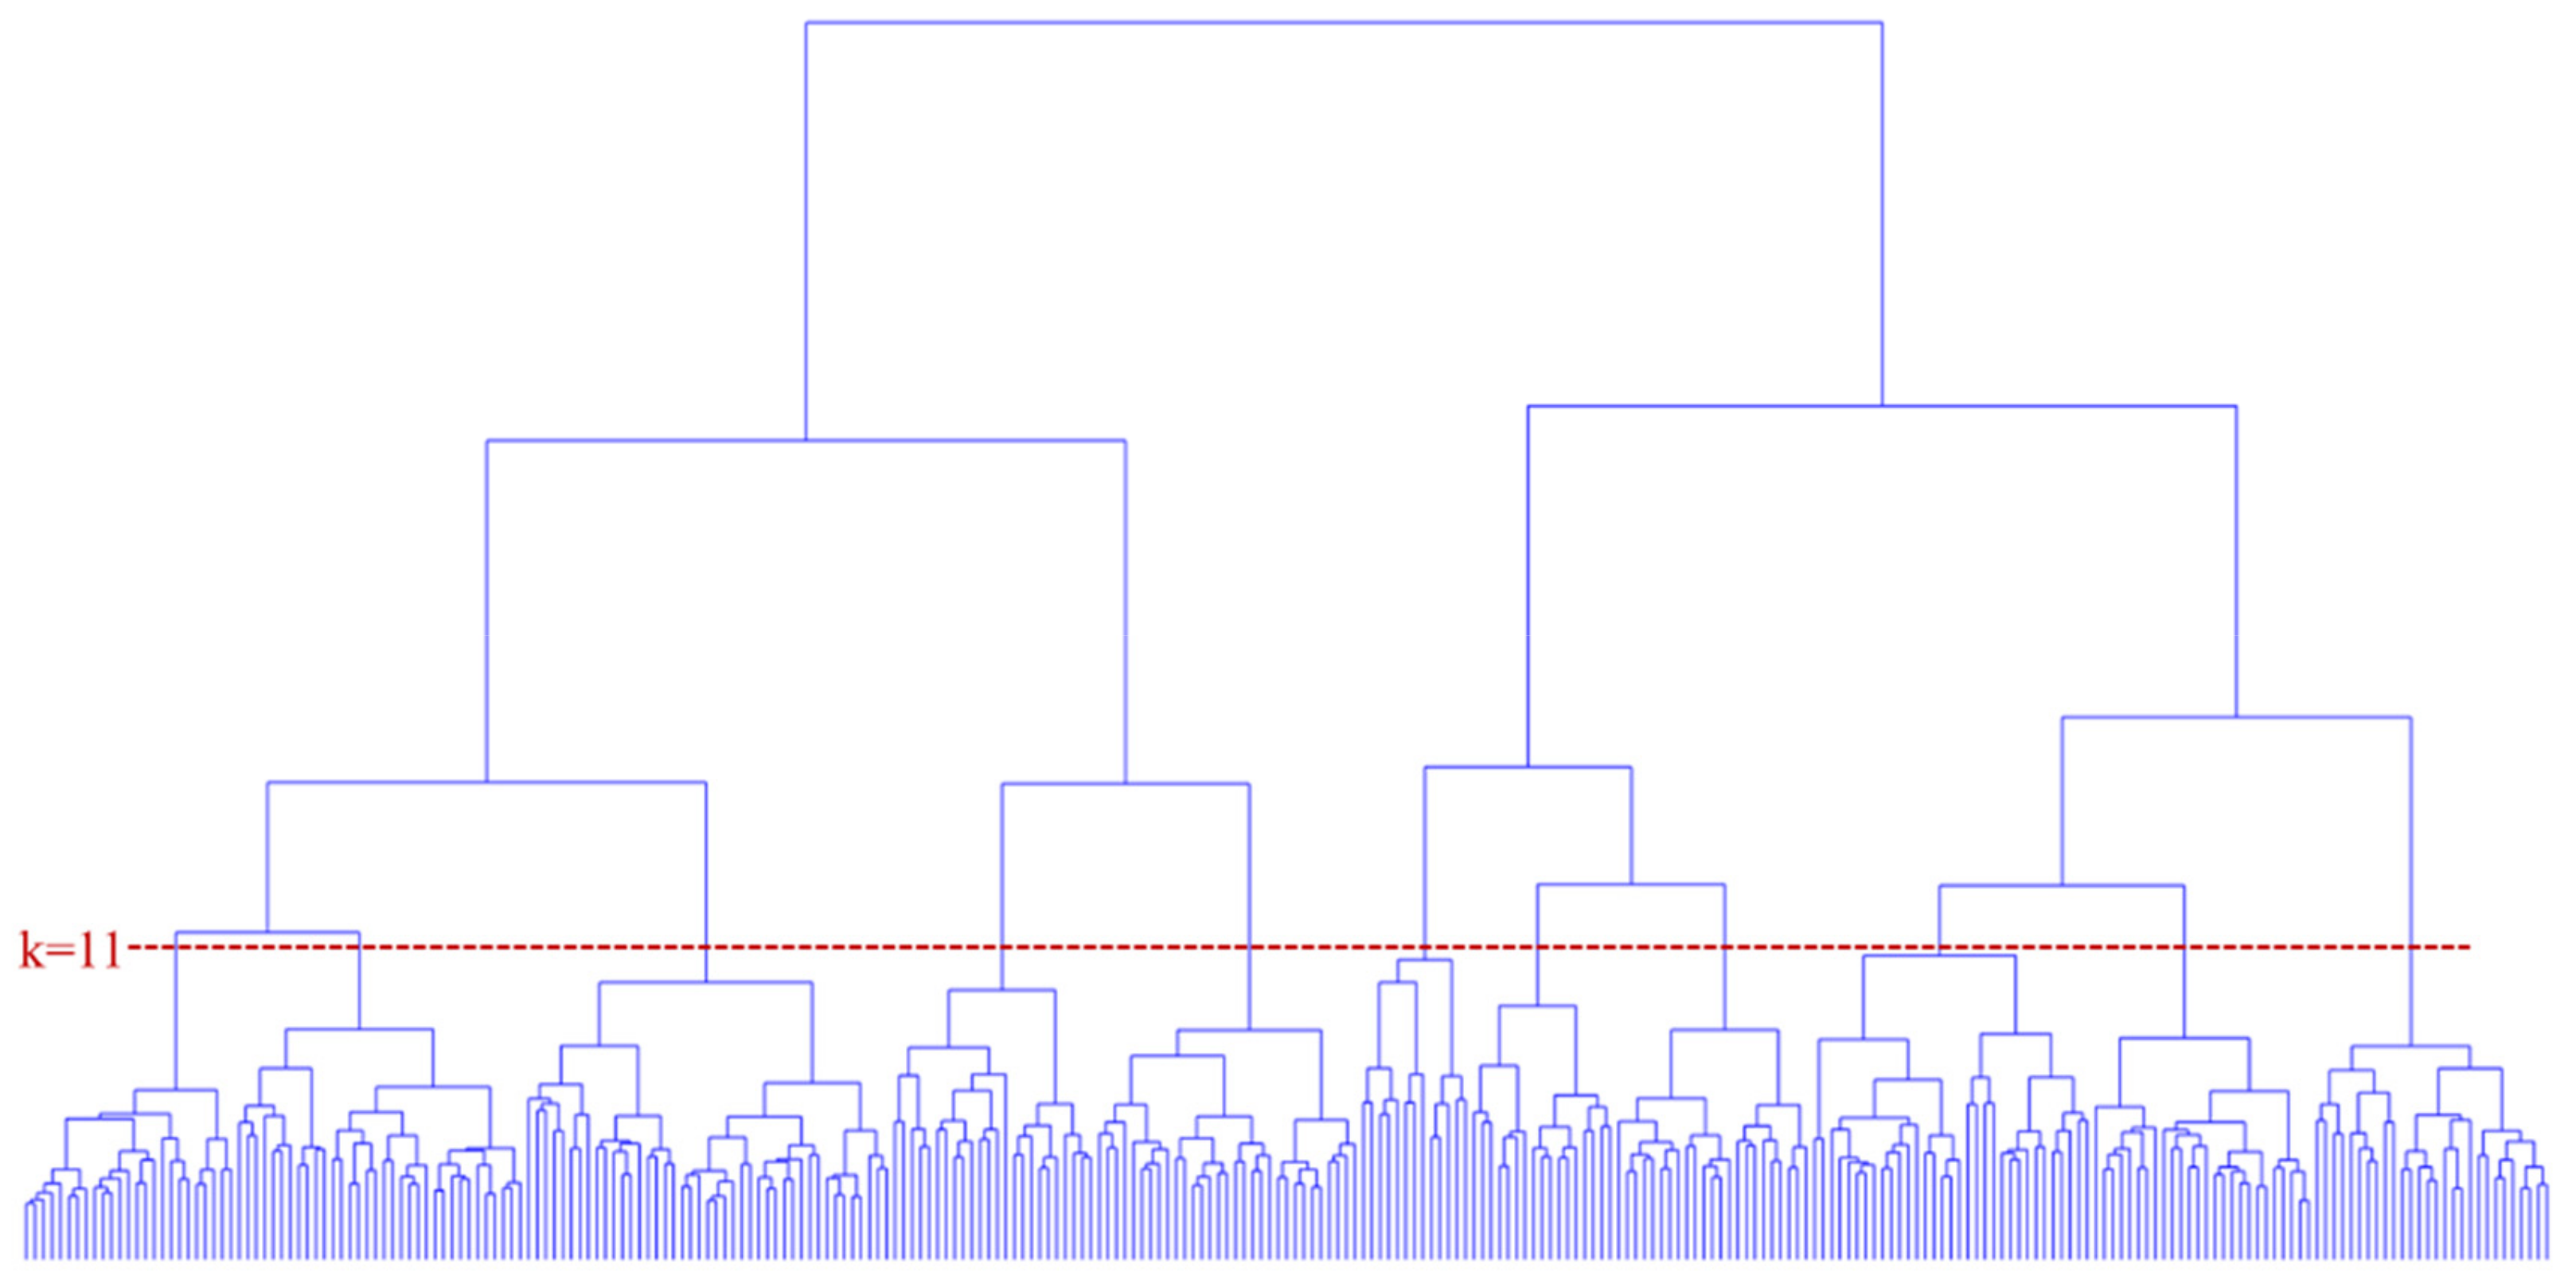
Figure 13.
Clustering results of 11 time series clusters.
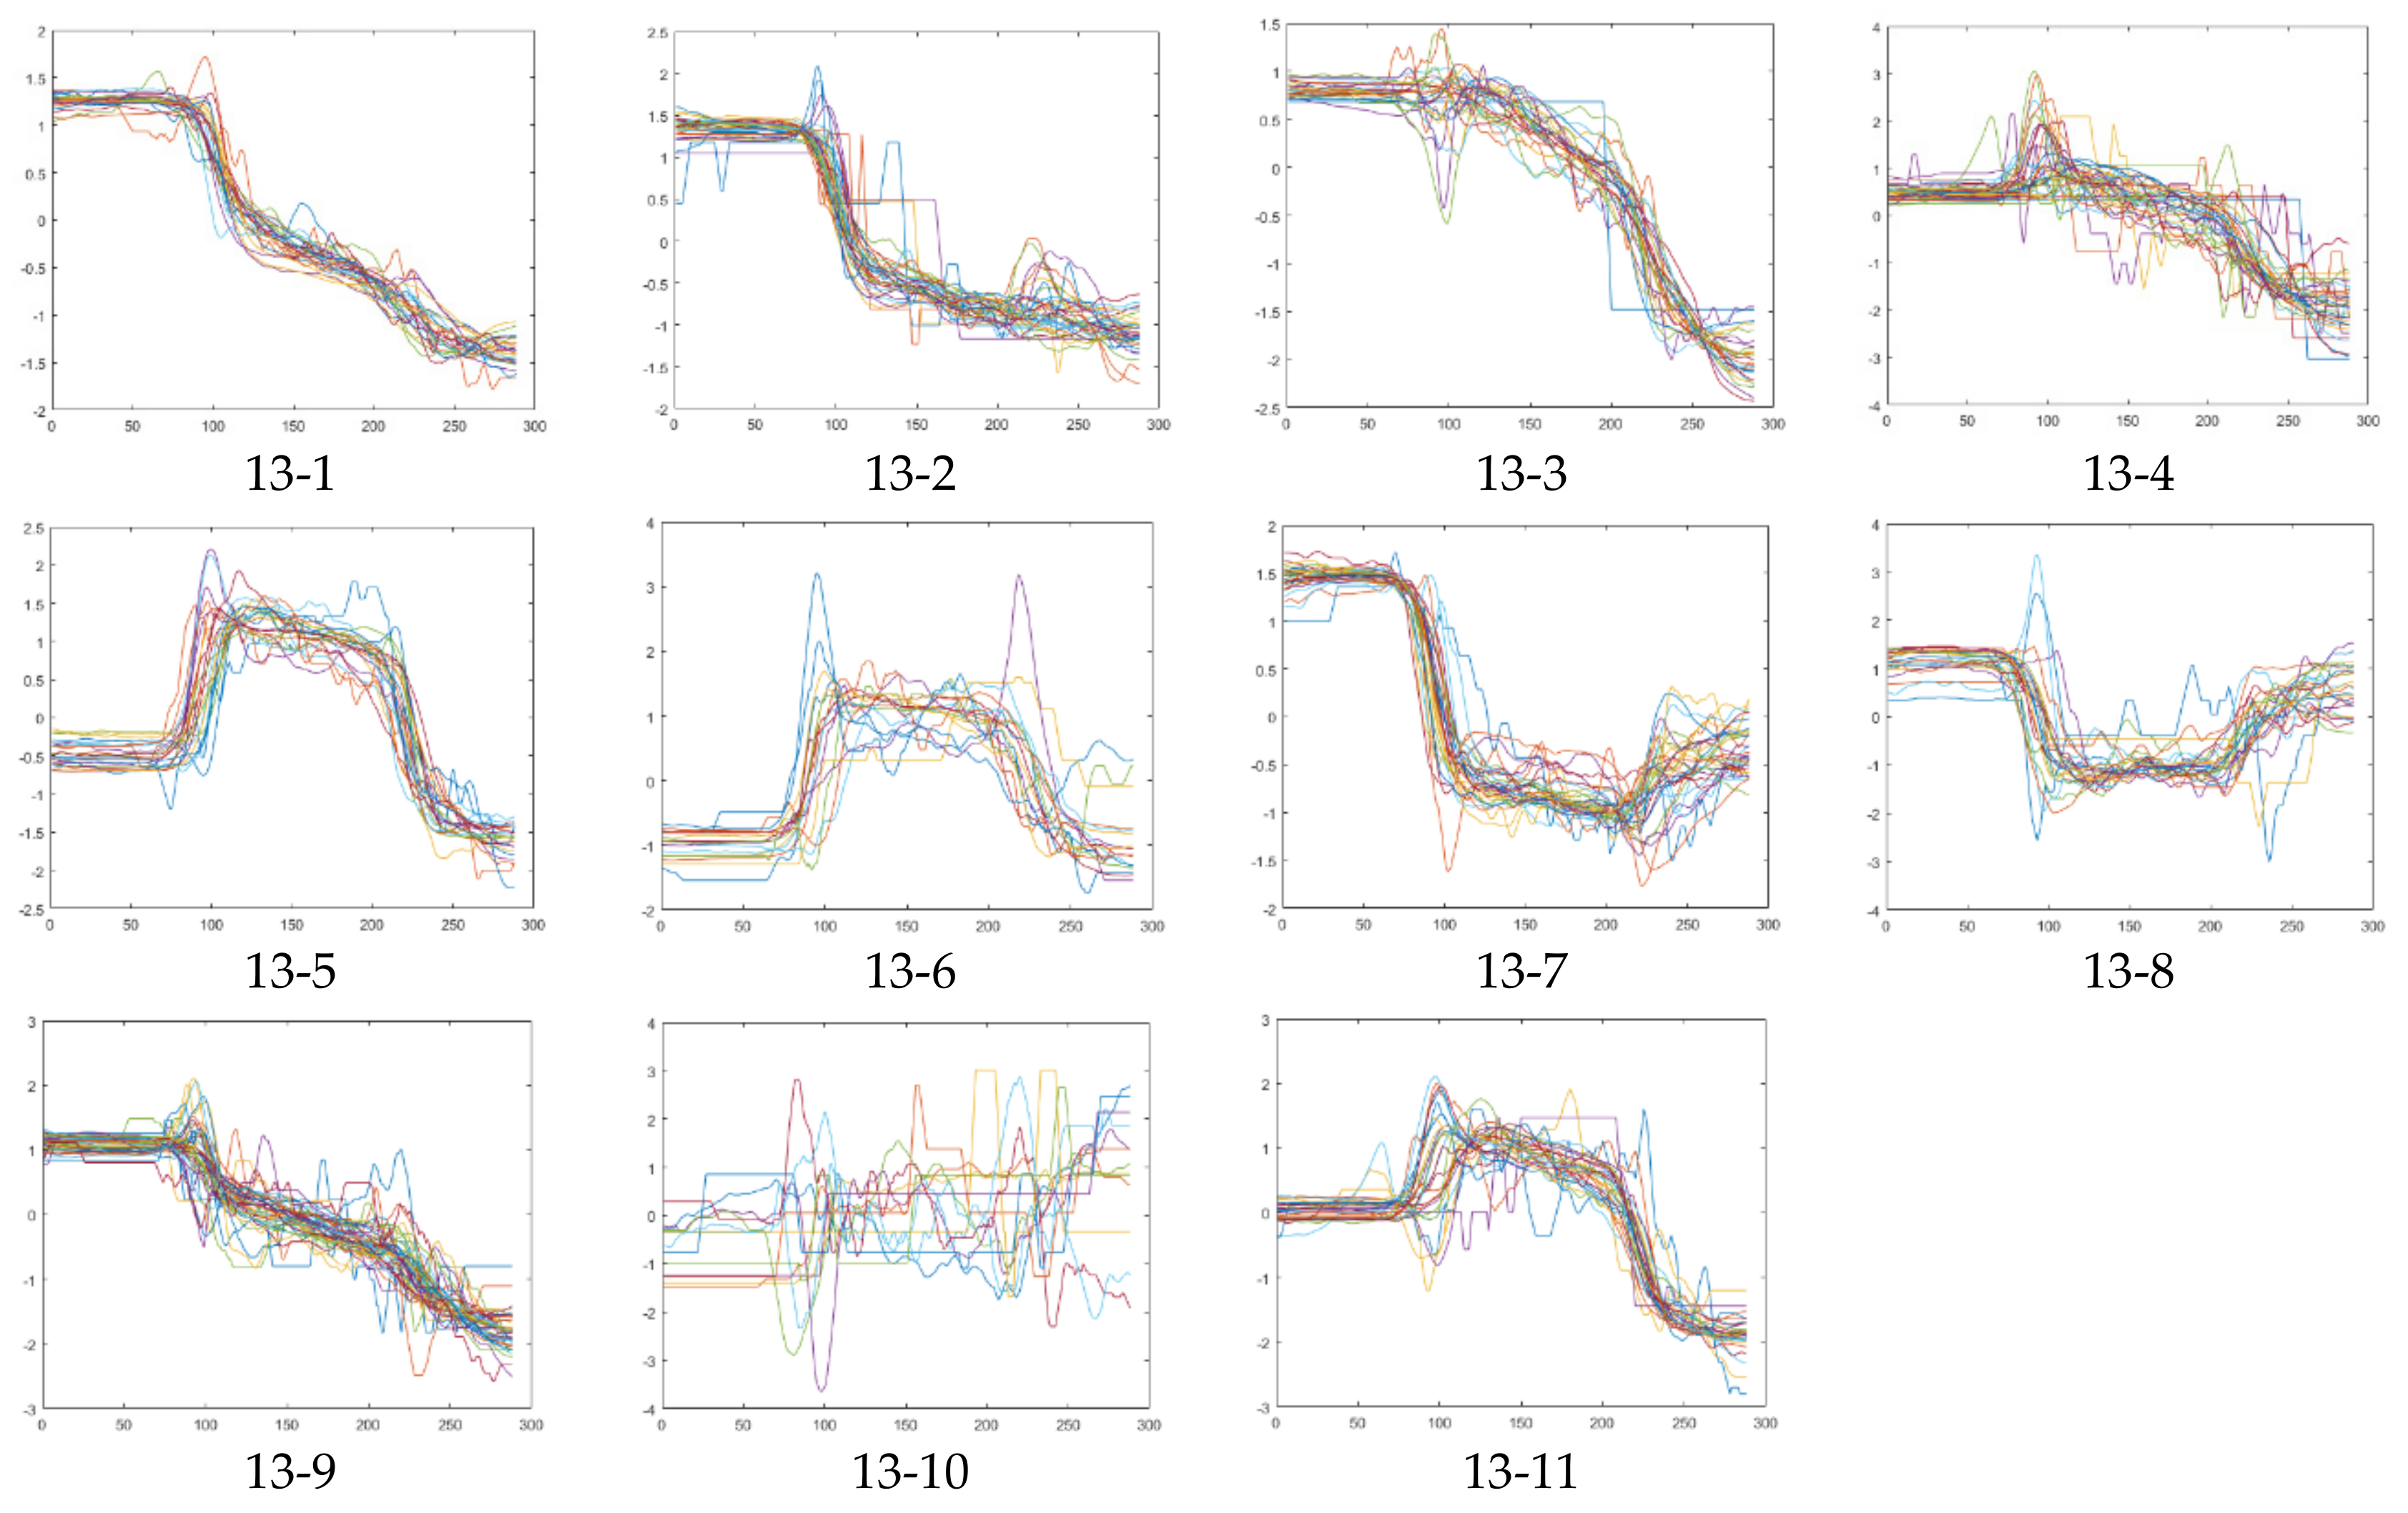
Figure 14.
Spatial distribution of subway stations with different clusters.

Figure 15.
Start and end times of critical periods.

Figure 16.
Curve slope of critical periods.
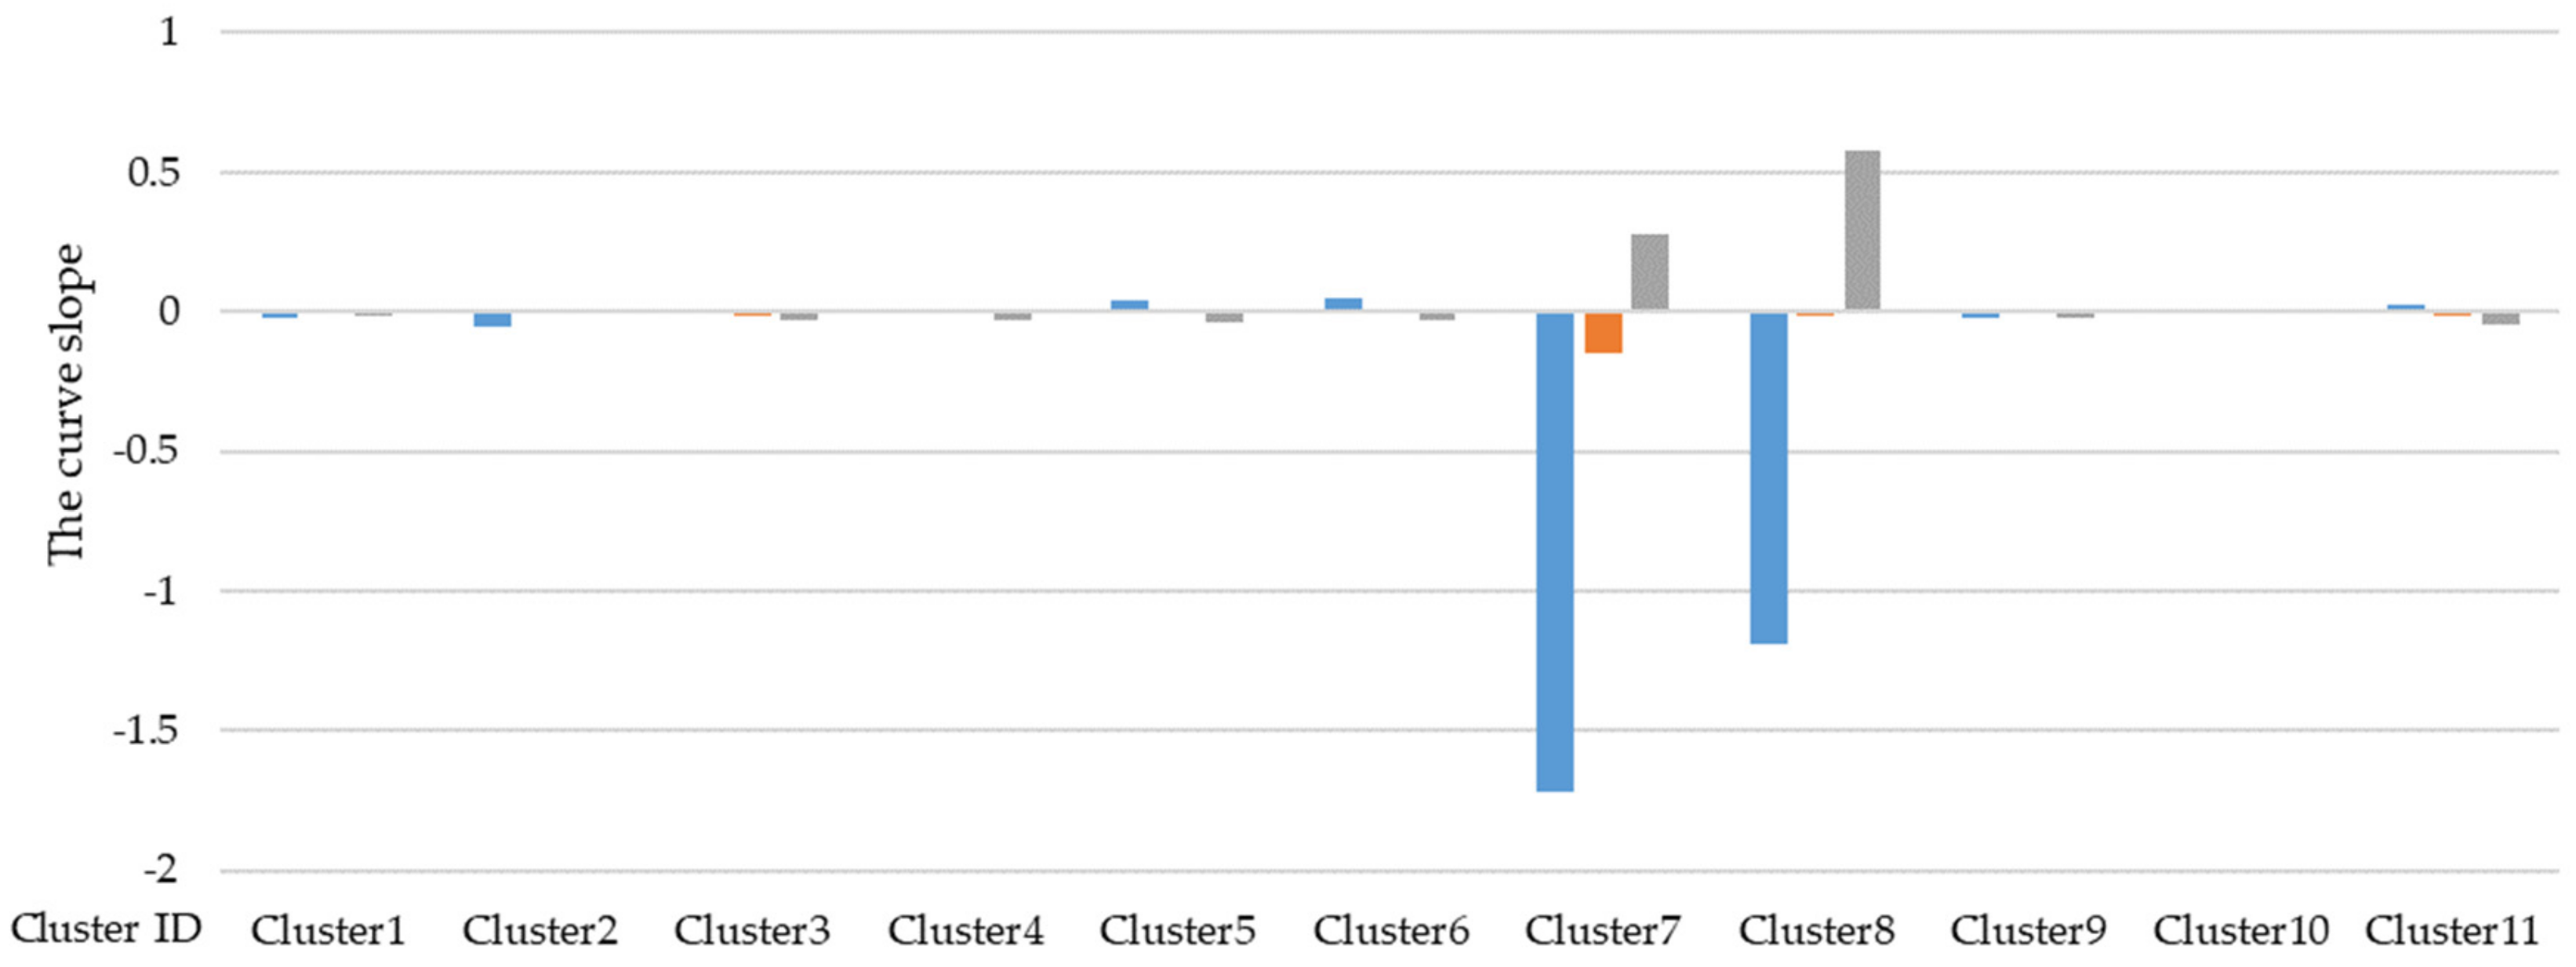
Figure 17.
FFBS parking area displayed in the monitoring platform.
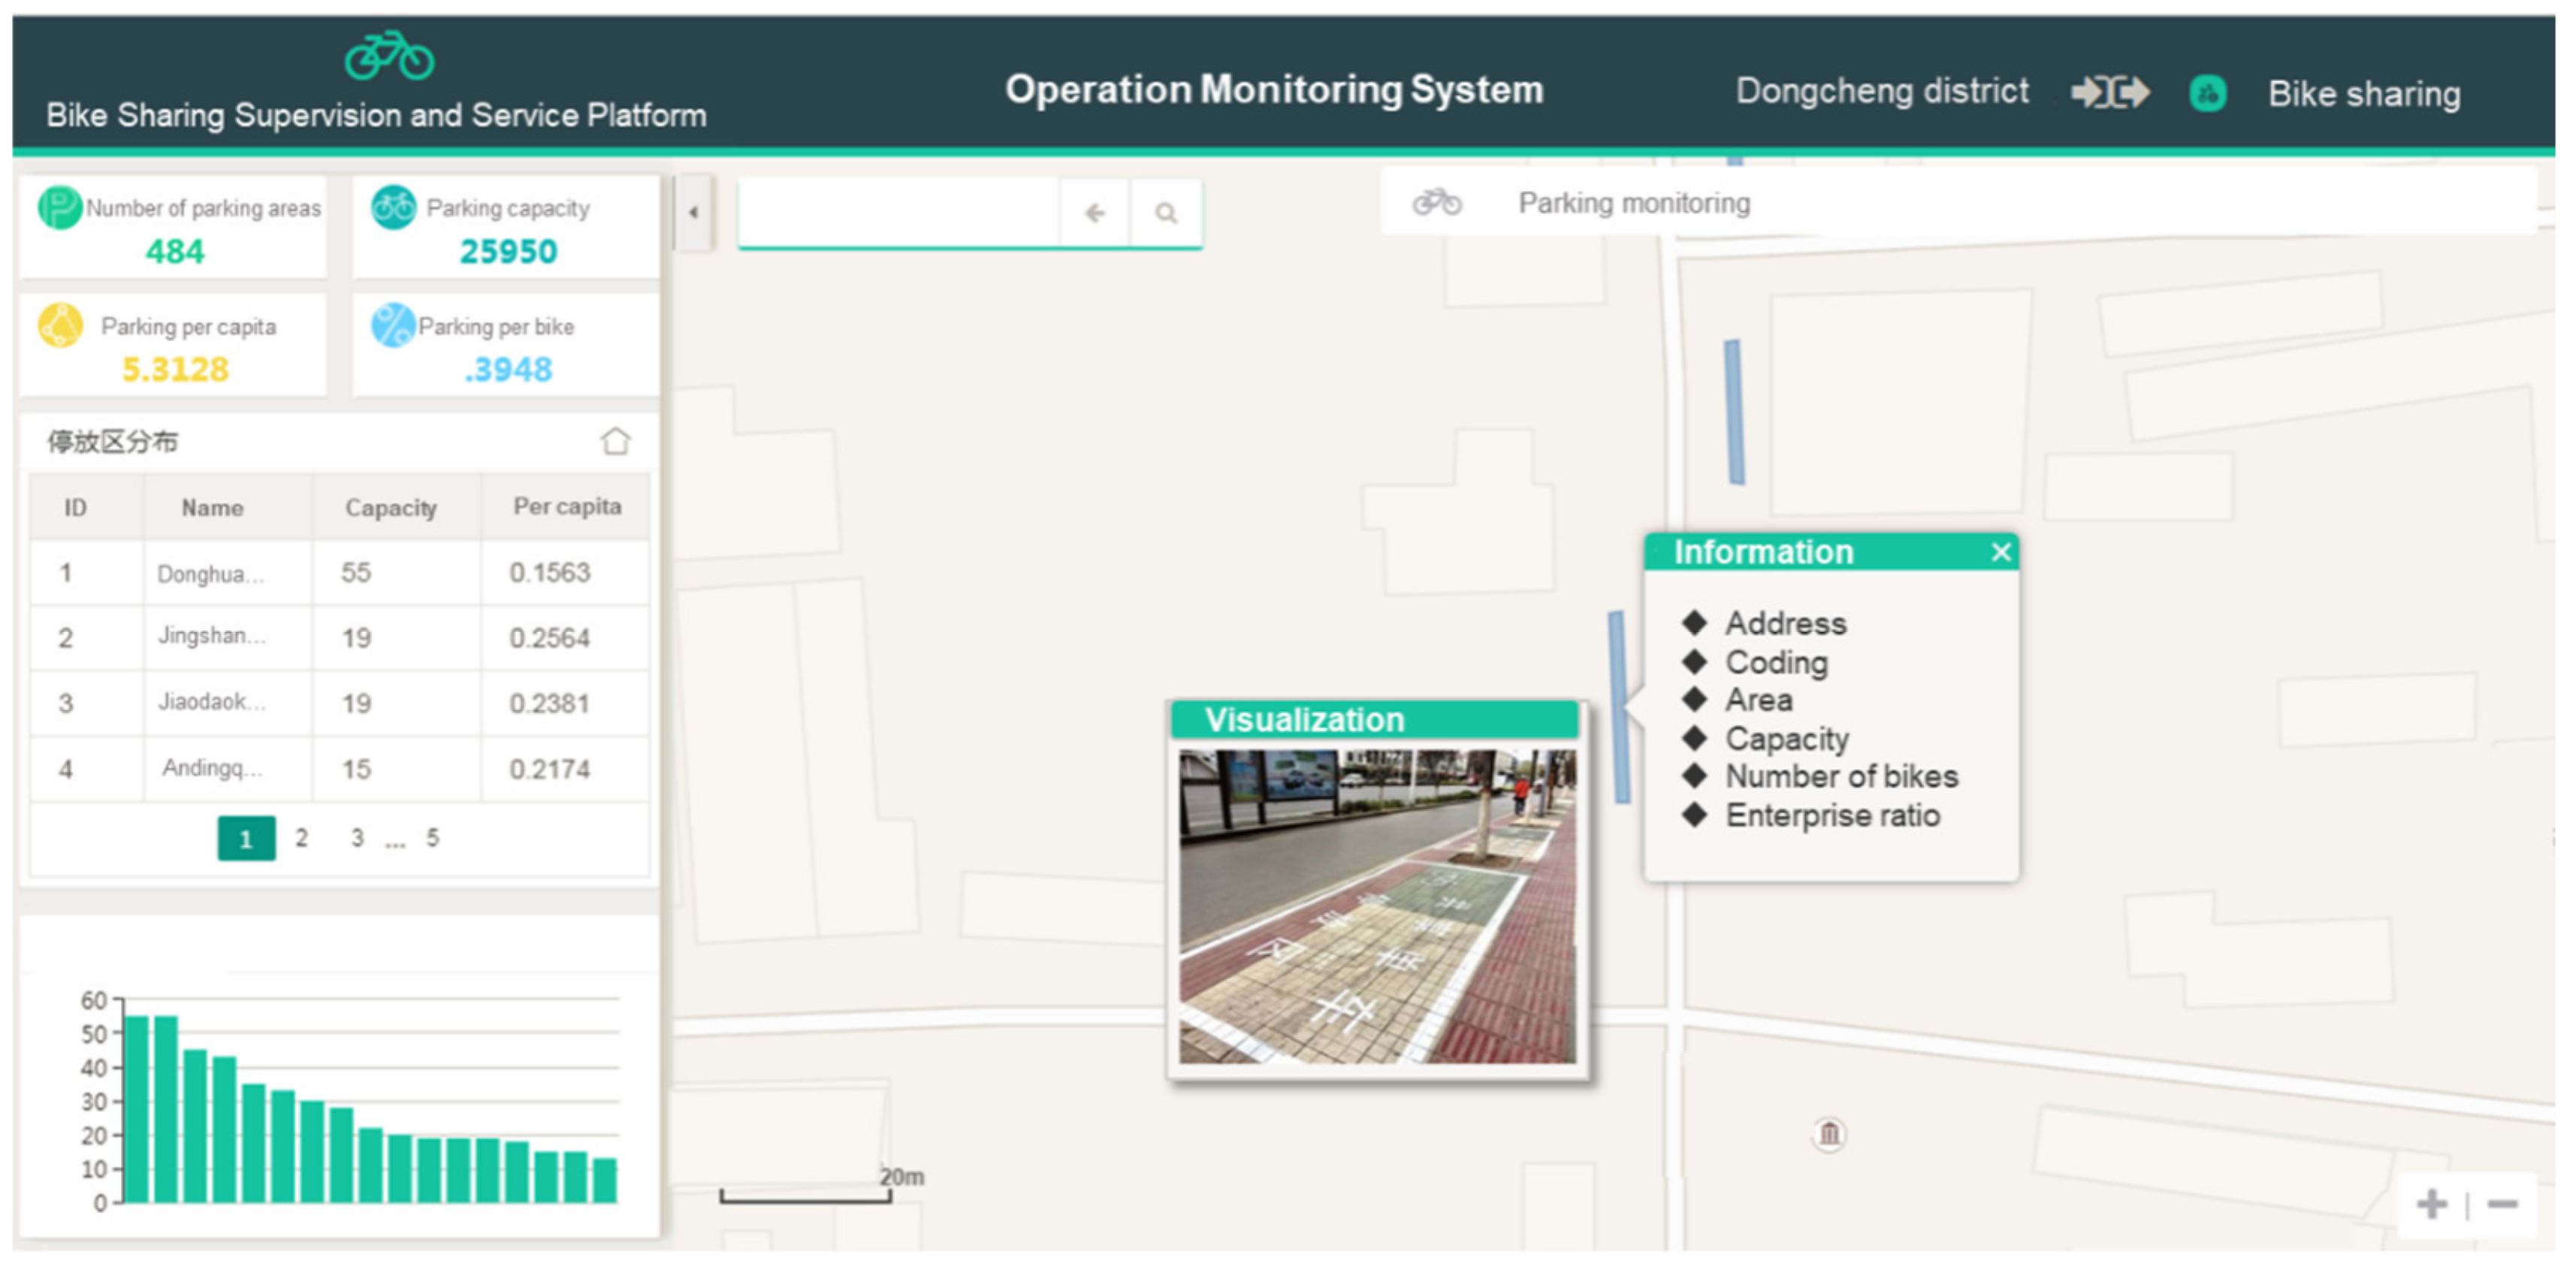
Figure 18.
M value of subway stations with FFBS parking intensity <200.
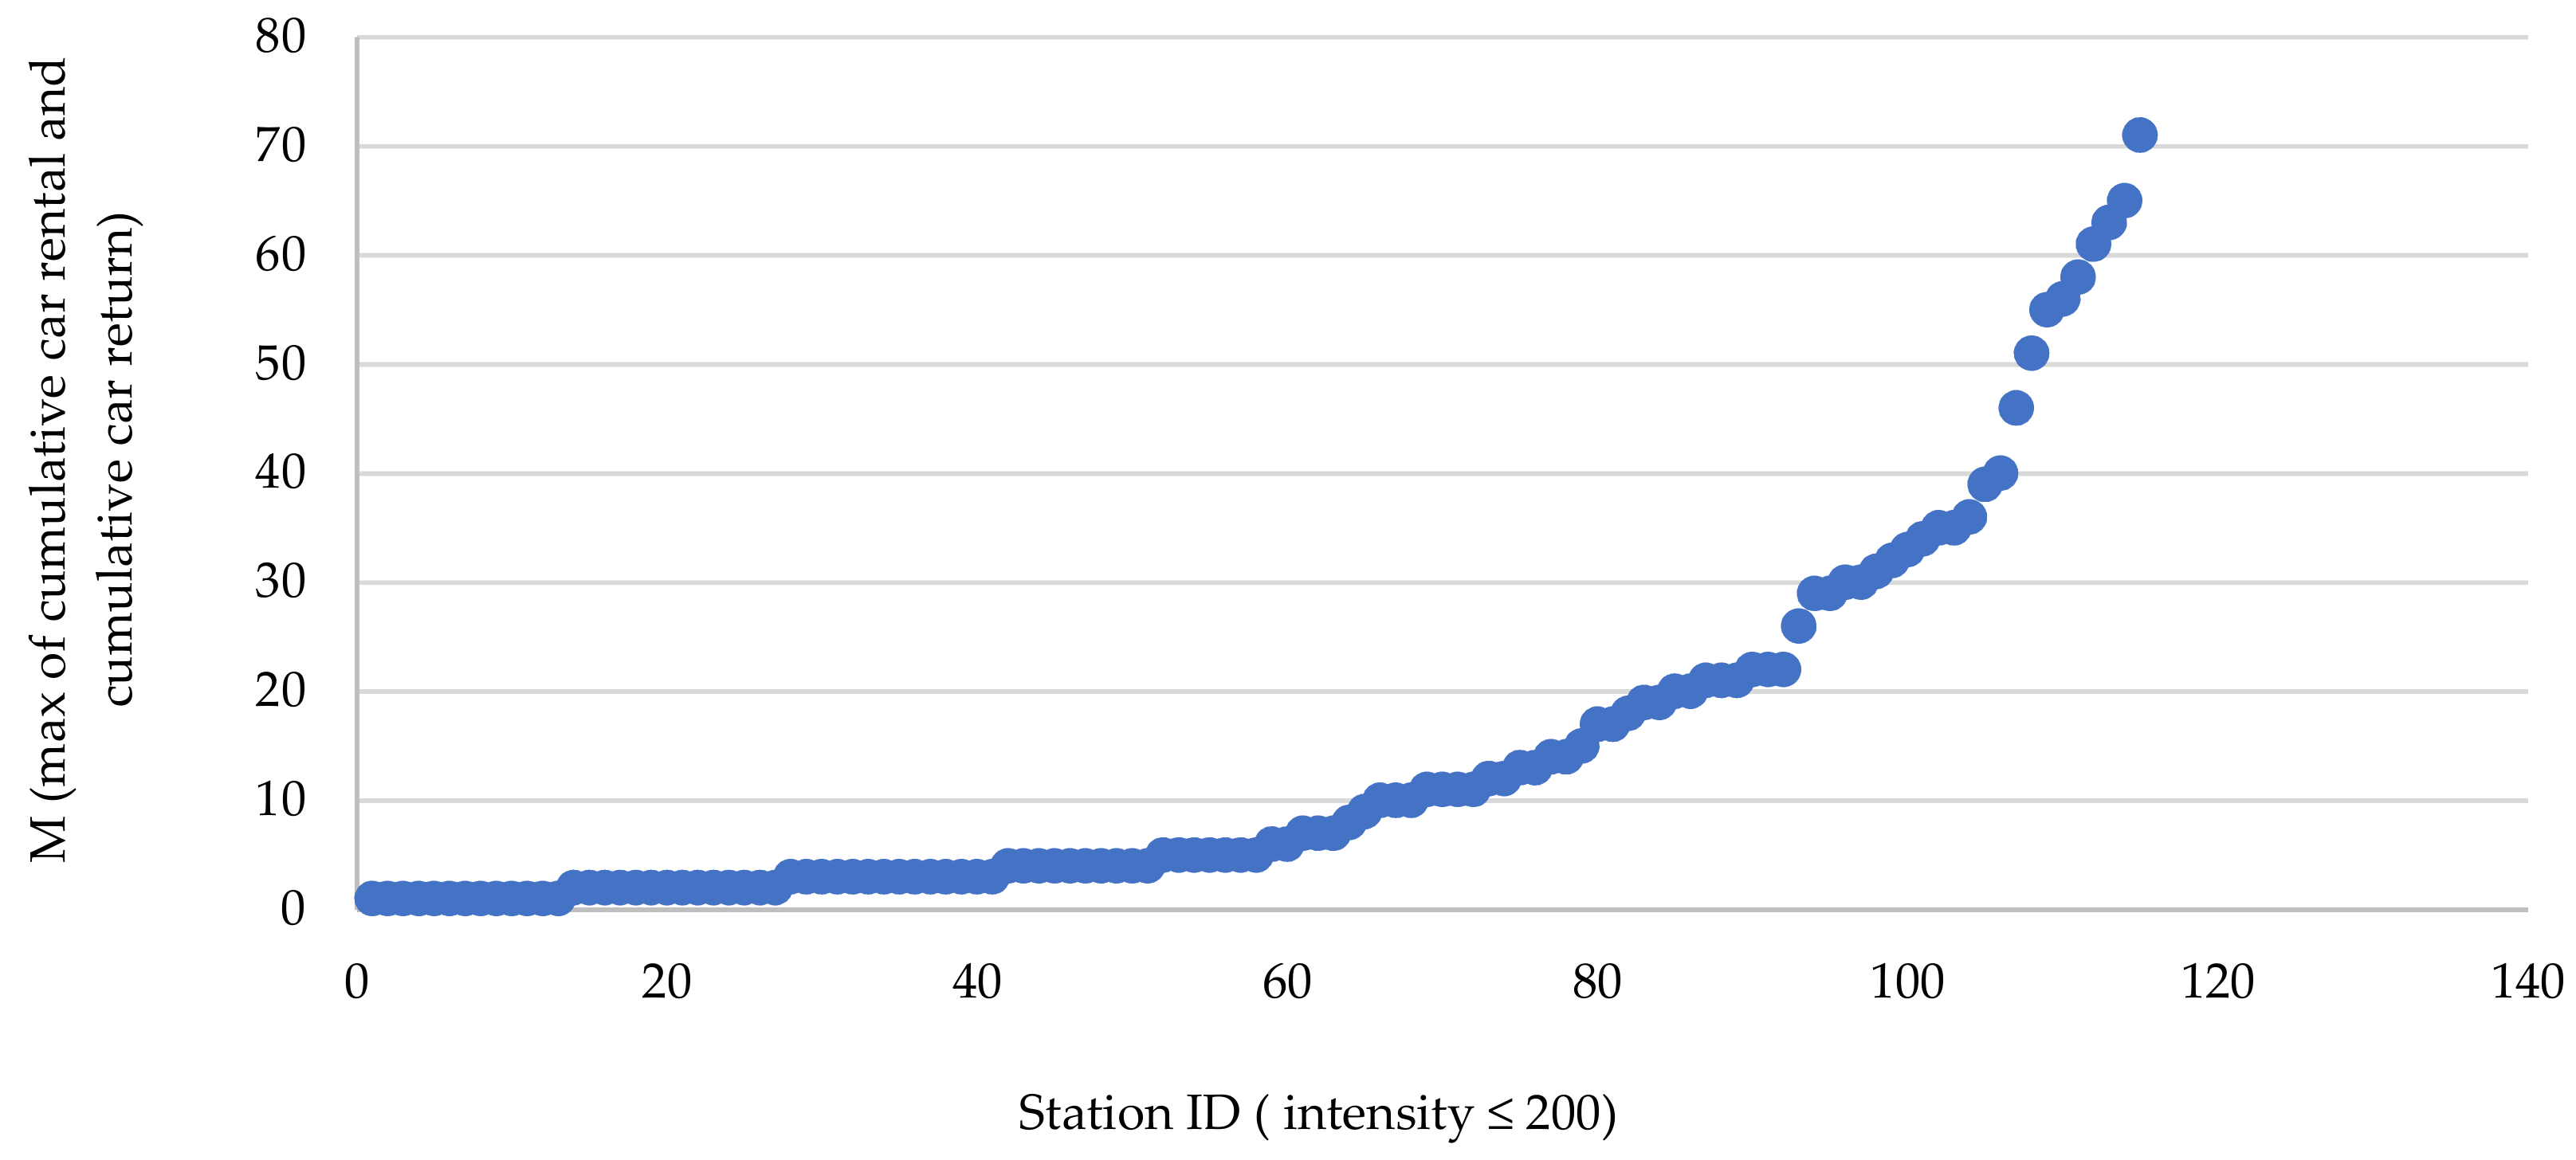
Figure 19.
Two levels of warning indicators for FFBS parking monitoring (sample).


Table 1.
Raw data and data items.
| Date | Time | Subway Station | Rent | Return |
|---|---|---|---|---|
| 20180601 | 201606010000-201806010005 | Dongsi station | 4 | 2 |
| 20180601 | 201606010005-201806010010 | Dongsi station | 1 | 5 |
| 20180601 | 201606010010-201806010015 | Dongsi station | 2 | 4 |
| 20180601 | 201606010015-201806010020 | Dongsi station | 2 | 4 |
| 20180601 | 201606010020-201806010025 | Dongsi station | 3 | 3 |
| 20180601 | 201606010025-201806010030 | Dongsi station | 3 | 2 |
| 20180601 | 201606010030-201806010035 | Dongsi station | 3 | 2 |
| 20180601 | 201606010035-201806010040 | Dongsi station | 3 | 2 |
| 20180601 | 201606010040-201806010045 | Dongsi station | 4 | 5 |
| 20180601 | 201606010045-201806010050 | Dongsi station | 1 | 2 |
| 20180601 | 201606010050-201806010055 | Dongsi station | 3 | 2 |
| 20180601 | 201606010055-201806010100 | Dongsi station | 1 | 3 |
| 20180601 | 201606010100-201806010105 | Dongsi station | 5 | 6 |
Table 2.
Four categories of time series.
| Category | Clusters Covered in Category | Number of Stations |
|---|---|---|
| Continuous Descending | 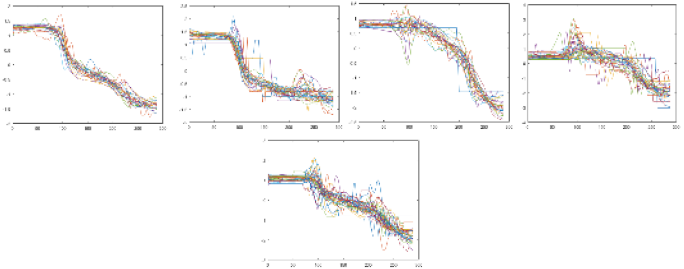 | 162 |
| Concave | 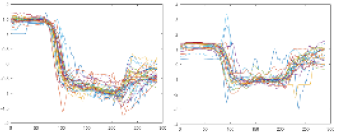 | 55 |
| Convex |  | 69 |
| Irregular | 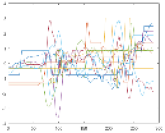 | 14 |
© 2019 by the authors. Licensee MDPI, Basel, Switzerland. This article is an open access article distributed under the terms and conditions of the Creative Commons Attribution (CC BY) license (http://creativecommons.org/licenses/by/4.0/).
Share and Cite
MDPI and ACS Style
Xu, D.; Bian, Y.; Rong, J.; Wang, J.; Yin, B. Study on Clustering of Free-Floating Bike-Sharing Parking Time Series in Beijing Subway Stations. Sustainability 2019, 11, 5439. https://doi.org/10.3390/su11195439
AMA Style
Xu D, Bian Y, Rong J, Wang J, Yin B. Study on Clustering of Free-Floating Bike-Sharing Parking Time Series in Beijing Subway Stations. Sustainability. 2019; 11(19):5439. https://doi.org/10.3390/su11195439
Chicago/Turabian StyleXu, Dandan, Yang Bian, Jian Rong, Jiachuan Wang, and Baocai Yin. 2019. "Study on Clustering of Free-Floating Bike-Sharing Parking Time Series in Beijing Subway Stations" Sustainability 11, no. 19: 5439. https://doi.org/10.3390/su11195439
Note that from the first issue of 2016, this journal uses article numbers instead of page numbers. See further details here.