Exploring the Quality of Urban Green Spaces Based on Urban Neighborhood Green Index—A Case Study of Guangzhou City


1
Guangdong Provincial Engineering Research Center for Public Security and Disaster, School of Geography and Planning, Sun Yat-sen University, Guangzhou 510275, China
2
China Regional Coordinated Development and Rural Construction Institute, Sun Yat-sen University, Guangzhou 510275, China
*
Author to whom correspondence should be addressed.
Sustainability 2019, 11(19), 5507; https://doi.org/10.3390/su11195507
Submission received: 31 July 2019
/
Revised: 24 September 2019
/
Accepted: 30 September 2019
/
Published: 4 October 2019
(This article belongs to the Special Issue Metropolitan Green Infrastructure and Sustainable Urban Growth)
Abstract
:Urban green space (UGS), as a form of green infrastructure, has been given increasing attention in urban planning and its policies. The quality of a UGS is fundamental for the sustainable development of the urban economy, society, environment, and quality of human life, although UGS is unevenly distributed within cities. Aiming to analyze the quality of UGS at the scale of Jiedaos in China, this paper took Haizhu district in Guangzhou as a case study based on collected data from 2010 and aerial imagery from 2012. The Urban Neighborhood Green Index (UNGI) was established by combining four weighted parameters: the green index (P1), the density of buildings (P2), proximity to green areas (P3) and building height (P4). Results from comparing with green index show that (1) the UNGI performed better for UGS planning due to its ability of uncovering impact of the built environment and its accessibility on quality of UGS; (2) the UGS has significant effects on neighbors, which underlies social inequity of UGS supply and presents rich information for urban planning and decision making; (3) a small green field attaching to a community plays a key role in fulfilling the need of neighbors for green space, fitness, and leisure in China, which is usually ignored due to the ownership of private property. It suggests recognizing UGS and improving its quality in old towns as well as improving urban villages characterized by poor quality of green space with green infrastructures. The UNGI can inform city planners regarding their consideration of UGS, and it can contribute to measurements of sustainability and the development of green infrastructure.
1. Introduction
Urbanization is dramatically changing the world and cities. The global urbanization rate is predicted to increase from 55% in 2018 to 68% over the next 30 years, and overall growth in world population will add approximately 2.5 billion people to urban areas by the year of 2050 [1]. Urbanization in the modern age has had a huge impact on the environment, reducing green space and threatening human wellbeing. In recent years, there is increased demand for urban green space (UGS) in urban areas [2,3]. Thus, an ecologically based urban planning and design paradigm is needed [4]. Green infrastructure has been given increasing attention in urban planning and its policies, especially due to its ecological, environmental, and social contributions to planning and designing high-quality UGS. Green infrastructure provides various opportunities for improving public health and wellbeing, as well as the environment, economy, and society [5]. Green infrastructure is framed within the conceptual context of sustainability and focuses on UGS and its development [6].
1.1. Urban Green Space
UGS is sometimes referred to as the urban green commons [7] and comprises all types of urban green space [8]. It includes public green space owned and maintained by governments, such as green space in parks, squares, street-sides, riversides, seaside, and greenbelts surrounding historical sites, etc. It also includes private or abandoned green space and even some urban residential areas, abandoned industrial areas, and grasslands [8]. With the growing demands stemming from urbanization, UGS has become a popular term in inter-discipline fields of ecology, medicine, psychology, economics, sociology, and geography, and its study continues to mature in these fields [9]. UGS is indispensable to urban sustainable development, due to its multiple functions and role as an ecosystem in terms of habitat for animals and plants, air filtration, microclimate regulation, and city rainwater drainage [10]. It is moreover valuable aesthetically and to the health [2], leisure, and social interaction of humans [11]. In current modern life, UGS pertains to everyone’s quality of life and mental and physical health [12].
The quality of a UGS refers to its so-called greenness and to its usefulness to residents [13]. The definition of the usefulness of UGS varies, given its multiple functions, especially with regard to health and aesthetic value [14]. UGS is used in various ways by different groups of people with complex needs. Further, various neighborhoods differ with regard to their respective needs and demand for UGS [15]. Indeed, the quality of UGS varies across urban areas, and its distribution within cities is uneven [14]. This issue relates to the accessibility of residents to UGS, which significantly influences how people use it [2,16]. Likewise, UGS quality influences housing prices [17], the behavior and cognition of children [18], and public attitude and wellbeing [19,20], such that unevenly distributed UGS pertains to social and spatial inequality and environmental justice [14]. Thus, the quality of UGS is sensitive to the specific features of each neighborhood. Urban residential spaces are increasingly various and complex in cities, and they have become another important component to how people access and use UGS [2]. To some extent, the need for UGS is derived from where people live and how they access UGS, whereas UGS availability results from where UGS is distributed. Moreover, urban form indicators such as structural attributes (e.g., the density and height of buildings) [21], spatial patterns of the population and economy, proximity and accessibility to green areas [13,19]), and even Spatial Syntax approaches have been proposed and applied to understand the need for UGS [22]. Other urban form indicators, such as the network and topology of roads, have also been used as predictors of vegetation cover [2]. In general, these methods connect the supply and need for UGS, and this relationship is crucial when aiming at social equity with regard to the distribution of UGS [13].
1.2. Assessing UGS Quality by Connecting Urban Form to the Green Index
The quality of a UGS has long been derived from a green index based on remotely sensed imagery [23] and by counting greenery [24]. The green index does well at integrating continually updated remotely sensed data. However, it is disadvantageous in that it disconnects the need for UGS by residents from its supply. In general, moreover, it is difficult to assess any social process with a single parameter such as the green index [25]. Indicators that can depict the quality of UGS and reveal its underlying social inequity are important for planning sound UGS patterns [26,27,28,29]. The combination of remote sensing and GIS, meanwhile, is a popular means for assessing urban environments [30], with which high-quality UGS can be determined based on the needs of citizens [31]. When private green space is included in the analysis of UGS, rather than public green space exclusively, coupling remote sensing and GIS further reveals underlying social inequity by highlighting its use and ecosystem services, such as recreation and health effects [32]. Considering the green index together with urban form indicators such as population and building density, road networks, etc. can advance the needs of residents and urban green supply [13] to facilitate UGS planning [33,34,35].
Connecting urban form indicators with the green index is a recent approach to assessing the quality of UGS [26]. Several indices have been implemented, such as the Building Proximity to Green-space Index (BPGI), the Urban Neighborhood Green Index (UNGI), the Neighborhood Green Space Tool (NGST), and the Building Neighborhood Green Index (BMGI) [14,15,24,27]. The UNGI was first proposed for studying green spaces in India, and it comprises four parameters: building density, green index, proximity to green areas, and the height of structures [15]. The index has notable advantages insofar as it connects urban form indicators to urban greenery. Among all four indicators, proximity to green areas acts as an accessibility indicator for UGS, depicting the distance from a building to the nearest green space. It was subsequently revised to form the BPGI, which was applied to a case study in Hungary [27]. Likewise, building density and building height both feature in calculations of accessibility to UGS [24].
A small-scale neighborhood (4 km2) was initially used by the UNGI. This is obviously limited, however, and more academic than practical, though it demonstrated the potential to work at a wider scale [15]. Further, the UNGI has the potential to better reveal social inequities with regard to UGS access compared to the green index. This potential was demonstrated when it was adapted to form the BPGI and applied to a large area in Hungary with an improved data acquisition method [27]. Although these indices have evolved from relatively small-scale measures to large-scale ones, there is little research on UGS evaluations that can output strategies for green development. Nevertheless, the indices can help expand the knowledge obtained at a smaller scale to larger regions.
Based on these findings, we applied the UNGI at the scale of a district in an administrative boundary (Jiaodao) to reveal spatial inequity in the quality of UGS. We expect that our research will provide a reference for UGS planning, by connecting urban form indicators to the green index.
The remainder of this paper is organized as follows. A conceptual framework is first elaborated. The framework is then introduced to the case study area. Next, we describe the data and methodology, along with our results and a comparison of the UNGI to the green index. Finally, we discuss our results and offer conclusions. We expect that this study will provide evidence for integrative assessments of the quality of UGS in Chinese cities to facilitate UGS planning and decision-making.
2. Study Area, Data Collection, and Methods
2.1. Conceptual Framework
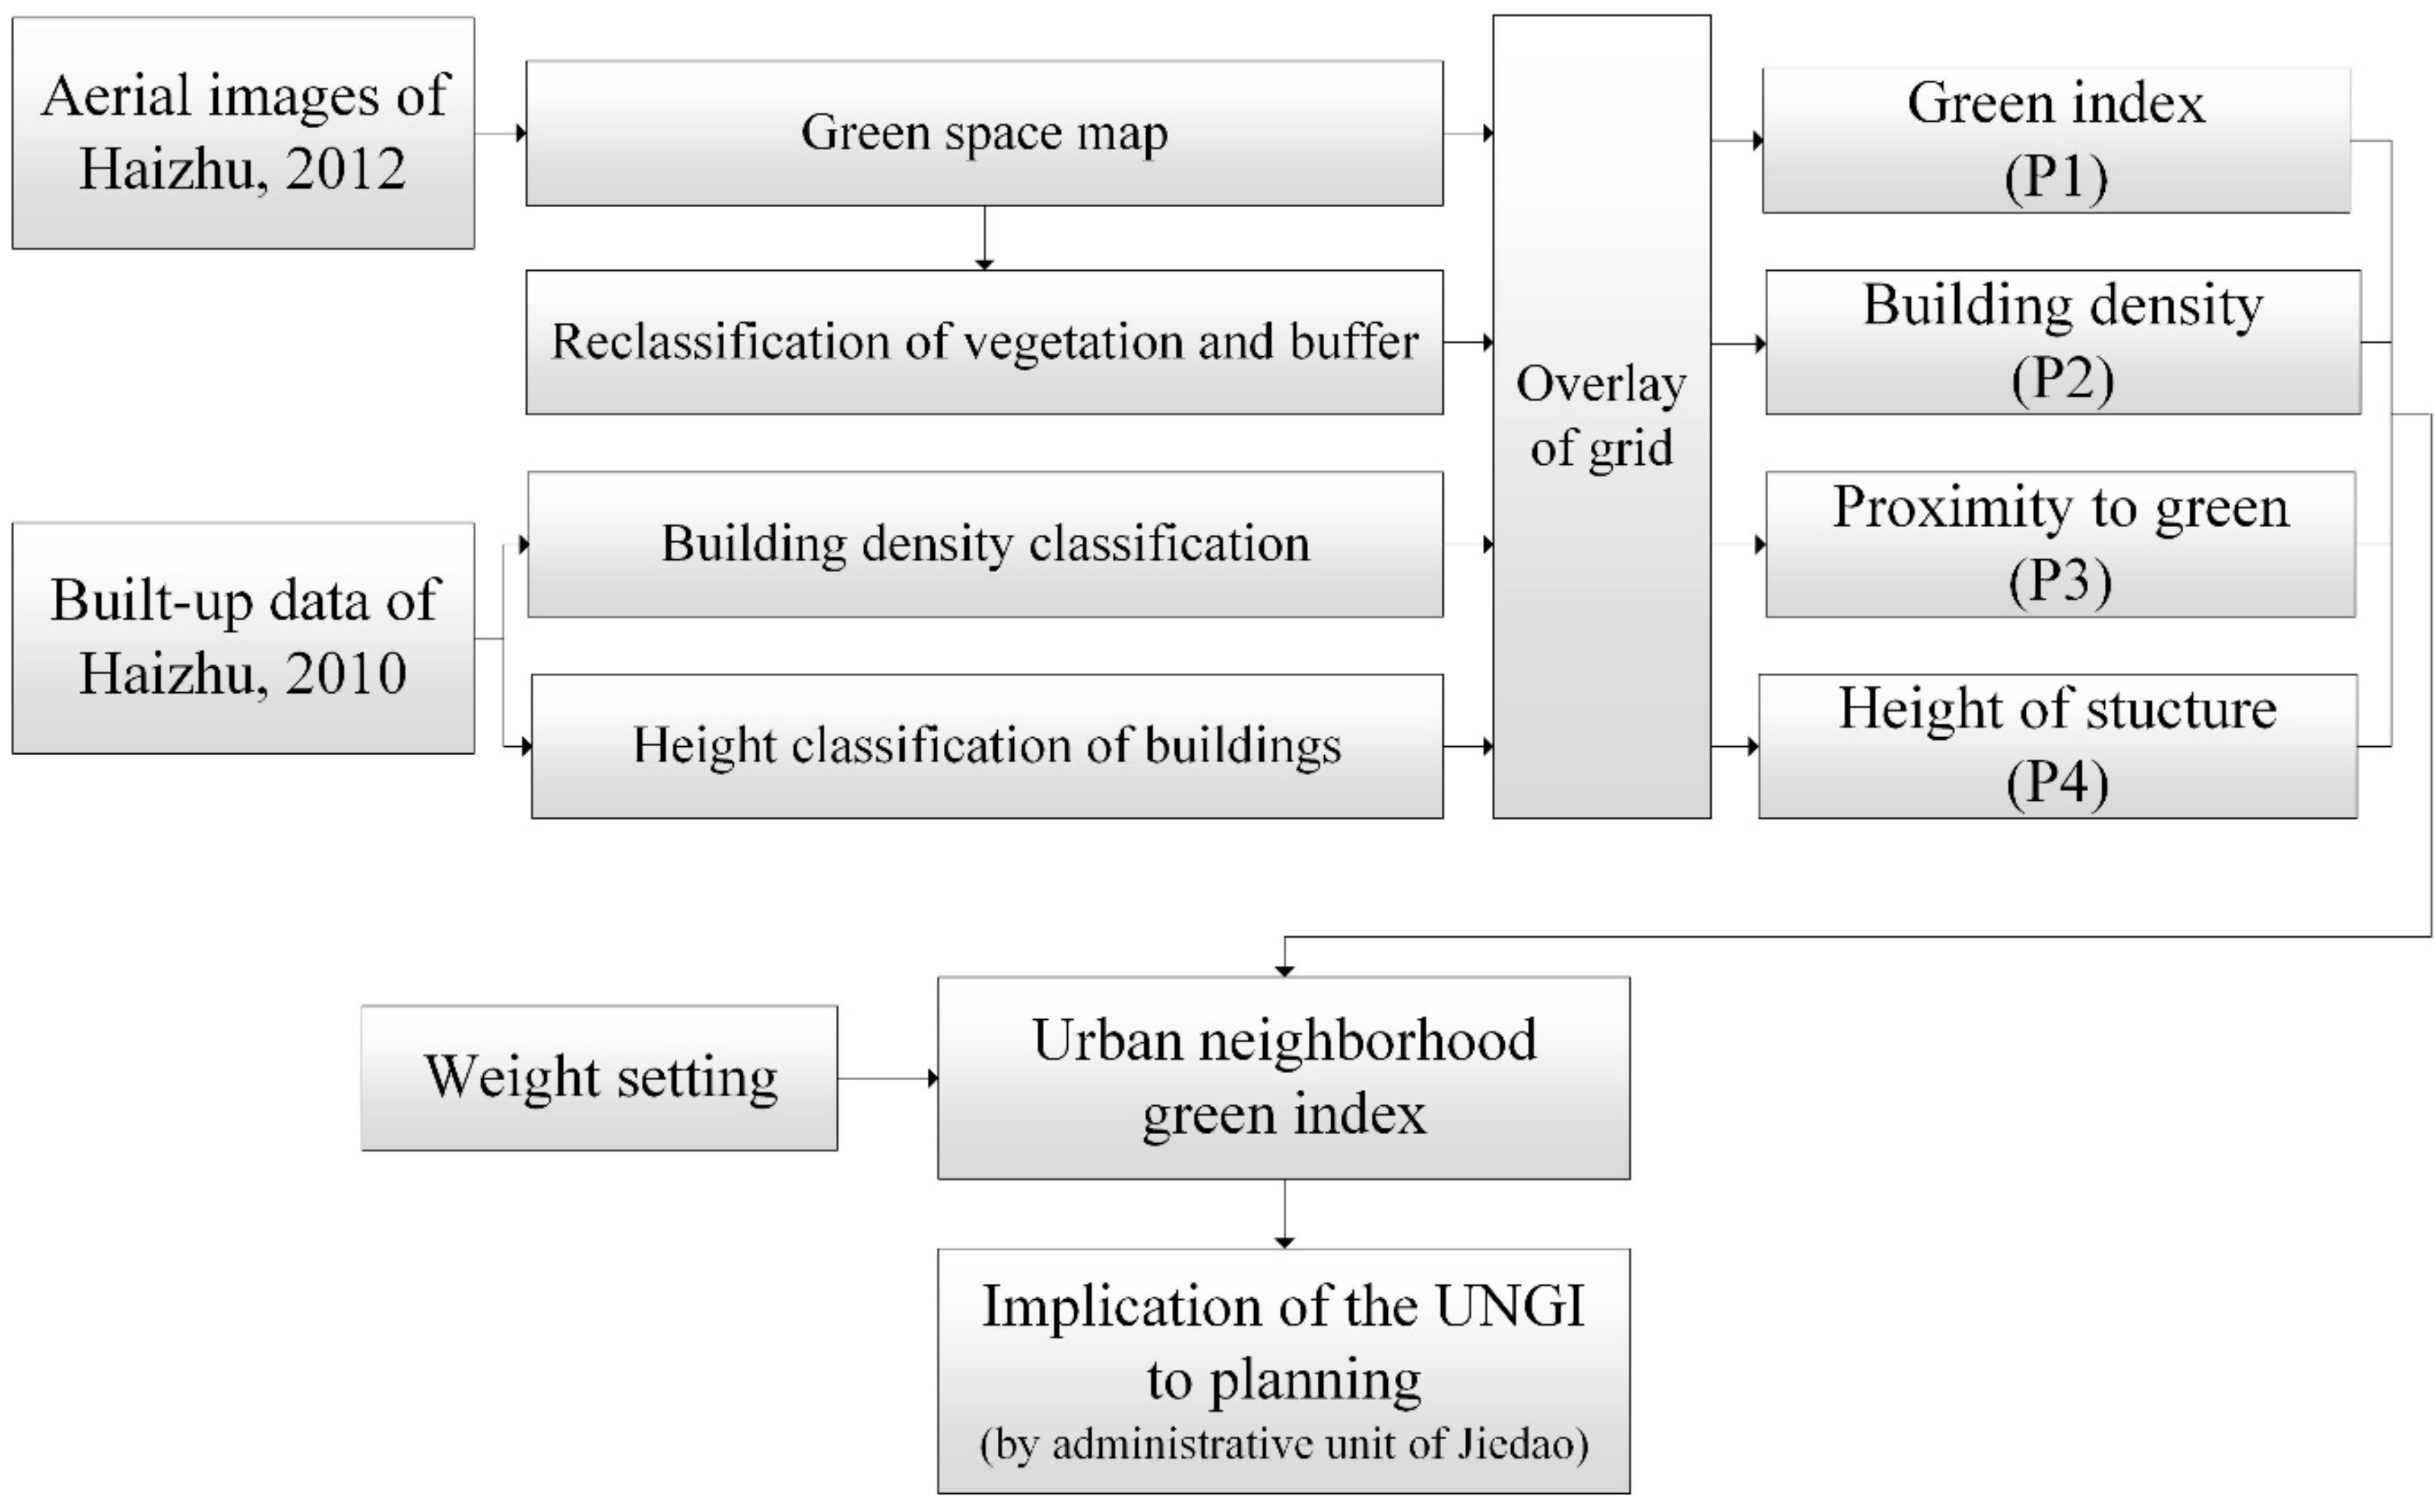
This study defines the quality of UGS as its usefulness to people based on greenness. It aims to build a UNGI with respect to both urban form indicators and urban greenery [2]. Four parameters are used to depict the quality of UGS: the green index (P1), building density (P2), proximity to green areas (P3), and height of structures (P4) (see Figure 1). It uses the green index—the percentage of green space—to refer to urban greenery. The higher the value of P1, the better the quality of the UGS. Building density (P2) and the height of structures (P4) refer to where people live. The higher the value of P2 and P4, the more likely residents are to visit a UGS. Finally, proximity to green areas (P3) denotes the accessibility of UGS to residents. The higher value of P3, the higher quality of the UGS.
Of the four parameters, P1 is widely used as an objective indicator, as it directly pertains to the availability of UGS. Both building density (P2) and the height of structures (P3) relate to the need for green space. They are complementary to each other, and they together reveal the distribution of residents. Proximity to green areas (P4) defines accessibility from residential areas to a potential destination of a UGS.
These four parameters were applied to aerial imagery collected in 2012 and to data from 2010 regarding Haizhu (see Figure 1). The 2012 aerial imagery was first interpreted and classified to output a map of green space with various subgroups. This map of green spaces was then integrated into a map to classify vegetation as dense and sparse. The 2010 data was used to classifying urban density and the height of urban structures. The green index (P1) was derived based on the aerial imagery from 2012. Both building density (P2) and the height of structures (P4) were derived from the 2010 data regarding Haizhu. Proximity to green areas (P3) was determined by combining the information in both datasets.
We overlaid the data on a 100 m × 100 m grid to transform the relative data to a consistent size that could be compared. To achieve an integrative index for the UNGI, we weighed each of the four parameters to differentiate their relative importance. Likewise, to validate the practical value of the UNGI, an analysis of the index was conducted at the boundary of a Chinese administrative unit, a so-called Jiedao, to reveal its implications for planning.
2.2. Study Area
Guangzhou is the third biggest city in China, and the largest city in southern China. It is located in a warm, humid, and rainy region. It is a pilot city for sustainable development in China and in a transformation process from a productive city to a sustainable one. Guangzhou has led UGS planning for many years. It has been innovative in protecting green coral areas, initiating sensitive area analysis, and building greenways in China [36]. For example, ecological construction goals can be seen all over in the urban master planning for Guangzhou city (2010–2020) from the perspective of social economic development, overall function, spatial development strategy, etc. Chen et al. [37] employed GIS to analyze pattern of parks and found an uneven and unequal distribution of UGS of Guangzhou. However, few innovative technologies have been used to analyze UGS based on urban form and the green index. Conventionally, not all UGS is counted when undertaking UGS planning because only public green space concerns the government. Moreover, the distribution of UGS has seldom been taken under consideration with the green index because the accessibility of UGS is rarely considered at a relatively fine scale such as a neighborhood.
This study took Haizhu district, one of the oldest districts in Guangzhou, as a case study area (Figure 2). Haizhu district, located in central Guangzhou, plays an important part on Guangzhou’s way toward becoming a sustainable city. It has good quality urban environment due to its vicinity to the southern bank of the Pearl river. Haizhu district, spanning 90.45 km² with 18 administrative Jiedao, comprises an old town in the west, a newly developing zone in the north-east, and an ecological residential zone with a wide range of green space in the south-east. It is shaped as an island surrounded by the Pearl river. Urban areas and the population are mostly concentrated in or near the old town in the west. Haizhu has invested in green space ecological planning and construction in recent years. An ecological green-spaces system was planned as one circle, one band, three core areas, and a reticulation corridor (Ecological planning of Haizhu, Guangzhou 2012). Ecological construction projects such as greenway projects and the Haizhu eco-city project led by the government have been ongoing for a decade and show notable achievements. As a result, a huge Haizhu lake park in the middle of Haizhu offers ample leisure and fitness opportunities, with widespread flora and a waterfront landscape. Further, the Wan-mu-orchard protected area in the east of Haizhu is currently under construction, and green space along roads—the three regional ecological corridors—spread across the entire area and play a critical role in sustainable development in the city. An evaluation of the quality of UGS at this stage is thus timely and necessary.
2.3. Data Collection
This study used collected data from 2010 and aerial images from 2012 as the base data. The data in both datasets have a resolution of 0.5 m × 0.5 m. The former was collected from a survey conducted in 2010 and includes urban features such as height, elevation, etc. A grid of 100 m × 100 m was regenerated for analyzing the case study are of about 100 km2, compared to a grid of 20 m × 20 m in a range of about 4 km2 in Gupta et al. (2012) study [15]. Moreover, the grid can match the original resolution of all four parameters, and it can be fitted for subsequent analysis. As the height of structures is the parameter most sensitive to cell size, the grid can measure high-rise buildings and is thus a sound option. Likewise, administrative maps and demographic data were used. Location correction was employed with the support of ArcGIS 10.2 to deal with positional offsets in the collected data.
This study generated a UGS classification system for Haizhu (Table 1) according to the UGS Classification Standard (CJJ/T85-2002) issued by the Chinese National Ministry of Construction. It used object-oriented segmentation and manual visual interpretation to extract urban green space and relative information from the 2012 aerial imagery. In support of eCognition 9.0, it weighted each spectral band as 1, and managed to find the proper segmentation scale by means of human-computer interaction. At a scale of 60, water, construction land, and green space were successfully extracted. An artificial visual interpretation and subsequent correction to classification followed this segmentation process, ultimately outputting the classification. Additional information, such as parks and land-use maps, was used to improve the results. Other measures were also included, such as a field survey, precision testing, and other means of artificial visual interpretation. After all these implementations, the overall classification accuracy reached 95%, meeting the requirements for subsequent analysis. As a result, UGS was classified into seven classes: namely, parks, attached green space, roadside green space with productive plantation areas, farmland, green space attached to housing estates, green space attached to urban roads and squares, and other green space (see Figure 3).
2.4. Defining the Four Parameters
Inspired by Gupta et al. (2012) [15], we classified each parameter (P1–P4) into four levels accordingly (Table 2). How these four parameters relate to the quality of UGS was also defined, by elaborating their descriptions. Meanwhile, all four parameters were produced on a 100 m × 100 m grid. Following the 25% quantile rule, 4 levels of quality were sorted—low, moderate, high, and very high—for the three parameters (P1, P2, and P4). A higher green index refers to a better greenness, and the percentage of green in each cell falls into one of the four interval domains, <0.25, 2.5–0.5, 0.5–0.75, and >0.75, which correspond to the four levels of quality from low to very high. A reversed set of domains were set for the other three parameters. In a cell of 100 m × 100 m, better quality refers to a low percentage of building density (P2). In the same manner, better quality also means a higher percentage of area that falls in a buffer around certain vegetation for proximity to green areas (P3), or a lower percentage of high-rise buildings in each cell (the height of structures, P4). We aimed for a process that was simple and with a technique that was easy to apply and generalize. The value and quality were determined accordingly (Table 2 and Figure 4).
2.5. Maps of Green Index and Building Density
Both the green index and building density were determined by counting their percentage in a cell (Table 2). For instance, in a cell of 100 m × 100 m on this grid, if the percentage of green is 45%, the cell receives a value of 0.5 and falls in the class of moderate quality. In the same manner, if the percentage of building density in a cell is 70%, this cell again receives a value of 0.5 and falls in the class of moderate quality. We then generated the green index (Figure 4 and Table 3) on a map of classified green space (Figure 3), and the building density on a demographic map (Figure 5) along with a map of building density (Figure 6 and Table 3).
2.6. Map of Proximity to Green Areas
The map for proximity to green areas was produced based on a map of buffer areas of vegetation. The buffer area of vegetation was itself derived in two main steps (Figure 7a,b). We first reclassified green space into two types (Figure 7a): dense vegetation, consisting of parks, green space attached to housing estates, green space attached to urban roads and squares, roadside green space, and attached green space; and sparse vegetation, consisting of farmland, productive plantation areas, and other green space. Dense vegetation was located mainly in the city center and had better green service and more of an influence on citizens. Sparse vegetation was distributed mainly in the suburban areas and had poorer availability and a low coverage rate.
We next generated a map for proximity to green areas. Because various green spaces serve a different range of areas, buffer analysis was used to define the range of service, to depict the quality and service of vegetation [34,38]. We defined buffer of park and the other vegetation (i.e., dense and sparse vegetations) by 100 m and 20 m respectively then obtained the map of buffer around vegetations (Figure 7b). Referring to Wendel et al. (2012) [34], we set 20 m buffer area surrounding open woodland and forest, within which these vegetations can be viewed, felt and perceived by nearby people and show their impact. Likewise, a 100 m buffer area surrounding each park was set due to a park as urban public green space shows especially comprehensive value influencing built environment to inhabitants [38]. Finally, we could generate a map for the proximity to green areas (Figure 7c) based on the map of the buffer around vegetation (Figure 7b) by calculating the percentage of the buffer or vegetation area in a cell (Table 2).
2.7. Map of the Height of Structures
The percentage of high-rise buildings in each cell was used to generate a map of the height of structures. Higher buildings suggest a greater need for surrounding green vegetation [2], and for simplicity, urban areas were classified into areas with low-rise buildings and areas with high-rise buildings. According to the Code for Design of Civil Buildings (GB50352-2005) and Residential Building Code (GB50368-2005), we defined high-rise buildings as those higher than 27 m or 9 stories (Table 4), and the remaining buildings as low-rise buildings (Figure 5). As such, we generated a map of the height of structures (Figure 8) in accordance with the four classes of UGS quality (Table 2).
2.8. UNGI Map and Evaluation
This study weighted the four parameters in the UNGI as follows: 0.27 (green index, P1), 0.30 (density of buildings, P2), 0.25 (proximity to green areas, P3), and 0.18 (height of structures, P4). This matches the weight matrix used in New Delhi, India [15], derived from Saaty’s pair-wise comparison method based on expert opinion [39]. We used an arithmetically weighted overlay approach to integrate all four parameters and generate the UNGI map. The approach is formulated as follows (Equation (1)):
where
UNGI(i) is the Urban Neighborhood Green Index of the i-th cell,
W(j) is the relative weight of the j-th parameter, and
P(ij) is the value of the j-th parameter in the i-th cell.
After conducting the arithmetically weighted overlay, the resulting values were classified further into the four green quality classes of the UNGI (Figure 9 and Table 3). An analysis was then conducted to compare the UNGI to the green index by their mean value and standard deviation according to Jiedaos. We expect that this analysis will facilitate UGS planning in Chinese cities.
3. Results and Discussions
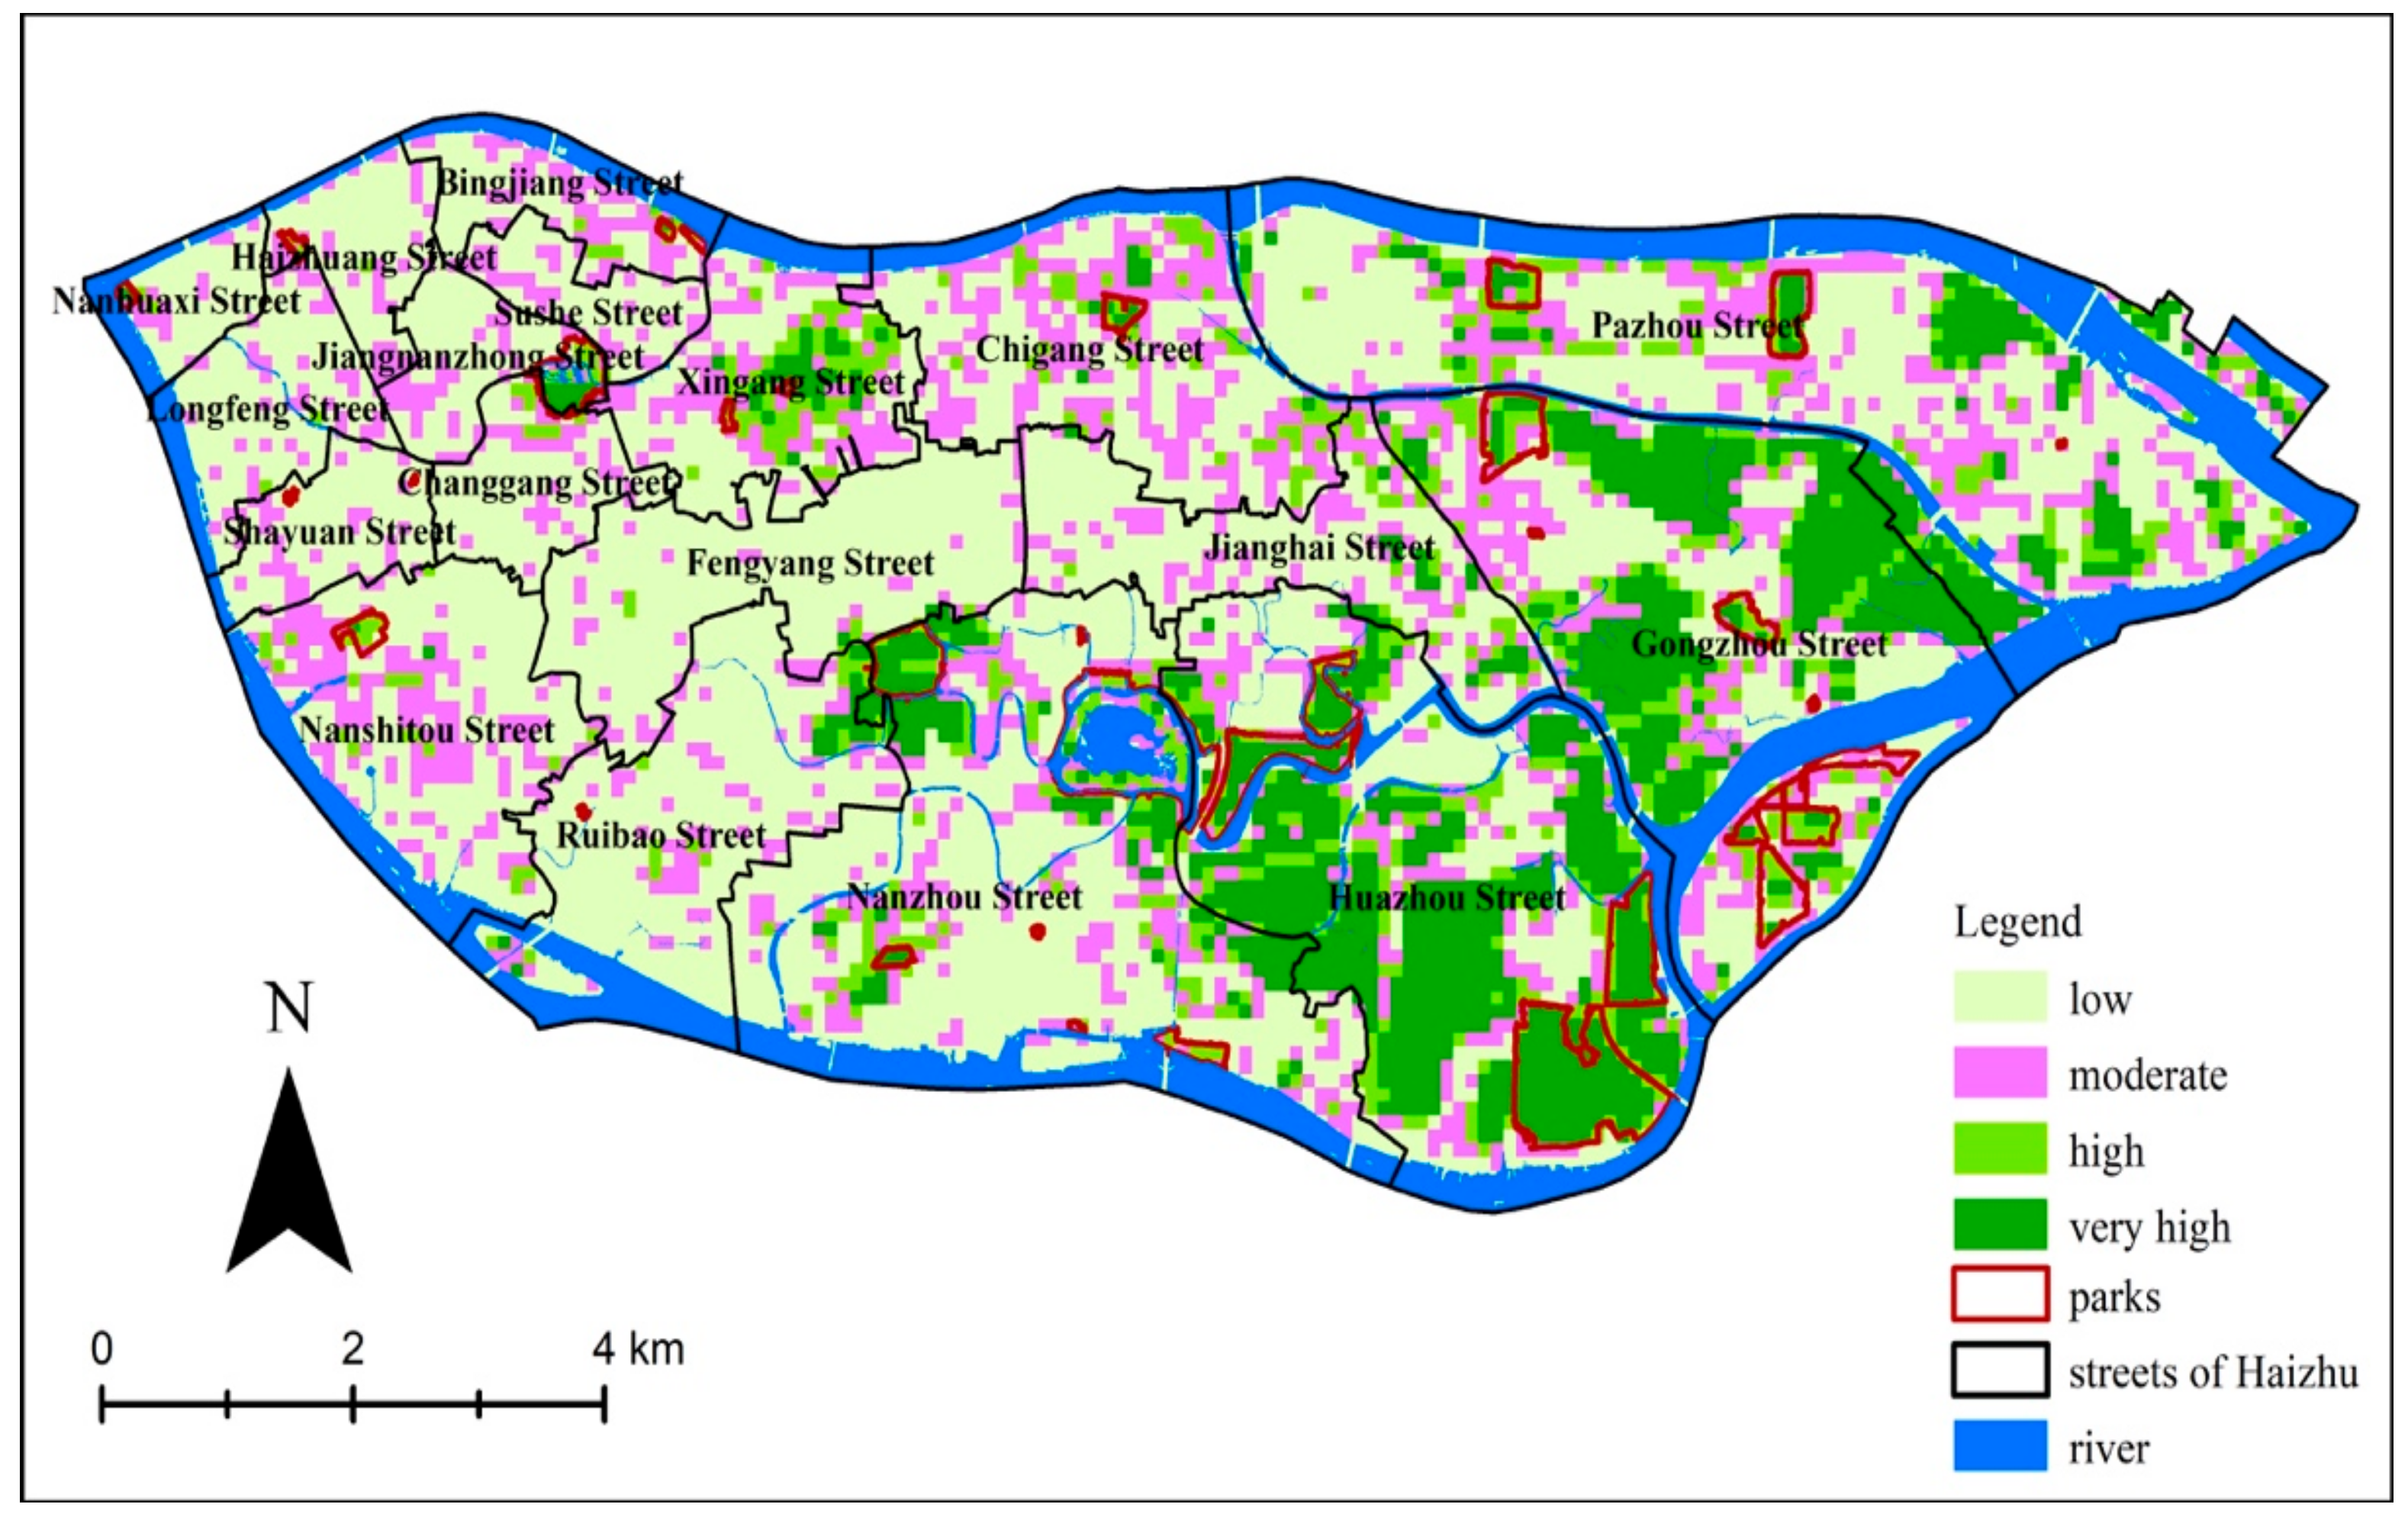
3.1. Green Index
The map of the green index parameter visualizes the amount of green space (Figure 4). UGS is mainly concentrated in the east and shows an overall uneven distribution across Haizhu. Low-quality green areas with a green index of less than 25% covered approximately 60% of Haizhu. The eastern area of Haizhu has mostly high-quality green space with a green index above 75% because Wan-mu-orchard and most farmland are concentrated there. Because the western area of Haizhu is mainly made up of buildings, parks were the main type of green space with very high-quality areas (with a green index above 75%). Because most of the population is densely distributed in the west of Haizhu, however, UGS development cannot be fully realized.
3.2. Building Density
The map of building density shows how urban areas form physically (Figure 6). The map reveals a relatively clear pattern of building density. Indeed, 61% of urban areas are concentrated in very high-quality green space (building density of 0%–25%) (Table 3). By contrast, only 2.33% of the area has low-quality green space with urban density over 75%. The very high-quality areas were around the old town and in the east. The old town areas in the west were mostly high-quality (building density of 25%–50%). Likewise, low-quality areas (with the highest building density) were identified as FengYang Jiedao, NanZhou Jiedao, and GuanZhou Jiedao. All of the identified places are characterized as urban villages where many immigrants are living.
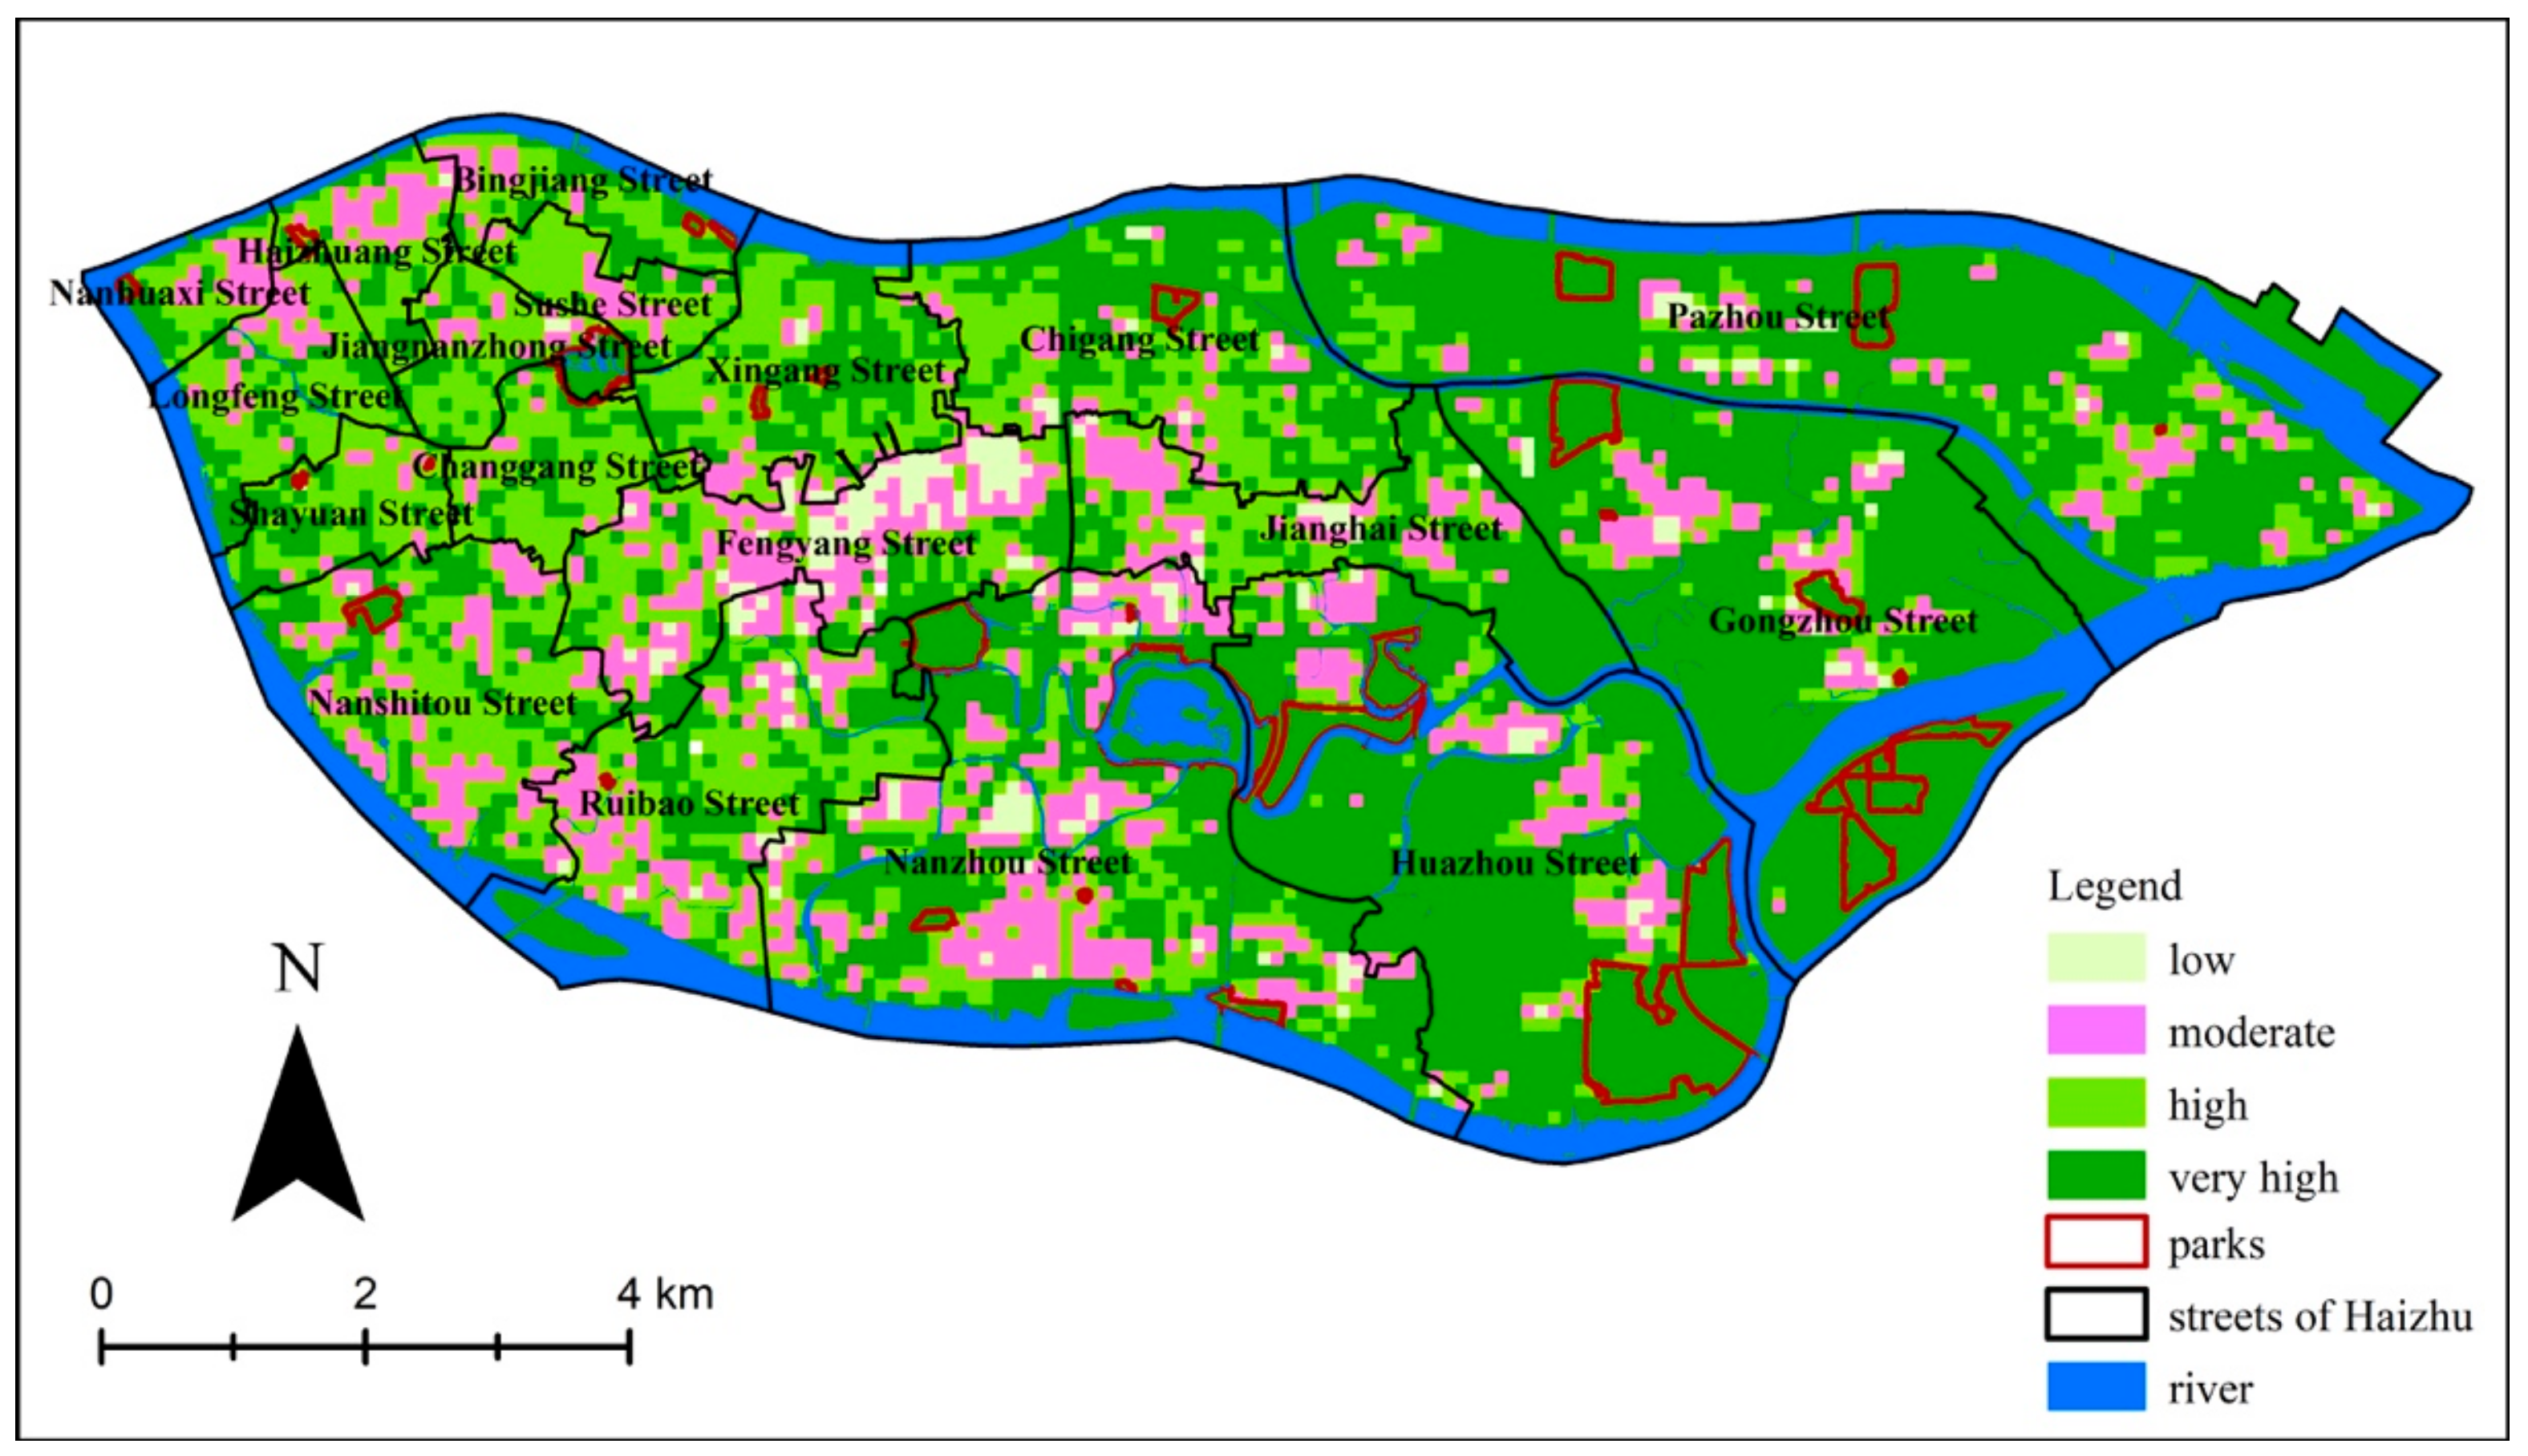
3.3. Proximity to Green Areas
The map of proximity to green areas (Figure 7c) shows that 46.37% of the area has a combination of low- and moderate-quality green space. This means that about half of the population in Haizhu district is not sufficiently close to green space. Lower-quality areas appear in the western part of the old town of Haizhu, central Haizhu, and the outskirts of Haizhu, where densely distributed urban areas coexist with small green spaces. Likewise, a wide range of moderate-quality areas in the east of Haizhu appear as a result of the green space in the Wan-mu-orchard protected area, due to its relative distance from residential areas. By contrast, very high-quality areas (with proximity to green areas over 75%) are typically near urban areas, especially in the old town. Many trees are growing inside these communities, and they are easy to access. Overall, the results show that proximity to green areas is a better parameter than the others for evaluating the service scope of green space, and especially for revealing the quality of UGS in a region.
3.4. Height of Structures
The map of the height of structures (Figure 8 and Table 3) shows that 96% of Haizhu is in very high-quality areas (with a height-of-structure index of less than 25%). The main cause is that urban villages, rural residential areas, and green space contain only low-rise buildings or no buildings at all. Urban villages make up an area of 26.1 km2, accounting for 29% of Haizhu. Further, green areas extend to 28 km². Moderate-quality areas (with the highest buildings) are concentrated along main roads, such as Jiangnan Road in the old town to the west of Haizhu. These areas contribute the most to high-rise buildings: the percentage of high-rise buildings in each cell is between 25% and 50%. Low-quality areas (with values over 75%) are in Fengyang Jiedao and Pazhou Jiedao, where the Canton Fair Complex and other business centers are located.
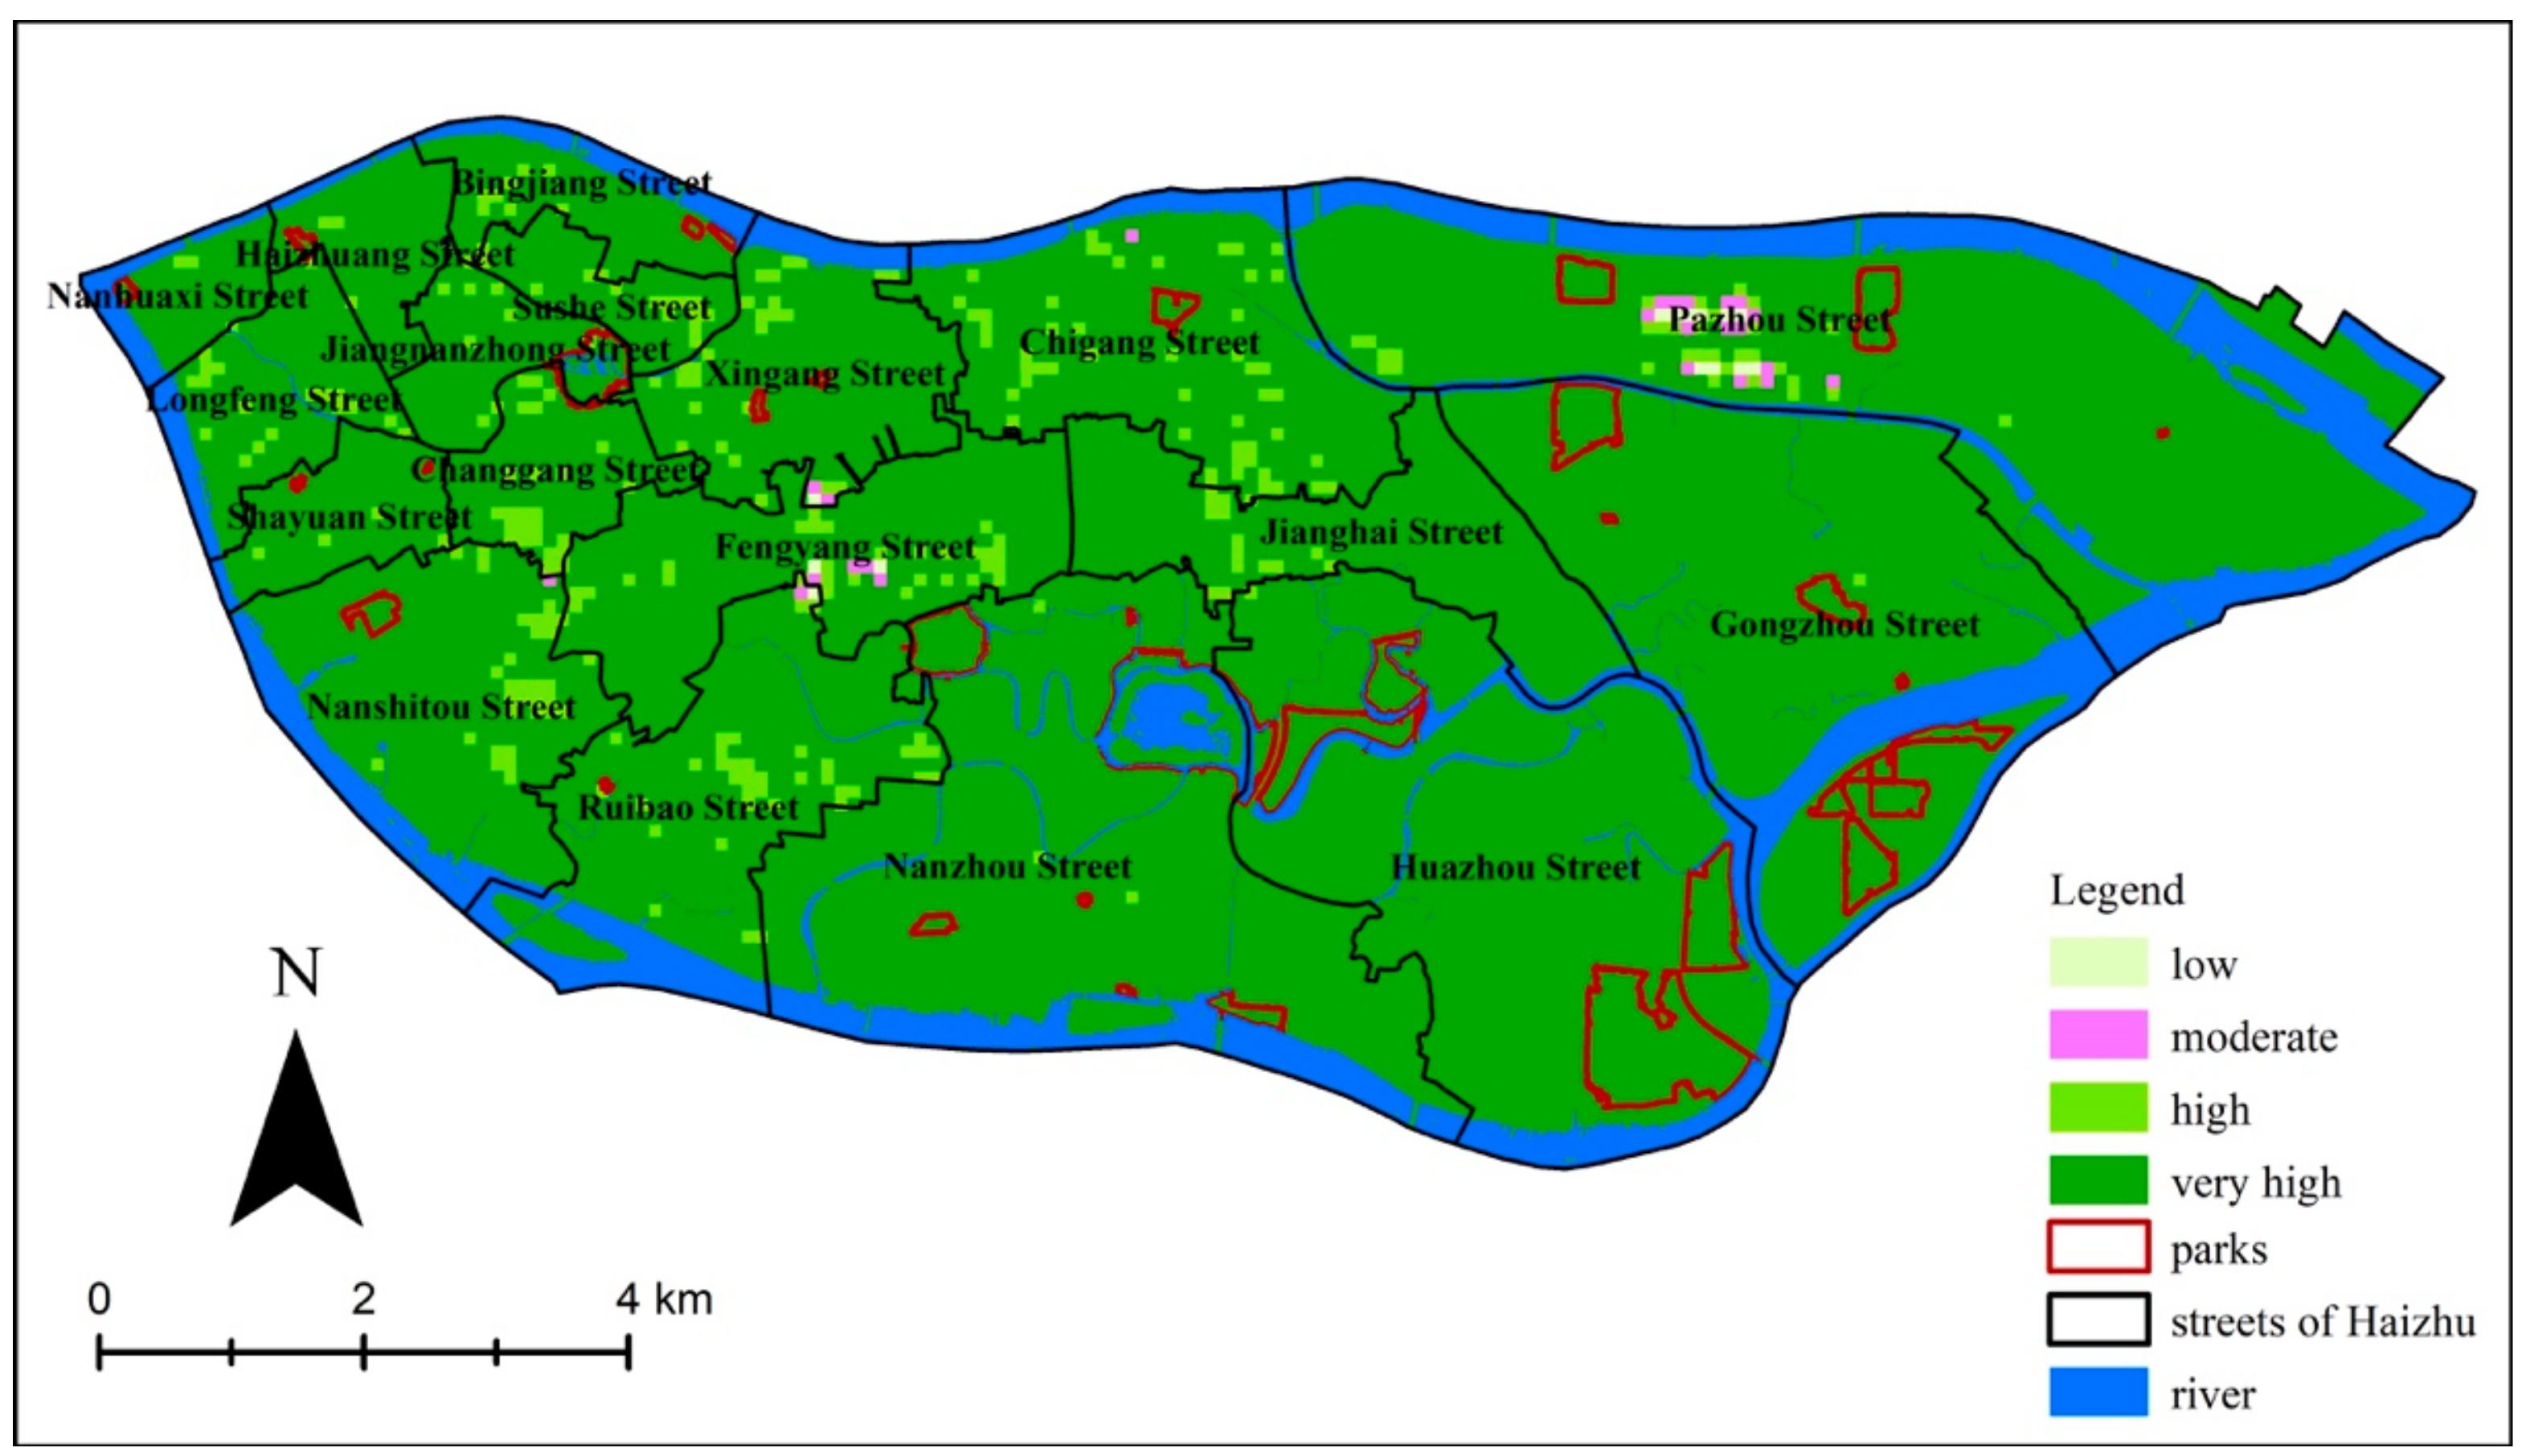
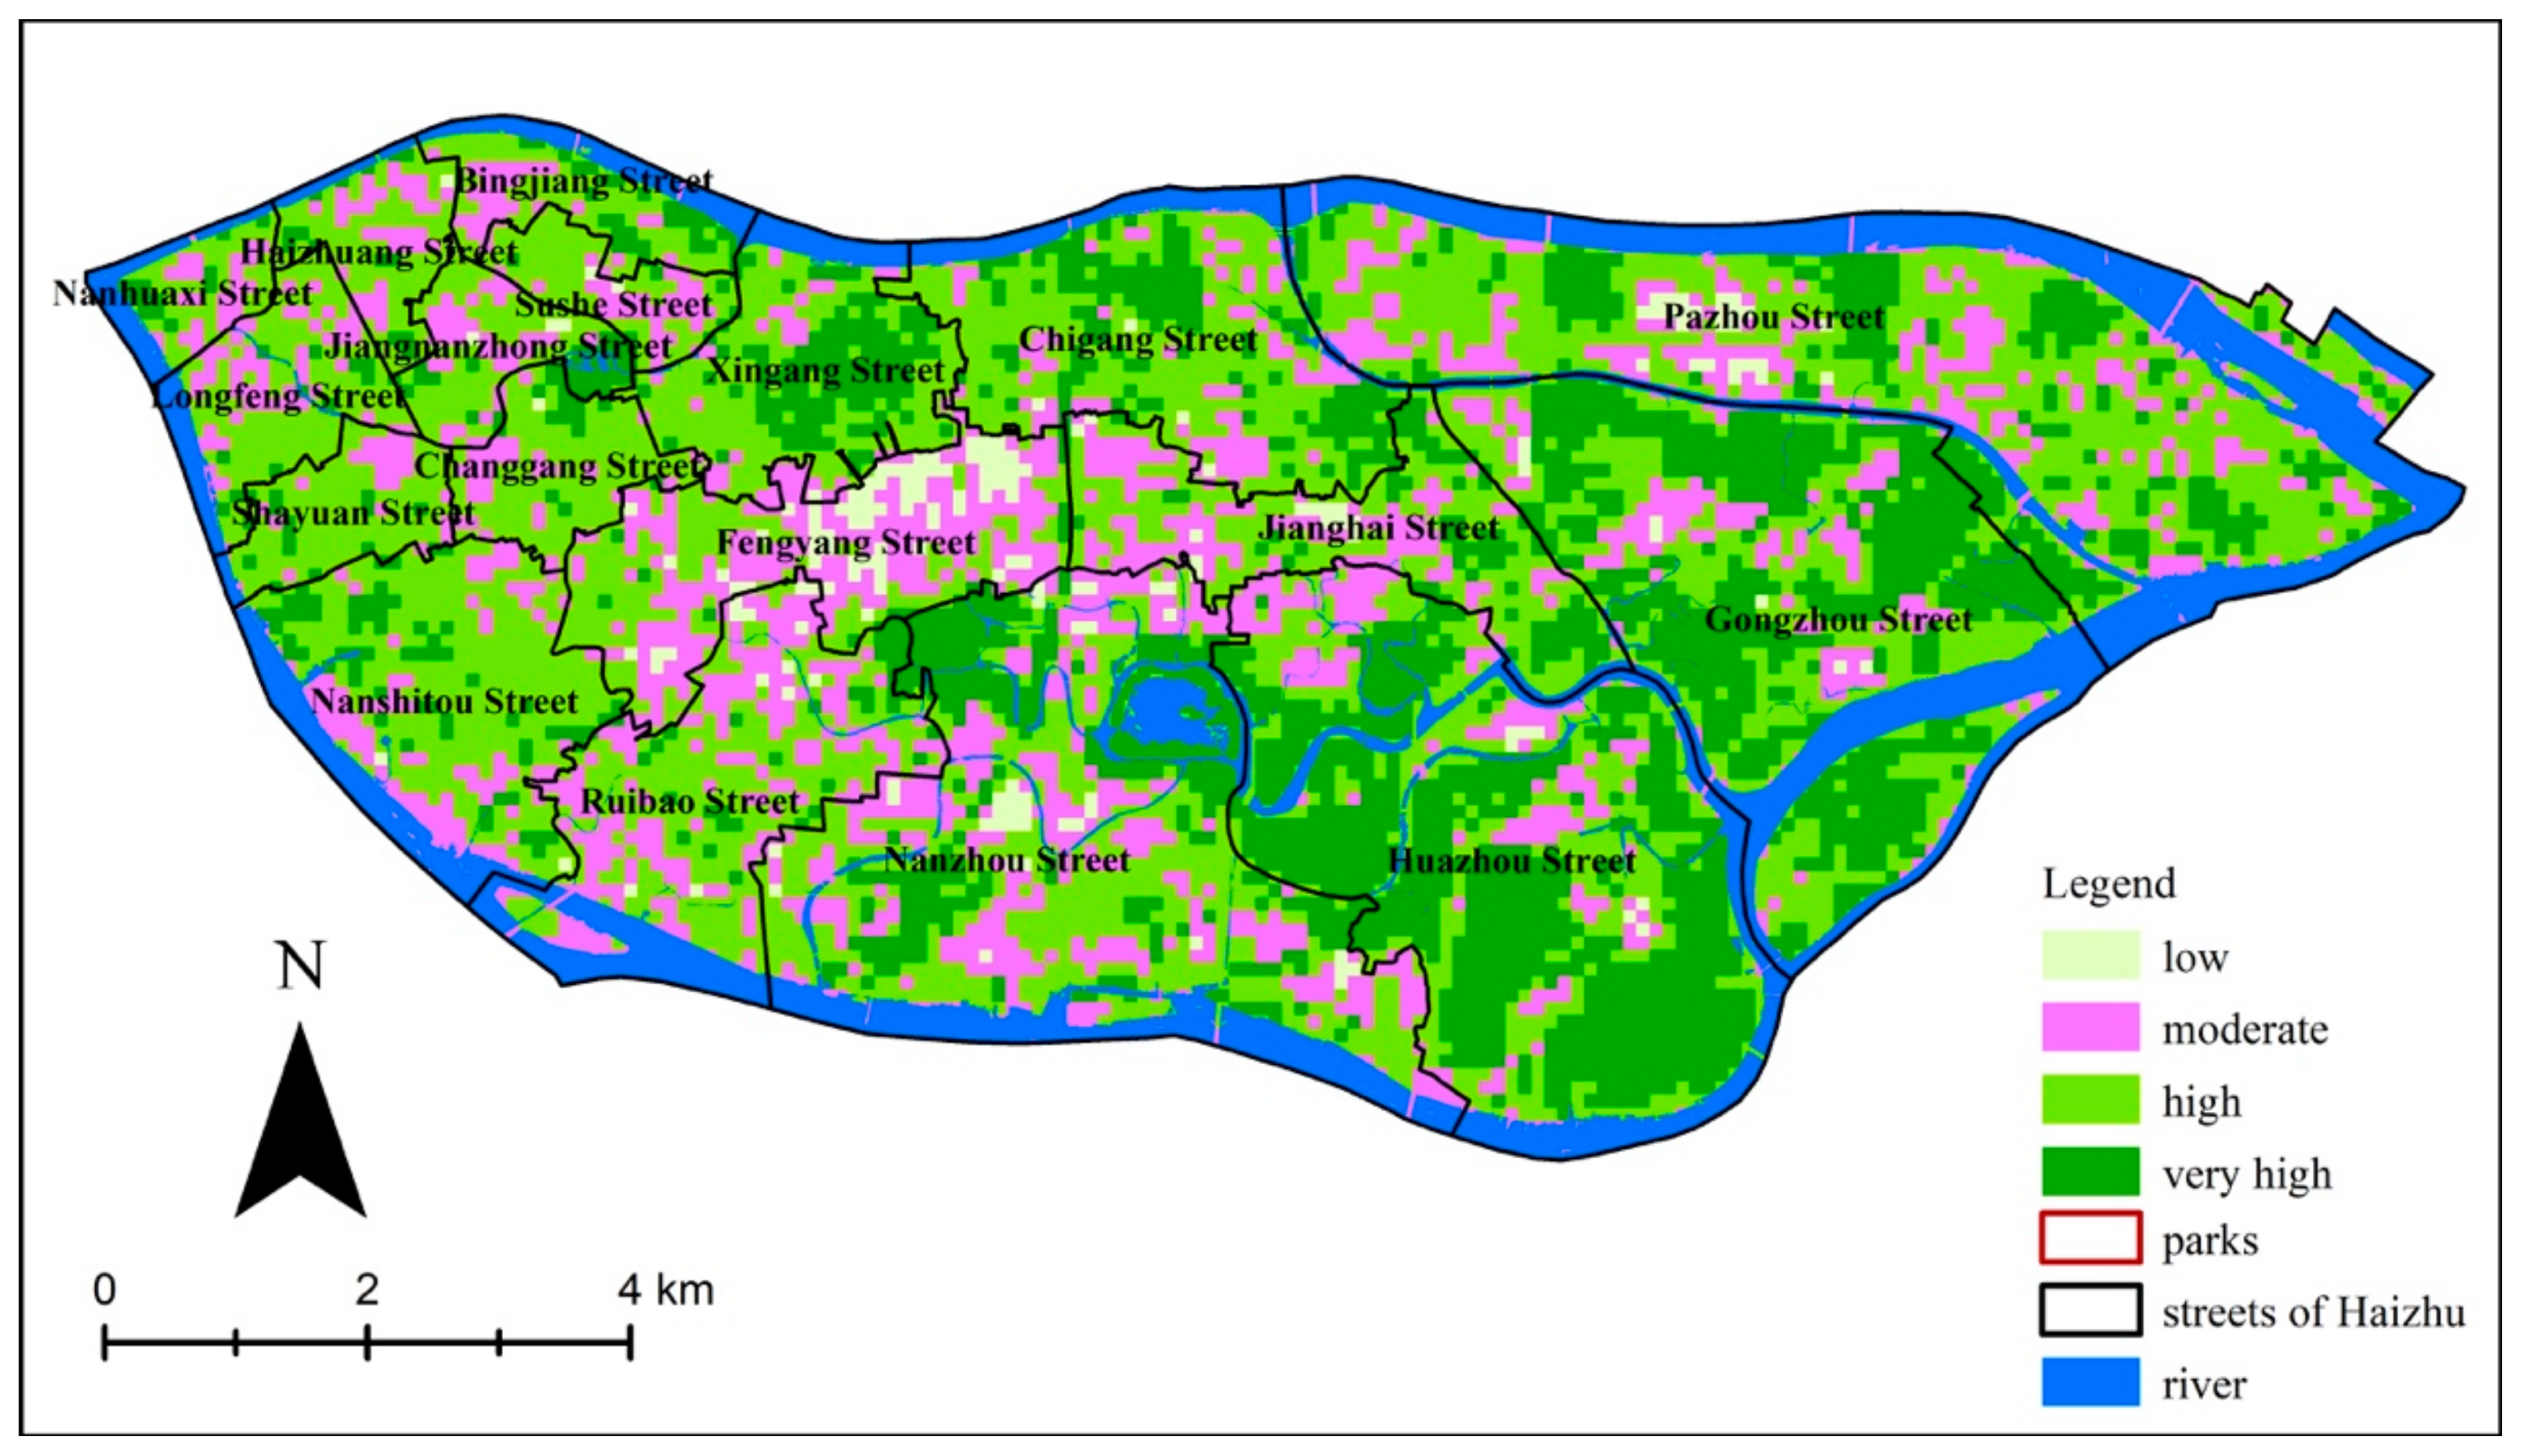
3.5. Urban Neighborhood Green Index
The map of the UNGI shows the overall quality of UGS (Figure 9). All values of the UNGI were from 0.25 to 1, most of which between 0.62 and 1. Referring to the principle of the quantile, we classified the UNGI into four intervals of UGS quality, from low to very high. The Jiedaos with the highest quality UGS were thus identified. Over 95% of the area of Xingang Jiedao had a UNGI over 0.62. Even in Jiedaos with a high density of buildings, such as Jiangnanzhong Jiedao and Changgang Jiedao, all had a UNGI over 0.62.
This study also identified Jiedaos that need improvement to the UGS. Over 85% of the area of Fengyang Jiedao had a UNGI below 0.62. Fengyang Jiedao consists of many tiny factories and urban villages. The UGS in this Jiedao comprised vegetation besides rivers, farmland in urban villages, productive plantation areas, and other small green spaces without amenities for physical activity or leisure.
3.6. Implications of the UNGI for UGS Planning
Considering vegetation type, urban density, proximity to green areas, and the height of structures, this study demonstrates that UNGI is a novel way to discuss the implications for UGS planning. The advantages of UNGI are discussed in what follows. The UNGI performed better than the green index at revealing underlying social inequity because the environment and its resulting accessibility differ by neighborhood. The UNGI is an integrative measure that considers together urban property, accessibility to green areas, and the green index. Theoretically, both UGS and areas with buildings are important for assessing the quality of a UGS. UGS accessibility is determined by its relative position between a UGS and areas with buildings with respect to their use. The UNGI differs in spatial distribution from the green index. All average values of the green index were lower than the UNGI (Table 5). Jiedaos such as Huazhou, Guanzhou, Xingang Jiedao, etc., had a high green index and a high UNGI, whereas Nanhuaxi, Longfeng Jiedao, etc. had a low green index yet a significantly high UNGI. This is to say that the areas with a lower green index do not necessarily have a lower UNGI. However, the higher the green index of a Jiedao, the higher the UNGI it will have (Table 5). The UNGI is superior to the green index for the following reasons.
First, UGS quality pertains to its usefulness based on greenness. The UNGI does better at revealing the quality of UGS compared to the green index. For instance, 83% of Pazhou Jiedao had a combination of moderate to high quality UGS according to the UNGI, yet 63% of its area had low-quality UGS according to the green index (Table 5). This shows the advantages of the UNGI: it is comparatively closer to reality, because this Jiedao is where the Canton Exhibition Center, a large business center, is located, and it has many high-rise buildings and excellent green space. It is obviously not a place with impoverished greenness.
Second, the UNGI is able to provide sufficient information for urban planning and decision-making, unlike the green index. The UNGI revealed the following social processes that the green index could not: (1) Fengyang Jiedao has the worst UGS in terms of health; (2) urban villages, which tend to feature poor-quality UGS, should be improved with proper UGS implementations; (3) small-scale UGS inside communities may play a key role in revealing and fulfilling the need for green space. By considering urban parameters and accessibility, this study unveiled the effects of UGS on residents.
Even though small-scale green space inside communities plays an important role in providing open space for fitness and leisure in China, the usefulness of such green space is usually ignored because it is located on private property. However, the UNGI recognizes the quality of UGS in the old town. For example, Longfeng Jiedao, in which green space is scarce but chiefly attached to housing estates, has 80% of its area with low-quality UGS according to the green index, whereas a majority of its area is considered moderate-quality UGS according to the UNGI. The UNGI in this case recognizes the importance and scope of green spaces attached to housing estates that can meet the needs of citizens for access to green space. Finally, when calculating the proximity to green areas, parks in towns such as Haizhu lake park, Haiyin park, and Haizhuang park contributed considerably to the quality of the UGS in their Jiedao, as did the green space attached to housing estates in the west of Haizhu. As abovementioned, this type of space is usually small and located inside communities, and it is usually occupied by trees. Nevertheless, its location inside communities and its proximity to residents makes valuable UGS in terms of providing shade and leisure. It therefore helps to promote the quality of the UGS.
4. Conclusions
Urban environments are facing ever-increasing pressure in terms of ecological deprivation, loss of natural resources, and the lack or inaccessibility of UGS. Green infrastructure has been expressly conceived as a planning tool for combining urbanization and quality urban environments to lead urban space towards sustainability [40]. Green infrastructure involves planning and policy, environmental and ecological focus, and social content, and it is associated with health and wellbeing, economic benefit, and UGS quality. To identify the current state of green infrastructure and analyze the quality of UGS at the scale of Jiedaos in China, a systematic quantitative analysis of UGS was undertaken using a set of green indices, collectively referred to as the UNGI. We developed the UNGI and applied it to a case study of Haizhu district in Guangzhou, China, from micro-scale (4 km2) to macro-scale (90 km2) areas based on collected data from 2010 and aerial imagery from 2012. At the macro-scale, the UNGI evaluates the greenery in Jiedaos, providing a good way to monitor the quality of UGS across a city. The UNGI outperforms other existing green indices in terms of revealing the quality of UGS, and it is more applicable to urban planning and policy.
The green index in this study was derived based on object-oriented segmentation and manual visual interpretation, unlike the traditional Normalized Deviation Vegetation Index. The Urban Neighborhood Green Index (UNGI) was established by combining four weighted parameters: the green index (P1), the density of buildings (P2), proximity to green areas (P3), and building height (P4). The four parameters of the UNGI are easy to use and suitable for urban planning. We redefined the parameter for the height of structures, and the administration border of Jiedaos was used to assess green spaces, rather than aesthetics or the mere size of the area. The advantage of the method is that it reveals the distribution of green space and its impact on various Jiedaos, based on the relationship of urban forms to greenness.
As an empirical study on UGS themes and planning schemes at the municipal level, this study fills a gap in knowledge of assessing UGS, using the UNGI as a way to enhance the development of green infrastructure and quality of life. The analyses show that (1) the UNGI performed better for UGS planning due to its ability of uncovering impact of the built environment and its accessibility on quality of UGS; (2) the UGS has significant effects on neighbors, which underlies social inequity of UGS supply and presents rich information for urban planning and decision making.; (3) a small green field attaching to a community plays a key role to fulfill the need of neighbors for green space, fitness, and leisure in China, which is usually ignored due to the ownership of private property.
The UNGI also has the advantage of tracing the dynamic quality of UGS, given that continually updated remote sensing images are available. When applying the UNGI to evaluate UGS quality, a sound match between different cell sizes, as well as a weighted matrix for four parameters should be further explored to ensure its relevance in different cities. LIDAR data will also improve the index by producing a finer 3D model and a more accurate description of the distribution of green space. The UNGI can inform city planners regarding their consideration of UGS, and it can contribute to measurements of sustainability and the development of green infrastructure. It suggests recognizing UGS and improving its quality in old towns and improving urban villages characterized by poor quality of green space with green infrastructures.
Through a systematic analysis, this study developed methods and models that will contribute to a new paradigm for urban planning and design, with an emphasis on UGS based on sustainability in a spatial setting. In particular, we focused on evaluating UGS and introduced methodologies for better investigating them. We expect that the results of our study will contribute to measurements of sustainability and the development of green infrastructure by city planners. In future research, we will focus on the application of UNGI to various Chinese cities, with special attention to its usage and implementation in urban planning, and with the aim of improving UGS in cities and the quality of life of citizens. Further, we plan to highlight the multifarious needs of structures and the hierarchy of UGS. Indeed, by detailing the various needs of citizens, for instance, in disadvantaged groups [41], we can better understand the relationship between UGS and residents. Moreover, UGS is not uniform, and different types of green space contribute in different ways and in a more nuanced manner to the quality of UGS.
Author Contributions
Conceptualization, Z.Z. and K.L.; methodology, K.L. and J.F.; formal analysis, K.L. and J.F.; investigation, W.L.; writing—original draft preparation, Z.Z., J.F. and X.T.; writing—review and editing, W.L.; visualization, K.L. and X.T.; funding acquisition, Z.Z.
Funding
This research was funded by National Natural Science Foundation of China, grant number 41401166, 41871148, Key Program of National Natural Science Foundation of China, grant number 41531178 and Research Team Program of Natural Science Foundation of Guangdong Province, China, grant number 2014A030312010.
Acknowledgments
We acknowledge the potential reviewers for their constructive comments.
Conflicts of Interest
The authors declare no conflict of interest.
References
- Department of Economic and Social Affairs. 68% of the World Population Projected to Live in Urban Areas by 2050. 2018. Available online: https://www.un.org/development/desa/en/news/population/2018-revision-of-world-urbanization-prospects.html (accessed on 25 August 2019).
- Saulle, R.; La Torre, G. Good quality and available urban green spaces as good quality, health and wellness for human life. J. Public Health 2011, 34, 161–162. [Google Scholar] [CrossRef] [PubMed] [Green Version]
- Davies, R.G.; Barbosa, O.; Fuller, R.A.; Tratalos, J.; Burke, N.; Lewis, D.; Warren, P.H.; Gaston, K.J. City-wide relationships between green spaces, urban land use and topography. Urban Ecosyst. 2008, 11, 269. [Google Scholar] [CrossRef]
- Heymans, A.; Breadsell, J.; Morrison, G.M.; Byrne, J.J.; Eon, C. Ecological Urban Planning and Design: A Systematic Literature Review. Sustainability 2019, 11, 3723. [Google Scholar] [CrossRef]
- Parker, J.; Zingoni de Baro, M.E. Green Infrastructure in the Urban Environment: A Systematic Quantitative Review. Sustainability 2019, 11, 3182. [Google Scholar] [CrossRef]
- Voghera, A.; Giudice, B. Evaluating and Planning Green Infrastructure: A Strategic Perspective for Sustainability and Resilience. Sustainability 2019, 11, 2726. [Google Scholar] [CrossRef]
- Nouri, H.; Chavoshi Borujeni, S.; Alaghmand, S.; Anderson, S.; Sutton, P.; Parvazian, S.; Beecham, S. Soil Salinity Mapping of Urban Greenery Using Remote Sensing and Proximal Sensing Techniques; The Case of Veale Gardens within the Adelaide Parklands. Sustainability 2018, 10, 2826. [Google Scholar] [CrossRef]
- Reis, C.; Lopes, A. Evaluating the Cooling Potential of Urban Green Spaces to Tackle Urban Climate Change in Lisbon. Sustainability 2019, 11, 2480. [Google Scholar] [CrossRef]
- Gulsrud, N.M.; Gooding, S.; van Den Bosch, C.C. Green space branding in Denmark in an era of neoliberal governance. Urban For. Urban Green. 2013, 12, 330–337. [Google Scholar] [CrossRef]
- Thompson, C.W. Urban open space in the 21st century. Landsc. Urban plan. 2002, 60, 59–72. [Google Scholar] [CrossRef]
- Liu, K.; Liu, L.; Liu, H.; Li, X.; Wang, S. Exploring the effects of biophysical parameters on the spatial pattern of rare cold damage to mangrove forests. Remote Sens. Environ. 2014, 150, 20–33. [Google Scholar] [CrossRef]
- Năstase, I.I.; Pătru-Stupariu, I.; Kienast, F. Landscape Preferences and Distance Decay Analysis for Mapping the Recreational Potential of an Urban Area. Sustainability 2019, 11, 3620. [Google Scholar] [CrossRef]
- Gupta, K.; Roy, A.; Luthra, K.; Maithani, S. GIS based analysis for assessing the accessibility at hierarchical levels of urban green spaces. Urban For. Urban Green. 2016, 18, 198–211. [Google Scholar] [CrossRef]
- Gidlow, C.J.; Ellis, N.J.; Bostock, S. Development of the neighbourhood green space tool (NGST). Landsc. Urban Plan. 2012, 106, 347–358. [Google Scholar] [CrossRef]
- Gupta, K.; Kumar, P.; Pathan, S.K.; Sharma, K.P. Urban Neighborhood Green Index–A measure of green spaces in urban areas. Landsc. Urban Plan. 2012, 105, 325–335. [Google Scholar] [CrossRef]
- Łaszkiewicz, E.; Kronenberg, J.; Marcińczak, S. Attached to or bound to a place? The impact of green space availability on residential duration: The environmental justice perspective. Ecosyst. Serv. 2018, 30, 309–317. [Google Scholar] [CrossRef]
- Panduro, T.E.; Veie, K.L. Classification and valuation of urban green spaces—A hedonic house price valuation. Landsc. Urban Plan. 2013, 120, 119–128. [Google Scholar] [CrossRef]
- Flouri, E.; Midouhas, E.; Joshi, H. The role of urban neighbourhood green space in children’s emotional and behavioural resilience. J. Environ. Psychol. 2014, 40, 179–186. [Google Scholar] [CrossRef]
- Balram, S.; Dragićević, S. Attitudes toward urban green spaces: Integrating questionnaire survey and collaborative GIS techniques to improve attitude measurements. Landsc. Urban Plan. 2005, 71, 147–162. [Google Scholar] [CrossRef]
- Cloutier, S.; Jambeck, J.; Scott, N. The Sustainable Neighborhoods for Happiness Index (SNHI): A metric for assessing a community’s sustainability and potential influence on happiness. Ecol. Indic. 2014, 40, 147–152. [Google Scholar] [CrossRef]
- Gu, W.; Chen, Y.; Dai, M. Measuring Community Greening Merging Multi-Source Geo-Data. Sustainability 2019, 11, 1104. [Google Scholar] [CrossRef]
- Liu, X.; Zhu, Z.; Jin, L.; Wang, L.; Huang, C. Measuring patterns and mechanism of greenway use–A case from Guangzhou, China. Urban For. Urban Green. 2018, 34, 55–63. [Google Scholar] [CrossRef]
- Neema, M.N.; Ohgai, A. Multitype green-space modeling for urban planning using GA and GIS. Environ. Plan. B Plan. Des. 2013, 40, 447–473. [Google Scholar] [CrossRef]
- Liu, Y.; Meng, Q.; Zhang, J.; Zhang, L.; Jancso, T.; Vatseva, R. An effective Building Neighborhood Green Index model for measuring urban green space. Int. J. Digit. Earth 2016, 9, 387–409. [Google Scholar] [CrossRef]
- Hur, M.; Nasar, J.L.; Chun, B. Neighborhood satisfaction, physical and perceived naturalness and openness. J. Environ. Psychol. 2010, 30, 52–59. [Google Scholar] [CrossRef]
- Sathyakumar, V.; Ramsankaran, R.A.; Bardhan, R. Linking remotely sensed Urban Green Space (UGS) distribution patterns and Socio-Economic Status (SES)-A multi-scale probabilistic analysis based in Mumbai, India. GISci. Remote Sens. 2019, 56, 645–669. [Google Scholar] [CrossRef]
- Li, X.; Meng, Q.; Li, W.; Zhang, C.; Jancso, T.; Mavromatis, S. An explorative study on the proximity of buildings to green spaces in urban areas using remotely sensed imagery. Ann. GIS 2014, 20, 193–203. [Google Scholar] [CrossRef]
- Li, X.; Zhang, C.; Li, W.; Ricard, R.; Meng, Q.; Zhang, W. Assessing street-level urban greenery using Google Street View and a modified green view index. Urban For. Urban Green. 2015, 14, 675–685. [Google Scholar] [CrossRef]
- Mansor, M.; Zakariya, K.; Harun, N.Z. Does Neighborhood Green Infrastructure (NGI) Affect Residents’ Self-Perceived Health? Adv. Sci. Lett. 2017, 23, 2770–2773. [Google Scholar] [CrossRef]
- Randall, T.A.; Churchill, C.J.; Baetz, B.W. A GIS-based decision support system for neighbourhood greening. Environ. Plan. B Plan. Des. 2003, 30, 541–563. [Google Scholar] [CrossRef]
- Szulczewska, B.; Giedych, R.; Borowski, J.; Kuchcik, M.; Sikorski, P.; Mazurkiewicz, A.; Stańczyk, T. How much green is needed for a vital neighbourhood? In search for empirical evidence. Land Use Policy 2014, 38, 330–345. [Google Scholar] [CrossRef]
- Kim, D.; Song, S.K. The Multifunctional Benefits of Green Infrastructure in Community Development: An Analytical Review Based on 447 Cases. Sustainability 2019, 11, 3917. [Google Scholar] [CrossRef]
- James, P.; Tzoulas, K.; Adams, M.D.; Barber, A.; Box, J.; Breuste, J.; Elmqvist, T.; Frith, M.; Gordon, C.; Greening, K.L.; et al. Towards an integrated understanding of green space in the European built environment. Urban For. Urban Green. 2009, 8, 65–75. [Google Scholar] [CrossRef]
- Latta, S.C.; Musher, L.J.; Latta, K.N.; Katzner, T.E. Influence of human population size and the built environment on avian assemblages in urban green spaces. Urban Ecosyst. 2013, 16, 463–479. [Google Scholar] [CrossRef]
- Senanayake, I.P.; Welivitiya, W.D.; Nadeeka, P.M. Urban green spaces analysis for development planning in Colombo, Sri Lanka, utilizing THEOS satellite imagery–A remote sensing and GIS approach. Urban For. Urban Green. 2013, 12, 307–314. [Google Scholar] [CrossRef]
- Chen, T.; Lang, W.; Li, X. Exploring the Impact of Urban Green Space on Residents’ Health in Guangzhou, China. J. Urban Plan. Dev. 2019. [Google Scholar] [CrossRef]
- Chen, T.; Hui, E.C.; Lang, W.; Tao, L. People, recreational facility and physical activity: New-type urbanization planning for the healthy communities in China. Habitat Int. 2016, 58, 12–22. [Google Scholar] [CrossRef]
- Wendel, H.E.; Zarger, R.K.; Mihelcic, J.R. Accessibility and usability: Green space preferences, perceptions, and barriers in a rapidly urbanizing city in Latin America. Landsc. Urban Plan. 2012, 107, 272–282. [Google Scholar] [CrossRef]
- Malczewski, J. GIS and Multicriteria Decision Analysis; John Wiley & Sons: New York, NY, USA, 1999. [Google Scholar]
- Lang, W.; Chen, T.; Li, X. A new style of urbanization in China: Transformation of urban rural communities. Habitat Int. 2016, 55, 1–9. [Google Scholar] [CrossRef]
- Zhu, Z.; Ren, J.; Liu, X. Green infrastructure provision for environmental justice: Application of the equity index in Guangzhou, China. Urban For. Urban Green. 2019, 46, 126443. [Google Scholar] [CrossRef]
Figure 1.
A technological flow chart.

Figure 2.
A map of location of Haizhu district.

Figure 3.
A map of classification of the UGS.

Figure 4.
A map of green parameter.

Figure 5.
A map of buildings and its classified height of structure.

Figure 6.
A map of building density parameter.

Figure 7.
Maps for producing proximity to the green parameter. (a) A map of reclassified vegetation; (b) a map of buffer around vegetations, and (c) a map of proximity to the green parameter.
Figure 7.
Maps for producing proximity to the green parameter. (a) A map of reclassified vegetation; (b) a map of buffer around vegetations, and (c) a map of proximity to the green parameter.

Figure 8.
A map of height of structure parameter.

Figure 9.
A map of UNGI. Note: four classes of quality of UGS are in domains namely low (0.25–0.43), moderate (0.43–0.62), high (0.62–0.81), and very high (0.81–1).
Figure 9.
A map of UNGI. Note: four classes of quality of UGS are in domains namely low (0.25–0.43), moderate (0.43–0.62), high (0.62–0.81), and very high (0.81–1).


Table 1.
Classification of the UGS of Haizhu.
| Classification | Description |
|---|---|
| Park | Public open space for leisure or appreciation by people. The major function includes ecology, aesthetics, and precautions against natural calamities. |
| Attached green space | Green space in communal facilities area, such as in factories or administrative buildings. |
| Farmland | Green land for cultivating crops and edible vegetables. |
| Productive plantation areas | Green land being nursery garden to raise mainly flowers and plants for appreciation and a little amount of woody plants for urban greening. |
| Green space attached to housing estates | Green land in residential area. |
| Green space attached to urban road and square | Green land in public square. |
| Roadside green space | Green land along roads. |
| Other green space | Unused green land with high value of urban landscape and eco-environment quality. |
Table 2.
Various parameters and their responding measure of quality of green.
| Parameter | Indicator and Description | Percentage | Value (pj) | Quality of UGS |
|---|---|---|---|---|
| Green index (P1) | Percentage of green in each cell | 0–25 | 0.25 | Low |
| 25–50 | 0.5 | Moderate | ||
| 50–75 | 0.75 | High | ||
| 75–100 | 1 | Very high | ||
| Building density (P2) | Percentage of buildings area in each cell, exclude the open space without vegetation | 0–25 | 1 | Very high |
| 25–50 | 0.75 | High | ||
| 50–75 | 0.5 | Moderate | ||
| 75–100 | 0.25 | Low | ||
| Proximity to green (P3) | Percentage of area in buffer around green in each cell. The buffer area arounds green is generated by two steps as Section 2.6. | >50% of the area of the cell in buffer around dense vegetation/park | 1 | Very high |
| > 20% and < 50% of the area of the cell in buffer around dense vegetation/park | 0.75 | High | ||
| Buffer around sparse vegetation | 0.5 | Moderate | ||
| Other Area | 0.25 | Low | ||
| Height of structures (P4) | Percentage of high-rise buildings in each cell. The process sees Section 2.8 | 0–25 | 1 | Very high |
| 25–50 | 0.75 | High | ||
| 50–75 | 0.5 | Moderate | ||
| 75–100 | 0.25 | Low |
Table 3.
The percentage of green quality classes for various parameters.
| Quality Classes | Percentage (%) | |||
|---|---|---|---|---|
| P1 | P2 | P3 | P4 | |
| Low | 59.16 | 2.33 | 35.06 | 0.15 |
| Moderate | 19.65 | 12.18 | 11.31 | 0.25 |
| High | 8.23 | 24.28 | 13.40 | 3.28 |
| Very high | 12.96 | 61.22 | 40.23 | 96.32 |
| Total | 100.00 | 100.00 | 100.00 | 100.00 |
Table 4.
Classification of the height of urban structures in Haizhu.
| Building Type | Division of Story | Height | |
|---|---|---|---|
| Story | m | ||
| Low-rise building | Low-rise building | 1~3 | ≤10 |
| Multi-story building | 3~7 | 11–16 | |
| Mid-rise building | 7~9 | 17–27 | |
| High-rise building | High-rise building | >9 | >27 |
Table 5.
Comparison of average and stand deviation between GI and UNGI by Jiedao.
| Jiedao | GI | UNGI | Jiedao | GI | UNGI | ||||
|---|---|---|---|---|---|---|---|---|---|
| Avg | SD | Avg | SD | Avg | SD | Avg | SD | ||
| Chigang | 0.26 | 0.19 | 0.73 | 0.12 | Shayuan | 0.16 | 0.12 | 0.72 | 0.10 |
| Xingang | 0.30 | 0.25 | 0.76 | 0.14 | Nanshitou | 0.18 | 0.16 | 0.70 | 0.12 |
| Changgang | 0.19 | 0.17 | 0.71 | 0.11 | Fengyang | 0.12 | 0.16 | 0.60 | 0.15 |
| Jiangnanzhong | 0.25 | 0.20 | 0.73 | 0.13 | Ruibao | 0.17 | 0.21 | 0.65 | 0.13 |
| Binjiang | 0.19 | 0.17 | 0.70 | 0.11 | Jianghai | 0.25 | 0.23 | 0.70 | 0.14 |
| Sudu | 0.21 | 0.10 | 0.69 | 0.12 | Pazhou | 0.25 | 0.30 | 0.70 | 0.12 |
| Haizhuang | 0.16 | 0.12 | 0.69 | 0.11 | Nanzhou | 0.26 | 0.29 | 0.70 | 0.15 |
| Nanhuaxi | 0.12 | 0.15 | 0.68 | 0.10 | Huazhou | 0.53 | 0.34 | 0.79 | 0.15 |
| Longfeng | 0.14 | 0.11 | 0.68 | 0.10 | Guanzhou | 0.44 | 0.37 | 0.77 | 0.13 |
Note: Please note that UNGI is achieved by Equation (1). Both UNGI and GI were standardized.
© 2019 by the authors. Licensee MDPI, Basel, Switzerland. This article is an open access article distributed under the terms and conditions of the Creative Commons Attribution (CC BY) license (http://creativecommons.org/licenses/by/4.0/).
Share and Cite
MDPI and ACS Style
Zhu, Z.; Lang, W.; Tao, X.; Feng, J.; Liu, K. Exploring the Quality of Urban Green Spaces Based on Urban Neighborhood Green Index—A Case Study of Guangzhou City. Sustainability 2019, 11, 5507. https://doi.org/10.3390/su11195507
AMA Style
Zhu Z, Lang W, Tao X, Feng J, Liu K. Exploring the Quality of Urban Green Spaces Based on Urban Neighborhood Green Index—A Case Study of Guangzhou City. Sustainability. 2019; 11(19):5507. https://doi.org/10.3390/su11195507
Chicago/Turabian StyleZhu, Zhanqiang, Wei Lang, Xiaofang Tao, Jiali Feng, and Kai Liu. 2019. "Exploring the Quality of Urban Green Spaces Based on Urban Neighborhood Green Index—A Case Study of Guangzhou City" Sustainability 11, no. 19: 5507. https://doi.org/10.3390/su11195507
Note that from the first issue of 2016, this journal uses article numbers instead of page numbers. See further details here.