A Reactive Power Compensation Strategy for Voltage Stability Challenges in the Korean Power System with Dynamic Loads


Department of Electrical and Information Engineering, Seoul National University of Science and Technology, Seoul 01811, Korea
*
Author to whom correspondence should be addressed.
Sustainability 2019, 11(2), 326; https://doi.org/10.3390/su11020326
Submission received: 30 November 2018
/
Revised: 28 December 2018
/
Accepted: 7 January 2019
/
Published: 10 January 2019
(This article belongs to the Special Issue Assessment of Energy Accident Risks)
Abstract
:This paper describes a methodology and specifics for technical studies on fault-induced delayed voltage recovery (FIDVR) mitigation to ensure power system reliability. Optimal locations of the dynamic volts-ampere-reactive (VAR) sources are determined for addressing the FIDVR issues in the voltage stability analysis and assessment methodology. We propose a voltage stability analysis method for planning dynamic VAR sources for bettering electric power transmission systems under contingency conditions. A time-domain dynamic simulation is performed to assess short-term voltage stability. While conducting dynamic simulations, sensitivity analysis is performed to assess the need for dynamic VAR sources. This study focuses on a reactive power compensation strategy to determine system voltage recovery performance by optimal flexible alternating current transmission system (FACTS) placement in a metropolitan region. The objective of this study is to determine the optimal installation of dynamic VAR sources while satisfying the requirements of voltage stability margin and transient voltage dip under a set of criteria. New insights are presented on the effect of FACTS controls on the reactive power compensation, which supports voltage recovery. The main features of the proposed method are (i) the development based on a load model for FIDVR, (ii) the use of sensitivity analysis of the network to the variations of the IM load, (iii) the establishment of the control function and compensation strategy to maintain the voltage of system within criteria limits, and (iv) the use of the sensitivity analysis based on branch parameterization for unsolvable cases. Case studies on the Korean power system validated the performance of the proposed strategy, showing that it effectively installed FACTS under contingency scenarios.
1. Introduction
Modern power systems are becoming increasingly complex and dynamic owing to an increased use of induction motor (IM) loads. The increasing usage of these loads with low inertia characteristics make power systems more vulnerable to short-term voltage stability (STVS). Such problems might be aggravated by the growing use of single-phase heating, ventilation, and air conditioner (HVAC) units with high-efficiency and low-inertia motors. When a fault occurs on the load side, where there is a high proportion of IM loads, a large power vacancy is induced and can cause a widespread voltage to drop. Additionally, the demand for reactive power increases significantly at large IM loads. Under these conditions, the local dynamic volts-ampere-reactive (VAR) reserves are insufficient and reactive power support cannot be delivered; therefore, the power system may experience fault induced delayed voltage recovery (FIDVR) or voltage instability [1,2,3,4].
FIDVR is a phenomenon caused by the dynamic behavior of constant-torque IM loads. When a motor stalls following a severe fault, the reactive power requirements might be 5 to 8 times higher than normal. The unexpected increase in the reactive power requirement may prevent voltage recovery in a local area power system. Furthermore, when a fault occurs during peak load conditions, a highly inductive power system load may not be able to maintain the voltage at the accepted levels [5,6,7,8]. To prevent catastrophic situations due to FIDVR, appropriate controlling actions are required to mitigate these conditions. Control solutions to alleviate FIDVR can be classified into demand-side and supply-side solutions [5]. The demand-side solution uses a protection system to rapidly disconnect IM loads under low-voltage conditions and limit the amount of load affected by low voltages [9]. Supply-side solutions focus on mitigating FIDVR threats and reinforcing power networks with dynamic VAR compensation devices, such as a static VAR compensator (SVC) and a static synchronous compensator (STATCOM) [10]. Voltage source converter devices, such as STATCOM, are efficient in controlling the voltage and can provide cost-effective voltage support to boost the local bus voltage during FIDVR events. Therefore, it is necessary to develop cost-effective reactive power compensation strategies that enhance STVS [1,2]. Various studies have been carried out to analyze the optimal placement of dynamic VAR sources. The method in [11] evaluates the cost and benefits of flexible alternating current transmission system (FACTS) device installation, while taking voltage stability into consideration. Reference [12] describes the optimal placement of dynamic VAR sources using post-contingency trajectory sensitivity analysis. In [13], the locations of dynamic VAR sources are determined based on modal analysis after considering the input signal for the supplementary controller of FACTS devices. Similarly, the methodology in [14] determines the optimal locations and sizing of FACTS devices using genetic algorithms. Tiwari et al. adopted a multi-contingency constrained reactive power planning method by decomposing the optimization problem [15]. Furthermore, several studies were conducted to alleviate the STVS problem using sensitivity analysis. In [16,17], a trajectory sensitivity analysis method is proposed to mitigate voltage instability using dynamic reactive power resources. References [18,19,20,21] used sensitivity as a performance measure for VAR sources to satisfy the requirements of voltage stability margin and transient voltage dip. In [22], a sensitivity index is applied to determine the most influential locations of dynamic VAR support under certain contingencies. The method in [23] proposed a new model for optimal management and control of the distribution system grid based on the sensitivity analysis of branch power flow equations. However, most of the existing studies only considered steady-state analysis when allocating dynamic VAR sources to resolve STVS issues. Thus the methods might not capture the full performance of the dynamic VAR sources, not considering the impact of IMs to transient voltage dynamics.
This paper presents an advanced method for dynamic VAR source compensation control schemes with FACTS to mitigate the STVS and FIDVR problems of power systems. This method is for the decision making on optimal operations and placement of dynamic reactive power compensation in terms of voltage stability, based on the sensitivity analysis information from the proposed methods. The main features of the proposed method are (i) the development based on a load model for FIDVR, (ii) the use of sensitivity analysis of the network to the variations of the IM load, (iii) the establishment of the control function and compensation strategy to maintain the voltage of system within criteria limits, and (iv) the use of the sensitivity analysis based on branch parameterization for unsolvable cases. Of them, the last feature is very important because of the security assessments of the power system reflecting the various contingencies that can be performed in terms of supporting reactive power compensation planning in order to guarantee secure system operations. When weak network conditions are combined with significant penetration of the IM load at fault clearing, the network is prone to FIDVR. Therefore, the objective of this study is to develop appropriate reactive power compensation strategies to resolve FIDVR problems. This study employed active power–voltage (PV) and reactive power–voltage (QV) analyses to identify the system margin in terms of voltage stability. In addition, the optimal allocation of dynamic VAR sources using a version of branch-parameter continuation power flow (BCPF) method [24] is applied. Using the methodology, it is possible to derive the results of sensitivity analysis for restoring reactive power under severe outage conditions. Furthermore, time domain analysis is conducted for dynamic stability monitoring in accordance with the power system planning standards. Case studies conducted on the worst conceivable contingency at the peak of the winter season considered in the Korean power system operation planning, which is threatened by serious FIDVR complications. This situation belongs to rare but extremely high impact events conceivable in system operations; one example of it is a loss of 765 kV double-circuit transmission lines in a Korean power system. The proposed strategy includes the coordination of the performance of transient stability with an adequate countermeasure to help make the grid resilient against catastrophic contingency. In addition, extensive simulation studies are performed to investigate its performance and to demonstrate its effectiveness in resolving the problem of STVS.
2. Methodologies for Countermeasures against Short-Term Voltage Stability Problems
2.1. Load Model Development Metodology
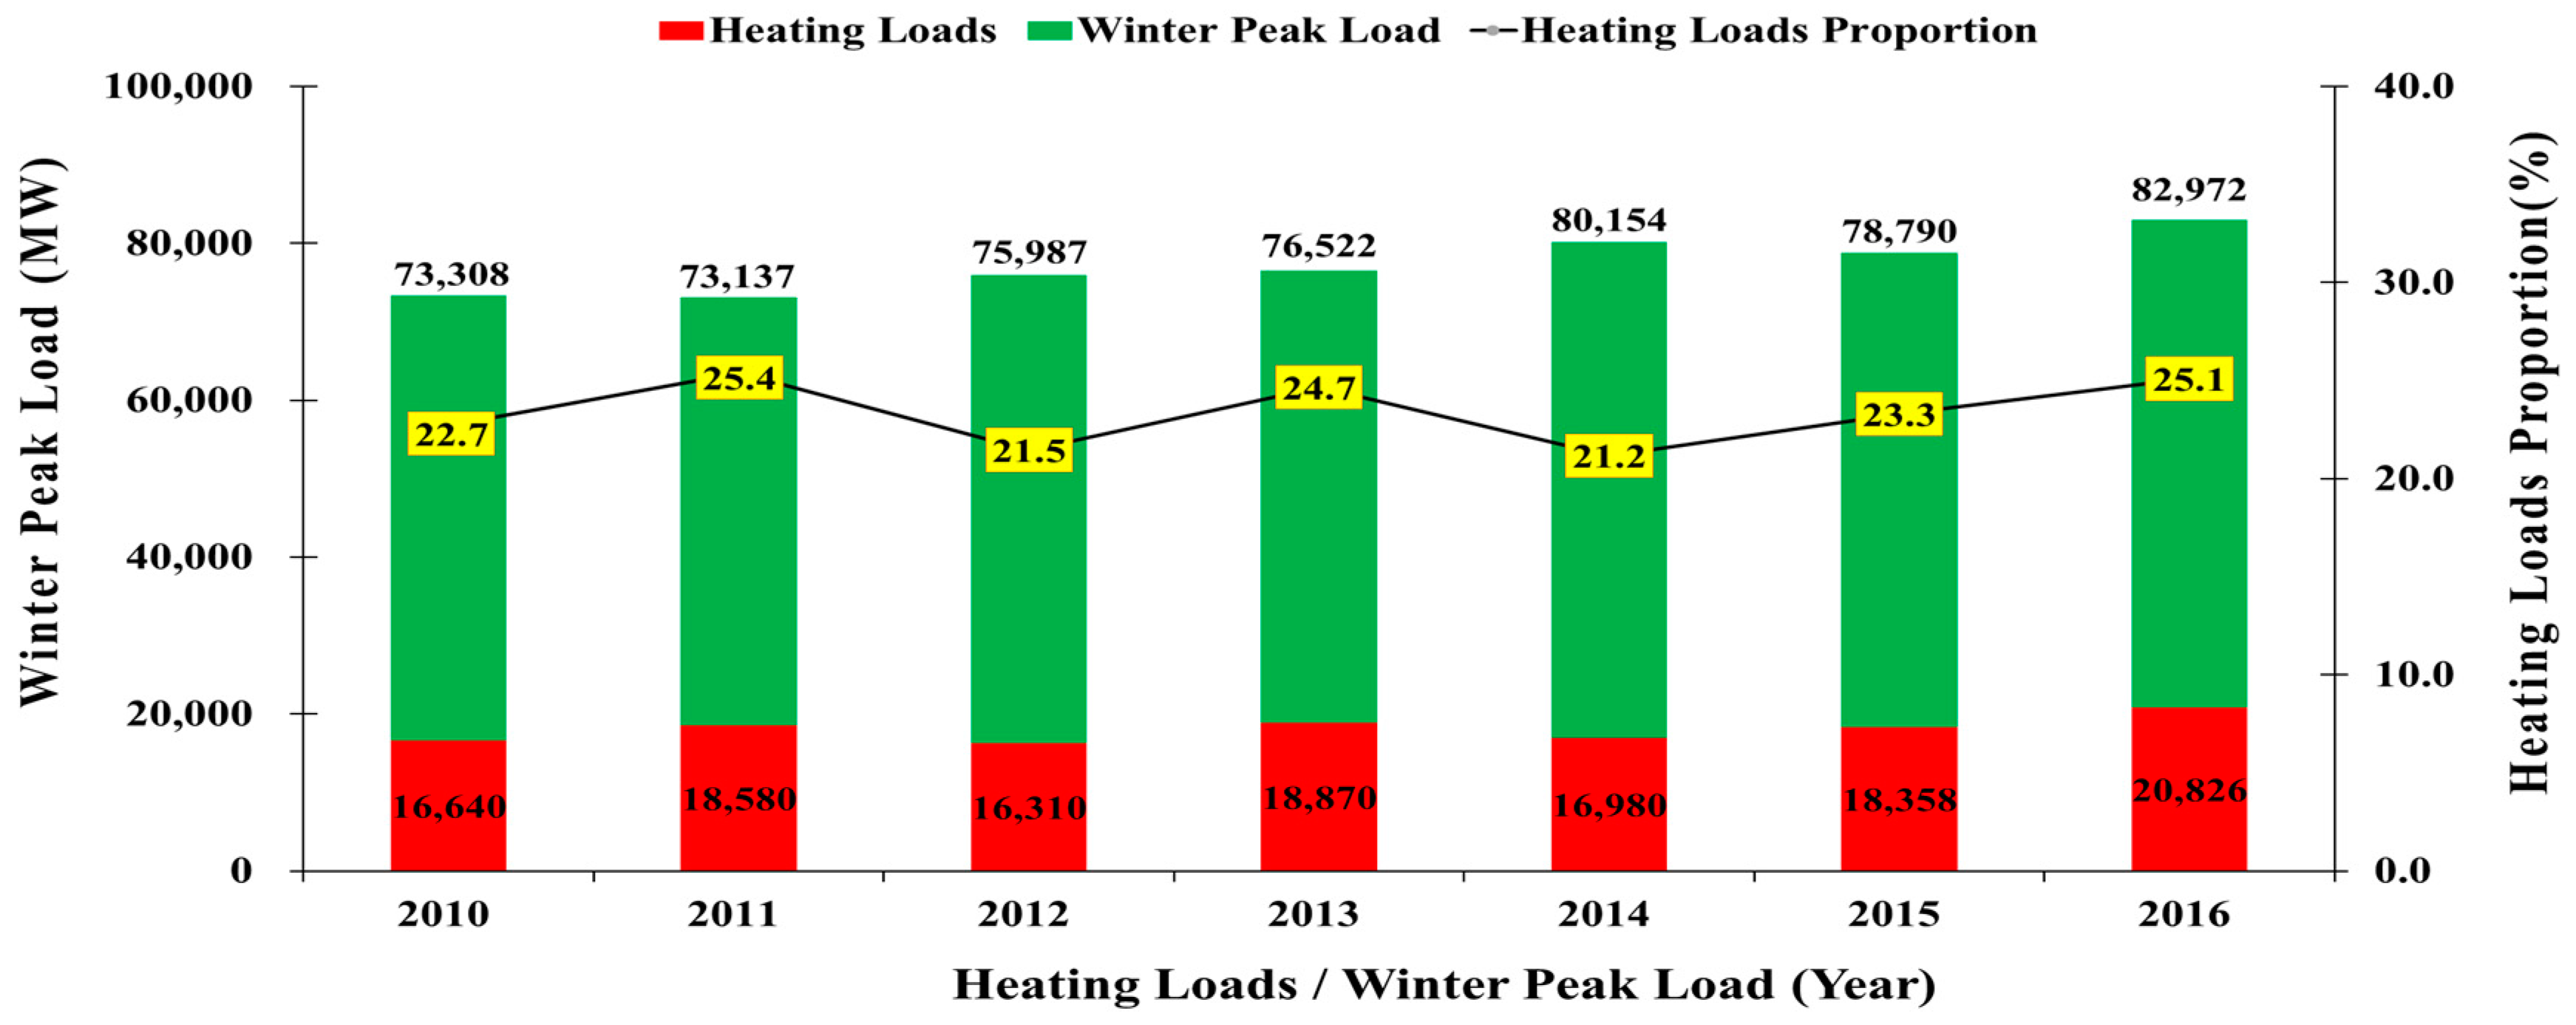
Load characteristics exert a significant influence on power system stability. However, load modeling is complicated because a typical load bus, represented in stability studies, is composed of a large number of devices. In addition, the composition changes depending on many factors, including time, weather conditions, and state of the economy. Even if the load composition is known exactly, it would be difficult to represent each individual component, as there are millions of such components in the total load supplied by a power system. Therefore, load representation in system studies is based on a considerable amount of simplification [25,26,27,28,29]. This subsection describes the fundamental concepts related to the development of the load model used in this study. For the purpose of this study, a more detailed dynamic load representation of the Korean power system was generated. Detailed information on the actual load compositions was obtained from the national statistical information database [30]. The recent change in the peak load in winter is shown in Figure 1.
In Figure 1, one can notice an increase in seasonal demand due to an increase in winter loads; further, the annual variation in power demand is continuously increasing. This increase in electricity consumption is attributed to the rise in gas prices. An increase in severe cold conditions due to climate change and changes in lifestyle are contributing to the increase in residential power equipment. In addition, due to advancements in the service industry, the demand for load in the commercial class is rapidly increasing. In particular, in the case of winter peak load, the proportion of commercial load exceeded that of the industrial load.
Generally, IM loads operate in a constant torque mode depending on the voltage of the connected nodes [2,9]. As soon as the voltage magnitude is reduced, IM loads attempt to slow down. If a low voltage persists for a certain period of time, the IM loads might be stalled or stopped. However, when the voltage begins to recover, the IM load restarts, draws large reactive power and current from the grid, resulting in a delayed voltage recovery. Another typical load that causes load recovery is the heating load based on thermostat-controlled resistance. Thermostatically controlled loads are self-restoring in nature. If these electric heating loads constitute a substantial share of the load, especially in winter, the system might be significantly affected. In the case of a heating load with a thermostat, the load might increase even if tap blocking is performed. These characteristics might be the main reason for voltage instability [29].
A key factor that results in FIDVR in power systems is the nature of the IM loads in the transmission and distribution systems. The performance characteristics of these loads are changing due to technological advances. A large three-phase induction motor (TPIM) and small single-phase induction motor (SPIM) are connected directly to the electrical network. These types of IM loads are expected to be a major component of the aggregate load due to economic reasons. Figure 2 shows the structure of the load model used in this study.
In Figure 2, the impedance and load tap changer settings were based on typical values in the available data. For the IM loads, two different motor models were used. One of the motor loads is a SPIM, which has a low inertia and responds instantaneously to voltage changes. Another motor load is a TPIM; they are commonly used in industry to drive processes. The ZIP load represents static loads (e.g., constant impedance, constant current, and constant power loads) [29,31]. The areas of particular concern in this study (metropolitan area of the Korean peninsula) are primarily residential and commercial. The primary sources for power demand consist of the TPIM (commercial class) and SPIM (residential class). In order to better represent the power consumption characteristics of IM loads, it is necessary to take advantage of the power consumption characteristics under the most severe peak conditions, in terms of voltage stability.
2.2. Reactive Power Support Devices
As large quantities of IM loads exert a significant influence on the stability of the power systems, the requirements for reactive power support have become important. Reactive power plays a major role in the transmission of power systems. During IM reacceleration after a fault, when high current is drawn, a high reactive power support is required for a few seconds to provide a fast response [7]. FACTS technologies are available in different forms, such as SVC, STATCOM, thyristor-controlled series capacitor (TCSC), and unified power flow controllers (UPFC). Among them, SVC and STATCOM are categorized as dynamic VAR compensation resources that rapidly inject or absorb VARs to support power system voltage immediately after system disturbances. The STATCOM technology increases voltage stability by providing dynamic control and compensation of the system voltage. The advantage of STATCOM is that its compensating current is not dependent on the system voltage level at the point of common coupling (PCC) when the voltage drops; it operates at full capacity. Utilizing the STATCOM switching control allows for faster control response when compared to SVC and improved performance in power systems. In addition, STATCOM is more resilient to changes in power system conditions, such as variations in harmonic levels, and requires smaller outdoor equipment when compared to SVC [32,33,34].
As mentioned earlier, STATCOM regulates the voltage at its PCC by controlling the amount of reactive power that is injected or absorbed from the power system through its voltage-source converter. When the system voltage is high, STATCOM absorbs reactive power (inductive mode), while the device generates and injects reactive power into the system when the system voltage is low (capacitive mode). Figure 3 represents the voltage-current (V-I) characteristics of SVC and STATCOM.
In Figure 3, one can notice that outside the linear operating range, STATCOM, and SVC act differently. SVC and STATCOM perform differently when the control limits of system voltage are reached. Both V-I curves are regulated with a slope when operating within limits. In the control range, a droop characteristic is used to avoid excessive control and to coordinate with other voltage control equipment. STATCOM has symmetrical inductive and capacitive reactive power ranges, but a fixed or switched shunt compensation can be used to bias the output range as desired. Additionally, STATCOM results in a better voltage support in low-voltage conditions. Therefore, an increase in the reactive power support of STATCOM quickly compensates for the disturbance-enhanced voltage stability margin [35,36]. The main purpose of STATCOM is to continuously regulate and support voltage under normal and transient conditions in the Korean power system. Dynamic reactive support is needed so that the transmission system remains stable in the metropolitan area for alleviating FIDVR.
2.3. Voltage Stability Analysis and Assessment
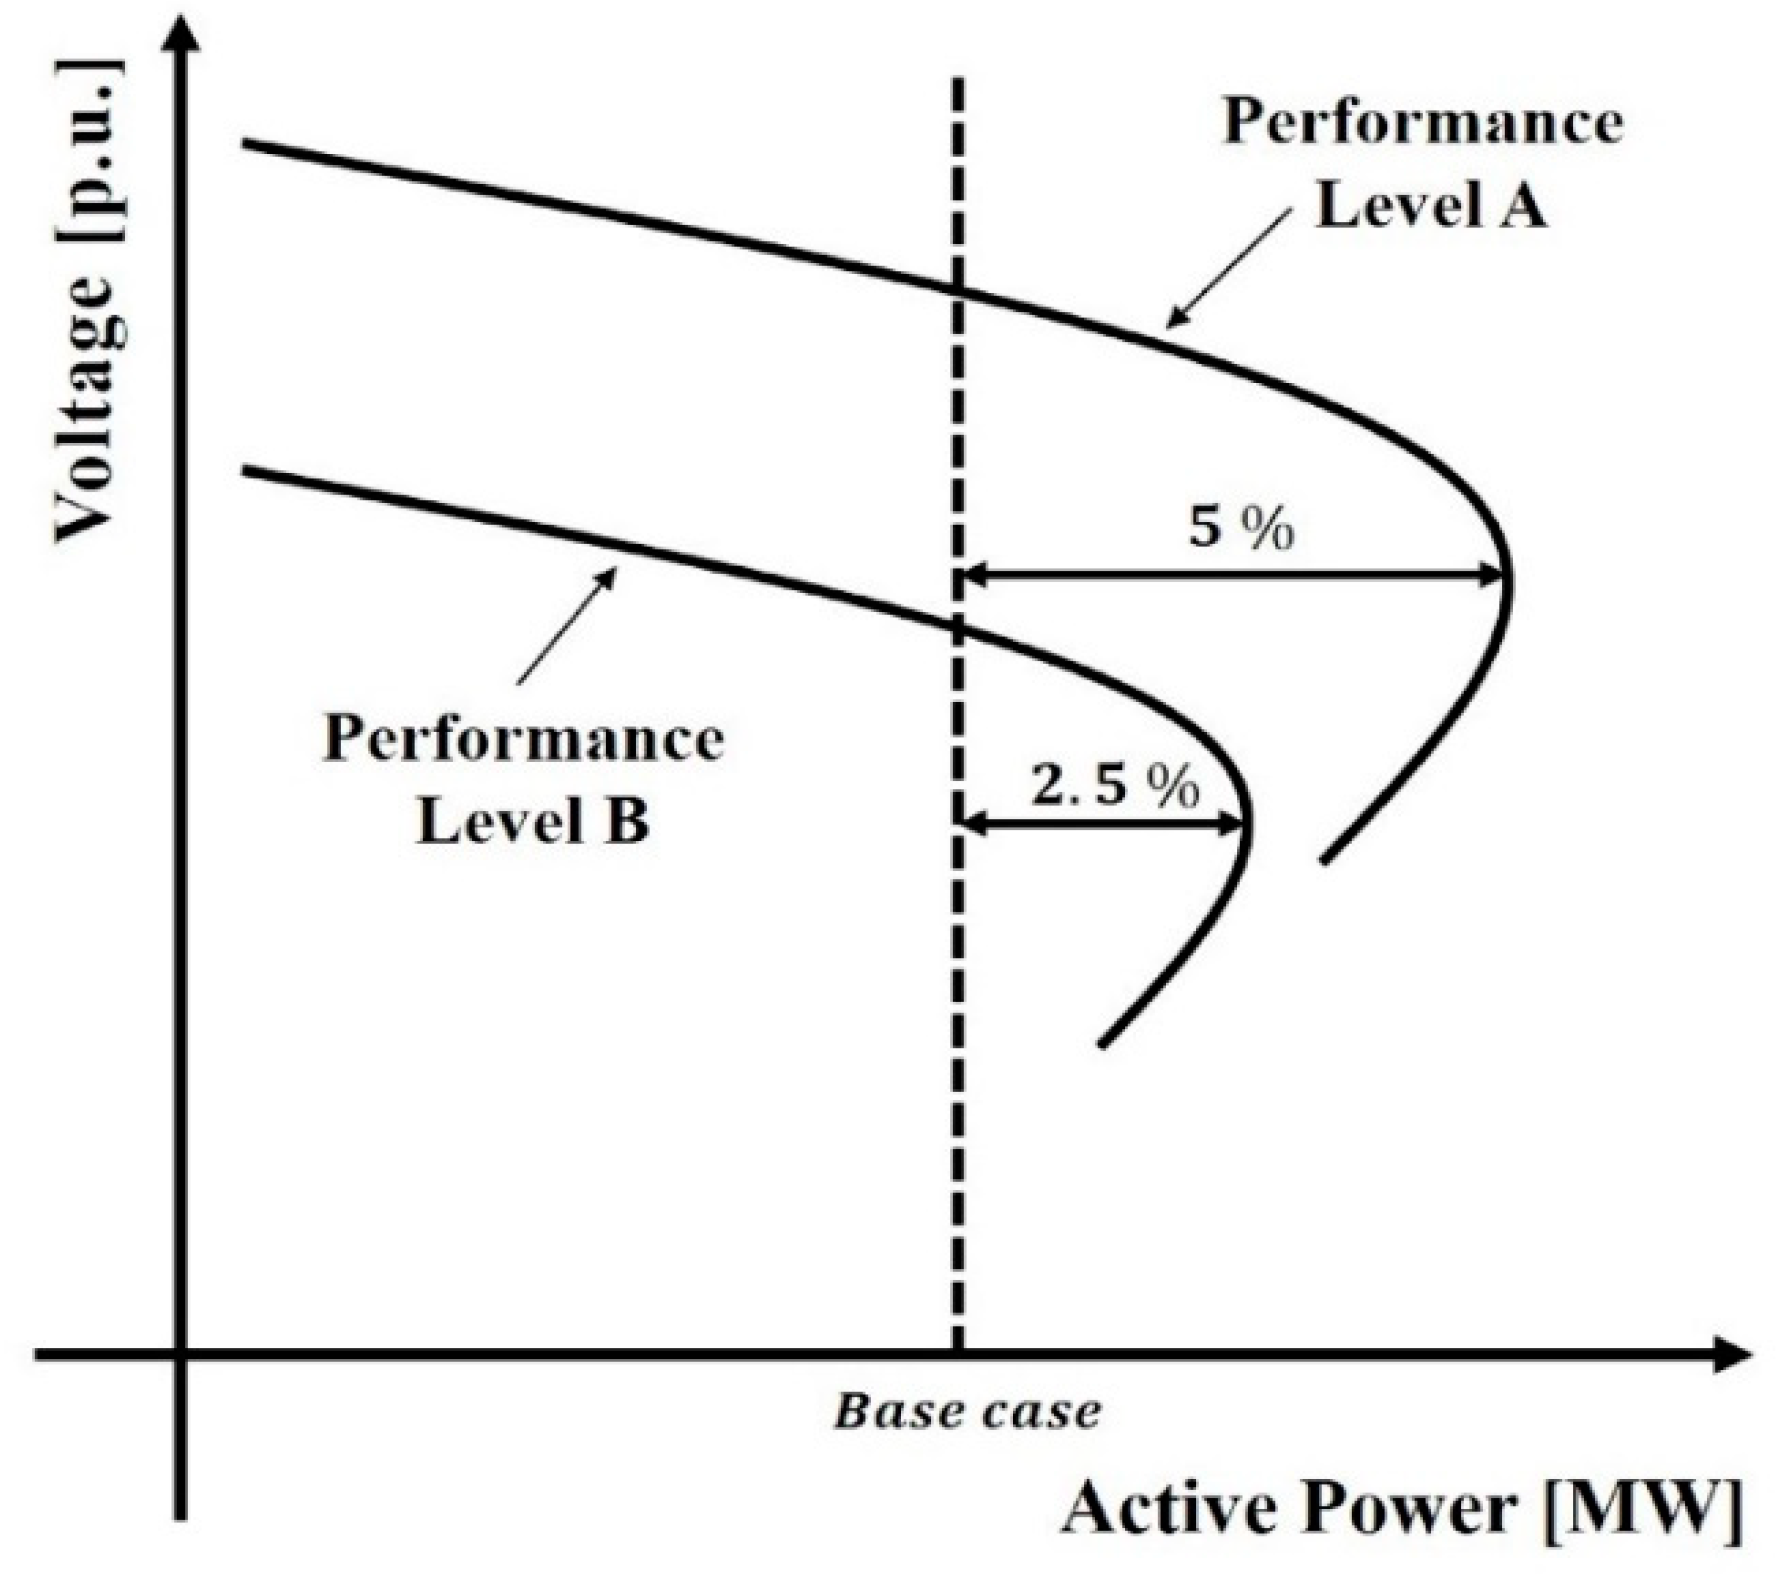
In this section, we describe the configuration of a methodology for voltage stability analysis. The analysis method is based on previously developed techniques [20,24,28,29]; however, it goes further to undertake extensive dynamic reactive power compensation based on characteristic IM loads. The two main features of this method are the use of steady-state analysis and time domain simulations. Initially, PV analysis was performed to assess the voltage stability margin of the Korean power system under various contingencies. PV analysis can be used to establish the actual system load-serving capability by plotting voltage versus increasing load. This method is used as a screening tool for determining the voltage stability limit of the system based on the criteria of the Western Electricity Coordinating Council (WECC) [37]. In the WECC, criteria are presented as a procedure available for determining voltage stability limit under a fixed load condition. To consider uncertainty, the required margins for performance levels are specified; in this paper, the minimum required margins on the WECC voltage stability criteria are used. In addition, a procedure for evaluating the secure operating limits of voltage stability is established. Figure 4 shows the PV curves for margin evaluation at each performance level.
As shown in Figure 4, based on the WECC criteria, two cases of voltage stability analysis are considered. One can notice that the maximum operating point on the P axis must have a MW margin equal to or greater than the values measured from the nose point of the PV curve for each performance level. In this study, it was fixed that the minimum power margin for performance level A, which is the contingency, must be greater than 5%. For performance level B, the minimum margin should be greater than 2.5% [37]. It is to be noted that the performance level should not cause voltage collapse within the limits of the study.
In the next step, we employed QV analysis to determine the control actions necessary to overcome violations of the voltage criteria. The purpose of this analysis is to determine the region of reactive deficiency in terms of reactive power for the severe contingencies determined through PV analysis. Additionally, QV analysis is used to identify the required amount of reactive power compensation. Figure 5 represents the QV curve for determining the reactive power margin.
From Figure 5, it can be inferred that the reactive power margin can be calculated using the QV curve, which defines the amount of reactive power that can be consumed by the bus. When a fault occurs, the reactive power margin of the bus should be maintained at a level sufficient to meet the criteria. Therefore, it is possible to calculate the reactive power margin on each bus for serious faults, so that the bus or area with a low reactive power margin can be determined as the reactive power vulnerable site. To this end, a VQVI margin vulnerability index can be used to identify vulnerable areas. VQVI considers the changes in the reactive power margin before and after the contingency and can be expressed as follows.
When a severe contingency occurs, it might be difficult to analyze systems using general power flow equations as the solutions are not valid after a contingency. Therefore, a branch-parameter continuation power flow method is used to the restore power flow solvability in unsolvable contingencies based on a continuous power flow. The branch parameter is multiplied by the series and shunt admittances of the branch. The BCPF can trace the power flow solution, in which the state of the branch moves from a pre-contingency state to a post-contingency state by changing the parameter from zero to one [24]. This method represents the YV analysis described in this investigation. Figure 6 shows two cases of YV curves with contingencies.
In Figure 6, one can notice that the branch parameter = 0 is in service and = 1 is out of service. These branch parameter variation curves represent stable and unstable cases, respectively. If the value of cannot reach one, as described in case 2, a control action is needed for power flow convergence. To determine the sensitivity of adequate injection VAR for reactive power compensation strategies is calculated at the nose point in the YV curve. Sensitivity information is divided into active power and reactive power. This study utilizes sensitivity to reactive power, which is influenced by changes in the voltage. The sensitivity can be calculated as
where is the reactive power at load bus and is the branch parameter. With this information, the most efficient load bus for restoring the voltage can be selected. The reactive power reserves of the VAR compensation resources are determined at the point of convergence of the power flow equations. Thus, if the remaining flows can be shifted to other branches using reactive power compensation, the power system might be restored.
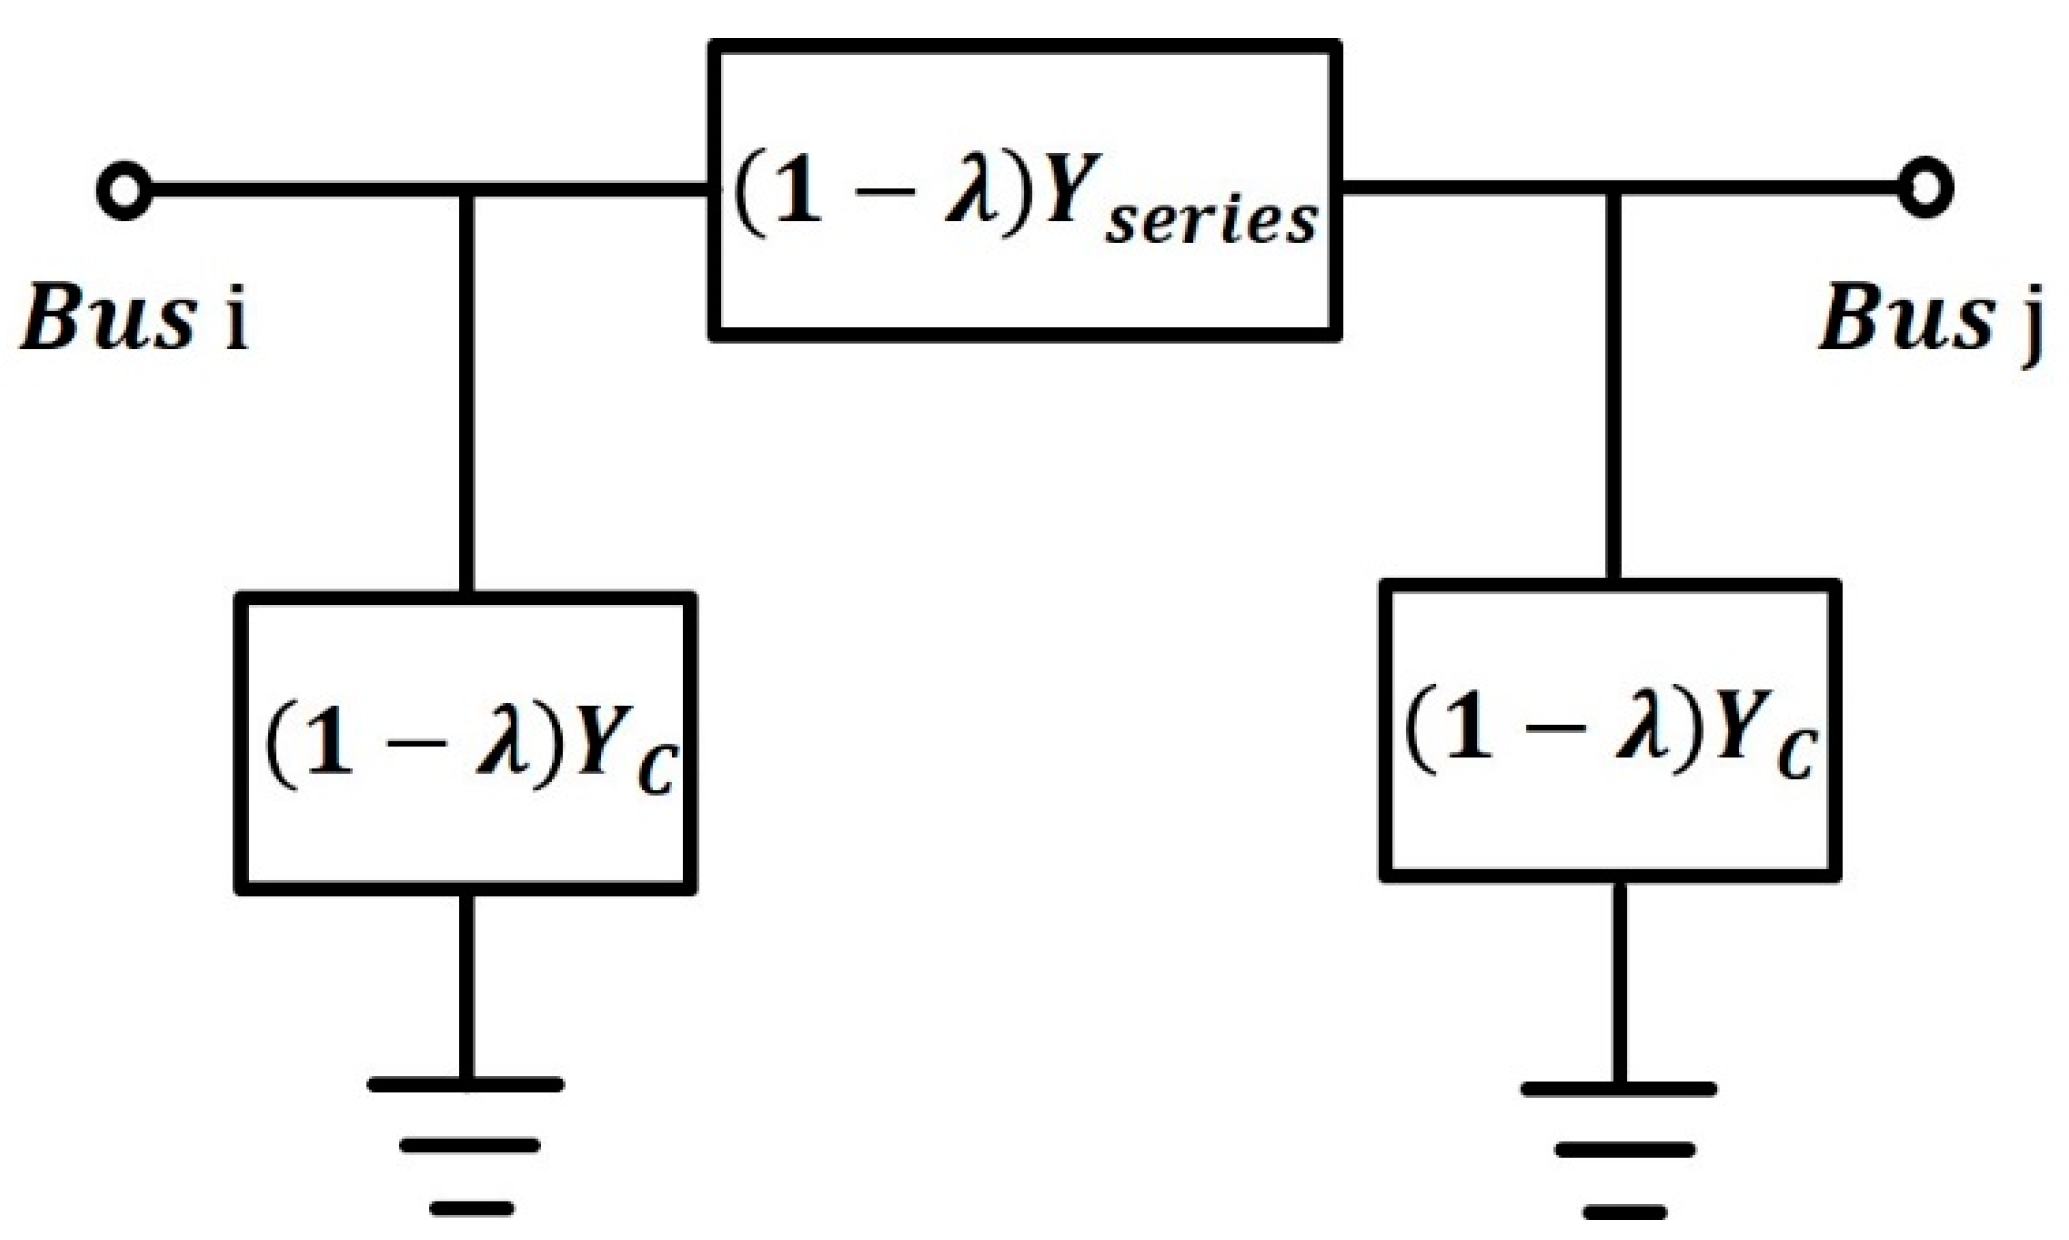
In the unsolvable case, the YV analysis can trace the power flow solution depends on the variations of transmission line parameter via continuation when a power flow solution does not exist after the branch outage [24]. The parameterization of the branch can be depicted as a π-equivalent circuit, as shown in Figure 7.
Figure 7 indicates that parameter is incorporated into a power flow equation to implement the branch parameter variation. If the branch of bus to is in an outage state, the active and reactive power flow from bus to bus can be
where , , and , are the admittances of the removed branch. As the continuation parameter increases, the system gradually closes to the power system with branch outages from pre-contingency systems. When is zero, the original power flow equations are obtained. When reaches one, the new power flow equations that represent the network with the branch totally removed is obtained. This method comprises a predictor and a corrector, and the BCPF uses an augmented Jacobian matrix. The augmented Jacobian used in the BCPF can be expressed as
where and represent the injection of the active and reactive power, respectively. Meanwhile, is chosen to remove the ill-conditioned problem from the singularity. Further, is the number of voltage-controlled buses. As shown in Equation (5), , and are augmented from the original power flow Jacobian matrix.
Using these characteristics, the BCPF can determine whether the cause of the divergence problem is unsolvable. The following is a sensitivity analysis procedure for applying the BCPF application to obtain a solution.
- Step 1:
- Solve the power flow and perform the YV analysis for specific contingencies that are determined by a preliminary study.
- Step 2:
- The BCPF is applied to select the unsolvable contingencies in the list.
- Step 3:
- Determine the reactive power reserves and reference voltages of the buses for converging.
- Step 4:
- In order to find effective buses for reactive power compensation, a sensitivity analysis is then performed.
- Step 5:
- Perform the sensitivity analysis of each buses where the FACTS devices are installed.
Load buses with large participation factor values have more influence in contributing to the voltage instability. Consequently, these buses can be regarded as best candidate location for determining the injection to enhance system voltage stability.
Finally, this study attempted to determine the most severe contingency and voltage-vulnerable areas through static analysis and detailed time simulations for verifying the reduction in FIDVR. Usually, transient load characteristics are more sensitive to voltage than steady-state load characteristics. To address FIDVR issues, in this study, the power system dynamic performance is evaluated against typical transient voltage criteria according to the WECC and NERC planning standards. The criteria imposed on the transient voltage dip are summarized in the following sections and will be used to illustrate the proposed reactive power planning approach. Figure 8 shows the voltage performance parameters with respect to the transient voltage dip criteria [37].
As shown in Figure 8, the post-fault transient voltage performance is expected to meet the following criteria.
- The post-fault transient voltage dip or overshoot should not exceed 25% at the load buses or 30% at the generator buses; it should not exceed 20% for more than 20 cycles at the load buses.
- The post-transient voltage deviation should not exceed 5% at any bus.
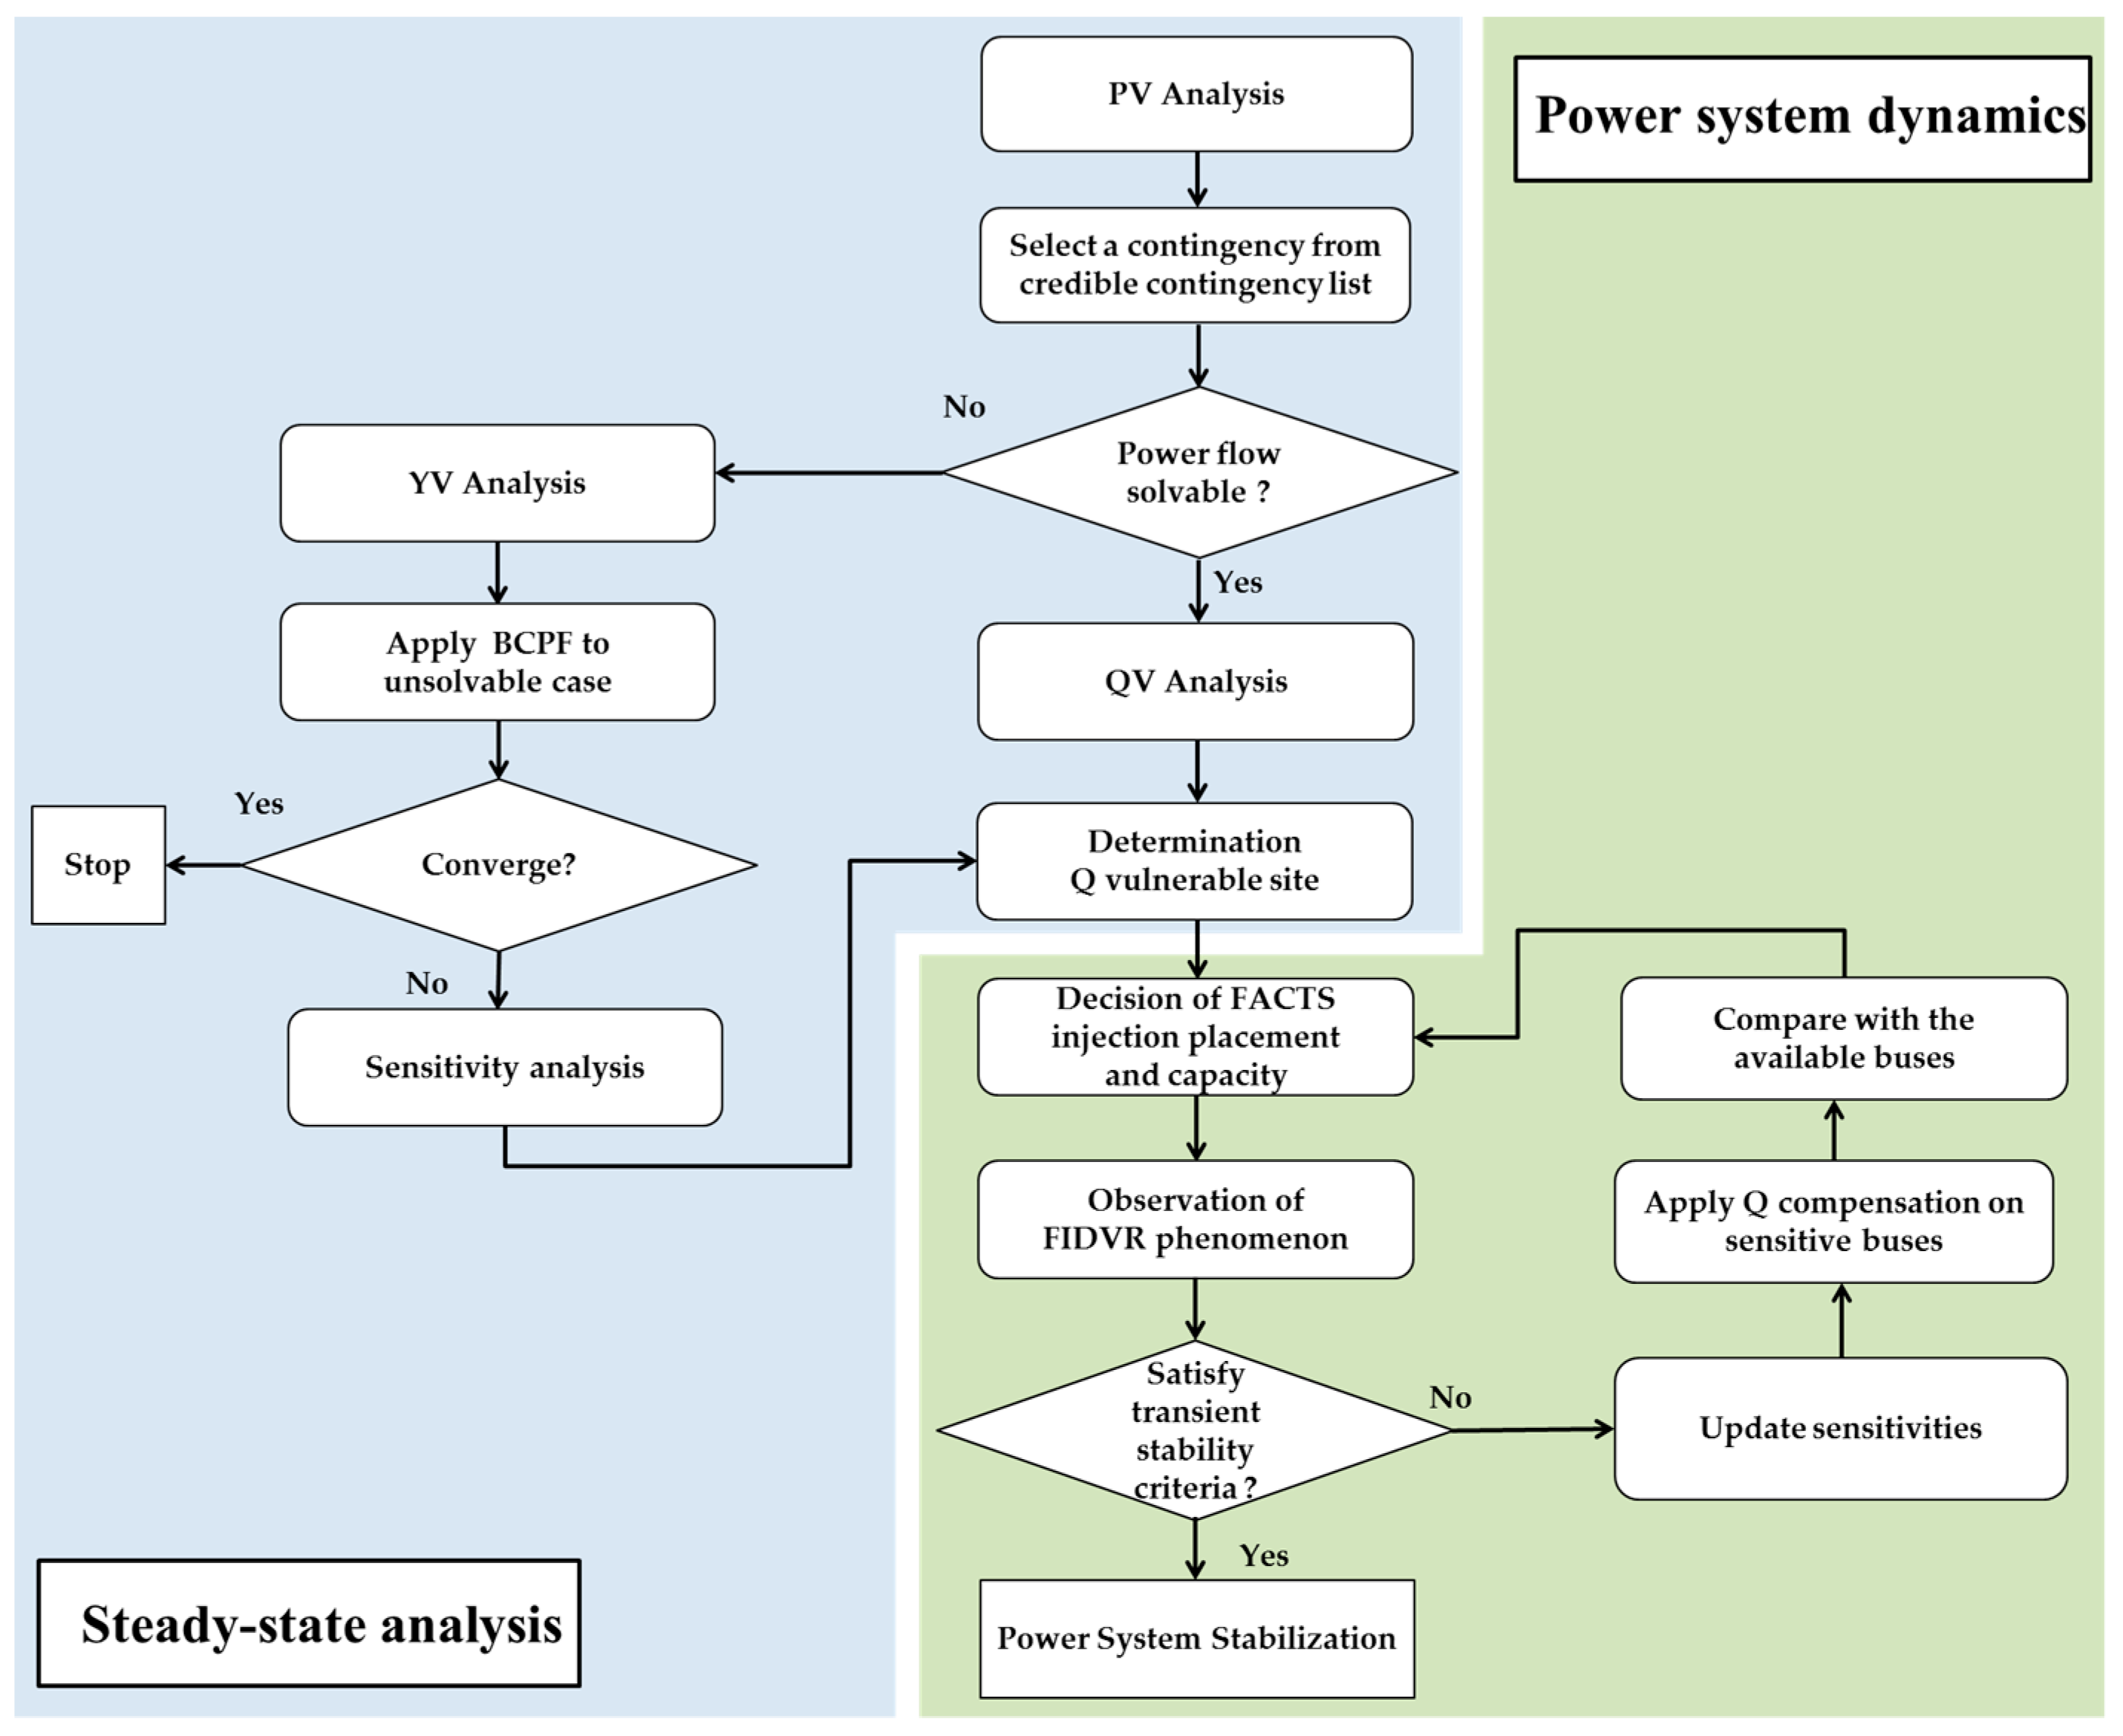
From Figure 8, the post-fault transient voltage performance is expected to meet criteria, namely: FACTS is an effective technology to mitigate transient voltage dip by providing dynamic VAR support for reactive power compensation. This study focuses on identifying the most effective locations and determining the capacity of FACTS so that the transient voltage dip criteria are satisfied for mitigating FIDVR. To accomplish this task, analysis of the transient voltage recovery of the Korean power system was conducted according to the above described standards. Figure 9 shows a flowchart of the employed voltage stability analysis and assessment method.
3. Results and Discussion
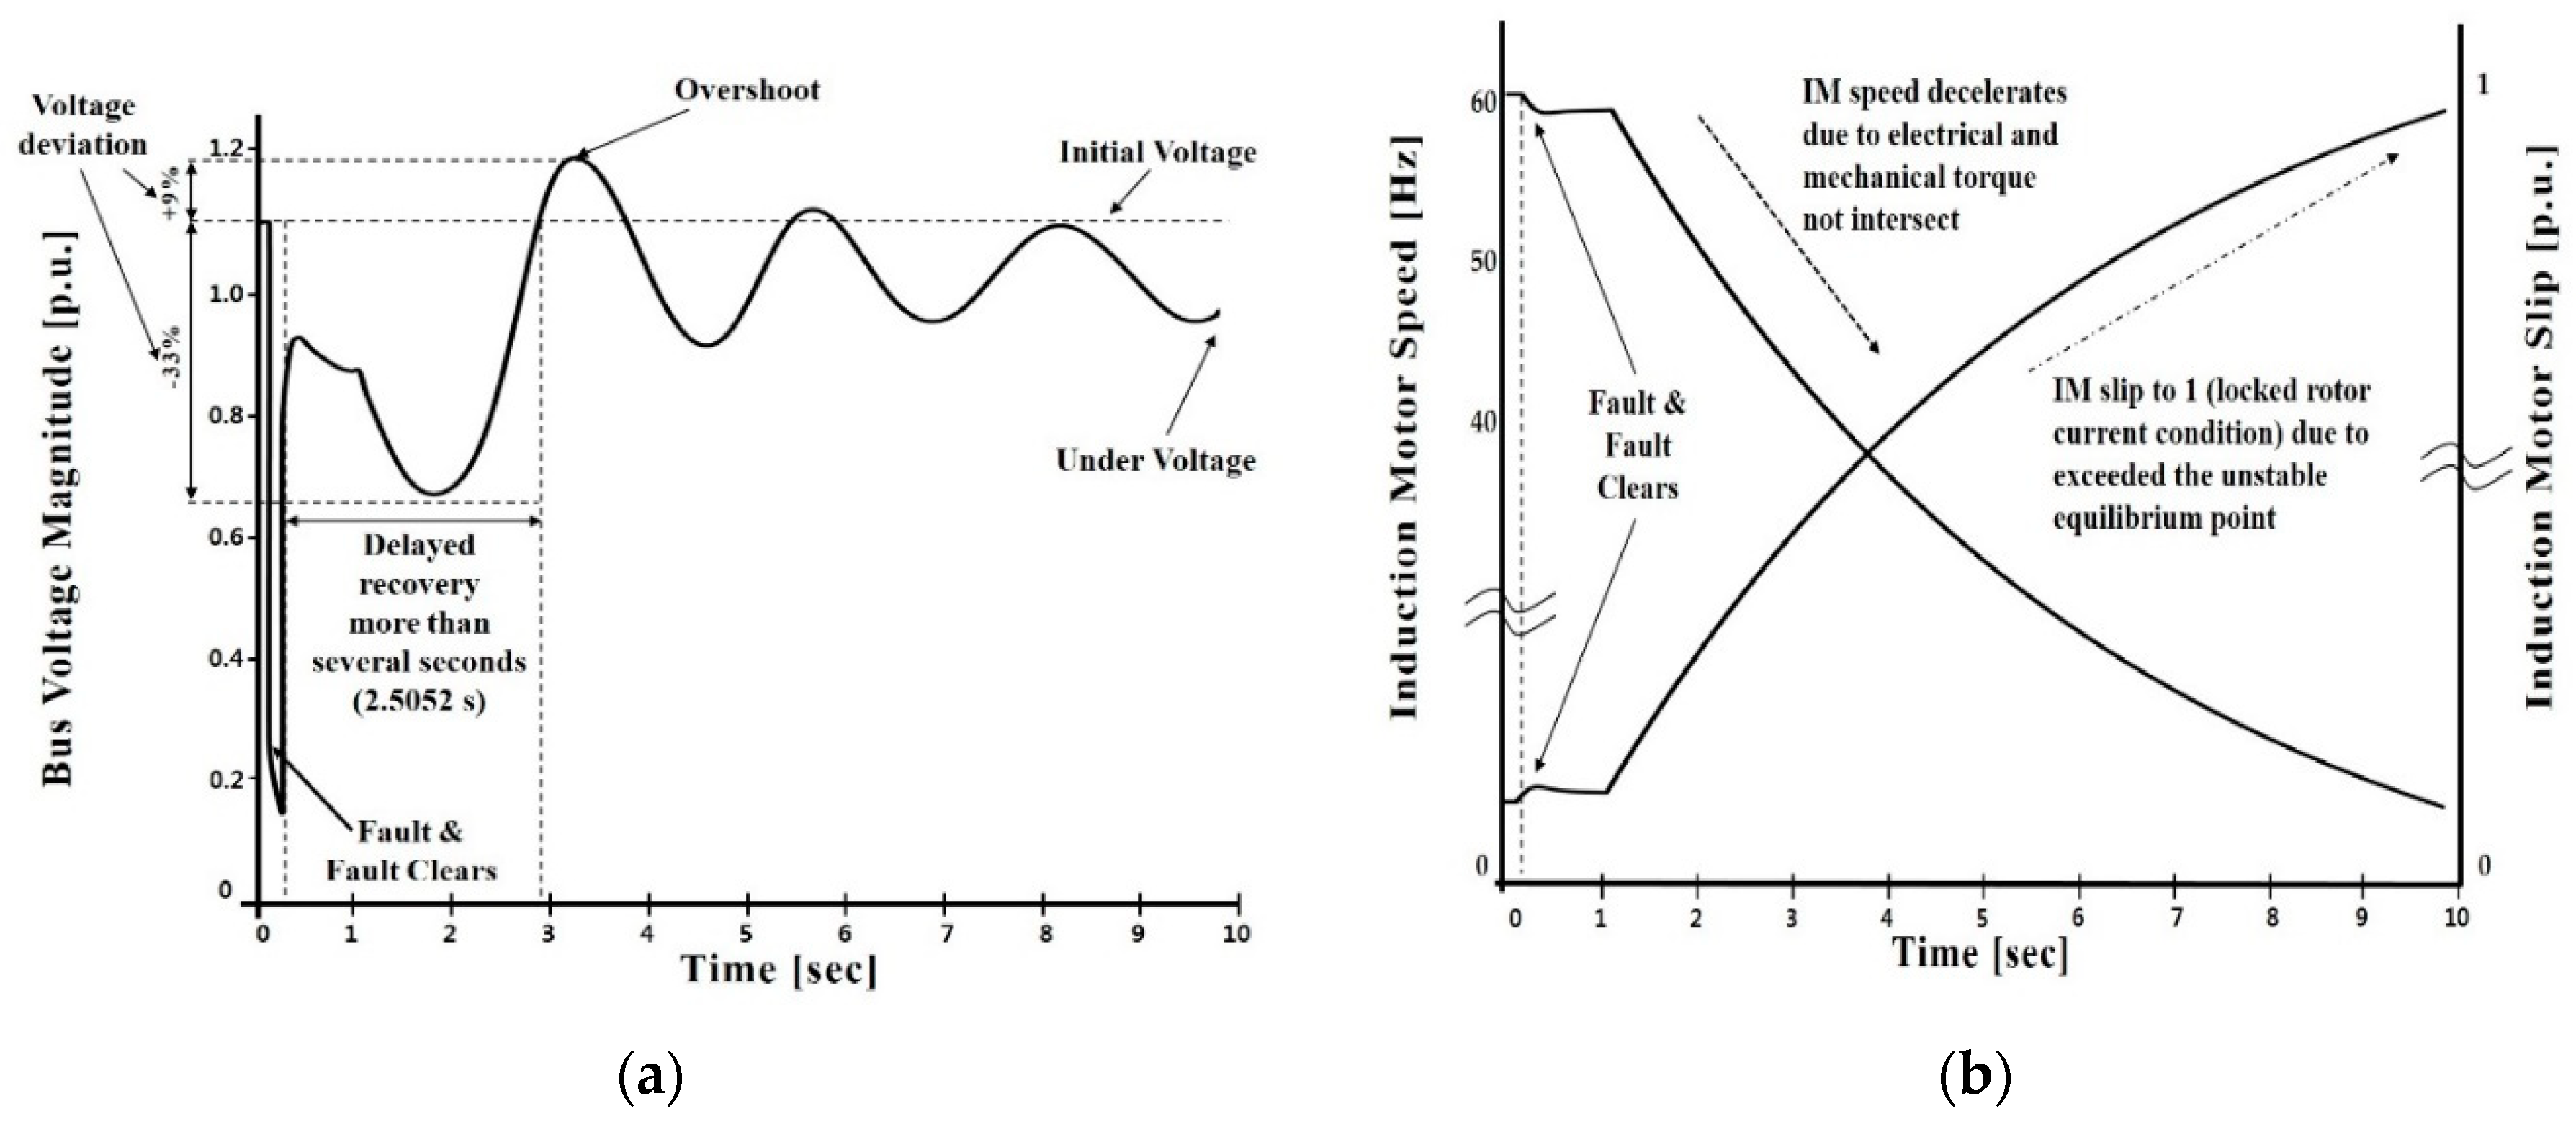
This section describes the results of voltage stability analysis in the Korean power system. Steady-state and dynamic studies were performed based on the proposed methodology. The Korean power system has the following distinct features: (i) concentration of load demand in the metropolitan region; (ii) major generating plants located in nonmetropolitan regions; and (iii) environmental regulations and land for constructing new facilities, such as transmission lines. Due to these geographical characteristics, six interface lines are operated to supply power to the metropolitan area from non-metropolitan areas. System operators in the Korean power system are always concerned with the lack of a reactive power reserve in the metropolitan area for an interface flow [38]. Under these circumstances, when a serious fault occurs in interface lines, a region with a high proportion of IM loads might significantly increase the VAR demand during voltage recovery. However, external reactive power cannot be sufficiently delivered to the IM load-concentrated region through long-distance transmission lines. As a result, the system might experience STVS problems. Unless immediate countermeasures are applied, this leads to a FIDVR phenomenon. Figure 10 shows a bus voltage profile without a countermeasure.
After the fault occurs, the voltages of the load buses drop immediately. Without a countermeasure scheme, the bus voltage cannot be recovered to its normal value after fault clearance. From Figure 10, the following observations can be made:
- (1)
- The IM loads absorbed much more reactive power after the fault. Consequently, voltage instability occurs following a severe fault.
- (2)
- Motor speed recovery is closely related to voltage recovery. If the speed cannot be recovered after clearing the fault, the motors will absorb much of the dynamic VAR.
- (3)
- The slip characteristics depend on the mechanical and electrical torques. When the mechanical and electrical torque do not equal each other, the slip moves to 1 as the equilibrium point is exceeded.
Here, the current under voltage load shedding (UVLS) scheme operated in the Korean power system is reviewed. The UVLS scheme is a demand-side solution that accomplishes the stabilization of the system by shedding the pre-defined loads in the case of a severe contingency as an event-based special protection scheme (SPS). However, the current UVLS system has a time delay between the activation and the actual load interruption. When the load shedding is delayed, it might not alleviate the FIDVR phenomenon. In addition, the UVLS system is forced to shed the pre-defined loads as the last resort, possibly resulting in an inconvenience for the end-use consumer. Therefore, in this paper, a scheme is proposed to utilize the dynamic reactive power resources to mitigate the FIDVR phenomenon. The comparison results of the bus voltage recovery for an existing scheme and the proposed scheme are shown in Figure 11.
Figure 11 indicates that the FDIVR phenomenon occurs even when the existing scheme is applied. This is attributed to the reactive power consumption of the motor load being increased dramatically as the voltage level falls to the limit value in the case of delaying the load shedding caused by the communication delay. On the other hand, it can be seen that the voltage is recovered when the proposed scheme is applied. It is noted that FACTS could have a positive effect on delayed voltage recovery owing to the induction motor power consumption characteristics. This paper presents the analysis associated with the design and application of the dynamic reactive power control strategy in case studies based on the practical system. It is desirable that FACTS devices need be installed in metropolitan areas with adequate amount of reactive compensation, because the FACTS system has a small footprint and requires less outdoor equipment. The placement of the most important buses, in terms of voltage stability, are determined through the proposed methodology. Furthermore, the system load condition corresponding to peak winter is applied in the case studies. As for the IM load, the above-mentioned (in Section 2) load model is adopted. In the simulation, IMs are used to represent inductive loads. For FIDVR events, it is assumed that IM loads have a composition proportion of 30% in the dynamic analysis based on the statistical system [30]. In this simulation, two case studies, solvable and unsolvable, are considered. The results of the two cases are described in detail in the following subsections.
3.1. Case 1: Performance Level A
First of all, in order to assess the vulnerable areas, a contingency list was derived using PV analysis. In the WECC criteria, the voltage stability analysis included in the PV and QV analysis. Through the using concept, this paper reports a study of voltage stability limit in the metropolitan region and the neighboring region in the Korean power system [38]. In the PV analysis associated with this study, the minimum active power margin for performance level A shall be greater than 5% under the contingency. The credible contingency sets to be applied in this simulation are all double circuit outages of 345 kV and 765 kV lines. Among them, the results of the six worst contingencies are shown in Table 1.
From Table 1, it can be seen that the voltage stability limit of % margin corresponding to No. 2 in the contingency list corresponds to performance level B; therefore, it might be regarded as the most serious failure. The remaining situations correspond to performance level A; the % margin of contingency No. 3 was the lowest. Therefore, No. 3 was considered as a solvable case and simulated. Further, reactive power reserve calculation for No. 3 was performed based on the VQVI margin vulnerability index. The results are shown in Table 2. These results are related to the capability of maintaining voltage stability on individual load buses and they can be used to identify vulnerable areas in the system.
From the data in Table 2, one can infer that the northern metropolitan area includes vulnerable sites. In No. 3 outage, the critical contingencies that influence the stability of the northern area are the route lines between 1300 and 3300. Figure 12 shows the shows the diagram of the metropolitan region.
As shown in Figure 12, the metropolitan region is largely divided into eastern, western, and northern areas. In addition, generators are aggregated in the western area. In substation 1300, active and reactive powers are supplied from 3150 C/C before faults (i.e., outages between 1300 and 3300, occur. When the fault occurs, the 1300 substation would be at the end of a load. For this reason, the 1300 substation might have problems of insufficient reactive power supply. Thus, this area needs reactive power sources because plenty of power is supplied through the interface line in the eastern and southern areas. Thus, it is concluded that FACTS devices should be installed at 1400, 1300, 1700, 2500, and 3300 to counter the FIDVR phenomenon.
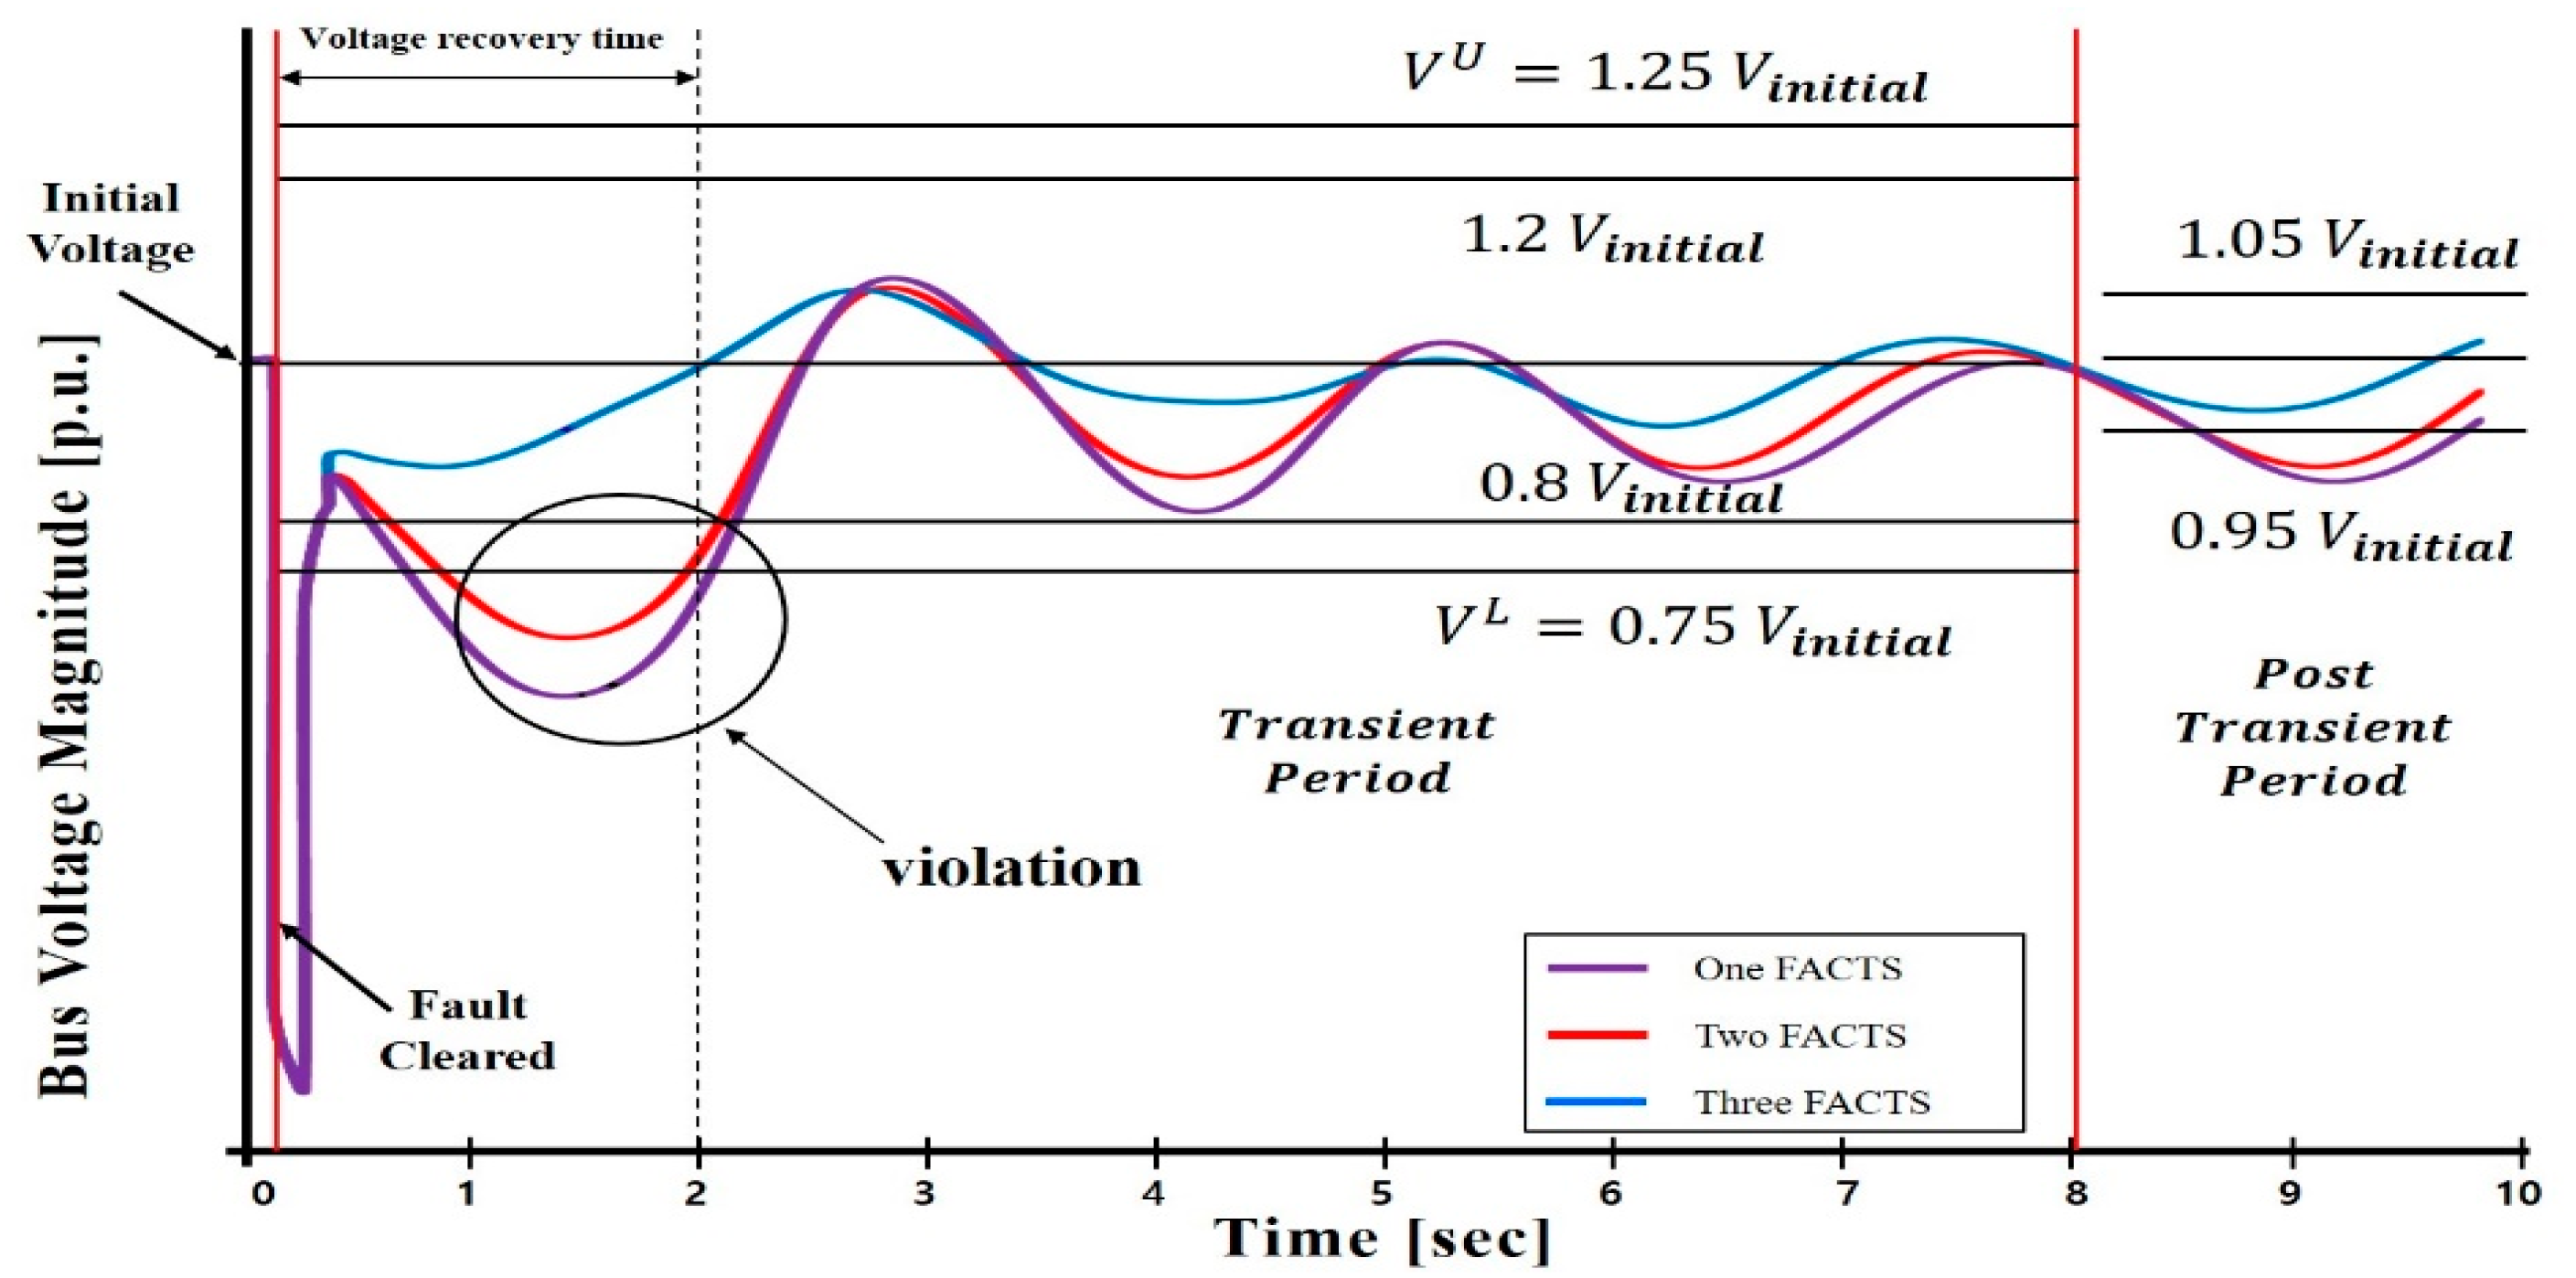
Using the above results, a transient stability analysis was performed to verify the STVS. The objective of the dynamic simulation is to establish appropriate dynamic VAR supports to satisfy the voltage criteria. FACTS device placement determined based on the QV analysis is shown in Table 2. Ten candidate buses were chosen to install the FACTS devices, which were installed in the order of ranking to observe whether the voltage was recovered or not. As the typical size of a FACTS device installed in the transmission level is 300 MVAR, the dynamic VAR support source capacity limit is set at 300 MVAR. The post-fault voltage trajectories of the buses are shown in Figure 13.
From Figure 11, one can notice that the transient voltage criteria are satisfied when three FACTS devices are installed. If only one or two FACTS devices are installed, the FIDVR event caused by an insufficient reactive power support cannot be resolved. Therefore, it was decided that the FACTS devices should be installed at 1400, 1300, and 1700 to mitigate the FIDVR phenomenon.
3.2. Case 2: Performance Level B
The proposed reactive power compensation strategy has also been applied to No.2 on the contingency list in performance level B. As mentioned earlier, contingency No.2 represents the most severe outage. For performance level B, corresponding to the bus section representing contingency, the minimum margin should be greater than 2.5%. This means that a 2.5% margin on the PV analysis is required for the worst-case performance level B disturbance cases. The 2.5% is based on the load level measured at the voltage collapse point. Therefore, the proposed method based on BCPF was applied to verify the unsolvable case. To identify effective buses for reactive power compensation, a sensitivity analysis was then performed at the critical point of the YV curve using the participation factor calculated for the load buses. The results of sensitivity analysis are shown in Table 3.
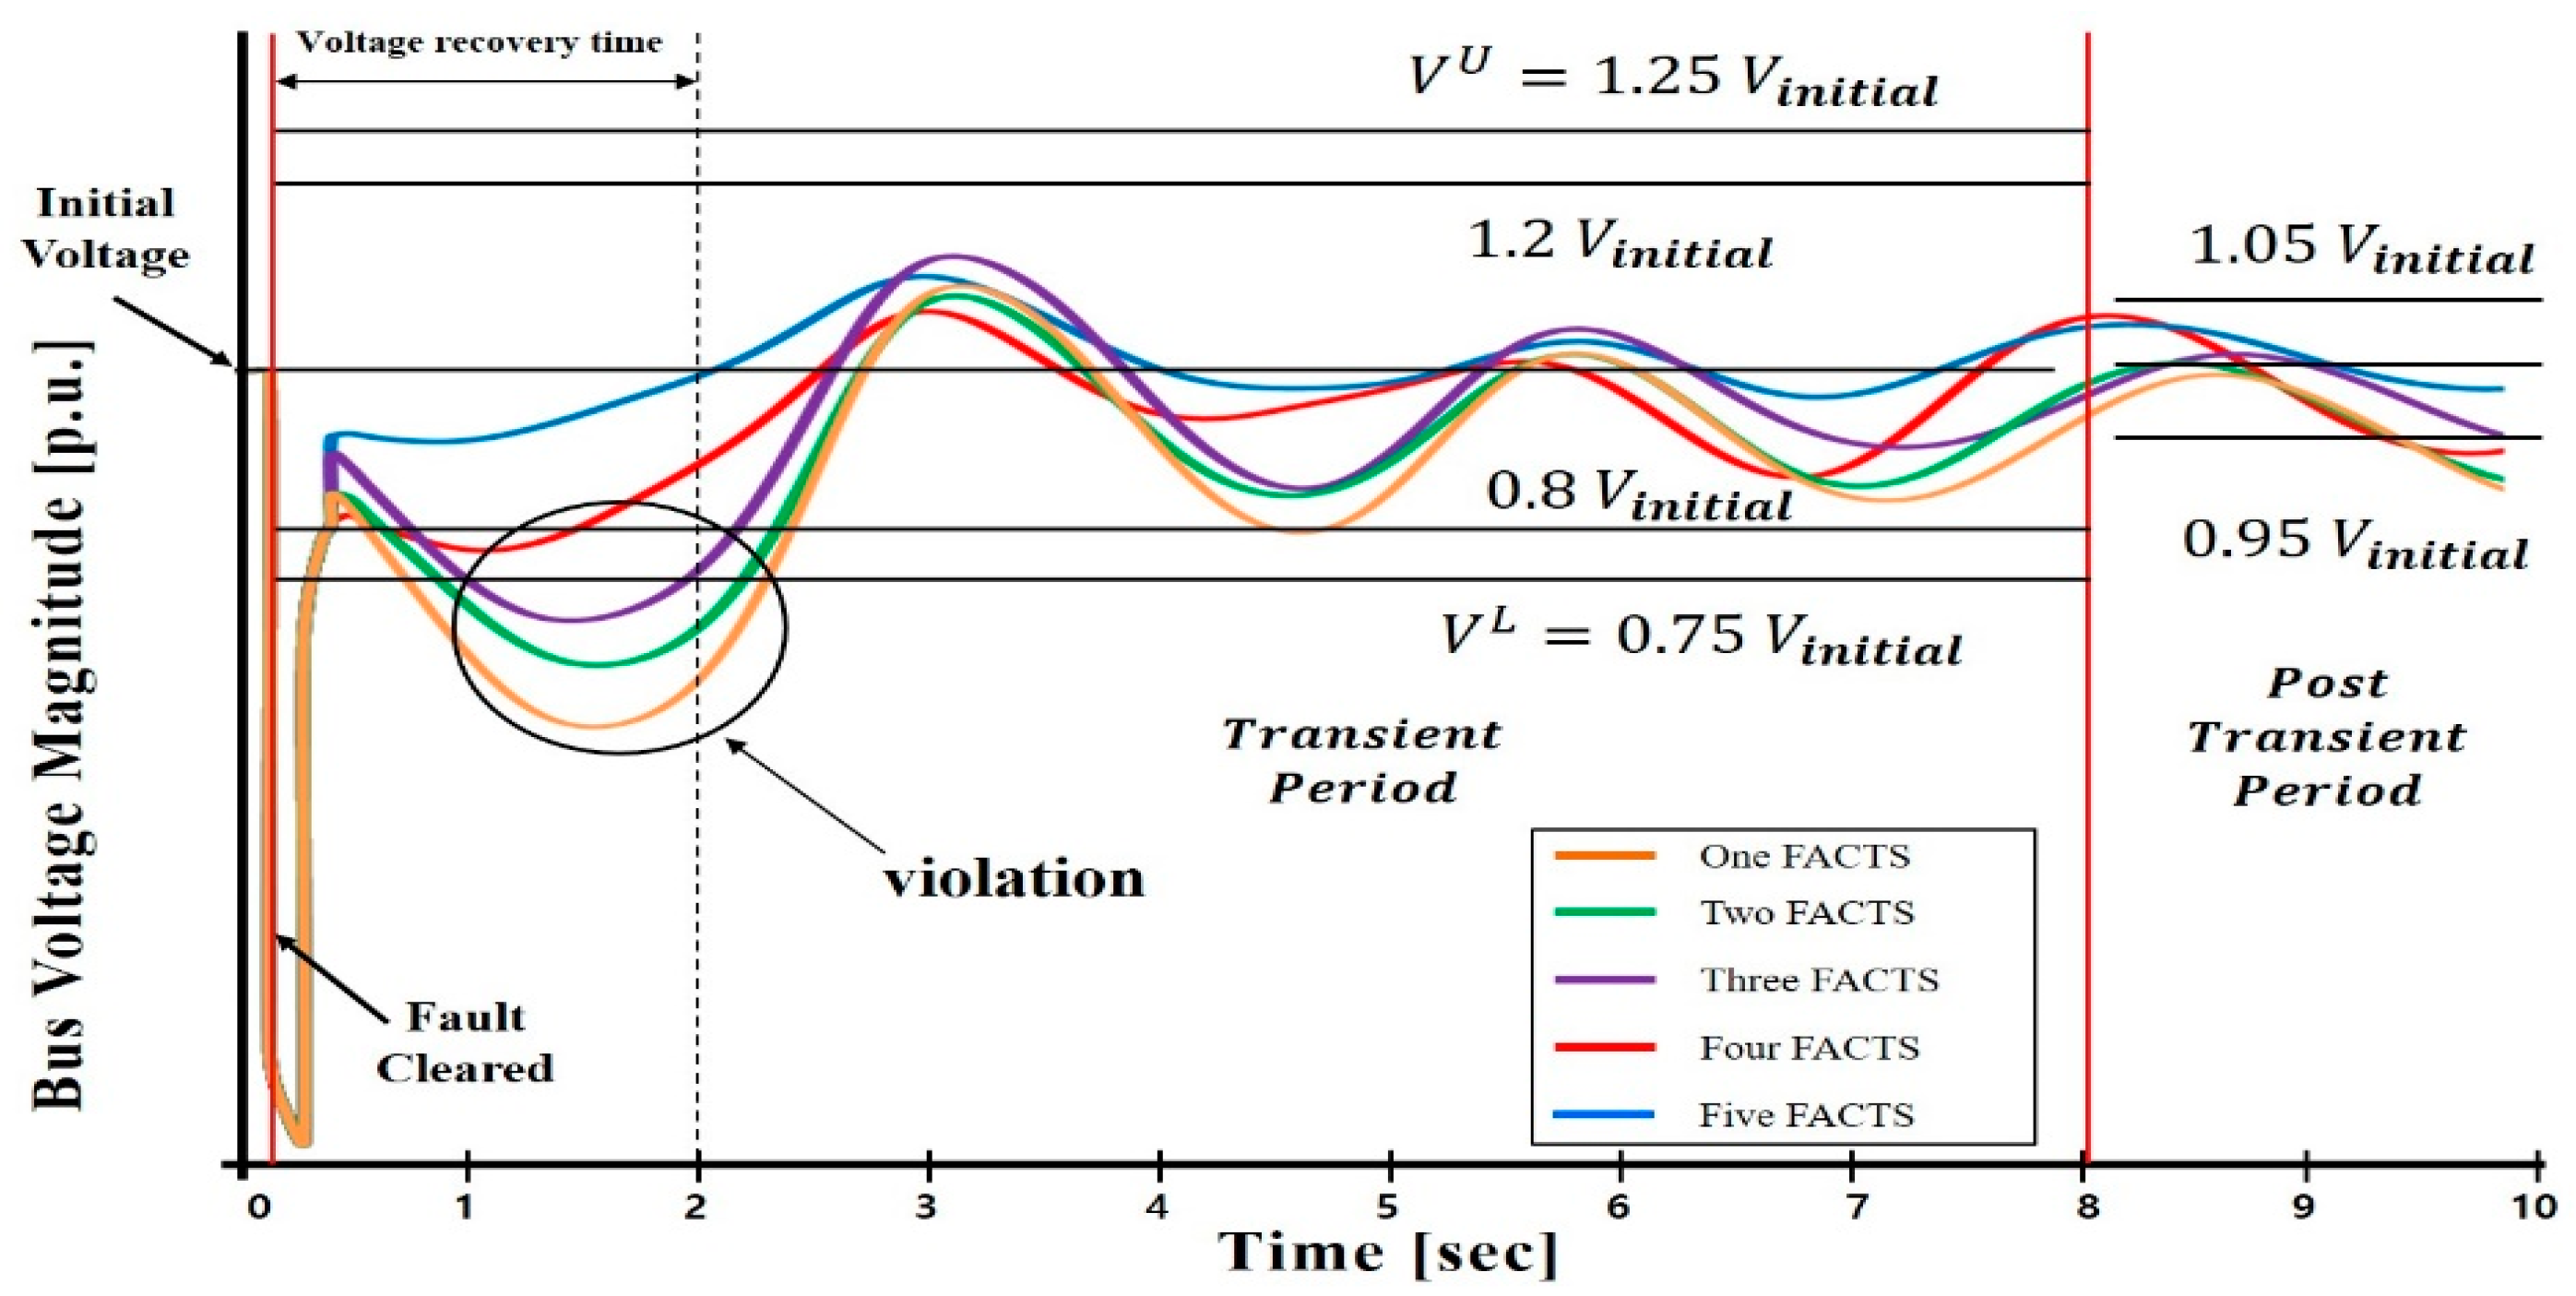
From Table 3, one can observe that the eastern metropolitan area consists of vulnerable sites. In the Korean power system, when the most severe 765 kV transmission line fault occurs, power flow takes a roundabout way to the nearby lines. When a large amount of power is concentrated in the power transmission line, voltage instability occurs. In addition, the dynamic nature of IM loads is the same as imposing a heavy demand for fast-responding reactive power resources under low-voltage situations. This leads to secondary effects, such as FIDVR, which further exacerbates the problem. The transient voltage dip and slow voltage recovery issues might be addressed by fast-responding dynamic VAR resources. Candidate buses are considered for selecting the locations of reactive power compensation in order to finalize the space and geographical location to install FACTS devices. For dynamic assessments, the above-mentioned performance criteria should be followed. Figure 14 shows the voltage responses of buses under contingency conditions after FACTS installation.
It can be seen in Figure 14 that the time domain simulations are run by applying a fault. To address the delayed voltage recovery caused by IM stalling under post-fault voltage trajectories, the voltage criteria are met using five FACTS devices. When four or less FACTS devices are installed, the FIDVR phenomenon cannot be mitigated due to insufficient VAR support. Therefore, it was concluded that the FACTS devices should be installed at 2700, 4500, 2500, 4700, and 4650 to mitigate the FIDVR phenomenon.
3.3. Discussion
The results of the stability analysis identified the areas vulnerable to FIDVR and the candidate buses for most effective actions have been proved; the participation factors evaluated could provide the valuable information on the adequate FACTS application against FIDVR. In addition, from the bus and branch participations, remedial actions to improve the overall system voltage stability could be decided. The above-mentioned results can be summarized in Table 4. From these results, one can notice that the number and placement of FACTS devices to quickly recover voltage depends on the performance level. In addition, dynamic voltage recovery times for two FACTS implementation cases are obtained for the comparison purposes.
In Table 4, it is indicated that when the system voltage is restored up to 0.8 p.u. within 2 s, and that FIDVR can be properly mitigated. For Case 1, the voltage was recovered within 2 s when three FACTS were applied. For Case 2, the voltage was recovered within 2 s when four FACTS were equipped, but the transient voltage dip criteria were not satisfied, and hence FDIVR cannot be adequately alleviated. It can be seen that a five FACTS application is required to mitigate the FIDVR.
In Case 1, when the fault occurs, it is seen that reactive power cannot be supplied to the northern metropolitan area from 3150 CC. For this reason, it is effective to inject FACTS directly into 1400. FACTS should also be installed on buses 1300 and 1700 that supply power to the metropolitan region. In Case 2, it is seen that FACTS injection directly on buses 4700 and 4650 is effective. In addition, it could be confirmed that it is effective to inject FACTS at 2700, 4500, and 2500 to increase the supply of reactive power in the eastern area. It is seen that the system voltages can be successfully maintained against this voltage instability scenario by five FACTS placed by the proposed methodology. Figure 15 shows the FACTS locations for improved voltage stability in a metropolitan region for the two cases.
Figure 15 shows that the FACTS control is reasonably performed to help maintain proper voltage regulation in metropolitan areas, especially for the critical contingency. As indicated by the above results, the information of bus participations can help determine the placements of FACTS, and the branch participations can be used to identify candidate lines for series compensations. This has been demonstrated in actual system studies, as in the discussion.
4. Conclusions
This paper presents a new framework on the reactive power compensation strategy designed based on voltage stability analysis. The framework adopts the conventional analysis of active and reactive power margins to decide the critical contingencies and the areas of reactive power deficiency. This paper adopts not only steady-state analysis but also dynamic time-domain simulations for the adequate amount of dynamic reactive power support. There also might be a limitation of only covering solvable cases using the conventional analysis, but this paper adopts the sensitivity analysis for unsolvable cases using the branch parameterized continuation power flow. For adequate compensation strategies, vulnerable buses as compensation locations must be carefully chosen in terms of voltage stability. The case study results demonstrated that the compensation level decided by the proposed method could mitigate the FIDVR caused by IM loads. In addition, the proposed method might be applied for determining the optimal number and placement of FACTS devices to resolve the FIDVR. By the performance assessment, the alleviating impacts of dynamic VAR compensation on the FIDVR phenomenon can be observed. Consequently, the dynamic support of reactive power could enhance the STVS. The contributions of this paper can be summarized as follows:
- This paper proposed an approach to deciding the appropriate reactive power compensation, considering the FIDVR problem. The proposed scheme can provide proper remedial actions in a reliable manner for various post-disturbance conditions.
- The approach proposed in this paper solved the optimal dynamic VAR allocation problem by systematically interfacing power system time-domain simulation.
- This strategy might further help explore and deploy more availability options when the desired injection amount fits VAR resource options for unsolvable cases.
Author Contributions
Y.L. conceived and designed the research, conducted static and dynamic simulations, and wrote the paper. H.S. improved the theoretical part and supervised the research.
Funding
This research received no external funding.
Acknowledgments
This research was supported by the Human Resources Development of the Korea Institute of Energy Technology Evaluation and Planning (KETEP) grant funded by the Korea government Ministry of Trade, Industry & Energy (20174030201840).
Conflicts of Interest
The authors declare no conflict of interest.
References
- Paramasivam, M.; Salloum, A.; Ajjarapu, V.; Vittal, V.; Bhatt, N.B.; Liu, S. Dynamic optimization based reactive power planning to mitigate slow voltage recovery and short term voltage instability. IEEE Trans. Power Syst. 2013, 28, 3865–3873. [Google Scholar] [CrossRef]
- Glavic, M.; Novosel, D.; Heredia, E.; Kosterev, D.; Salazar, A.; Habibi-Ashrafi, F.; Donnelly, M. See it fast to keep calm: Real-time voltage control under stressed conditions. IEEE Power Energy Mag. 2012, 10, 43–55. [Google Scholar] [CrossRef]
- Williams, B.R.; Schmus, W.R.; Dawson, D.C. Transmission voltage recovery delayed by stalled air conditioner compressors. IEEE Trans. Power Syst. 1992, 7, 1173–1181. [Google Scholar] [CrossRef]
- Taylor, L.Y.; Hsu, S.M. Transmission voltage recovery following a fault event in the Metro Atlanta area. In Proceedings of the Power Engineering Society Summer Meeting, Seattle, WA, USA, 16–20 July 2000; pp. 537–542. [Google Scholar]
- North American Electric Reliability Corporation. Technical Reference Paper Fault-Induced Delayed Voltage Recovery; North American Electric Reliability Corporation: Princeton, NJ, USA, 2009. [Google Scholar]
- Alaqeel, T.A.; Almohaimeed, S.A.; Suryanarayanan, S. A review of air conditioning motor loads stalling on voltage recovery in the saudi electric grid. In Proceedings of the Power Symposium (NAPS), Morgantown, WV, USA, 17–19 September 2017; pp. 1–6. [Google Scholar]
- De Leon, J.D.; Taylor, C.W. Understanding and solving short-term voltage stability problems. In Proceedings of the Power Engineering Society Summer Meeting, Chicago, IL, USA, 21–25 July 2002; Volume 2, pp. 745–752. [Google Scholar]
- Lu, N.; Yang, B.; Huang, Z.; Bravo, R. The system impact of air conditioner under-voltage protection schemes. In Proceedings of the Power Systems Conference and Exposition, Seattle, WA, USA, 15–18 March 2009; pp. 1–8. [Google Scholar]
- Shaffer, J.W. Air conditioner response to transmission faults. IEEE Trans. Power Syst. 1997, 12, 614–621. [Google Scholar] [CrossRef]
- Bai, H.; Ajjarapu, V. A novel online load shedding strategy for mitigating fault-induced delayed voltage recovery. IEEE Trans. Power Syst. 2011, 26, 294–304. [Google Scholar] [CrossRef]
- Wibowo, R.S.; Yorino, N.; Eghbal, M.; Zoka, Y.; Sasaki, Y. FACTS devices allocation with control coordination considering congestion relief and voltage stability. IEEE Trans. Power Syst. 2011, 26, 2302–2310. [Google Scholar] [CrossRef]
- Sapkota, B.; Vittal, V. Dynamic VAr planning in a large power system using trajectory sensitivities. IEEE Trans. Power Syst. 2010, 25, 461–469. [Google Scholar] [CrossRef]
- Farsangi, M.M.; Nezamabadi-Pour, H.; Song, Y.H.; Lee, K.Y. Placement of SVCs and selection of stabilizing signals in power systems. IEEE Trans. Power Syst. 2007, 22, 1061–1071. [Google Scholar] [CrossRef]
- Ghahremani, E.; Kamwa, I. Optimal placement of multiple-type FACTS devices to maximize power system loadability using a generic graphical user interface. IEEE Trans. Power Syst. 2013, 28, 764–778. [Google Scholar] [CrossRef]
- Tiwari, A.; Ajjarapu, V. A computer package for multi-contingency constrained reactive power planning. In Proceedings of the Power & Energy General Society Meeting, Denver, CO, USA, 26–30 July 2015; pp. 1–5. [Google Scholar]
- Huang, W.; Sun, K.; Qi, J.; Xu, Y. A new approach to optimization of dynamic reactive power sources addressing FIDVR issues. In Proceedings of the 2014 IEEE/PES Power Systems Conference and Exposition, National Harbor, MD, USA, 27–31 July 2014; pp. 1–5. [Google Scholar]
- Huang, W.; Sun, K.; Qi, J.; Xu, Y. Voronoi diagram based optimization of dynamic reactive power sources. In Proceedings of the Power & Energy Society General Meeting, Denver, CO, USA, 26–30 July 2015; pp. 1–5. [Google Scholar]
- Wildenhues, S.; Rueda, J.L.; Erlich, I. Optimal allocation and sizing of dynamic var sources using heuristic optimization. IEEE Trans. Power Syst. 2015, 30, 2538–2546. [Google Scholar] [CrossRef]
- Xu, Y.; Dong, Z.Y.; Meng, K.; Yao, W.F.; Zhang, R.; Wong, K.P. Multi-objective dynamic VAR planning against short-term voltage instability using a decomposition-based evolutionary algorithm. IEEE Trans. Power Syst. 2014, 29, 2813–2822. [Google Scholar] [CrossRef]
- Liu, H.; Krishnan, V.; McCalley, J.D.; Chowdhury, A. Optimal planning of static and dynamic reactive power resources. IET Gener. Transm. Distr. 2014, 8, 1916–1927. [Google Scholar] [CrossRef]
- Meliopoulos, A.S.; Cokkinides, G.; Stefopoulos, G. Voltage stability and voltage recovery: Load dynamics and dynamic VAR sources. In Proceedings of the Power Systems Conference and Exposition, Atlanta, GA, USA, 29 October–1 November 2006; pp. 124–131. [Google Scholar]
- Tiwari, A.; Ajjarapu, V. Optimal allocation of dynamic VAR support using mixed integer dynamic optimization. IEEE Trans. Power Syst. 2011, 26, 305–314. [Google Scholar] [CrossRef]
- Di Fazio, A.R.; Russo, M.; Valeri, S.; De Santis, M. Sensitivity-based model of low voltage distribution systems with distributed energy resources. Energies. 2016, 9, 801. [Google Scholar] [CrossRef]
- Seo, S.S.; Kang, S.G.; Lee, B.J.; Kim, T.K.; Song, H.C. Determination of reactive power compensation considering large disturbances for power flow solvability in the korean power system. J. Electr. Eng. Technol. 2011, 6, 147–153. [Google Scholar] [CrossRef]
- Hamzah, I.A.; Yasin, J.A. Static Var compensators (SVC) required to solve the problem of delayed voltage recovery following faults in the power system of the Saudi electricity company, western region (SEC-WR). In Proceedings of the IEEE Bologna Power Tech Conference, Bologna, Italy, 23–26 June 2003; Volume 4. [Google Scholar]
- Kundur, P.; Paserba, J.; Ajjarapu, V.; Andersson, G.; Bose, A.; Canizares, C.; Van Cutsem, T. Definition and classification of power system stability. IEEE Trans. Power Syst. 2004, 19, 1387–1401. [Google Scholar]
- Hill, D.J. Nonlinear dynamic load models with recovery for voltage stability studies. IEEE Trans. Power Syst. 1993, 8, 166–176. [Google Scholar] [CrossRef]
- Kundur, P.; Balu, N.J.; Lauby, M.G. Power System Stability and Control; McGraw-Hill: New York, NY, USA, 1994; Volume 7. [Google Scholar]
- Van Cutsem, T.; Vournas, C. Voltage Stability of Electric Power Systems; Springer Science & Business Media: New York, NY, USA, 1998; Volume 441. [Google Scholar]
- Electric Power Statistics Information System. Available online: http://epsis.kpx.or.kr/epsisnew/ (accessed on 2 November 2018).
- Lu, N.; Xie, Y.; Huang, Z.; Puyleart, F.; Yang, S. Load component database of household appliances and small office equipment. In Proceedings of the Power and Energy Society General Meeting-Conversion and Delivery of Electrical Energy in the 21st Century, Pittsburgh, PA, USA, 20–24 July 2008; pp. 1–5. [Google Scholar]
- Paserba, J.J.; Leonard, D.J.; Miller, N.W.; Naumann, S.T.; Lauby, M.G.; Sener, F.P. Coordination of a distribution level continuously controlled compensation device with existing substation equipment for long term var management. IEEE Trans. Power Syst. 1994, 9, 1034–1040. [Google Scholar] [CrossRef]
- Paramalingam, J.; Nakamura, F.; Matsuda, A.; Yamanaka, D.; Tsuchiya, T. Application of FACTS Devices for a Dynamic Power System within the USA. In Proceedings of the International Power Electronics Conference, Niigata, Japan, 20–24 May 2018; pp. 2329–2334. [Google Scholar]
- Larsen, E.V.; Miller, N.W.; Nilsson, S.L.; Lindgren, S.R. Benefits of GTO-based compensation systems for electric utility applications. IEEE Trans. Power Deliv. 1992, 7, 2056–2064. [Google Scholar] [CrossRef]
- Hingorani, N.G.; Gyugyi, L.; El-Hawary, M. Understanding FACTS: Concepts and Technology of Flexible AC Transmission Systems; IEEE Press: New York, NY, USA, 2000. [Google Scholar]
- Pourbeik, P.; Koessler, R.J.; Quaintance, W.; Wong, W. Performing comprehensive voltage stability studies for the determination of optimal location, size and type of reactive compensation. In Proceedings of the Power Engineering Society General Meeting, Montreal, QC, Canada, 18–22 June 2006; pp. 1–6. [Google Scholar]
- Western Electricity Coordinating Council. Voltage Stability Criteria, Undervoltage Load Shedding Strategy, and Reactive Power Reserve Monitoring Methodology; Reactive Power Reserve Work Group Technical Studies Subcommittee Western Electricity Coordinating Council: San Diego, CA, USA, 2007; Available online: http://www.wecc.biz/main.html (accessed on 15 November 2018).
- Lee, B.; Song, H.; Kwon, S.H.; Jang, G.; Kim, J.H.; Ajjarapu, V. A study on determination of interface flow limits in the KEPCO system using modified continuation power flow (MCPF). IEEE Trans. Power Syst. 2002, 17, 557–564. [Google Scholar]
Figure 1.
Induction motor loads proportion at winter peak condition.

Figure 2.
Model structure for load buses.

Figure 3.
V-I characteristic of the static VAR compensator and the static synchronous compensator.

Figure 4.
PV curve for margin evaluation.

Figure 5.
Concept of QV curve and reactive power margin.

Figure 6.
Stable and unstable cases of YV curve.

Figure 7.
Representation of π-equivalent circuit with branch parameter.

Figure 8.
Post-fault voltage performance criteria for load bus.

Figure 9.
Flowchart of the voltage stability analysis and assessment method.

Figure 10.
Responses of bus voltages under the most severe contingency. (a) Bus voltage magnitude. (b) Induction motor speed & slip.
Figure 10.
Responses of bus voltages under the most severe contingency. (a) Bus voltage magnitude. (b) Induction motor speed & slip.

Figure 11.
Comparison of voltage recovery results with existing and proposed schemes.

Figure 12.
One-line diagram of metropolitan region in Korean power system.

Figure 13.
Post-fault voltage trajectories of buses.

Figure 14.
Post-fault voltage response of buses with flexible alternating current transmission system.
Figure 14.
Post-fault voltage response of buses with flexible alternating current transmission system.

Figure 15.
Representation of FACTS injection location in metropolitan region.


Table 1.
Active power margin of contingency list.
| Contingency List | Line (# of Circuits) | % Margin | Performance Level | Voltage Level |
|---|---|---|---|---|
| # 1 | 1200–5010 (2) | 5.87 | A | 765 [kV] |
| # 2 | 4010–6030 (2) | 459 | B | 765 [kV] |
| # 3 | 1300–3300 (2) | 5.22 | A | 345 [kV] |
| # 4 | 1400–1500 (2) | 6.04 | A | 345 [kV] |
| # 5 | 2400–4600 (2) | 7.08 | A | 345 [kV] |
| # 6 | 2500–4750 (2) | 7.44 | A | 345 [kV] |
Table 2.
Results of the reactive power margin with contingency No. 3.
| Contingency List | Ranking | Bus No. | V-Q margin Vulnerability Index |
|---|---|---|---|
| # 3 (1300–3300) | 1 | 1400 | 0.02575 |
| 2 | 1300 | 0.02749 | |
| 3 | 1700 | 0.03528 | |
| 4 | 2500 | 0.03867 | |
| 5 | 3300 | 0.05437 | |
| 6 | 4700 | 0.07713 | |
| 7 | 4500 | 0.07997 | |
| 8 | 1200 | 0.08049 | |
| 9 | 4100 | 0.08847 | |
| 10 | 3600 | 0.09412 |
Table 3.
Results of a sensitivity analysis with contingency No. 2.
| Contingency List | Ranking | Bus No. | Participation Factor |
|---|---|---|---|
| # 2 (4010–6030) | 1 | 2700 | 0.0153 |
| 2 | 4500 | 0.0148 | |
| 3 | 2500 | 0.0147 | |
| 4 | 4700 | 0.0139 | |
| 5 | 4650 | 0.0137 | |
| 6 | 4600 | 0.0136 | |
| 7 | 3600 | 0.0131 | |
| 8 | 4400 | 0.0126 | |
| 9 | 4800 | 0.0125 | |
| 10 | 4200 | 0.0123 |
Table 4.
Comparison results of Case 1 and Case 2.
| # of FACTS | Injection Buses | Voltage Recovery Time | Fault Induced Delayed Voltage Recovery Mitigate? | |||
|---|---|---|---|---|---|---|
| Case 1 | Case 2 | Case 1 | Case 2 | Case 1 | Case 2 | |
| One | 1400 | 2700 | 2.3416 s | 2.5171 s | No | No |
| Two | 1400, 1300 | 2700, 4500 | 2.2141 s | 2.3984 s | No | No |
| Three | 1400, 1300, 1700 | 2700, 4500, 2500 | 0.4578 s | 2.2419 s | Yes | No |
| Four | 2700, 4500, 2500, 4700 | 1.6877 s | No | |||
| Five | 2700, 4500, 2500, 4700, 4650 | 0.3975 s | Yes | |||
© 2019 by the authors. Licensee MDPI, Basel, Switzerland. This article is an open access article distributed under the terms and conditions of the Creative Commons Attribution (CC BY) license (http://creativecommons.org/licenses/by/4.0/).
Share and Cite
MDPI and ACS Style
Lee, Y.; Song, H. A Reactive Power Compensation Strategy for Voltage Stability Challenges in the Korean Power System with Dynamic Loads. Sustainability 2019, 11, 326. https://doi.org/10.3390/su11020326
AMA Style
Lee Y, Song H. A Reactive Power Compensation Strategy for Voltage Stability Challenges in the Korean Power System with Dynamic Loads. Sustainability. 2019; 11(2):326. https://doi.org/10.3390/su11020326
Chicago/Turabian StyleLee, Yunhwan, and Hwachang Song. 2019. "A Reactive Power Compensation Strategy for Voltage Stability Challenges in the Korean Power System with Dynamic Loads" Sustainability 11, no. 2: 326. https://doi.org/10.3390/su11020326
Note that from the first issue of 2016, this journal uses article numbers instead of page numbers. See further details here.