Tacit Collusion of Pricing Strategy Game between Regional Ports: The Case of Yangtze River Economic Belt

School of Economics and Management, Shanghai Maritime University, Shanghai 201306, China
*
Author to whom correspondence should be addressed.
Sustainability 2019, 11(2), 365; https://doi.org/10.3390/su11020365
Submission received: 17 December 2018
/
Revised: 5 January 2019
/
Accepted: 7 January 2019
/
Published: 12 January 2019
(This article belongs to the Special Issue Sustainability Issues in Shipping and Port Management, and Maritime Logistics)
Abstract
:We develop a game model to analyze the tacit collusion between regional ports under three different scenarios. In the first scenario, there is simultaneous pricing game between regional ports; this intends to depict pricing strategy adopted independently. In the second, we consider two competing ports that make sequential pricing decisions. Thirdly, an infinitely repeated game model is then formulated for regional ports to test the stability of Nash equilibrium. Our main finding is that there is a certain degree of tacit collusion of pricing strategy between regional ports in the competitive environment; in particular, the tacit collusion of pricing strategy will gradually stabilize with the increasing number regional ports games. A case study of Yangtze River Economic Belt is provided to illustrate the results.
1. Introduction
While overall prospects for port activity remain bright, today’s port-operating landscape is characterized by heightened port competition, especially in the container market segment, where decisions by shipping alliances regarding capacity deployed, ports of call and network structure can determine the fate of a container port. Under this background, further enhancing container port performance in regional market is increasingly recognized as critical for port planning, investment positioning and strategy pricing, as well as for meeting globally established sustainability benchmarks and objectives such as the Sustainable Development Goals [1].
As an important basic industry in the national economic system, the port plays an important role in the improvement of the country’s comprehensive capability and the development of the regional economy in China. On 12 July 2017, the Ministry of Transport of the People’s Republic of China (MOT) and National Development and Reform Commission (NDRC) issued the latest “Port Tariff and Charging Method” to deregulate port pricing formation mechanism. According to the method, port tariff will be transformed from mainly depending on government pricing into government guidance, such as cargo dues, pilotage fees, tug fees, parking fees, special trimming charges for oil fences, etc. Particularly, the competitive services of port will be changed from uniform pricing into being based on market regulations.
Accompanied by the deregulation of port tariff policy, the protection and restoration of regional ports ecological environment have been given the first priority, particularly in Yangtze River Economic Belt. In the past 40 years of reform and opening up, the ecosystem of the Yangtze River Economic Belt has suffered serious damage due to the failure to deal with the relationship between human and nature in the process of rapid economic development and urban expansion. The main ecological and environmental problems include soil erosion in the upper reaches, frequent floods, lake eutrophication, soil salinization, pollution of heavy metals and persistent organic compounds and loss of biodiversity in the middle and lower reaches. Besides the impact of global climate change, the frequent occurrences of soil erosion in the upper reaches and flood disasters in the middle and lower reaches are mainly due to the significant reduction of surface vegetation caused by human activities, such as urbanization, mining, deforestation and reclamation, shipping pollution, as well as large-scale port construction and operation, etc.
Moreover, MOT had issued a notice of promoting regional port integration reform, thanks to successful lessons from the case of Ningbo-Zhoushan Port on 17 August 2017. According to the notice, regional port resources will be further integrated in order to resolve overcapacity, and improve the synergy between regional ports. Therefore, with the deepening of port reform in China, the port tariff deregulation and regional port integration have further accelerated to improve port competition and efficiency, optimizing resource allocation and service function between regional ports, particularly in the Yangtze-River Economic Belt.
In the meantime, NDRC conducted an antitrust investigation in mid-April 2017 on the Shanghai and Tianjin ports. The survey found three main problems: First, two ports were suspected of restricting transaction, requiring shipping companies to use services provided by their affiliated enterprises, such as tug, tally, ship agency and so on. Second, two ports were suspected of charging unfair and high prices, especially to local foreign trade container businesses. Thirdly, two ports were suspected of attaching additional unreasonable transaction conditions, such as compulsory services, non-competitive clauses, loyalty clauses, and so on.
Therefore, the aim of the research is to explore the possibility of pricing strategy tacit collusion between regional ports with the deregulation of port tariff and the promotion of regional port integration. Due to the close geographical location and unchanged regional traffic volume in a given period, will the deregulation of port tariff policy inevitably promote competition between regional ports, especially in the Yangtze-River Economic Belt? What is the pricing strategy chosen by regional ports? If one port selects a specific pricing strategy, how will the other port responds to it? Will the regional ports fiercely compete or tacit collude in order to get more benefits for itself or themselves? In particular, is there a stable Nash equilibrium of pricing strategy after long-term game between regional ports?
The rest of this paper is organized as follows. Section 2 gives a literature review of port pricing competition and tacit collusion. In Section 3, we formulate a game model to characterize the decision of regional ports adopting pricing strategy. In Section 4, we further study the model analytical solution and offer a comparison of the results. The fifth section is a case study. Managerial and policy implications are present in Section 6. Finally, the conclusions and future directions of the study are summarized in Section 7.
2. Literature Review
There is a varied body of literature on the subject of port pricing competition. Among which, the game theoretic approach is mainly adopted as follows: Anderson et al. [2] develop a game-theoretic best response framework to understand how competitor ports will respond to development at a focus port, and whether the focus port will be able to capture or defend market share by building additional capacity. Lee and Lee [3] examine the inherent problems in the old lease charging system at Busan container terminals, developing a reasonable lease calculation model, and articulating the design of an efficient lease charging system to enhance throughputs. Luo et al. [4] propose a two-stage duopoly model that comprises the pricing and capacity decisions of two heterogeneous players serving an increasing market. Bae et al. [5] develop the linear container handling demand function which incorporates transshipment traffic, and apply a non-cooperative two-stage game to a vertical- structure seaport market with ports as upstream players and shipping lines as downstream players. Zhuang et al. [6] use alternative duopoly games, namely a Stackelberg game and a simultaneous game, to model port competition, where ports provide differentiated services in the sectors of containerized cargo and dry-bulk cargo. Song et al. [7] consider the competition between two ports involving both hinterland shipments and transshipments, taking a transport chain perspective including deep-sea, port, feeder and inland transportation. Sheng et al. [8] propose a model that explicitly incorporates the effects of competition between regional ports and between shipping companies, and captures operational considerations such as the inventory costs of in-transit cargo, and the tradeoff between enlarged fleet size and slow steaming. Zhang et al. [9] develop a game-theoretical model of port competition for the intermodal network design and pricing strategy problem, describing a case study involving the competition between Dalian port and Yingkou port in China.
In addition to port pricing coordination and cooperation, He [10] uses theory and examples to prove that the cooperation of regional ports on pricing strategies is more conducive to the improvement of total profits based on the Bertrand model. Wang and Zhang [11] combine the traditional game with the evolutionary game, studying the mechanism of port competition coordination and propose measures to promote the coordinated development of ports. Fan et al. [12] utilize the game model to analyze the competition and cooperation among ports in the Yellow Sea region of China. Zhou et al. [13] adopt the Bertrand game model to solve the optimal pricing of each port based on the joint mode among the three ports, and based on this, the demand, profit, regional consumer surplus and social welfare of each port are studied. Shinohara and Saika [14] present a port cooperation model related to port governance from the perspective of port governance; here, port cooperation issues are summarized and analyzed. These studies have all concluded that the port adopts appropriate cooperative pricing strategy in competition, which is conducive to the improvement of total profits.
To achieve a green and sustainable development of the port industry, various regulations have been adopted for the control of emissions. Golias et al. [15] present a new formulation for the discrete space berth-scheduling problem at marine container terminals, with the objective of minimizing the total emissions and fuel consumption for all vessels while in transit to their next port of call. Homsombat et al. [16] investigate the market-based policy on pollution control in a region with multiple ports, revealing that in the absence of inter-port coordination, pollution spill-over and inter-port competition can lead to distorted pollution taxation and emission constraints. Lee et al. [17] adopt an energy-environmental version of the Global Trade Analysis Project referred to as GTAP-E to analyze the quantitative effects of a maritime carbon tax on the global economy. Cullinane and Bergqvist [18] emphasize that the ECA rules may become a challenge for some parts of the shipping market operating in the North and Baltic Sea and may pose a certain risk in terms of reverse environmental effects. Franc and Sutto [19] explore the potential impacts of the implementation of such a measure on the organization of containerized shipping lines and European ports. Wang et al. [20] analyze and benchmarks the economic implications of two alternative Emission Trading Scheme mechanisms. Zhao et al. [21] keep pace with the times and study the stability of the port strategic alliance in the context of the Maritime Silk Road; tacit collusion is considered and whether the price alliance will be maintained. Sys et al. [22] examine both the potential effects of the emerging international maritime emission regulations on the competition between seaports, and the potential underlying economic motivations fostering the discussion of introducing Emission Control Areas. Cariou et al. [23] propose a mixed integer linear programming (MILP) model based on a multi-commodity pickup and delivery arc-flow formulation.
This paper is different from the aforementioned studies in the following ways:
- (i)
- We develop a Bertrand model to analyze the pricing strategy of one shot and simultaneous, sequential game as well as infinitely repeated game. In the paper of Saeed and Larsen [24], which discusses the three terminals’ decision on whether to act as a singleton or to enter into a coalition with one or both of the other terminals in the first stage, the second stage is modeled as a Bertrand game. Ishii et al. [25] construct a non-cooperative game theoretic model where each port selects port charges strategically in the timing of port capacity investment through a two-stage game. Dong et al. [26] present an analysis of the price competition between two container terminals using a two-stage non-cooperative game theoretical model. In contrast, we analyze the tacit collusion of pricing strategy game between regional ports through an infinitely repeated game. As the tacit collusion is actually a kind of collusion based on the non-cooperative dynamic game, the port uses the strategic behavior in the dynamic game to achieve mutual coordination, and observes or predicts the behavior of competitor to exchange information. However, in an infinitely repeated game, due to the lag of observation and revenge as well as the existence of punishment system, the results of formal cooperation or even tacit collusion may occur.
- (ii)
- Tacit collusion of pricing strategy game between regional ports has been analyzed in an infinitely repeated game. Cai [27] considers that market price manipulation under tacit collusions is an inter-firm strategic behavior that promotes rapid rise of market price in non-oligopoly markets; the dynamic mechanism for tacit collusions of price manipulation can be revealed by an analysis based on Bertrand’s duopoly game model. Furthermore, Barbot et al. [28] develop a test for vertical collusion between airports and airlines in the case of two different scenarios. Liu and Wu [29] use the Chinese liquor market data and mathematical statistics to study the tacit collusion under the price leadership system to propose anti-monopoly regulation. In a game, there may be a problem of “prisoner’s dilemma”. However, we consider the choice of pricing strategy between regional ports in the increasingly competitive environment; an infinitely repeated game model is then formulated for regional ports, and the internal mechanism of pricing strategy of regional ports is then discussed in depth. A certain degree of tacit collusion of pricing strategy between regional ports has been found under the competitive environment. Particularly, the tacit collusion of pricing strategies will gradually stabilize with the increasing number of regional ports’ games.
- (iii)
- In the port demand function, Álvarez-SanJaime et al. [30] model the competition between two ports, except for the location and their capacity, which are identical in all respects. Guo et al. [31] assume that the hinterland is linearly distributed and that the freight demand of the hinterland is uniform with a constant density. Song et al. [32] assume that the two ports differ in their unit handling costs; the former incurs a large unit cost of dealing with each unit container, while the latter incurs a small unit cost, which is normalized to zero. However, we use different sensitivities and differential marginal costs, considering that the regional ports can provide substitutable or differentiated services. Moreover, one port’s demand is more sensitive to its own charge than to the neighboring port’s charge in the region.
3. The Model
To analyze the price independent decisions for homogeneous products of oligopolistic firms, the Bertrand Duopoly model was proposed by French economist Joseph Bertrand in 1883. With respect to the port industry, the regional port’s pricing strategy can be seen as a game under the Bertrand model, the reasons for which are as follows: (1) Due to the economic situation of a certain region in a certain period of time, the total cargo volume of the same region during this period will not change much. Therefore, the port oligarchs in the same region may adopt a pricing strategy in order to achieve more profit or attract more volume. (2) With the development of container port, the loading and unloading equipment and corresponding operation tend to be homogenized, that is, regional ports services are basically homogeneous. (3) There is seldom formal or informal agreements between neighboring ports; the regional ports are basically making independent pricing strategies.
3.1. Model Basics
We assume that two adjacent ports i and j in the same region, the corresponding service prices are denoted by and , the cargo throughputs are and , respectively. Following Singh and Vives [33], the quadratic utility function gives rise to a linear demand structure of regional ports as following:
where is an indicator of the market demand level of the region in a certain period, represents the competition coefficient, reflecting the impact of the port’s own price on its cargo throughput (see Zhuang et al. [6]; Sheng et al. [8]; Song et al. [32]). represents the service substitution coefficient of the two regional ports. Considering the services of the two ports are not completely homogeneous, we assume that , which means that the port’s container throughput is more sensitive to its own price than to its neighboring port’s.
The profit functions of regional ports can be expressed by:
where the marginal operation costs of the two ports are denoted by and respectively. (see Song et al. [7]; Barbot et al. [28]; Zheng and Negenborn, [34]). Since both ports are located within the same region, we assume that they have an identical fixed cost, which is normalized to zero. Without loss of generality, we assume that ci < cj.
3.2. Simultaneous Game
Based on the assumptions above, we consider the non-cooperative simultaneous game between the two regional ports.
By taking the derivative of Equations (3) and (4), we obtain the first order conditions:
According to the second order conditions, . Additionally, note that , the negative definite Hessian Matrix is satisfied.
Therefore, solving the above reaction functions yield the Nash equilibrium in port price:
The operation profits for the regional ports are given, respectively, by:
3.3. Sequential Game
Considering a dynamic non-cooperative game environment, the game has a sequential order, assuming that the time sequence of the game is: (1) regional port i selects the price ( > > 0); (2) regional port j selects price after observing price .
Based on the assumptions above, the backwards-induction is used to analyze how port j makes its price after observing the price of port i. According to the principle of profit maximization, the price of port j should satisfy:
The response function of port j can be given by:
Since port i can predict the response function of port j before making its own pricing decision, the price of port i can be expressed as:
Therefore, the response function of port i is solved as follows:
By substituting the formula (14) into Equation (12), the price of port j can be rewritten as:
Which lead to the following solutions:
3.4. Repeated Game
Given an original game G between the regional ports, then repeating the G game indefinitely, which is called an infinite repeated game of G, denoted as G (∞, δ), where δ is the discount factor (0 < δ < 1) that reflects the cross-time discount rate. Furthermore, for any t, before the t-th stage (t times repeat), two regional ports can see the outcomes of the previous (t − 1) stage game.
For contrast, the sequential game is assumed to be the original game G. Each stage of the repeated game (each repetition) actually includes two stages in the sequential game: (1) Firstly, port i makes pricing decision. (2) Secondly, port j makes its own pricing decision after observing the price of port i. Therefore, a sequential game can be considered as one stage of repeated games.
The total payoff of each game in G (∞, δ) is equal to the present values:
where S is the total payoff of each game in an infinite number of repeated games, S1, S2,… is the payoff of each stage, respectively.
First, port i selects to raise its price in all stages of the repeated game. Under this background, port j will also increase price according to its own optimal response.
Therefore, the total payoffs of port i and j can be given by:
If exists, the total payoffs of port i and j can be rewritten as:
Second, if port i chooses to decrease its price during the second stage decision, port j will also decrease its own price after observing the price reduction behavior of port i.
In this circumstance, the total payoffs of port i and j can be expressed as:
Third, port i increases its price in the first stage, and then cuts the price at the second stage, and raises the price again at the third stage, and so on. In the meantime, port j adopts a me-too strategy.
Therefore, the total payoffs of port i and j can be rewritten as:
4. Model Analytical Solution and Results Comparison
Proposition 1.
In contrast to non-cooperative simultaneous game, the latecomer’s optimal pricing strategy is to adopt a me-too strategy under the sequential game.
Proof.
Assume that the forerunner port i chooses to change its port tariff, the service price difference under the simultaneous game and sequential game can be given by:
Since we assume 1 > β > γ >0 and α is usually greater than ci, that is, α – β * ci > 0. Therefore, if the forerunner port i chooses to raise the price, the strategic behavior of the port j as the follower is also increasing its price. At the same time, the equilibrium price of the port market under the sequential game is higher than that in the simultaneous game. That is, when the forerunner port in the regional market wants to implement the pricing manipulation behavior, the latecomer port’s optimal following strategy behavior will promote this manipulation behavior to become a reality.
Proposition 2.
In contrast to a non-cooperative simultaneous game, the port throughput of forerunner and latecomer decreases and increases, respectively, after putting up its price. However, both port profits increase under the sequential game.
Proof.
According to Equations (9) and (16), the port profit difference under the simultaneous game and sequential game can be expressed as:
It is obvious that above port profit difference is positive, that is, the forerunner port obtains more profit under the sequential game than that in non-cooperative simultaneous game. Note that it is assumed that 1 > β > γ > 0, since Δpi/Δpi = 2β/γ, that is, the latecomer port raises its price following the forerunner port. However, the degree of the latecomer’s price rises is lower than that of the forerunner.
Moreover, the latecomer port’s throughput difference under the simultaneous game and sequential game can be written as:
Since we assume that ci < cj and 1 > β > γ > 0, we find that the latecomer port’s throughput will increase after putting up its price. That is, the port profit of the latecomer also increases under the sequential game, which means that the two regional ports have more tacit pricing incentives in the sequential game than the non-cooperative simultaneous game.
Proposition 3.
The degree of pricing manipulation is subject to market demand and marginal cost, as well as regional competition and service substitution.
Proof.
According to Equations (27) and (28), Δpi and Δpj is positively correlated with α, respectively, that is, a higher market demand level causes a greater port price. In real life, the port operator usually increases its service price, drawing support from economic development and traffic volume. However, port propaganda and convenient condition may become the purpose of manipulating regional port market price.
Second, Δpi is negatively correlated with ci, which means the increment of port marginal cost results in a decrease in service price under the sequential game. That is to say, the regional port’s own marginal cost limits the range of its price increasement, which is well understood. As higher marginal cost has already caused a natural increment of regional market price, it will be difficult to further manipulate the regional port price market.
Third, Δpi is negatively correlated with β. A heavier degree of regional competition results in a lower range of its price increasement. That is to say, more intensity of competition between regional ports, and more possibility of an oligopoly market, tends to be the perfect competition market. The regional ports usually take a price cut strategy to attract more container traffic to their common hinterlands. Therefore, it will be hard to make further efforts to increase regional port prices.
Finally, Δpi is positively correlated with γ. Larger service substitution causes a higher range of its price increasement, which indicates that price manipulation and collusion are more likely to occur in the homogeneous service market.
Proposition 4.
Tacit collusion of pricing strategy between the regional ports tends to be stable under the infinite repeated game.
Proof.
According to Equations (21)–(26), the total payoff differences can be rewritten as follows:
Since and , it is apparent that and .
5. Application in the Yangtze-River Economic Belt
5.1. Background Information
The Yangtze River Economic Belt officially presented as national strategy on 25 September 2014 covers 11 provinces, including Shanghai, Jiangsu, Zhejiang, Anhui, Jiangxi, Hubei, Hunan, Chongqing, Sichuan, Yunnan and Guizhou, with an area of 2.05 million square kilometers; it covers the population and GDP of more than 40% of the country. The four strategic positions of Yangtze River Economic Belt are defined as: the inland river economic belt with global influence, the coordinated development belt with interactive three regions, the internal and external opening belt with a comprehensive promotion, and the pilot belt with ecological civilization construction.
As a veritable golden waterway, the cargo volume of the Yangtze River trunk line reached 2.5 billion tons in 2017, with an increase of more than 8.2%, ranking first in the world’s inland rivers. In the past five years, port cargo throughput along Yangtze River trunk line increased from 1.86 billion tons to 2.44 billion tons, container throughput increased from 13.57 million TEUs to 16.5 million TEUs, and the number of 100 million-ton ports along the Yangtze River trunk line increased from 10 to 14. Moreover, the number of 10,000-ton berths also increased from 421 to 581.
Nanjing Port is a pivotal port for water-land intermodal transport and river-sea transit of the Yangtze River Economic Belt. As a transit port for container transportation in the Yangtze River, its container terminals are located on both sides: the Nanjing Longtan Container Terminal is located on the south bank of the river. It was opened in 2005 with a planned coastline of 3675 m, land area of 365,000 square meters, and a first-phase dock yard of 410,000 square meters. Now, it has all kinds of routes (offshore routes, domestic trade river-sea direct routes, and foreign trade domestic feeder routes, among others), with more than 100 flights per week.
Wuhu Port is the fifth-largest port in Yangtze River, and is also the last 10,000-ton deep water port upstream from the river. On 8 December 2014, the annual cargo throughput of Wuhu Port broke through 100 million tons for the first time, becoming the first port in Anhui province and the fourth port upstream of Nanjing in Yangtze River to do so. Wuhu Port has memberships at the deputy director of Yangtze River Port and Shipping Alliance and the director of Yangtze River Economic Belt Shipping Alliance.
5.2. Parameter Values
First, is the market demand level of the region in a certain period. According to the background of the Yangtze River Economic Belt, the container throughput of Nanjing Port was 317 ten thousand TEUs in 2017, with an increase of 2.7%. Meanwhile, the container throughput of its neighboring ports in Zhengjiang and Yangzhou was 40.5 ten thousand TEUs and 50.9 ten thousand TEUs in 2017. Moreover, the container throughput of Wuhu Port was 71 ten thousand TEUs in 2017, with an increase of 16.9%. In the meantime, the total container throughput of its neighboring ports along Yangtze River of Anhui section was 126 ten thousand TEUs in 2017, with an increase of 18.3%. Therefore, we take the value at ten thousand TEUs.
Second, as far as demand is concerned, Luo et al. (2012) set the price sensitivity of Shenzhen Port at 1.5 times that of the Hong Kong Port, that is, 150,000 TEU/$ and 100,000 TEU/$. Together with the price and throughput data of Nanjing Port and Wuhu Port of Yangtze River Economic Belt, taking the exchange rate of 1 $ equal to 6.58 RMB into account, and one-third of the price sensitivity between Shenzhen Port and Hong Kong Port, we set these values at and (RMB/TEU).
Third, according to the annual report in 2017 of Nanjing Port (Group) Co., Ltd., its operating cost and container throughput are 628,760,537 (RMB) and 317 (ten thousand TEU), respectively, that is, (RMB/TEU). Furthermore, by reference to the annual report of Wuhu Port, affiliated to Yangtze River of Anhui section Logistics Group, its operating cost and container throughput are 163,085,191 (RMB) and 71 (ten thousand TEU), respectively, that is, (RMB/TEU).
Finally, δ is the discount factor (0 < δ < 1) that reflects the cross-time discount rate. By referring to official bank-lending rates and field investigation, we set this value at δ = 0.05.
5.3. Nash Equilibrium
Combined with the existence of the optimal solution theoretically proved, Nash equilibrium could be calculated by using Modern Technical Computing of Wolfram Mathematica 9.0 software, and the figures are obtained with the Plot 3D cubic domain of the software.
First, after applying the above values to our model, we present the results of a single game in Table 1.
From the numerical values obtained, the following results can be drawn:
- (1)
- Δpi = 64.45 > 0, Δpj = 21.62 > 0, it can be concluded that under the premise of the price increase of the forerunner port, the optimal response of the follower port is also the price increase, which is consistent with the model results.
- (2)
- Δpi/Δpj = 2β/γ = 2.98, Δqi = −37.96 and Δqj = 16.44, it can be seen that the port price increase range of forerunner is larger than the follower’s, and the port throughput has remained decreased after forerunner’s price increase, while the follower is on the contrary, which is also consistent with the model results.
- (3)
- Δπi = 2443, Δπj = 15237, it can be seen that the price increase is beneficial to both regional ports of the forerunner and the follower. In addition, the result obtained by the numerical value of the example is Δπj > Δπi, and the profit increase of port j is greater than that of port i. This is because the latecomer advantage, the profit of port j and its increase range are greater than port i. That is to say, the increasing price of forerunner port is not only beneficial to itself, but also has considerable benefits for the follower.
Secondly, according to Equations (21)–(26) and the values taken, we present the results of the repeated game in Table 2.
As is shown in Table 2, although there is a possibility of betrayal collusion in the single game due to the decrease in throughput, the optimal pricing strategy of the forerunner port is to adopt a price increase strategy in perspective of long-term interest. In the meantime, the optimal strategy of the follower port is to employ a me-too strategy, which is consistent with the results of our theoretical model.
5.4. Sensitivity Analysis
We perform a sensitivity analysis to gain further managerial insights. Specifically, the sensitivity analysis can be used to judge the pricing trends between regional ports if the regional environment changes.
First, the sensitivity analysis of port i’s price difference to market demand and its marginal cost between the sequential game and the simultaneous game is performed; the market demand and its marginal cost both increase by 10 percent, that is, , which is shown in Figure 1.
On accompanying the parameter of market demand of regional ports’ increase, port i’s price difference between the sequential game and the simultaneous game also increases, signifying that more market demand causes a higher port price increase. Furthermore, although port i’s price difference between the sequential game and the simultaneous game is inversely proportional to its marginal cost, the effect is not significant.
Second, the sensitivity analysis of port i’s price difference to regional competition and service substitution between the sequential game and the simultaneous game is performed, the regional competition and service substitution both increase with by 10 percent, that is, and , as shown in Figure 2.
Coupled with gradual intensifying of regional competition, port i’s price difference between the sequential game and the simultaneous game decreases, signifying that a heavier regional competition leads to lower port price increase. However, port i’s price difference between the sequential game and the simultaneous game also increases by enhancing service substitution. Furthermore, the effect tends to be not significant with gradual intensification of regional competition.
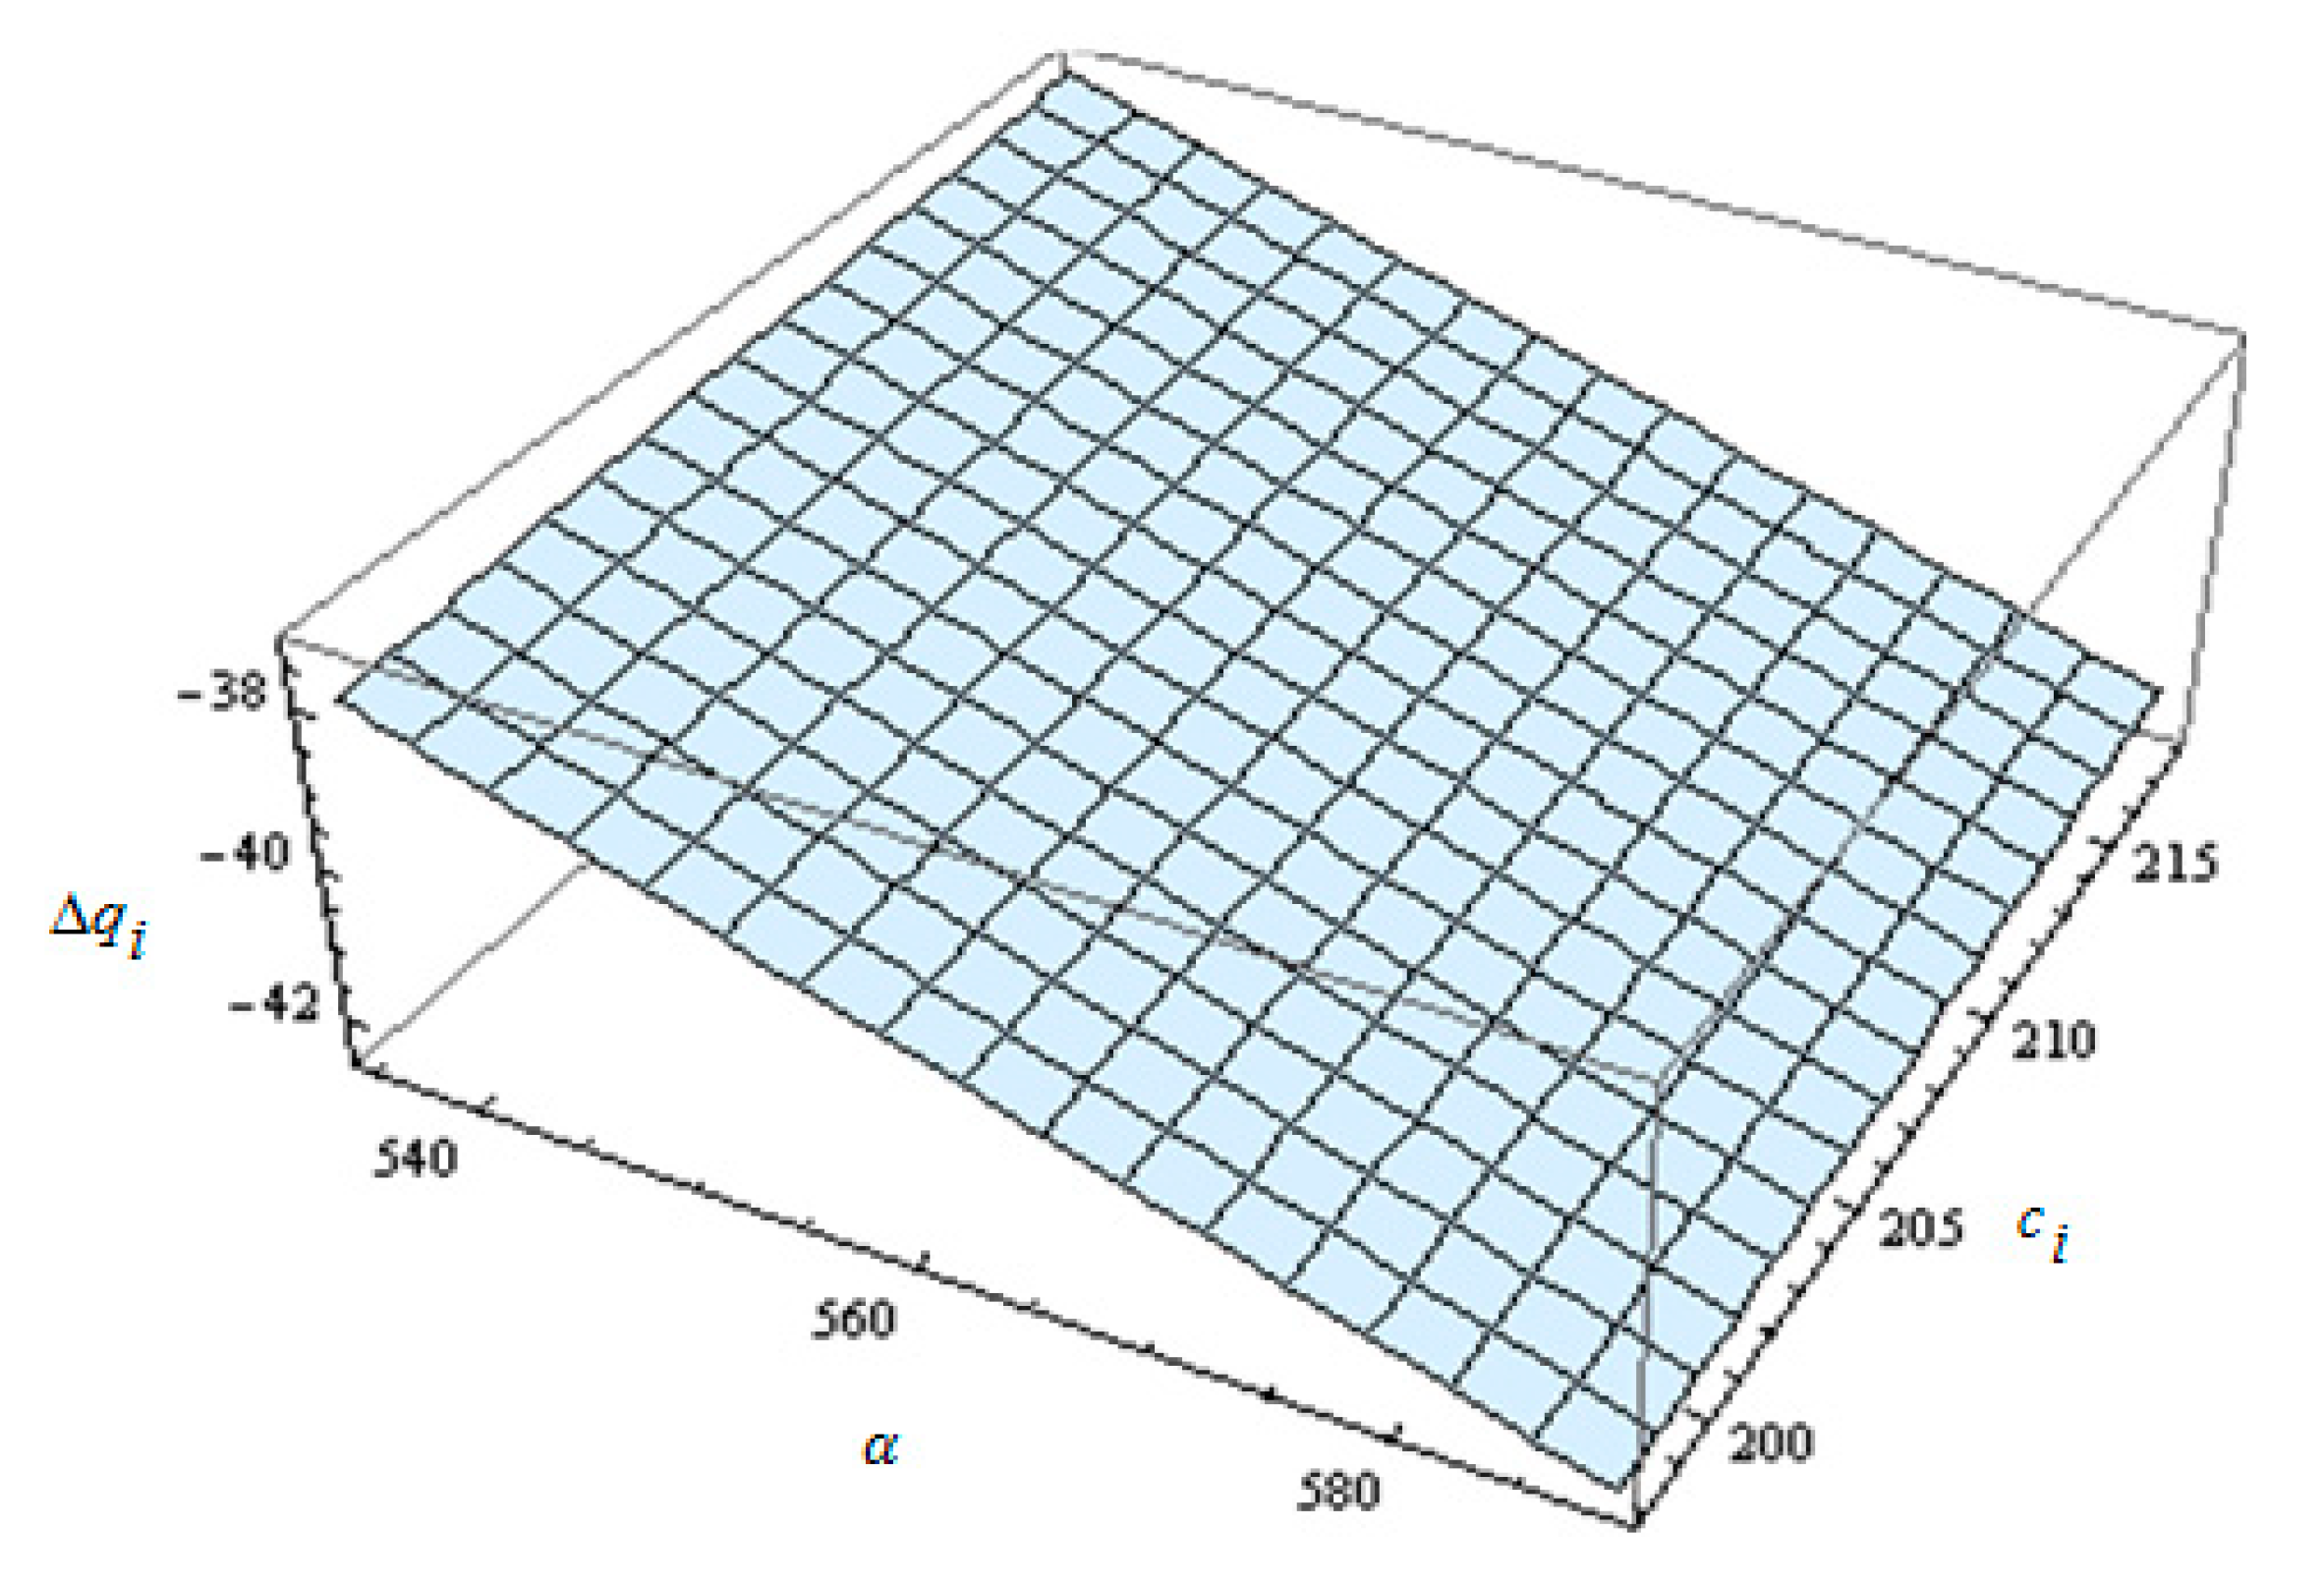
Third, the sensitivity analysis of port i’s throughput difference to market demand and its marginal cost between the sequential game and the simultaneous game is performed; the market demand and its marginal cost both increase by 10 percent, that is, and , as shown in Figure 3.
As is shown in Figure 3, port i’s throughput difference between the sequential game and the simultaneous game is inversely proportional to the market demand of regional ports, while the effect of marginal cost is not significant.
Fourth, the sensitivity analysis of port i’s throughput difference to regional competition and service substitution between the sequential game and the simultaneous game is performed; the regional competition and service substitution both increase by 10 percent, that is, and , as shown in Figure 4.
As is shown in Figure 4, port i’s throughput difference between the sequential game and the simultaneous game is proportional to regional competition, while inversely proportional to the service substitution of regional ports.
Fifth, the sensitivity analysis of port i’s profit difference to market demand and its marginal cost between the sequential game and the simultaneous game is performed; the market demand and its marginal cost both increase by 10 percent, that is, and , as shown in Figure 5.
As is shown in Figure 5, port i’s profit difference between the sequential game and the simultaneous game is proportional to market demand, while inversely proportional to port i’s marginal cost, and the effect of the latter is not significant.
Finally, the sensitivity analysis of port i’s profit difference to regional competition and service substitution between the sequential game and the simultaneous game is performed; the regional competition and service substitution both increase by 10 percent, that is, and , as shown in Figure 6.
As is shown in Figure 6, port i’s profit difference between the sequential game and simultaneous game is inversely proportional to the regional competition, while proportional to the service substitution of regional ports. Furthermore, heavier regional competition and lower service substitution of regional ports lead to lower port profit difference between the sequential game and the simultaneous game.
6. Managerial and Policy Implications
Sensitivity analysis and comparative studies show that port tariff, container throughput and port profit, as well as regional overall throughput and profit, through the simultaneous game and the sequential game, even the indefinitely repeated game, provide managerial and policy implications for the government price department to further deregulate port tariff policy, the port administrative authority to strengthen port charge supervision, and the port operator to optimize a pricing strategy.
First of all, the market demand of regional ports is proportional to the equilibrium price. According to the calculated equilibrium price formula of a single game, a larger the market demand of a certain region in a certain period, the higher the equilibrium prices between the regional ports.
Secondly, the marginal operation cost of regional port is proportional to the equilibrium price. Cost increase can be considered the most direct reason for price increase, that is, the more the marginal operation cost of the port, the higher the equilibrium prices between the regional ports.
Thirdly, the degree of competition in the regional market is inversely proportional to the equilibrium price. The heavier the degree of market competition, the lower the equilibrium prices between the regional ports.
Fourth, the degree of port service substitution is directly proportional to the equilibrium price. It indicates that the greater the degree of port service substitution, the higher the equilibrium prices between the regional ports. This implies that the price manipulation behavior is more likely to occur between homogeneous services in the oligopoly regional port market.
Finally, under the infinite repeated game, the optimal pricing strategy of the forerunner port is to increase its price from a long-term interest perspective, as does the follower port. Accordingly, the tacit collusion of pricing strategy behavior tends to be stable after several rounds of the game, which means that under the non-cooperative game environment, the regional ports may adopt tacit collusion pricing behaviors. Particularly, the tacit collusive pricing strategies tend to stabilize with the increase in game times.
7. Conclusions and Future Research
This paper uses the game model to quantitatively analyze the pricing strategy between regional ports under a single and repeated environment.
First of all, we focus on the two cases of simultaneous game and sequential game. It is found that the optimal pricing strategy of the forerunner port is to adopt a price increase strategy under the sequential game. In the meantime, the optimal strategy of the follower port is to employ a me-too strategy, which will ultimately promote price increase. That is, tacit collusion of pricing strategy is of great temptation for regional ports with deregulation of port tariff.
Second, the forerunner port’s throughput is decreased due to the second-mover advantage of the follower. Therefore, the infinite repeated game theory is further utilized to analyze the forerunner port behavior in the long-term repeated game. Considering the long-term profit, the forerunner port will adopt a price increase strategy after several rounds of the game, which means that tacit collusive pricing behavior tends to be stable with the increase of game times. Managerial and policy implications are that there usually exists an increase in both total cargo throughput and port price market in the process of regional port integration. Government price department and administrative authority should strengthen port charge supervision and prevent tacit collusion. Otherwise, the tacit collusion of pricing strategy will result in a substantial social welfare loss in the process of regional port integration.
The authors recognize that there is space to further study this topic. Potential directions for future study include, but are not limited to, the following: First, we should further enrich the current game model to consider various factors influencing port pricing strategy, such as commercial, governance, institutional, and social decisions, etc. Second, the case study could be better linked to the model when further detailed data are collected in the future. Third, the model can be extended to the study of multi-ports from a transport chain perspective. Finally, Nash equilibrium of the Bertrand model and the Cournot model can be compared to analyze the objective of port profit maximization and cargo throughput priority.
Author Contributions
Conceptualization, G.D.; Data curation, D.Z.; Formal analysis, D.Z.; Investigation, D.Z.; Methodology, G.D.; Project administration, G.D.; Visualization, G.D.; Writing—original draft, D.Z.; Writing—review & editing, G.D.
Funding
This work is supported by the National Natural Science Foundation of China under Grant No. 71774109, and Major Research Plan of National Social Science Foundation under Grant No. 18ZDA052.
Acknowledgments
The authors are grateful to four anonymous referees and an editor for their insightful and constructive comments and suggestions, which have contributed to improving this paper.
Conflicts of Interest
The authors declare no conflict of interest.
References
- United Nations Conference on Trade and Development. Review of Maritime Transport; United Nations: New York, NY, USA; Geneva, Switzerland, 2018. [Google Scholar]
- Anderson, C.M.; Park, Y.A.; Chang, Y.T.; Yang, C.H.; Lee, T.W.; Luo, M. A game theoretic analysis of competition among container port hubs: The case of Busan and Shanghai. Marit. Policy Manag. 2008, 35, 5–26. [Google Scholar] [CrossRef]
- Lee, P.T.W.; Lee, T.C. A new lease charging system for Busan container terminals: A historical case study. Marit. Policy Manag. 2012, 39, 91–105. [Google Scholar] [CrossRef]
- Luo, M.; Liu, L.; Gao, F. Post-entry container port capacity expansion. Transp. Res. Part B Methodol. 2012, 46, 120–138. [Google Scholar] [CrossRef]
- Bae, M.J.; Chew, E.K.; Lee, L.H.; Zhang, A. Container transshipment and port competition. Marit. Policy Manag. 2013, 40, 479–494. [Google Scholar] [CrossRef]
- Zhuang, W.; Luo, M.; Fu, X. A game theory analysis of port specialization-implications to the Chinese port industry. Marit. Policy Manag. 2014, 41, 268–287. [Google Scholar] [CrossRef]
- Song, D.P.; Lyons, A.; Li, D.; Sharif, H. Modelling port competition from a transport chain perspective. Transp. Res. Part E Logist. Transp. Rev. 2016, 87, 75–96. [Google Scholar] [CrossRef]
- Sheng, D.; Li, Z.C.; Fu, X.; Gillen, D. Modeling the effects of unilateral and uniform emission regulations under shipping company and port competition. Transp. Res. Part E Logist. Transp. Rev. 2017, 101, 99–114. [Google Scholar] [CrossRef]
- Zhang, Q.; Wang, W.; Peng, Y.; Zhang, J.; Guo, Z. A game-theoretical model of port competition on intermodal network and pricing strategy. Transp. Res. Part E Logist. Transp. Rev. 2018, 114, 19–39. [Google Scholar] [CrossRef]
- He, Y. Duopoly Pricing Strategy for Regional Ports Based on Bertrand Model. Logist. Technol. 2011, 30, 46–48. (In Chinese) [Google Scholar]
- Wang, D.; Zhang, H. Evolutionary game analysis on the coordination mechanism between regional ports. J. Dalian Maritime Univ. 2014, 40, 61–68. (In Chinese) [Google Scholar]
- Fan, Y.; Gao, T.; Qiao, H. Competition and collaborative strategies within ports cluster in Huanghai area-A game theory approach. Syst. Eng. Theory Pract. 2015, 35, 955–964. (In Chinese) [Google Scholar]
- Zhou, L.; Chen, G.; Guo, L. Research on pricing strategy based on co-opetition among the three ports. Logist. Eng. Manag. 2017, 39, 37–41. (In Chinese) [Google Scholar]
- Shinohara, M.; Saika, T. Port governance and cooperation: The case of Japan. Res. Transp. Bus. Manag. 2018, 26, 56–66. [Google Scholar] [CrossRef]
- Golias, M.; Boile, M.; Theofanis, S.; Efstathiou, C. The berth-scheduling problem: Maximizing berth productivity and minimizing fuel consumption and emissions production. Transp. Res. Rec. 2010, 2166, 20–27. [Google Scholar] [CrossRef]
- Homsombat, W.; Yip, T.L.; Yang, H.; Fu, X. Regional cooperation and management of port pollution. Marit. Policy Manag. 2013, 40, 451–466. [Google Scholar] [CrossRef]
- Lee, T.C.; Chang, Y.T.; Lee, P.T.W. Economy-wide impact analysis of a carbon tax on international container shipping. Transp. Res. Part A Policy Pract. 2013, 58, 87–102. [Google Scholar] [CrossRef]
- Cullinane, K.; Bergqvist, R. Emission control areas and their impact on maritime transport. Transp. Res. Part D Transp. Environ. 2014, 28, 1–5. [Google Scholar] [CrossRef]
- Franc, P.; Sutto, L. Impact analysis on shipping lines and European ports of a cap-and-trade system on CO2 emissions in maritime transport. Marit. Policy Manag. 2014, 41, 61–78. [Google Scholar] [CrossRef]
- Wang, K.; Fu, X.; Luo, M. Modeling the impacts of alternative emission trading schemes on international shipping. Transp. Res. Part A Policy Pract. 2015, 77, 35–49. [Google Scholar] [CrossRef]
- Zhao, X.; Wang, X.; Zhou, Q. Port strategic alliance stability under the background of “maritime silk road” strategy. J. Dalian Marit. Univ. 2016, 40, 61–68. (In Chinese) [Google Scholar]
- Sys, C.; Vanelslander, T.; Adriaenssens, M.; Van Rillaer, I. International emission regulation in sea transport: Economic feasibility and impact. Transp. Res. Part D Transp. Environ. 2016, 45, 139–151. [Google Scholar] [CrossRef]
- Cariou, P.; Cheaitou, A.; Larbi, R.; Hamdan, S. Liner shipping network design with emission control areas: A genetic algorithm-based approach. Transp. Res. Part D Transp. Environ. 2018, 63, 604–621. [Google Scholar] [CrossRef]
- Saeed, N.; Larsen, O.I. An application of cooperative game among container terminals of one port. Eur. J. Oper. Res. 2010, 203, 393–403. [Google Scholar] [CrossRef]
- Ishii, M.; Lee, P.T.W.; Tezuka, K.; Chang, Y.T. A game theoretical analysis of port competition. Transp. Res. Part E Logist. Transp. Rev. 2013, 49, 92–106. [Google Scholar] [CrossRef]
- Dong, G.; Huang, R.; Ng, P. Tacit collusion between two terminals of a port. Transp. Res. Part E Logist. Transp. Rev. 2016, 93, 199–211. [Google Scholar] [CrossRef]
- Cai, J. An analysis of the mechanism of market price manipulation under tacit collusion. J. Chongqing Technol. Bus. Univ. 2011, 28, 250–253. (In Chinese) [Google Scholar]
- Barbot, C.; D’Alfonso, T.; Malighetti, P.; Redondi, R. Vertical collusion between airports and airlines: An empirical test for the European case. Transp. Res. Part E Logist. Transp. Rev. 2013, 57, 3–15. [Google Scholar] [CrossRef]
- Liu, F.; Wu, X. Tacit collusion and antitrust regulation based on price leadership system-evidence from Chinese liquor market. China Ind. Econ. 2016, 4, 75–92. (In Chinese) [Google Scholar]
- Álvarez-SanJaime, Ó.; Cantos-Sánchez, P.; Moner-Colonques, R.; Sempere-Monerris, J.J. The impact on port competition of the integration of port and inland transport services. Transp. Res. Part B Methodol. 2015, 80, 291–302. [Google Scholar] [CrossRef]
- Guo, L.; Yang, D.; Yang, Z. Port integration method in multi-port regions (MPRs) based on the maximal social welfare of the external transport system. Transp. Res. Part A Policy Pract. 2017, 110, 243–257. [Google Scholar] [CrossRef]
- Song, Z.; Tang, W.; Zhao, R. Cooperation mode for a liner company with heterogeneous ports: Business cooperation vs. port investment. Transp. Res. Part E Logist. Transp. Rev. 2018, 118, 513–533. [Google Scholar] [CrossRef]
- Singh, N.; Vives, X. Price and quantity competition in a differentiated duopoly. Rand J. Econ. 1984, 15, 546–554. [Google Scholar] [CrossRef]
- Zheng, S.; Negenborn, R.R. Centralization or decentralization: A comparative analysis of port regulation modes. Transp. Res. Part E Logist. Transp. Rev. 2014, 69, 21–40. [Google Scholar] [CrossRef]
Figure 1.
Port pricing difference with regard to market demand and marginal cost between sequential and simultaneous games.
Figure 1.
Port pricing difference with regard to market demand and marginal cost between sequential and simultaneous games.

Figure 2.
Port pricing difference with regard to regional competition and service substitution between the sequential and simultaneous games.
Figure 2.
Port pricing difference with regard to regional competition and service substitution between the sequential and simultaneous games.

Figure 3.
Port throughput difference with regard to market demand and marginal cost between the sequential and simultaneous game.
Figure 3.
Port throughput difference with regard to market demand and marginal cost between the sequential and simultaneous game.

Figure 4.
Port throughput difference with regard to regional competition and service substitution between the sequential and simultaneous game.
Figure 4.
Port throughput difference with regard to regional competition and service substitution between the sequential and simultaneous game.

Figure 5.
Port profit difference with regard to market demand and marginal cost between the sequential and simultaneous games.
Figure 5.
Port profit difference with regard to market demand and marginal cost between the sequential and simultaneous games.

Figure 6.
Port profit difference with regard to regional competition and substitution between the sequential and simultaneous games.
Figure 6.
Port profit difference with regard to regional competition and substitution between the sequential and simultaneous games.


Table 1.
Nash equilibrium of single game between regional ports.
| Single Game | ||||||
|---|---|---|---|---|---|---|
| Simultaneous game | 641.64 | 568.26 | 337.16 | 430.35 | 149578 | 146001 |
| Sequential game | 706.09 | 589.88 | 299.20 | 446.79 | 152021 | 161238 |
Table 2.
Total payoffs of repeated game between regional ports.
| Repeated Game | ||||||
|---|---|---|---|---|---|---|
| Case 1 | 160,022 | 169,724 | ||||
| Case 2 | 159,894 | 168,922 | ||||
| Case 3 | 159,900 | 168,960 |
© 2019 by the authors. Licensee MDPI, Basel, Switzerland. This article is an open access article distributed under the terms and conditions of the Creative Commons Attribution (CC BY) license (http://creativecommons.org/licenses/by/4.0/).
Share and Cite
MDPI and ACS Style
Dong, G.; Zhong, D. Tacit Collusion of Pricing Strategy Game between Regional Ports: The Case of Yangtze River Economic Belt. Sustainability 2019, 11, 365. https://doi.org/10.3390/su11020365
AMA Style
Dong G, Zhong D. Tacit Collusion of Pricing Strategy Game between Regional Ports: The Case of Yangtze River Economic Belt. Sustainability. 2019; 11(2):365. https://doi.org/10.3390/su11020365
Chicago/Turabian StyleDong, Gang, and Dandan Zhong. 2019. "Tacit Collusion of Pricing Strategy Game between Regional Ports: The Case of Yangtze River Economic Belt" Sustainability 11, no. 2: 365. https://doi.org/10.3390/su11020365
Note that from the first issue of 2016, this journal uses article numbers instead of page numbers. See further details here.