Three-Dimensional Urban Expansion Analysis of Valley-Type Cities: A Case Study of Chengguan District, Lanzhou, China

 ,
,
Abstract
:1. Introduction
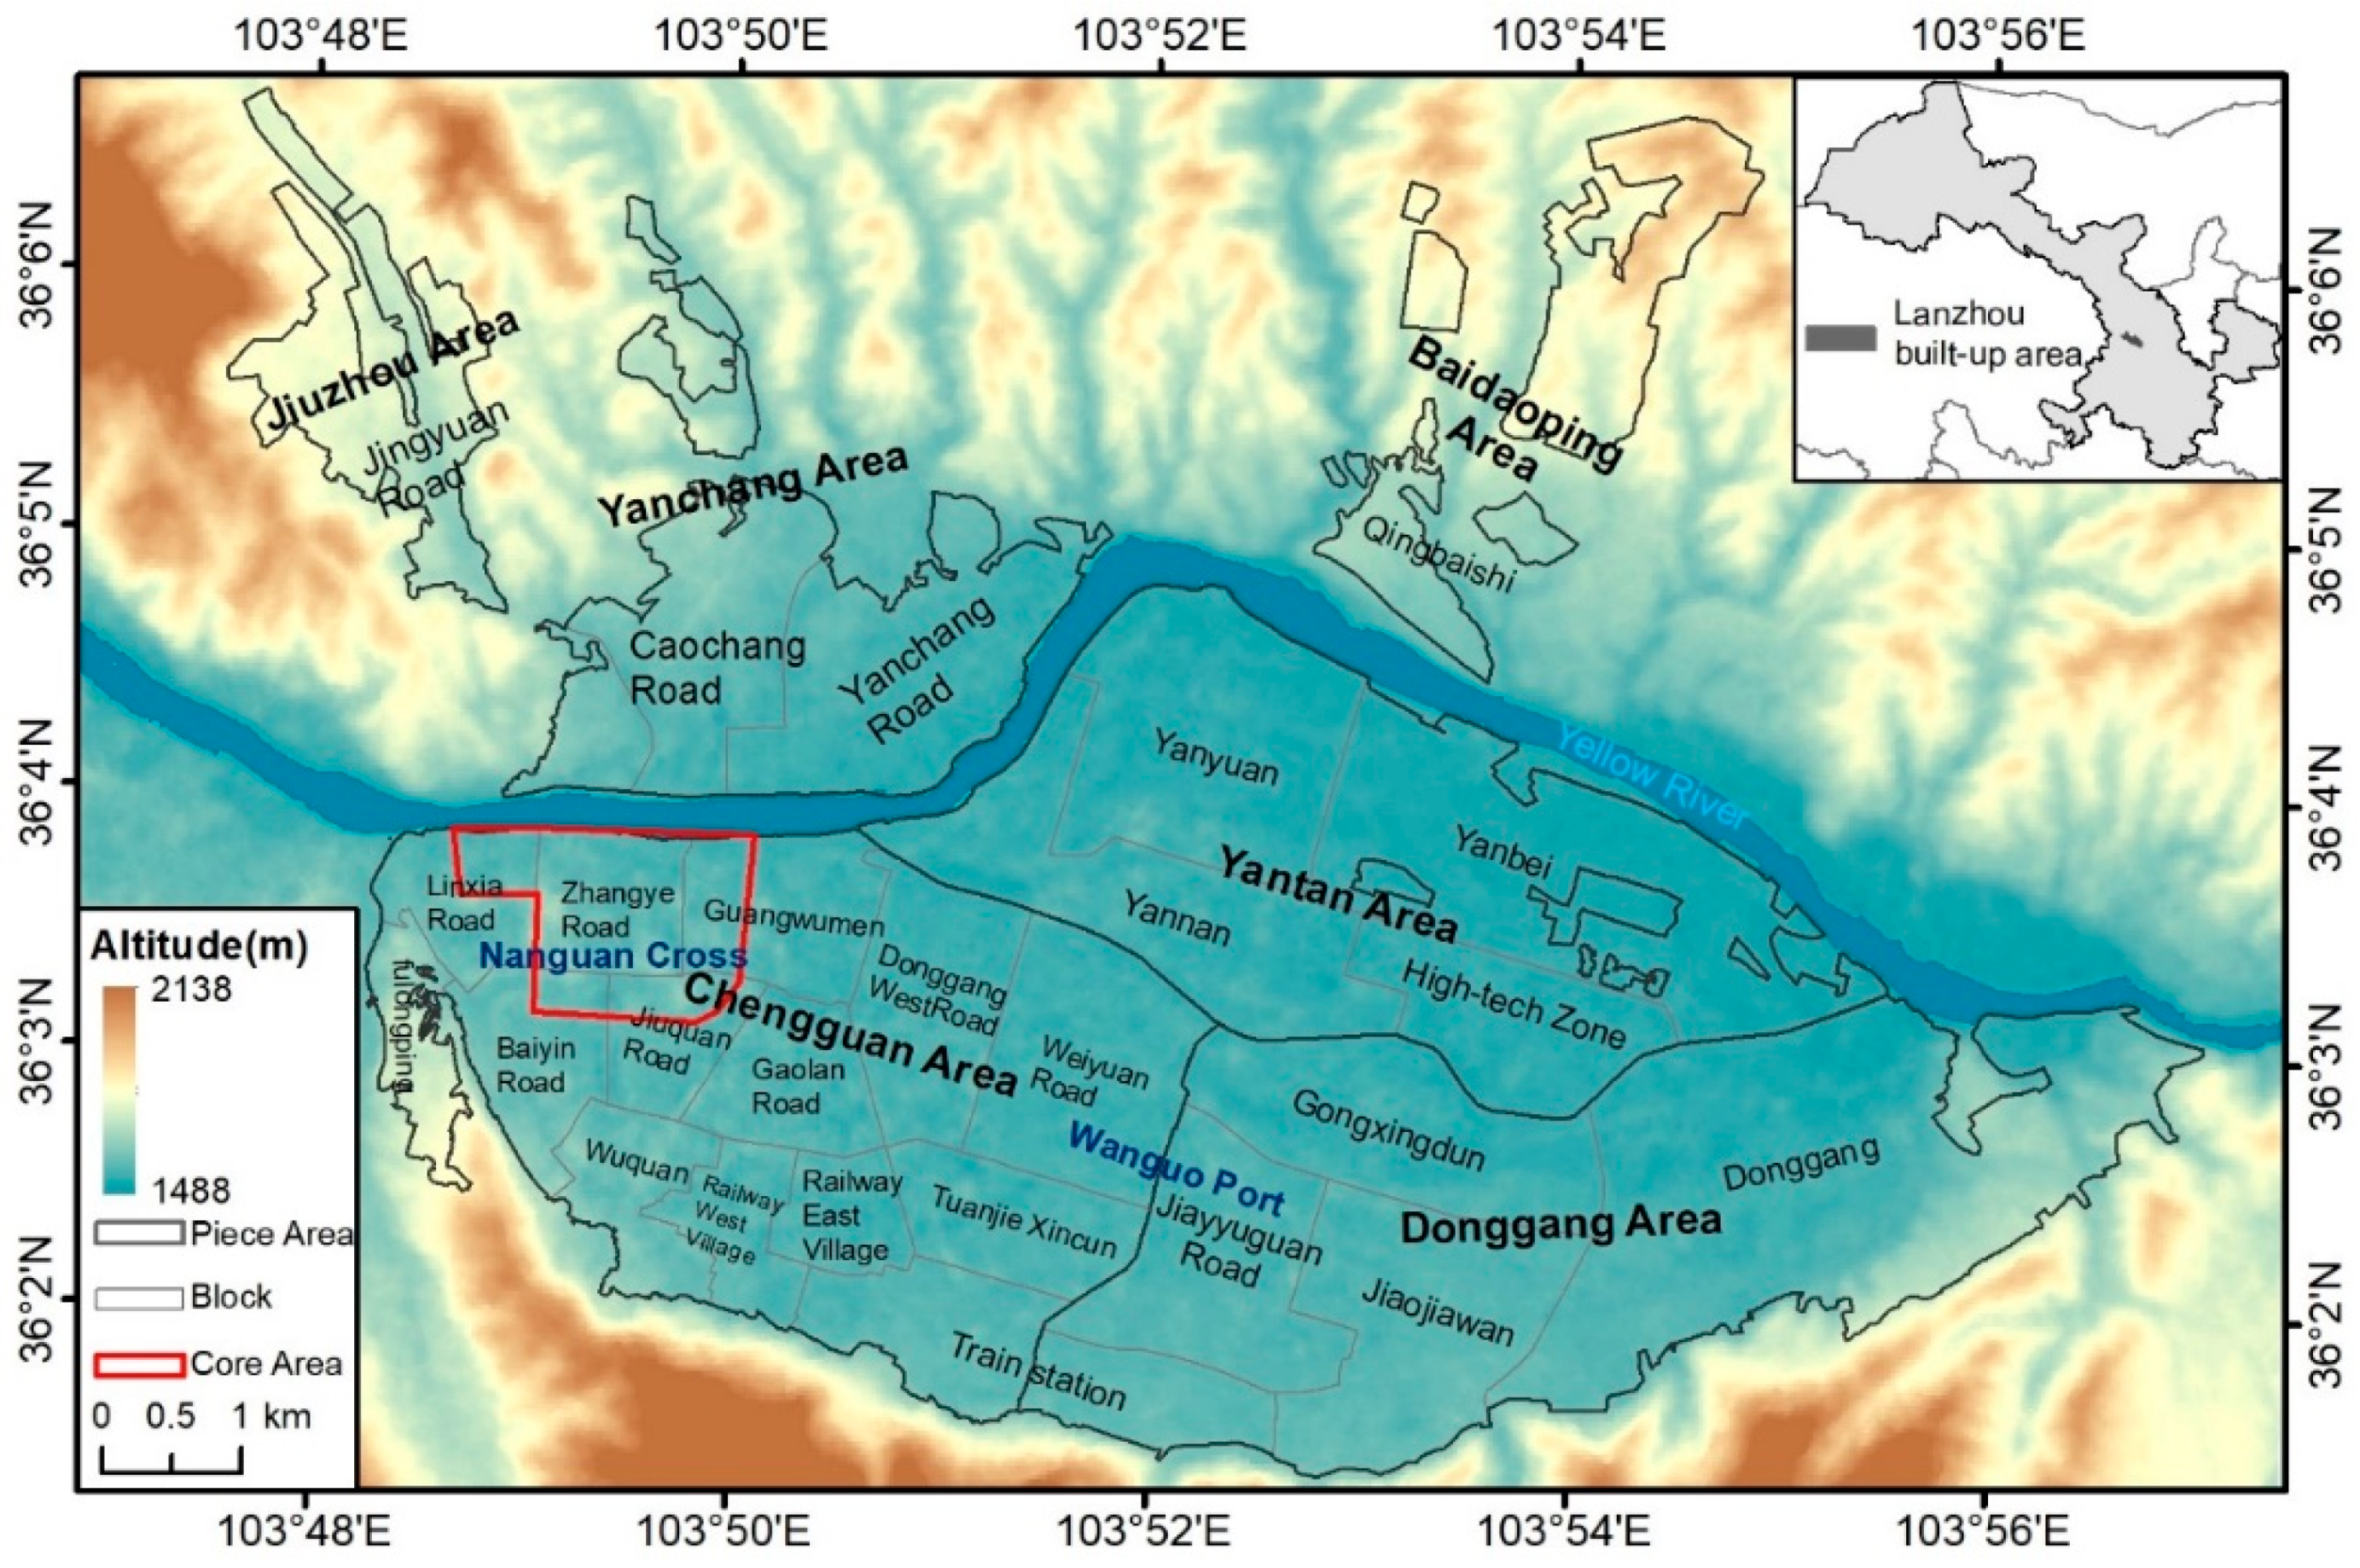
2. Study Area
3. Materials and Methods
3.1. Data Sources and Extraction of the City Three-Dimensional Information
3.2. Analysis of Urban Expansion
3.2.1. Building Density
3.2.2. Floor Area Ratio
3.2.3. Urban Vertical Expansion Speed
3.2.4. Fluctuation Degree
3.2.5. Skyline
4. Results
4.1. Horizontal Urban Expansion
4.2. Vertical Urban Expansion
4.2.1. Changes in Building Height
4.2.2. Building Density and Floor Area Rate Change
4.2.3. Vertical Expansion Speed
4.2.4. Changes in the Appearance of the City
5. Discussion
5.1. Factors Affecting the Three-Dimensional Expansion of Chengguan District
5.2. Three-Dimensional Expansion and Existing Problems in Chengguan District
6. Conclusions
Author Contributions
Funding
Conflicts of Interest
References
- Sarvestani, M.S.; Ibrahim, A.L.; Kanaroglou, P. Three decades of urban growth in the city of Shiraz, Iran: A remote sensing and geographic information systems application. Cities 2011, 28, 320–329. [Google Scholar] [CrossRef]
- Koziatek, O.; Dragićević, S. iCity 3D: A geosimualtion method and tool for three-dimensional modeling of vertical urban development. Landsc. Urban. Plan. 2017, 167, 356–367. [Google Scholar] [CrossRef]
- Chung, U.; Choi, J.; Yun, J.I. Urbanization effect on the observed change in mean monthly temperatures between 1951–1980 and 1971–2000 in Korea. Clim. Chang. 2004, 66, 127–136. [Google Scholar] [CrossRef]
- Fan, P.; Xie, Y.; Qi, J.; Chen, J.; Huang, H. Vulnerability of a coupled natural and human system in a changing environment: Dynamics of Lanzhou’s urban landscape. Landsc. Ecol. 2014, 29, 1709–1723. [Google Scholar] [CrossRef]
- Seto, K.C.; Burak, G.; Hutyra, L.R. Global forecasts of urban expansion to 2030 and direct impacts on biodiversity and carbon pools. Proc. Natl. Acad. Sci. USA 2012, 109, 16083–16088. [Google Scholar] [CrossRef] [Green Version]
- Han, L.; Zhou, W.; Li, W. Increasing impact of urban fine particles (PM2.5) on areas surrounding Chinese cities. Sci. Rep. 2015, 5, 12467. [Google Scholar] [CrossRef] [Green Version]
- Zhou, W.; Jia, W.; Cadenasso, M.L. Effects of the spatial configuration of trees on urban heat mitigation: A comparative study. Remote Sens. Environ. 2017, 195, 1–12. [Google Scholar] [CrossRef]
- Li, B.; Liu, Z.; Nan, Y.; Li, S.; Yang, Y. Comparative analysis of urban heat island intensities in Chinese, Russian, and DPRK regions across the transnational urban agglomeration of the Tumen river in northeast Asia. Sustainability 2018, 10, 2637. [Google Scholar] [CrossRef]
- Galster, G.; Hanson, R.; Ratcliffe, M.R.; Wolman, H.; Coleman, S.; Freihage, J. Wrestling sprawl to the ground: Defining and measuring an elusive concept. Hous. Policy Debate 2001, 12, 681–717. [Google Scholar] [CrossRef]
- Frolking, S.; Milliman, T.; Seto, K.C.; Friedl, M.A. A global fingerprint of macro-scale changes in urban structure from 1999 to 2009. Environ. Res. Lett. 2013, 8, 024004. [Google Scholar] [CrossRef]
- Fan, C.C. The vertical and horizontal expansions of China’s city system. Urban. Geogr. 1995, 20, 493–515. [Google Scholar] [CrossRef]
- Long, Y.; Gu, Y.; Han, H. Spatiotemporal heterogeneity of urban planning implementation effectiveness: Evidence from five urban master plans of Beijing. Landsc. Urban. Plan. 2012, 108, 103–111. [Google Scholar] [CrossRef]
- Deng, F.F.; Huang, Y. Uneven land reform and urban sprawl in China: The case of Beijing. Prog. Plan. 2004, 61, 211–236. [Google Scholar] [CrossRef]
- Bagan, H.; Yamagata, Y. Land-cover change analysis in 50 global cities by using a combination of Landsat data and analysis of grid cells. Environ. Res. Lett. 2014, 9, 064015. [Google Scholar] [CrossRef]
- Batty, M.; Besussi, E.; Maat, K.; Harts, J.J. Representing multifunctional cities: Density and diversity in space and time. Built Environ. 2004, 30, 324–337. [Google Scholar] [CrossRef]
- Silva, P.; Li, L. Mapping urban expansion and exploring its driving forces in the city of Praia, Cape Verde, from 1969 to 2015. Sustainability 2017, 9, 1434. [Google Scholar] [CrossRef]
- Kityuttachai, K.; Tripathi, N.; Tipdecho, T.; Shrestha, R. CA-Markov analysis of constrained coastal urban growth modeling: Hua Hin seaside city, Thailand. Sustainability 2013, 5, 1480–1500. [Google Scholar] [CrossRef]
- Zambon, I.; Colantoni, A.; Salvati, L. Horizontal vs. vertical growth: Understanding latent patterns of urban expansion in large metropolitan regions. Sci. Total Environ. 2019, 654, 778–785. [Google Scholar] [CrossRef]
- Zhang, P. Spatiotemporal Features of the three-dimensional architectural landscape in Qingdao, China. PloS ONE 2015, 10, e0137853. [Google Scholar] [CrossRef]
- Zhang, W.; Li, W.; Zhang, C.; Ouimet, W.B. Detecting horizontal and vertical urban growth from medium resolution imagery and its relationships with major socioeconomic factors. Int. J. Remote Sens. 2017, 38, 3704–3734. [Google Scholar] [CrossRef]
- Zhang, W.; Li, W.; Zhang, C.; Hanink, D.M.; Liu, Y.; Zhai, R. Analyzing horizontal and vertical urban expansions in three East Asian megacities with the SS-coMCRF model. Landsc. Urban. Plan. 2018, 177, 114–127. [Google Scholar] [CrossRef]
- Qin, J.; Fang, C.; Wang, Y.; Li, G.; Wang, S. Evaluation of three-dimensional urban expansion: A case study of Yangzhou City, Jiangsu Province, China. Chin. Geogr. Sci 2014, 25, 224–236. [Google Scholar] [CrossRef]
- Soergel, U.; Michaelsen, E.; Thiele, A.; Cadario, E.; Thoennessen, U. Stereo analysis of high-resolution SAR images for building height estimation in cases of orthogonal aspect directions. ISPRS J. Photogramm. Remote Sens. 2009, 64, 490–500. [Google Scholar] [CrossRef]
- Sportouche, H.; Tupin, F.; Denise, L. Extraction and three-dimensional reconstruction of isolated buildings in urban scenes from high-resolution optical and SAR spaceborne images. IEEE Trans. Geosci. Remote Sens. 2011, 49, 3932–3946. [Google Scholar] [CrossRef]
- Zhao, Z.; Duan, Y.; Zhang, Y.; Cao, R. Extracting buildings from and regularizing boundaries in airborne lidar data using connected operators. Int. J. Remote Sens. 2016, 37, 889–912. [Google Scholar] [CrossRef]
- Handayani, H.; Murayama, Y.; Ranagalage, M.; Liu, F.; Dissanayake, D. Geospatial Analysis of horizontal and vertical urban expansion using multi-spatial resolution data: A case study of Surabaya, Indonesia. Remote Sens. 2018, 10, 1599. [Google Scholar] [CrossRef]
- Shi, L.; Shao, G.; Cui, S.; Li, X.; Lin, T.; Yin, K.; Zhao, J. Urban three-dimensional expansion and its driving forces—A case study of Shanghai, China. Chin. Geogr. Sci. 2009, 19, 291–298. [Google Scholar] [CrossRef]
- Zheng, Z.; Zhou, W.; Wang, J.; Hu, X.; Qian, Y. Sixty-year changes in residential landscapes in Beijing: A perspective from both the horizontal (2D) and vertical (3D) dimensions. Remote Sens. 2017, 9, 992. [Google Scholar] [CrossRef]
- He, Q.; Liu, Y.; Chen, Z.; Yin, C.; Tan, R. Simultaneously simulate vertical and horizontal expansions of a future urban landscape: A case study in Wuhan, Central China. Int. J. Geogr. Inf. Sci. 2017, 31, 1–22. [Google Scholar] [CrossRef]
- Zhang, P. Spatial fluctuation of urban architecture. J. Arid Land Resour. Environ. 2016, 30, 51–57. [Google Scholar]
- Anjuke. Available online: http://www.anjuke.com/ (accessed on 7 March 2019).
- China National Standards. Residential Building Code (GB50368-2005); China Architecture & Building Press: Beijing, China, 2005. [Google Scholar]
- China National Standards. Code for Design of Civil. Building (GB50352-2005); China Architecture & Building Press: Beijing, China, 2005. [Google Scholar]
- Scott, D.W. Multivariate Density Estimation: Theory, Practice, and Visualization; John Wiley & Sons: Hoboken, NJ, USA, 2015. [Google Scholar]
- Qiao, W.; Liu, Y.; Wang, Y.; Yuying, L.U. Analysis on the characteristics of three-dimensional urban space expansion in Nanjing since 2000. Geogr. Res. 2015, 34, 666–667. [Google Scholar]
- Liu, S.H.; Shen, Y.F. A probe into the urban sprawl model and its drive mechanism in Shanghai. Econ. Geogr. 2006, 26, 487–491. [Google Scholar] [CrossRef]
- Moreira, F.; Rego, F.C.; Ferreira, P.G. Temporal (1958–1995) pattern of change in a cultural landscape of northwestern Portugal: Implications for fire occurrence. Landsc. Ecol. 2001, 16, 557–567. [Google Scholar] [CrossRef]
- Yixing, Z. On the relationship between urbanization and gross national product. Chin. Sociol. Anthropol. 1988, 21, 3–16. [Google Scholar] [CrossRef]
- Peng, W.; Wang, G.; Zhou, J.; Zhao, J.; Yang, C. Studies on the temporal and spatial variations of urban expansion in Chengdu, western China, from 1978 to 2010. Sustain. Cities Soc. 2015, 17, 141–150. [Google Scholar] [CrossRef] [Green Version]
- Taubenböck, H.; Wiesner, M.; Felbier, A.; Marconcini, M.; Esch, T.; Dech, S. New dimensions of urban landscapes: The spatio-temporal evolution from a polynuclei area to a mega-region based on remote sensing data. Appl. Geogr. 2014, 47, 137–153. [Google Scholar] [CrossRef]


| Classification | Floor | Height (m) |
|---|---|---|
| Low-rise building | 1–3 | ≤9 |
| Multi-story building | 4–6 | 9–21 |
| Middle-rise building | 7–9 | 21–30 |
| Small high-rise building | 10–16 | 30–50 |
| High-rise building | 17–40 | 50–100 |
| Ultra-high-rise building | >40 | >100 |
| 1975 | 1987 | 1998 | 2007 | 2018 | ||||
|---|---|---|---|---|---|---|---|---|
| Area (km2) | 25.6 | 30.98 | 40.52 | 49.97 | 58.69 | |||
| Change rate (km2/a) | 0.45 | 0.87 | 1.05 | 0.79 | ||||
| Year | 1975 | 1987 | 1998 | 2007 | 2018 | |||
|---|---|---|---|---|---|---|---|---|
| Weighted average height (m) | 6.12 | 7.87 | 9.96 | 12.71 | 21.20 | |||
| Weighted average height change rate % | 28.59 | 26.56 | 27.61 | 66.80 | ||||
| Volume (108 m3) | 0.57 | 0.84 | 1.41 | 2.16 | 3.26 | |||
| Volume change rate (106 m3/a) | 2.28 | 5.10 | 8.37 | 10.00 | ||||
© 2019 by the authors. Licensee MDPI, Basel, Switzerland. This article is an open access article distributed under the terms and conditions of the Creative Commons Attribution (CC BY) license (http://creativecommons.org/licenses/by/4.0/).
Share and Cite
He, S.; Wang, X.; Dong, J.; Wei, B.; Duan, H.; Jiao, J.; Xie, Y. Three-Dimensional Urban Expansion Analysis of Valley-Type Cities: A Case Study of Chengguan District, Lanzhou, China. Sustainability 2019, 11, 5663. https://doi.org/10.3390/su11205663
He S, Wang X, Dong J, Wei B, Duan H, Jiao J, Xie Y. Three-Dimensional Urban Expansion Analysis of Valley-Type Cities: A Case Study of Chengguan District, Lanzhou, China. Sustainability. 2019; 11(20):5663. https://doi.org/10.3390/su11205663
Chicago/Turabian StyleHe, Sijia, Xiaoyun Wang, Jingru Dong, Baocheng Wei, Hanming Duan, Jizong Jiao, and Yaowen Xie. 2019. "Three-Dimensional Urban Expansion Analysis of Valley-Type Cities: A Case Study of Chengguan District, Lanzhou, China" Sustainability 11, no. 20: 5663. https://doi.org/10.3390/su11205663