1. Introduction
The main aim of this paper is to investigate the average daily motorized mobility of single vehicles—so not an aggregated motorized mobility as collected by some statistics—by using private motorized vehicles in Italy, with related trends; thereafter, to compare these data with those obtained from other countries, making use of both existing research studies and directly collected data; the final aim is to understand both the compliance of daily activities based on the use of automobiles with the autonomy of batteries (range) and to calculate some economic outcomes.
This study aims therefore at providing a multisource data analysis, including direct data collection, regarding daily average distances covered with motorized mobility, light-duty road vehicles in particular with a look also at heavy-duty ones.
The results might be used as a basis for policies involving a shift towards new propulsions for road vehicles (Gerboni R. et al., 2017 [
1]): namely, electric motors or plug-in hybrid powertrains.
In urban and metropolitan contexts, both pollutants, when surpassing existing thresholds, and the availability of charging spots—wired or wireless—in addition to future possible areas for charging when driving (CWD), are frequently the most relevant variables for a driver who has to choose the proper traction, and therefore the powertrain to acquire.
As far as possible (e.g., 90–95% of electric recharging, according to results provided by eCo-FEV, 2015 [
2]) charging points are expected to be placed and used with slow electric charging either at home or in extended parking areas of companies, universities, public institutions, markets, interchange areas (park and ride), and stadiums; a smaller market (5–10%) if left thereafter to the rapid and fast electric charging on generic public land, given the shorter time usually available for parking, moreover paying, on public metropolitan areas as well as the more expensive (than slow charging) and time-constraining car stay (because the parking area is shared).
Charging spots might be placed even in the countryside, with a focus on more extended coverage needs. The most flexible motor vehicle—also for extra urban trips—is the rechargeable hybrid one (PHEV) because of user needs (Dalla Chiara B. et al., 2018 [
3]) and—in some areas—the fact a diffused charging network outside cities cannot be imagined at present or in the short-medium term: Italy has been covered with diesel-gasoline stations in almost 20 years, entailing lower fuelling times than that required for electric recharging.
Whenever a user could not afford the more flexible plug-in vehicles, which allows him to use both the electric traction within a city and the traditional internal combustion engine (ICE) outside it, he may avail himself of the full-electric vehicles in a sharing option; in this context, electric car-sharing might be a good path towards a future of more flexible—though more expensive—automobiles.
However, regardless of whether the driver decides to use electric traction within an urban center for personal economic reasons or environmental ones, more frequently imposed by the public administration, his usual daily trips (i.e., covered distances) and daily scheduling needs to be compared with the typical autonomies of electric batteries, for which abundant technical and commercial sheets are available. These autonomies typically reach 300–350 km approximately, sometimes 400 km, for a vehicle up to around 1.5 t of total mass on the ground, in the most optimistic options, without specific needs related to air conditioning and heating within the vehicle.
As a matter of fact, according to our analysis, a more extended number of variables influence the propensity of drivers to use electric vehicles or just the electric traction as an option for plug-in hybrid vehicles. These also influence the propensity to acquire either battery electric vehicles (BEV) or hybrid ones as alternatives to the traditional thermic engines (diesel or gasoline based). We deem that the main recurrent variables can be:
Environmental sensibility and, more importantly, constraints, i.e., when the concentration of pollutants in a city overcomes existing thresholds (e.g., in the European Union, under the 21 May 2008 Directive 2008/50/EC of the European Parliament and of the Council regarding ambient air quality and cleaner air for Europe), which have inhibited the use of Euro 0 up to 4, sometimes even Euro 5 diesel engines in the winter of 2018 in some European cities;
Energy cost for electric traction and the alternative fuel cost for engine propulsion per distance unit;
Availability of charging spots either at home, at the workplace parking areas or in public ones (park and ride areas, restaurants, stadiums, etc.);
Price of the electric/hybrid vehicles and their maintenance costs;
Range or autonomy of the battery compared to that of the tank;
Daily scheduling of one’s daily activities and their compliancy with the parking and recharging times during daylight or nighttime in case of a shared parking area: i.e., one not belonging to an individual;
Actual availability of a charging spot compliant with the drivers’ needs, in terms of power, recharging time and distance to be covered;
Possibilities for solving the risk associated with the exhaustion of the battery in the case of full electric vehicles, whose recharging is more complex than just pouring a liquid into a tank (refueling);
Risk aversion;
Actual independence from electricity, on the one hand, or crude-oil on the other, associated with different model options (full electric instead of hybrids).
In this paper, we therefore address just one of the abovementioned variables, though it has a great influence on most of the others: the compliancy of pure electric traction, and therefore of the autonomies of batteries (for PHEV or BEV), with the trips of road vehicles, mainly automobiles. We did not focus on the fact that such distances may be covered by full electric vehicles or with just the electric traction of a rechargeable (i.e., plug-in) hybrid-electric one, the latter being used most likely with an electric motor within an urban context and with the ICE when traveling outside the city. We just wanted to understand whether the aims and constraints on oil independence—such as those imposed in the EU, U.S., and Japan—rather than those concerning pollutants, typically applied in some metropolitan contexts, might be compliant with the daily trips of drivers, considering mainly the charging time availability during nighttime at home or during daylight at the workplace. If both these charging possibilities are not available for a driver, this analysis is probably not relevant, as the driver would not have to make this choice for an automobile, focusing his attention instead on a traditional one equipped with an ICE or a car sharing option, in case of personal motorized mobility, or on public transport. We also want to understand if these daily trips have varied much in recent years.
We are well aware that the ‘average distances’ do not represent the actual distribution of daily runs of road vehicles; yet similar distributions of daily distances covered by automobiles reported in different studies indicate that a high percentage of trips respond to specific features; therefore, as discussed below, a road vehicle can probably use electric traction for a high percentage of shorter daily trips throughout the year and the ICE for a few days, typically during longer trips at weekends. This seems to be the most flexible solution, according to the real data directly collected and that reported in the literature. Some deeper considerations will be provided on this aspect.
After introducing a general overview of motorized mobility by road in Italy, the study compares data from other studies to provide an overview on average daily driving distances. This allows us to show how different recent analyses converge on a limited range of average distances covered daily by Italians on the road, which seems compliant with ranges allowed by electric batteries when the possibility to recharge each day exists. It also allows for an estimation of the average distances of vehicle runs in both urban and non-urban contexts, with the former compliant with electric traction and the latter with the range of tanks for ICEs.
Subsequently, average distances in some EU Countries are taken from the literature, and the results are also compared with U.S. data. Finally, the study extends the analysis on trends in road-vehicle usage to an international context, addressing average daily distances covered also for freight transport in some EU countries to provide a further basis for comparison and for understanding whether daily motorized mobility can be considered as a stable phenomenon.
Having explored the average distances covered for passenger mobility and, in a more general way, for freight, the link to the usage of electric traction—whether for full electric or hybrid road vehicles—implicitly emerges, once the range of batteries and recharging time features are examined in the literature. A common ground for shifting a part of the present mobility, satisfied only by ICEs, towards electric traction, even PHEVs, is thereafter provided. The average distances in relation to the main features of electric or hybrid vehicles are highlighted, namely, for their driving range and recharging times. These are useful also for supporting a viable shift of automobiles based on ICEs towards flexible hybrid electric ones equipped with plug-in solutions (including conductive and inductive charging), without the need to change driving behavior; alternatively, short distances can be satisfied by full electric vehicles (BEV), even shared, while still leaving longer distances to traditional automobiles. The economic effect of this possibility is quantified in the final section. Our analysis and related data might also be used as a basis for deducing a market share for electric traction, that for BEV results relatively limited: less than 10% of the overall vehicles within 10 years (2030).
2. Automotive Companies and Sustainable Innovation, Market Opportunities, and Actual User Needs
For a number of years, many studies have highlighted that car makers are investing resources in the transition to alternative fuel vehicles (Aggeri et al, 2009 [
4]; Avadikyan et al., 2010 [
5]; Hensley et al., 2009 [
6]; Plots, 2014; Skippon and Garwood, 2011 [
7]), with some researchers predicting that HEV technologies will gradually gain popularity in the market (Chan, 2007 [
8]). For this reason, the power of the incremental innovation trajectory will remain strong in the automotive industry (Magnusson et al., 2009 [
9]). By introducing innovations, Swann (2009) [
10] identified an incentive to innovate in the competitiveness of the market share and an opportunity for the investments firms can make to support innovation.
Within this panorama of innovation, car makers recognize their role in making companies more sustainable and recognize the need to convert their production to cleaner or less-polluting products (Lozano, 2013 [
11]; Nilsson, 2012 [
12]; Wesseling, 2015 [
13]); however, we need to verify that this transition can be compliant with existing travelers’ daily behavior, which is the main scope of this paper.
Christensen (2011) [
14] underlined that the pressure on the automotive industry to innovate is created by a combination of consumer demand for fuel efficient automobiles (though not necessarily electric vehicles), European Union legislation on CO
2 emissions of newly registered automobiles (European Commission, 2009), and the incentives or subsidies implemented by national and local authorities to get car-users to purchase cleaner and more fuel efficient vehicles (Christensen, 2011) [
14].
The automotive industry therefore represents fertile terrain for progress in innovation, especially with the introduction of alternative fuels and alternative powertrain technologies (Zapata and Nieuwenhuis, 2010 [
15]).
Increasing attention is being paid to sustainability and environmental issues. Porter and Kramer (2011) [
16] invited corporations to redefine their goals to create shared value, trying to push them to move beyond profit as a primary objective. In the industrialized nations, as pointed out by Hart (1997) [
17], the automotive companies are ‘going green’, having realized they can reduce pollution and increase profits simultaneously. However, car makers “have to respond to increasingly strict governmental regulation, environmental and social expectations by applying management strategies” (Koplin, 2006) [
18].
Some factors more than others influence the development of these technologies by car makers, such as: investment costs for the innovation process and the conversion of production; EU emission rules (sanctions for the CO2 emission level of production and eventual incentives for production conversion); competition among car makers focusing on these technologies, with some of them declaring they have been converting their production for a few years now, thereby satisfying new consumer behavior and consumer demand, which is currently largely derived from the mid-high price range. However: “When individuals consider the adoption of sustainable lifestyles, they engage with an increasingly complex decision-making process” (Young et al., 2010).
The impact of purchase price, fuel efficiency and fuel prices on buying decisions is highlighted in numerous studies and included in many models of consumer buying behavior (Plots, 2014; Train and Winston, 2007; Santini and Vyas, 2005; Shende, 2014).
Lane and Potter (2007) point out that car purchases are predominantly driven by financial and performance considerations including price, fuel consumption, comfort, size, practicality, and reliability. In addition, as suggested by numerous studies, we should consider the subjective psychological factors, which include attitudes, lifestyle, personality, self-image, risk-perception, corporate culture, and company image, considering also that some drivers like to advertize their ‘green’ credentials by using highly observable eco-products (Lane and Potter, 2007; Skippon and Garwood, 2011; Graham-Rowe et al., 2012; Axsen et al., 2012; Schuitema et al., 2013; Burgess et al., 2013; Rezvani et al, 2015).
In particular, studies on EV purchase intentions highlight affective or hedonic attributes such as pleasure and joy (Schuitema et al., 2013), consumer emotions (Moons and De Pelsmacker, 2012; Ajzen, 1991; Richins (1997), the perception of supportive policy, knowledge, and perceived behavioral control; social norms have also been shown to significantly influence consumer intentions to adopt EVs (Kahn, 2007; Lane and Potter, 2007; Ozaki and Sevastyanova, 2011; Egbue and Long, 2012; Moons and De Pelsmacker, 2012; Rezvani et al., 2015).
The paper by Hardman S. et al. (2018) [
19] presents a literature review of studies that investigate infrastructure needs to support the market introduction of plug-in electric vehicles (PEVs).
In this field, it is indeed necessary to consider the increasing consumer involvement towards sustainability and environmental issues, especially air pollution and attention to health and the degree of product innovation. Other factors that could considerably influence consumer choices are the penalties to nations for not reducing CO2 emissions from road transport in cities—discussed later in the paper—and the consequent new steps to reduce pollution in the city centers, as well as apprehension regarding oil resource depletion in the future with the possibility of increasing prices.
The PHEV may have desirable attributes other than fuel savings (Heffner et al., 2007; Lemoine, 2008).
Then, according to mentioned literature, mainly economic, the consumer choices about PHEV and full electric vehicles (BEV) are primarily influenced by:
- (a)
Satisfaction of the consumer’s daily needs, primarily the possibility given the daily distances to recharge the vehicle sometime during the day (slow charging), at night (slow charging) or from time to time (rapid or fast charging);
- (b)
Costs, including purchase prices, taking account of possible government or car manufacturer subsidies, and operational costs;
- (c)
Powertrain with related fuel efficiency;
- (d)
Availability of charging stations in public and private areas;
- (e)
Services provided by the car manufacturers.
3. State of the Art: The Recent Evolution of Daily Mobility
3.1. State of the Art on Daily Mobility and Related Trends
Technological progress—mainly in the so-called green-motors and ITS fields (Böhm et al., 2010 [
20]), in an attempt to reduce dependence on the near-monopoly of crude oil (for example, nearly 94% in terms of tons of oil equivalent (toe) in Europe and 93% in the U.S. in 2017 and 2018) and to reduce air emissions—has favored the development of both new-ICE and electric motors for road vehicles, also interconnecting them with infrastructures for various aims, including booking facilities for recharging the batteries. All this has mainly taken place since the beginning of the 21st century in most industrialized countries, with much higher emphasis in recent years. In the same period, traffic demand in the EU and the U.S. seems to have reached a period of stabilization (
Figure 1,
Figure 2 and
Figure 3).
The main aim of this paper is to investigate the average daily motorized mobility of single vehicles—so not an aggregated motorized mobility as shown in
Figure 1,
Figure 2 and
Figure 3, which help only for framing the issue—by using private motorized vehicles in Italy and, more generally, heavy-duty vehicles, with related trends; thereafter, to compare these data with those from other countries, making use of both existing research studies, including technical reports, and directly collected data; the final aim is to understand both the compliance of daily activities based on the use of automobiles with the autonomy of batteries (range) and to calculate some economic outcomes.
The results add also a number of potential results of interest for transport research: from energy consumption, according to daily covered distances, to the most appropriate types of propulsions, either by ICEs or electric motors with BEVs or by hybrid powertrains, namely PHEVs. The actual usage of roads can also be useful for road pricing policies (Directive (EU) 2019/520 on the interoperability of electronic road toll systems and facilitating cross-border exchange of information on the failure to pay road fees in the Union) in order to calculate yearly well-balanced vehicle taxation per traveled km, computed on actual distances covered by road users, at least at the national level, that we obtain in this paper. As is well-known, road pricing can be a substitute to the fixed taxation adopted until now by numerous countries, whether an automobile is used on public roads or parked in a garage during the year the tax is paid. However, road pricing needs a sound analysis of actual traveled distances so that, on average, a national income can be adequately calculated.
3.2. State of the Art on Current Use of Road Vehicles and Range Requirements (Demand)
To support both analyses on energy issues—either consumption or emissions—and the development of BEVs or of just the electric traction used in PHEVs, many studies have investigated the current use of road vehicles. The main literature on these aspects is discussed below.
The European Commission introduced the concept of Sustainable Urban Mobility (SUMPs) as a new planning paradigm with a focus on people’s needs. The program encourages the development of alternative fuels such as electricity, hydrogen fuel cells, and natural gases to reduce the negative impacts of both passenger transport and private, public, and freight transport in terms of the environment and emissions posing a health risk (Arsenio et al., 2016 [
21]).
As outlined in (Tamor et al., 2015 [
22]), a reliable estimation of the potential for electrification of personal automobiles in a given region is dependent on a detailed understanding of vehicle usage in that region. Studies recording details of individual vehicle usage over a sufficient period are available for a few regions in the U.S. In their paper, the authors compare statistical characterizations of four such studies—three in the U.S., one in Germany—and find remarkable similarities between them: the Puget Sound Regional Council Traffic Choices Study (PSRC, 2008 [
23]); 446 vehicles in the greater Seattle area, the Commute Atlanta Value Pricing Program (Guensler and Williams, 2002 [
24]; Ogle et al., 2005 [
25]); 651 vehicles in greater Atlanta, and the Europe Field Operations Test (euroFOT, 2012 [
26]); 100 midsized Ford vehicles in several German cities. This commonality would provide, according to Tamor et al., 2015 [
22], high confidence that ensemble data can be used to predict the spectrum of usage and acceptance of alternative vehicles in general.
The relationship between location and household vehicle miles of travel was previously studied for a dense city (Chicago) by Lindsey et al. (2011) [
27], who mainly considered the effects on energy consumption.
The recent availability of innovative engines and electric motors for vehicles, in addition to conventional ICEs, such as HEVs, PHEVs, and BEVs of varying designs and prices, induced many authors to investigate the relationship between their features and trip needs where traveled distance is a relevant factor. In Arslan et al. (2014) [
28], the focus is on PHEVs, whereas Axsen and Kurani (2013) [
29] explored user preferences for the whole range of EVs. Their study also reported some user motivations and implications for policy. Many studies have recently become available concerning daily mobility and user preferences for EV from various specific perspectives (Pucher et al., 2007 [
30]; Metz, 2010 [
31]; Axsen et al., 2013 [
32]; Hidrue et al., 2011 [
33]; Jensen et al., 2013 [
34]; Le Duigou et al., 2014 [
35]; Plötz et al., 2014 [
36]; Van Rijnsoever et al., 2013 [
37]; Ziegler, 2012 [
38]; Hjorthol et al., 2014 [
39]).
Dalla Chiara, Bottero, Deflorio, Filidoro (2014) [
40] and Dalla Chiara, Pellicelli (2016) [
41] review the literature and some analyses on typical trips of freight vehicles—on the basis of the international, national or local trips—and then present a range of competitiveness of electric vehicles on the basis of demand analysis. Performances and quantitative limitations on the supply side: range (autonomy), batteries, power, performances, consumption, are outlined, as well as recharging possibilities most suitable to user needs.
Dalla Chiara et al. (2018) [
3] present a methodology and an analysis applied to a real-life dataset, which refers to an extended period that lasted more than one year pertaining to trips undertaken in Europe by more than 1000 vehicles. The main scope was to focus on variables concerning the duration and length of the trips, the idle times, and the energy consumed by engines. The study provides a quantitative analysis of the energy needs, obtained over a wide range of usage of road vehicles, and attempts to correlate them with the opportunities of recovering energy during the idle time detected over real-life 24 h driving cycles, assuming the availability of intermediate charges.
In Stark J., Link C., Simic D., Bäuml T. (2015) [
42] the analysis is focused on range as a crucial technical feature of EVs: many of the existing studies underestimate range requirements, as they are based on one-day analyses and on mean values of daily trip distances. This data is not appropriate to answer questions on user needs; longitudinal mobility data is more suitable.
We therefore try to sustain our proposal with subsequent analyses: according to our results, reported below, at the current stage of technology a set of new vehicles seems to be the most viable approach for satisfying actual driver requirements, without modifying daily travel behavior. In our opinion, and supporting our ideas with subsequent data, this set can flexibly satisfy both short daily travel needs, with an electric traction, and longer trips with propulsion by ICEs, as well as direct battery charging or indirect charging through the ICE itself. The demand for such motorized mobility, which must be compliant with constraints on CO2 emissions and greater independence from crude-oil in many countries, in addition to taking into account constraints on urban motorized accessibility in many cities, can be sustainably satisfied in multiple ways: a hybrid bi- or multi-fuel motor vehicle with independent engine and independent recharging, allowing use of the electric engine on short trips and fuelled engine propulsion for longer ones, would be a good synthesis, though more expensive than both BEV and ICE vehicles. This approach might allow the driver to maintain the free mobility guaranteed in the last century by ICE vehicles, mitigating at the same time overall consumption and emissions.
Another important aspect related to consumptions, both from the company and the customer (car owner) or fleet manager (in case of shared mobility) viewpoints is the total cost of ownership (TCO) of these new vehicles, which combine an electric motor with a traditional one in a unique powertrain. Some relevant aspects have already been analyzed by Rusich A. and Danielis R. (2015) [
43] when assessing the total cost of ownership, social lifecycle cost and energy consumption of 66 cars with different fuel/powertrains available in Italy in 2013. That work also focused on the importance of subsides for low emission vehicles, which helps them penetrate in the market at a lower price than the others.
In addition, the following analysis is aimed at evaluating how the TCO of a medium-size vehicle (SUV) may vary depending on six different tractions: gasoline and diesel traditional ICE, gasoline and diesel HEV, and gasoline and diesel PHEV. Calculations are carried out according to our analysis on the average daily and annual traveled distances, assuming that plug-in vehicles first use electric autonomy (43 km, compliant with our results) and then continue with the ICE. In order to have maximum efficiency, electric batteries are assumed to be charged every day, in a slow charging way, typically during night-time; the main alternative, which is still as slow as electric charging, would be during the working time in parking areas at the workplace, if feasible.
3.3. State of the Art on Plug-in Electric Vehicles, Hybrid Architectures, and Ranges (Supply)
Furthermore, the European Commission has set environmental goals to reduce air pollution and greenhouse gas emissions; in order to contribute to more energy efficiency and less fossil dependency, several studies have confirmed that PHEVs have this potential. Concerning the diffusion of electric traction, a study by Wikström M., Eriksson L. and Hansson L. (2016) [
44] confirms that the policy entrepreneur affects and accelerates the introduction of PHEVs in local public authorities, assesses the travel demand, finds appropriate applications, and supervises the deployment process.
The Chinese market is important for the objective of reducing the prices of electric traction systems by exploiting scale economy. It is the largest consumer and producer of automobiles worldwide, and it has the potential to change the economic incentives for emerging technology development worldwide. Even though EV adoption in China might increase local emissions, global emissions from automobiles could nevertheless plausibly decrease as a result of increased development and adoption of electric vehicle technology worldwide (Helveston J.P., Liu Y., Feit E.M., Fuchs E., Klampfl E., Michalek J.J., 2015 [
45]).
In Carley at al. (2013) [
46], the authors examine consumer stated intent to purchase plug-in electric vehicles and assesses the factors that increase or decrease interest.
Tal G., Nicholas M. A, Davies J., and Woodjack J. (2014) [
47] deeply analyzed the growing plug-in electric vehicle (PEVs) market features, new models of battery electric vehicles (BEVs) and plug-in hybrid vehicles (PHEVs) with varying battery sizes and electric driving range. They wondered to know how these different models are used in the real world. A common assumption in PEV impact analysis is that PEV owners will maximize their vehicle utility by appropriately sizing their battery to their driving needs and by charging their vehicles as much as possible to recover the cost of the vehicle purchase. Based on these assumptions, the authors expected a high correlation between PHEV owners usage of the vehicle and the number of plug-in events, and they expected drivers of PHEVs with small battery to plug in more than owners of vehicles with a larger battery and similar driving patterns. This paper examines the assumptions presented using a survey of more than 3500 PEV owners conducted in California from May and June 2013. The results show that small battery PHEV electric vehicle miles traveled (eVMT) are lower than larger range PHEV or BEVs not only because of the battery size but also as a result of the public charging availability and charging behavior. Higher electric range PHEV and BEV drivers charge more often and report more charging opportunities in the same areas that smaller battery PHEVs could not find chargers. This paper in particular is quite related and useful with reference to the aims of our work.
The importance of local transport policies on the diffusion of HEV and E-vehicles is highlighted by Hagman J., Ritzén S., Stier J.J., and Susilo Y. (2016) [
48]. In fact, TCO depends strictly on local subsidies that help to increase the use of battery electric vehicles (e.g., economic and regulatory environments, existing fuel/road infrastructure); nevertheless, the most appropriate business models are based on consumer conditions (e.g., vehicle performance and applications, attitudes, lifestyle, personality and self-image, price, fuel economy, comfort, size, practicality, and reliability). Below, the present study presents an automobile cost model based on driver habits and existing economic conditions in order to better fit real driving data.
Over the last few years, the efforts regarding technological improvements and innovation in transport have been intensified, and fleets of vehicles using renewable sources is now the new trend for public authorities, non-profit organizations and many private companies promoting sustainable development. A study by Margaritis D., Anagnostopoulou A., Tromaras A., and Boile M. (2016) [
49] also provides some future perspectives on freight transport. In fact, modern composite materials for the chassis of the EVs could reduce the weight without any compromise to crash safety and vehicle stability.
Loss of weight is actually a manufacturing target to allow the vehicle to maintain its crash compatibility, along with other advantages such as lower rolling resistance, brake power and energy saving. Moreover, the production of EV modular concepts on a cabin-chassis design for a city vehicle of max 7.5 t gross weight is a current industry need in order to deliver different goods to customers. This could achieve reductions to production costs, and consequently make EVs more attractive to fleet operators that own a multi-purpose fleet.
Finally, in Anselma et al. (2019) [
50] different parallel HEV powertrain configurations are assessed for and compared to a conventional automobile: P2 appears to be the most appealing HEV architecture both in terms of CO
2 emission reduction, driving capability and TCO, which seems quite compliant with our final results.
4. Actual Usage of Public Roads, Trip Characterization, and Average Distances: Italian Data
One relevant database derives from ISFORT (“Istituto Superiore di Formazione e Ricerca per i Trasporti” is an Italian institute that operates in the transportation and mobility sector; it has organized three longitudinal studies or observatories—on mobility demand, logistics, and urban mobility—that have collected an extensive amount of data, thereby generating a comprehensive database) (2018) [
51] research, which is focused on Italians’ daily mobility on working days. The database is annually developed with direct interviews of a sample of 12,200 Italians aged 14–80 years. The sample composition aims at acquiring data that can be considered representative of the entire Italian population.
This report shows how the period of consumption contraction, which has characterized the Italian economy over the last eight years, has affected daily trips. In 2008, there were 128.1 million trips on an average working day, while in 2017 this number fell to 97.9 million, a 24% decrease. Additionally, daily passenger-kilometers traveled, the other measure of mobility used, decreased, although less so: from 1561 million in 2008 to 1037.1 million in 2017, a contraction of approximately 34%.
During the monitored period, according to another, institutional, source, the population of Italy increased by approximately 3.2%, from 58.7 million in 2008 to 60.6 million in 2017 (ISTAT, 2017) [
52]. After a long period of continuous growth in road trips, which started after the Second World War, a period of
stabilization, slight decrease, followed by a recent slight increase in demand seems to have begun with the new century.
This contraction of consumption, associated with households’ need to minimise expenses, would suggest that some Italians intend to reduce their use of private cars in favour of generally cheaper public carriers, bicycles or walking, sometimes even motionless communications such as teleconferences, exchanges of e-mails or messages via the web. The ISFORT survey seems to confirm this supposition about a modal shift. Respondents were asked to indicate their future intentions regarding means of transport to be used: 34.0% of those interviewed expressed a propensity to a modal shift away from private cars (32.8% in large cities), but only 9.8% (10.6% in large cities) away from public transport; on the other hand 32.3% (32.6% in large cities) expressed a desire for a future modal shift towards public transport and only 7.6% (10.6% in large cities) towards private automobiles. The propensity to a modal shift towards bicycles has seen a big increment in the past couple of years: 38.8% of the respondents expressed their interest in increasing their use of the bicycle, a consistent increment from the 28.9% in 2015.The modal share for trips on foot was estimated at 22.3% (17.5% in 2008) and by bicycle at 5.2% (3.6% in 2008). However, in analyzing motorized mobility, this propensity to a modal shift is reflected in the actual ISFORT data.
As shown in
Table 1 and
Table 2, from 2008 until 2017 public transport in urban areas has increased by 10%, while in extra-urban areas it is almost constant.
The amount of automobile use has decreased over the years in the urban context; however, if we only consider the motorized means, the percentage of automobile use is steady at around 85%, very similar to the use percentage in extra-urban contexts.
The ISFORT report also investigates public transport use according to city dimensions. Public transport is relevant only in large towns (above 250,000 inhabitants) and middle urban ones (100,000–250,000 citizens), with rates equal to 21.1% and 9.8%, respectively (private automobile rates equal 44.7% and 60.4%). However, this use drops drastically to 4.8% in small cities (population < 100,000 inhabitants), where automobile use is 68.8%.
The modal share of home-work trips was analyzed by the Politecnico di Torino (2013) [
53]. The study was performed on a sample of 880 employees, 83% of whom employ regularly motorized mobility; trips by bicycle or on foot represent 17%. Regarding motorized mobility, 63% of people ride at least one bus to get to work, 49% use their own automobile, and only 8% use a motorcycle or a moped. Note that the sum of the percentages is greater than 100%; this is caused by multimodal trips. For instance, among the Politecnico di Torino employees, 17% of motorized mobility involve both automobile and public transport. The values obtained in the research conducted by the Politecnico di Torino on the use of public transport are greater than those documented by ISFORT, but they refer exclusively to trips to work, which are generally characterized by a higher use of public transport. Furthermore, the Politecnico di Torino is one of the major traffic-attractive poles in Turin; therefore, it is well integrated with public transport by different bus lines and by the automated subway line, besides being not far from the two primary train stations of the city (approximately 15 min on foot).
After this general description of Italian demand features, which reveals 80–85% of daily mobility accounted for by automobile use, our analysis will now deal with trip distance.
This section aims at assessing the average daily distances covered in Italy with a road vehicle, both in urban and extra-urban contexts. It investigates the use of vehicles via an aggregated approach, aimed at identifying the average distance ranges. The results can support the decision-making process regarding the most suitable propulsion or engine features—including plug-in hybrid solutions—of present or future motor vehicles from a demand viewpoint.
The lack of an equivalent structured study that characterizes Italians’ trips requires an analysis, by comparison and merging, of different sources; each study considered refers to a particular sample and provides different information that partially contributes to the overall analytical result.
ISFORT divides trips into three categories (
Table 3), based on distance.
The increase in the weight of urban propensity trips and the consequent decrease in middle and long-distance trips can be partially explained also by the increment of workday recreational trips, which usually entail short distances. In fact, according to ISFORT data, such trips are primarily recreational (41.2% in 2017, 32.7 in 2008). On the other hand, work or study trips have decreased in weight from 35.9% in 2008 to 31.5% in 2017, while trips related to household management have decreased from 31.4% in 2008 to 27.3% in 2017.
Comparable results have been obtained by the survey in the Politecnico di Torino (2013), which, considering only automobiles, estimates a percentage of 64.3% for urban propensity trips (<10 km), 32.9% for the middle-distance trips (10–50 km), and 2.9% for long distance trips (>50 km). If compared to the ISFORT data, the increase in middle distance trips and the decrease in urban propensity trips can be justified by the aim of the trip; the analysis produced by the Politecnico di Torino considers exclusively home-work trips whereas ISFORT investigates every trip scope.
Figure 4 illustrates a diagram based on data from the cited survey (Politecnico di Torino, 2013). 812 people responded to the questionnaire (out of a universe of approximately 1300), all working at university either as teaching staff or in a technical-administrative capacity). The questionnaire related to trip distances (
x axis) and to their frequency as observed in the reference sample (
y axis).
As any expert in transport engineering would expect, there is a reduction in sample frequency with the increase in distance covered. Dividing the first bin (0–5 km) into two other bins (0–2.5 km and 2.6–5 km), the overall percentage is split into 11.7% within 2.5 km and 23.5% within the 2.6–5 km range. This distribution is easily justified by the major inclination towards personal mobility, either on foot or by bicycle, for short distances (0–2.5 km).
According to data from the same survey, the daily average distance covered altogether by automobile is equal to 12.9 km; in urban contexts, this distance is estimated at 6.2 km whereas in extra-urban areas it is 14.4 km. The study by ISFORT determined the daily average distance of a trip as 10.6 km, similar to the distance obtained by the Politecnico di Torino. In contrast, the detailed daily average distance of the ISFORT survey is 4.2 km in urban areas.
Based on the latest available value referred to in the 2017 ISFORT survey, the daily average distance is 25.8 km globally.
For further comparison, data provided by 5T (i.e., Telematic Technologies for Transport and Traffic in Turin, Italy, is a public company that operates in the ITS and info-mobility fields, mainly to manage the traffic monitoring and control system in the Turin metropolitan area) and extracted by Viola (2012) [
54] are reported in
Table 4.
5T data refer to all of the trips without distinguishing among different transport means and considering both weekdays and holidays. It refers to Turin and its metropolitan area; therefore, interregional trips are not included. The reference area for 5T and for the Politecnico di Torino data is nearly identical, but the first sample refers only to home-work trips whereas 5T data include all trip generation scopes. Considering the entire metropolitan area of Turin, the average distance from 5T data is 11.9 km, a bit less than the 13–13.8 km range found by the surveys previously introduced. The average distance considering only the urban area is 4.6 km, a value similar to ISFORT’s (4.2 km) but less than that found by the Politecnico di Torino (6.2 km). 5T distances are on average less than in the Politecnico di Torino data because 5T also considers recreational trips, which are generally characterized by short distances: i.e., 5T data exclude interregional trips and, therefore, long-distance recreational trips.
The national official report provided by the Statistical Office of the Ministry of Infrastructures and Transport (Ministero delle Infrastrutture e dei Trasporti, CNIT, Rome, Italy, 2004) [
55] estimated the
annual average distance by automobile in Italy as 12,326 km. A daily average distance obtained from this aggregated value is close to 34 km. This last figure considers exclusively weekday trips, while the value by the Ministry of Infrastructure and Transport also includes trips for holidays: it includes aggregated data without distinguishing between urban and extra-urban trips but provides information that includes holiday trips, excluded in previous analyses made by other institutions.
Caserini et al. (2013) [
56] provide additional aggregated data. They estimate the annual average travel distances of vehicles, divided by age and fuel, analysing odometer values declared by the automobile owners when they start the selling procedure of their vehicles on specialised websites. The study results depend on an effective correspondence between actual data and the data indicated by the owners regarding the total mileage of their cars; regarding older vehicles in particular, sellers might tend to avoid providing correct odometer data to make the vehicle appear less worn, trying to obtain a higher final price. The reference sample is composed of 32,950 vehicles divided into 18,652 gasoline vehicles from 1 to 16 years old and 14,298 diesel vehicles from 1 to 14 years old, covering the period between June and September 2010. The reference sample is the 1.1% of the automobiles sold in Italy per year; the vehicle age distribution is similar to the distribution indicated in the national database by ACI (i.e., Automobile Club d’Italia, a public society in Italy that publicises and contributes to regulatory issues in the automotive field) for 2011. The actual use of the vehicles is not reported; it is impossible to know whether private vehicles used exclusively for personal purposes constitute the sample or, especially for diesel vehicles, there are some vehicles previously used for freight transport. The developed analysis estimates that gasoline vehicles cover 10,636 km per year, corresponding to 29.1 km per day, whereas gasoil or diesel vehicles cover 18,685 km per year, equalling 51.2 km per day. Weighting the distances by the size of the related subgroups, an annual average distance of 14,129 km is obtained, which corresponds to a daily average distance of 38.7 km.
ACI (2012) [
57] investigates the influence of number of inhabitants of urban areas on average distances by car. Daily average distances are greater in small cities: from 31 km and 3.8 trips on an average working day for cities up to 10,000 inhabitants to 23.2 km and 2.7 trips in cities with more than 250,000 inhabitants.
Finally, data related to the motorway network managed by Autostrade per l’Italia (2013) [
58] have been investigated. These data are quite reliable because they derive from automatic registrations at tolling stations at toll motorway entrances and exits. This sample refers primarily to long-distance trips, including both working and holiday days. Even on motorways, a reduction of traffic flows in recent years has emerged, quantified as a decrease of 7.5% in motorized mobility demand (2012 on 2011), with a decline of light vehicles of 7.3% (going back to the 2003 levels); a slight increase was recorded in 2014 and at the beginning of 2015. Globally, the daily average distance covered on Italian highways is equal to 77.9 km, with a daily distance for light vehicles equal to 72.65 km. Approximately 62% of the light traffic covers a distance of less than 50 km.
Analysis of the average distances shows that different studies, even though they considered different samples and used different approaches, achieved quite comparable results. Specifically, a comparison of all the above-mentioned results shows that the daily average distances traveled by Italians ranges from 25.8 km to 38.7 km and is characterized by an average vehicle trip length between 4.2 and 6.2 km in urban areas and between 11.9 and 26.5 km in extra-urban areas, as summarized in
Table 5 and
Table 6.
The similarity and nearly steady values in recent years of these data are quite useful; however, it is still not enough for our purpose, i.e., a critical review to understand the sustainability of partial or full electrification with consequent economical outcomes.
Furthermore, both the Politecnico di Torino and ISFORT studies found that more than 60% of Italian trips take place within a distance of 10 km whereas only approximately 3% exceed 50 km. Detailed analysis of the results collected by the Politecnico di Torino confirms a decreasing trend in the percentage of the sample covering a given daily distance, but with a slight increase in distances. In
Figure 5 a simple qualitative scheme is presented to relate the distances traveled and their frequency to possible vehicle types (BEV, ICE automobiles, HEV) used to satisfy the different ranges required.
An initial conclusion which implicitly emerges is: urban daily trips, which correspond to a far higher frequency in the yearly usage of automobiles—typically for weekdays between Mondays and Fridays, in some cases also Saturdays—are wholly compliant with the range of BEV, as quoted from the literature and obtained from the authors’ data collection and direct analyses. These distances are in any case compliant with the autonomy of most batteries when plug-in hybrid ICE-electric vehicles are used with their electric traction and not with their ICEs. ICEs are instead preferable for long-range trips, which typically occur a few days a week or during weekends, involving distances that may easily surpass 150–200 kms before the need arises to recharge the battery at home, at the workplace or within the city. Moreover, given the high average percentage of people living in cities and suburbs with respect to the overall population (3/4 in Europe, approximately), the daily trips correspond to the high mass of daily mobility. The possibility of placing electric charging spots in urban or metropolitan areas—such as at home, work, or public parking places—is more feasible and maintainable than elsewhere. The most flexible automobile turns out to be the PHEV; yet for drivers who cannot afford it, BEV-sharing (i.e., a car sharing of plug-in automobiles) may be a good solution, at least during a transitional phase.
5. Comparison of Average Distance in Other Countries and Synthesis
A primary aim of this study has been to provide a structured investigation of average motorized mobility in Italy, as only data from different sources and samples, including those directly collected, were available to the authors. The present section provides a comparison with mobility in other EU Countries and in the United States, to ascertain if some relevant differences in daily mobility features are observable, given also the different electric market share in these countries (
Figure 6).
The next step will be to compare demand and supply. Our aim is to assess the possibility of shifting from ICE to more innovative solutions (such as BEV, HEV, PHEV) without the need to change daily driving patterns and of accomplishing high-level aims to influence transport policy (such as in U.S. and EU), keeping in mind the presence of a near-monopoly in energy provision for transport, as mentioned above: EU leaders have agreed (23.10.2014) on the domestic 2030 greenhouse gas reduction target of at least 40% compared to 1990, together with the other main building blocks of the 2030 policy framework for climate and energy, as proposed by the European Commission in January 2014. This 2030 policy framework aims to make the EU’s economy and energy system more competitive, secure, and sustainable and also sets a target of at least 27% (increased to 32% in 2019) for renewable energy and energy savings by 2030.
Within this context, Franke and Krems (2013) [
59] investigated factors outside Italy that influence the range preferences of potential electric vehicle customers. They collected the results from different studies and calculated a
39–41 km range of daily distances in Germany; 61–80% of vehicles travel fewer than 50 km per day, with 91–95% traveling fewer than 100 km. Greaves et al. (2014) [
60] pursued a similar aim but employed GPS data collected in Sydney by 166 participants, assuming a simple home-based recharging set-up.
Figenbaum et al. (2014) [
61] investigated the actual use of
EVs in Norway, based on a survey of 1721 EVs. Based on a combination of responses to questions about insured driving distance and odometer readings, they obtained an average distance of
14,000–15,000 km/year, which is not so different from the Italian values (12,500 km). This value is close to the annual average mileage of new ICE vehicles in Norway: 15,160 km the first year, 14,800 km the second and 13,400 km the third year. They thus concluded that the annual driving distance for EVs with the latest technology is approximately the same as that for new gasoline vehicles. The average distance to work for EV owners is 26 km, considerably greater than the Norwegian average of 15 km. Eighty-one percent of EVs are driven daily whereas another 16% are driven 3–5 days per week, and the majority of respondents reported that they had not changed their travel patterns. Older data from Norway (Econ 2006 [
62]) indicated a driving distance of EVs in 2006 of 10,400 km for privately owned EVs and approximately 7600 km for those owned by companies.
Even French data collected and elaborated by Feildel and Martouzet (2012) [
63] is quite similar to the Italian data, with 6.8 km as the average distance for single trips by traditional automobile for urban and extra-urban trips.
Focusing on the United States, Pearre et al. (2011) [
64] carried out a study of 484 sample vehicles (470 were observed for more than 50 days; the research is focussed on this subset) in the metropolitan area of Atlanta, Georgia. Of the 30 top industrialized areas in the United States, the Atlanta area is the second in terms of number of miles traveled daily per person by car, exceeded only by Houston, Texas. Therefore, the results should presumably be greater than the U.S. average. To collect the data, the sample automobiles were equipped with a GPS data logger that, after collecting the data during the day, transmitted it daily to the central station. The data reported in the following graph refers to 2004. Specifically, a single trip is composed of the sum of one or more trips divided by pauses shorter than 30 min.
The graph in
Figure 7 shows that a majority of the trips take place within a range of 50 miles (80.5 km). Excluding days without trips, the average mileage of the daily trips is 44.7 miles (71.9 km), while when considering all of the days, the daily average becomes 32.6 miles (52.5 km), values considerably greater than those found in European countries, though the shape or trend is quite similar to that in
Figure 4 and
Figure 5. The daily average distance in the United States, according to the NHTS (National Household Travel Survey) by the Bureau of Transportation Statistics (U.S.) and reported in the analyzed research, is 29.1 miles (46.8 km), a value less than the 32.6 miles obtained for the metropolitan Atlanta area and in accordance with previous forecasts. The value corresponds to a daily trip of 12–16 miles (19.3–25.7 km), made on average 21 days per year.
A further confirmation of the previous values is provided by data from the Transportation Energy Data Book (Davis et al., 2012) [
65], reported in
Table 7, which synthezises the main data related to average private motorized mobility in the United States.
Figure 8 and
Figure 9 report the distribution of daily distance covered by automobile according to various collected or directly analyzed sources. We consider this comparative result an original added value.
6. Automobile Usage Trend in the International Context
After analyzing the average distance traveled by automobile on a daily basis in Italy and in other countries, which resulted satisfying considering our declared aims, this section investigates typical annual automobile usage in an international context in order to show how this is changing over time. This may be useful also in understanding whether a highly varying trend over the years might compromise the compliance of battery autonomies with the usage of PHEVs and BEVs, still considering the average daily distances, according to our results.
A Dutch analysis (Van Der Waard, 2012) [
66] indicates that about half of the trips take place by car, 20% by bicycle, 20% on foot, and 5% by public carriers. Alternatively, referring to passenger-kilometers covered, 75% is covered by car, 13% by public carriers, and 8% by bicycle. The lower weight of the mobility by bicycle in terms of passenger-kilometers is easily interpretable since this transport mode, even if deeply rooted in the Netherlands, is used mostly for short distances. Forty percent of the trips take place within 2.5 km and 70% within 7.5 km, while 25% exceed 10 km (in Italy, according to ISFORT data from 2013, this value is 31.1%). The average distance of commuters to get to work is 18 km, which can be compared to the values previously indicated.
The use of automobiles in different OECD Countries—mainly referring to the EU—is reported in the graph in
Figure 10, extracted from Litman’s study (2013) [
67].
Figure 10 shows that per capita vehicle travel has leveled off in this century, even in the case of Italy, which is the only EU country with a higher value in 2000 when compared to data from the most recent available year. ACI (2008) [
68] confirms this decreasing trend, reporting a 22% decrease between 2003 and 2007 versus a 14.5% increase in the number of automobiles. The average annual distances in different OECD countries have similar trends; shorter overall covered distances refer to countries (Greece, Ireland, Portugal, and Spain) where economic systems were not as consolidated as those in countries where statistics for average automobile use are more relevant. Nevertheless, their increasing rates were higher. In 2007, at the end of the monitoring period, the average distances covered in all of the countries considered are uniform, except for the United States, where the average annual distances by automobile are much higher.
Madre et al. (2012) [
69] report average annual distances in France (
Figure 11), dividing the population into quartiles according to household living standards, in increasing order from Q1 to Q4.
This analysis, besides being compliant with previous average data, also shows the close relationship that occurs between mobility and economic aspects, with higher living standards associated with higher average annual distances. Considering the higher percentage of medium-low living standards in the whole population, it can be affirmed that the global average annual distance is not so different from the Italian one, being approximately between 12,000 and 14,000 km. Sivak’s study (2013) [
70] investigated the average distances of light vehicles in the United States using FHWA (Federal Highway Administration) data. The data refer to all light vehicles—private, commercial, and public—since data on private vehicles alone was not available. The result should presumably be greater than what would be obtained by analyzing only private light vehicles.
Figure 12 illustrates the annual average distances of light vehicles.
The trend in the annual average distances of all light vehicles in the United States has increased, with a peak in the year 2006, after which there was an initial reduction followed, in 2008 on, by a tendency towards stabilization. The aggregated data has been reported exclusively to provide an overview of the mobility trend in light vehicles in the United States.
Figure 13 provides a detailed look at annual average distances.
As shown by the graph, all trends reach their peak in 2004–2006. After 2004, the annual average distance per vehicle decreases by 5.4%, from 11,946 miles (19,225 km) in 2004 to 11,318 miles (18,215 km) in 2011. 1992 is the latest year prior to the 2004 peak that had a rate lower than the 2011 rate. A daily average distance of 31 miles (49.9 km) can be determined from the annual data; the obtained value is next to that related to the Atlanta study (32.6 miles) and to the NHTS numbers (29.1 miles).
Finally,
Figure 14 reports the trend in the annual average distances in the United States, extracted from a study of motorized mobility on the population between 16 and 34 years of age (Frontier Group and U.S. Pirg Education Fund, 2012 [
71]).
After a period of practically constant growth, from the end of the 1990s a trend towards stabilization is shown repeatedly, with a decreasing final tendency. In 2010, the annual average distance of the analyzed sample is 7900 miles (12,714 km), corresponding to a daily average distance of approximately 21.6 miles (34.8 km).
7. Economic Approach
As shown in this study, the operational costs for the consumers may be relatively low and, in some cases, convenient. Literature studies demonstrate that the lower operational costs encourage EV adoption (Caperello and Kurani, 2011; Graham-Rowe et al., 2012; Sovacool and Hirsh, 2009; Egbue and Long, 2012; Jensen et al., 2013; Lieven et al., 2011; Zhang et al., 2011; Rezvani et al, 2015).
Sierzchula (2012) identifies three important policy approaches to encourage the transition to more sustainable transport: (1) economy-wide policies to develop all types of alternative fuel vehicles (AFV) powertrains, especially incremental innovations; (2) policies for the construction of fuel or charging infrastructure; (3) technology-specific policies for the development and adoption of radical systemic AFVs.
The increasing regulations and pollution restrictions for cities and the other changes that emerge could push consumer choices toward electric or hybrid powertrains characterized by a strong level of innovation. Recently, this phenomenon is already affecting some consumers who are willing to pay a mid-high price for higher quality and innovation. Research demonstrates that early adopters of EVs generally have a higher socio-economic status as they need to make the necessary higher investment in an EV (Curtin et al., 2009; de Haan et al., 2006; Ozaki and Sevastyanova, 2011; Rogers, 2003; Plots, 2014).
However, as highlighted by Xia (2011), the future of automobile industry supply chain management will also be influenced by sustainable development, less dependence on gas, green energy reform, and a high moral standard.
This trend could grow substantially in terms of government subsidies for automobile makers and consumers, and in a short time involve most of the traditional market. Some studies have highlighted that financial subsidies provided by governments or manufacturers positively influence the decision to adopt EVs (Krupa et al., 2014; Lane and Potter, 2007; Zhang et al., 2011; Rezvani et al, 2015).
However, from a more practical viewpoint, having understood how far average daily distances are compliant with the range of electric batteries or, vice-versa, what kind of autonomy can be required in batteries, we still need to understand if this is also sustainable from the economic viewpoint, in addition to the technical one. So far, the winning solution is a hybrid-electric traction, if we consider a flexible automobile which is compliant with both non-polluting daily urban trips and with less environmentally-constrained, though less frequent, longer extra-urban trips.
This section is therefore aimed at evaluating the economic impact on final users, i.e., drivers of the new hybrid-electric traction technologies, and at assessing the economic interest of the companies in this sector from the business economic viewpoint. The following analysis first defines the main costs, proportional and non-proportional to the traveled distance, and compares the total cost of ownership of different traction types: traditional gasoline and diesel, gasoline and diesel HEVs, and gasoline and diesel PHEVs.
The economic analysis is closely linked to previous mobility analyses, in particular for urban and extra-urban travel distances. Moreover, this section can be useful from both a car driver or fleet manager and car maker point of view, providing an indication of the possible economic advantages when using electric tractions, either pure or in combination with ICE in hybrid powertrains.
As a first step, it is necessary to define the main relevant costs for a car that is useful for our computations. The ACI (Automobile Club of Italy) provides the following definition: «The total cost of a vehicle is to be intended as the sum of the operating costs plus the initial costs averaged along the life cycle of the vehicle. Of course, results have some approximations such us: interest rate, real life cycle of the engine/powertrain and other components, fuel cost. Total operating costs plus the amortization cost, referred to averaged annual traveled length, give as output the value of the total cost of ownership (TCO) expressed in Euro per kilometer.
Total annual cost for the owner is composed of two main important parts:
- A.
Costs not proportional to the traveled length (€):
Car Tax
Insurance, compulsory by law (hereafter “RCA”, according to the national denomination)
Interest on purchasing capital (depreciation)
- B.
Costs proportional to the traveled length (€/km):
The car tax is calculated considering some important factors: country of matriculation, power of the engine (kW), emission class of the engine (Euro I, Euro II, …, Euro VI) and power; when the engine power is higher than 185 kW, a supplement of 20 €/kW must be paid. Hybrid vehicles are considered atypical, and car taxes regard only the thermal engine. Many discounts are available for full electric automobiles or BEVs according to the country (e.g., in Italy, electric vehicles are free of taxes for the first five years, then users pay 75% less than normal). Other fuels, such as GPL or methane, can take advantage of eco-subsidies. In this paper, the car tax is calculated for a user in an average Italian region (Lazio) for 88.25 kW (120 HP) of engine power (Source: from website
http://www.utelio.it/calcolo-bollo-auto.php).
The Italian average car tax in 2017 was 2.58 €/kWh; engine power higher than 100 kW have a price of 3.87 €/kWh (
Table 8). These rates apply to both traction, diesel and gasoline. Since 2014, many Italian regions have adopted some tax discounts for hybrid electric vehicles (PHEVs and HEVs), and since 2016, nine Italian regions have planned on abolishing them (and for the most part have gone ahead with this): i.e., Lombardy, Veneto, Lazio, Campania, Puglia, Emilia Romagna, Basilicata, Liguria and Umbria (Source: from website
http://www.lifegate.it/persone/stile-di-vita/chi-compra-lauto-ibrida-cinque-regioni-non-paga-il-bollo).
RCA (Civil Liability for road vehicles) is a compulsory insurance that considers the following variables: region of matriculation, car owner’s age, driving years, vehicle type, and frequency of accidents (Merit Class). Penalties or a higher insurance amount are expected only if the responsibility of an accident is more than 50% (Italian law 248/2006). The calculation is done for a Roman employee, 40 years old, expert driver, with a range covering insurance starting from 1 to 5 million (Source: from website
http://www.allianz.it/preventivi-assicurazione/preventivo-assicurazione-auto/calcolo-preventivo-auto-tradizionale) (minimum by law).
The depreciation rate is calculated from Equation (1):
Equation (1)—Interest rates
where is the interest rate to calculate, is the official price list of the vehicle (including matriculation or registration, testing and transport fees, and IVA-Value Added Tax (VAT), is the residual value estimated to be 20% of the initial purchase cost, is the interest rate (the average of the interest rates of the entire financial operation in the medium term), which here is 5.5%.
The interest rate on purchase capital is calculated from Equation (2):
Equation (2)—Interest capital rate
where
is the interest rate for the invested capital,
is the official price list of the vehicle (including registration, testing and transport fees, and IVA-Value Added Tax, i.e., VAT),
is the residual value estimated to be 20% of the initial purchase cost, and
K is a factor that depends on fuel and engine displacement (
Table 9):
Fuel cost refers to the certified fuel consumption for the automobile (NEDC cycle, valid until 2017). The fuel cost is calculated as follows in Equation (3):
Equation (3)—Fuel cost.
Gasoline price refers to the European average of 1.30 €/l.
Tires are estimated to be at their end of life after 30,000 km for Crossover and SUV (Sport Utility Vehicles); the price is based on the sellers, discounted by 15%. Equation (4) defines the cost:
Equation (4)—Tire cost
where tire price is €100 and average life of SUV tires is 30,000 km.
The maintenance is considered both ordinary (imposed by the car maker) and extraordinary (brake pad replacement, shock absorbers, friction, small collisions, scratches, etc.). These costs also include the spare parts and is based on professional work paid at 25.82 € plus VAT per hour.
According to ACI indications, for medium-size Crossover and SUV vehicles, the maintenance cost is estimated at 0.068 €/km for diesel and 0.064 €/km for gasoline.
Battery cost depends on its initial purchasing price and its average life cycle. A number of car makers compare battery life with engine life. Battery cost regards only electric vehicles such as BEVs (Battery Electric Vehicle) and PHEVs (Plug-in Hybrid Electric Vehicle); Equation (5) defines how battery cost is calculated:
Equation (5)—Battery cost
Electric energy cost depends on daily distances covered in electric mode. The energy demand also depends on the capacity of BEV and PHEV batteries, and the price expressed in €/kWh is influenced by the global energy market. The main hypothesis taken in this study regards traction control: in fact, it is assumed that vehicles initially use the energy accumulated on batteries and, once this has ended, traditional engine power (only for PHEVs). Equation (6) defines energy cost:
Equation (6)—Electric energy cost
7.1. Example 1: Comparing Traditional and Electric Traction with NEDC Consumption
The following different car tractions have been compared for this study:
Traditional gasoline
Traditional diesel
Hybrid electric vehicle (HEV) gasoline
Hybrid electric vehicle (HEV) diesel
Plug-in hybrid electric vehicle (PHEV) gasoline;
Plug-in hybrid electric vehicle (PHEV) diesel.
As reported in this critical review, the average annual mileage is estimated at 12,000 to 14,000 km (
Section 4). The following analysis is based on that mileage and, in accordance with previous indications, an urban average daily trip is considered to be 10 km and an extra-urban daily trip 28 km. According to these distances, total daily traveled length is 38 km (12,500 km annually).
Vehicle prices vary, but comparing the actual market for PHEV and traditional automobiles, it is possible to make some approximation. In fact, the gasoline cost for PHEVs is approximately 30% more than for traditional gasoline, and the cost for diesel fuel for PHEVs is approximately 40% more than for traditional diesel (
Table 10 and
Table 11).
As shown in
Figure 15, year 0 corresponds to the moment of purchase, and every subsequent year includes previous costs and ongoing costs. PHEV diesel and gasoline costs (
Table 12) equalize their costs with traditional powertrains after 5 and 3 years, respectively. In addition, after approximately 3 years and according to the previous distance covered, gasoline for PHEVs is the cheapest traction compared to the others. The most expensive tractions are diesel and HEV gasoline, since they balance the efficiencies of traditional and electric engines instead of using only electric traction like PHEVs.
Finally, electric traction seems to be very suitable for mixed urban and extra-urban usage. Even medium–short distances allow all the electric capacity of batteries to be used and to do so properly during low efficiency periods (acceleration, stop and start, low engine loads). In addition, PHEVs and HEVs could recover some energy during braking phases. On the other hand, inboard units such as air conditioning, lights, and radios could reduce the battery energy.
7.2. Example 2: Comparing Traditional and Electric Traction with Real Consumption
Several studies have confirmed (Source:
http://www.theicct.org/fuel-consumption-discrepancies) that homologation cycles are done without on-board units powered on and with other approximations (less vehicle load, slow accelerations, etc.), thus accounting for fuel consumption and emissions below the true levels.
In this section, the same calculation that was carried out above is repeated, leading to an increase in the average electric and fuel consumption. In particular, electric traction expenditures and traditional fuels are increased by 21%, resulting in electric fuel consumption equal to 26.3 kWh/100 km.
As shown in
Figure 16, even in the case of real consumption, the costs for PHEV diesel and gasoline become equalized with traditional powertrains after 5 and 3 years, respectively. Gasoline PHEV remains the cheapest traction compared to the others after 3 years of usage (
Table 13).
8. A Glimpse at Freight Transport
To complete the review on road distance traveled, this section reports and analyses average daily distance covered for freight transport, trying to understand whether constant values similar to those for personal motorized mobility exist here as well. Information about the transported tons is omitted because such a deep analysis would require knowledge of the paths and capacities of the vehicles; this was beyond the scope of this study and is not treated in the literature, unlike the case for travelers. The compulsory introduction of a black box for e-calls in Italy, as well as in the other EU countries (since 2017) has laid the bases for an excellent future contribution to this analysis. Therefore, only available aggregated data are considered. According to the main aims of this study, the analysis is mainly focused on Italian freight transport; only a general overview of freight transport in other countries is provided.
Referring to data provided by the association of toll-motorways (Autostrade per l’Italia, 2013 [
58]) on heavy-duty vehicles, traffic flow on highways in 2012 decreased by 8.2% with respect to 2011, returning to values comparable to those in 2000. Average daily distance was equal to 100.6 km per truck, and almost half (48%) of heavy vehicles covered distances less than 50 km.
According to CONFETRA (“Confederazione Generale Italiana dei Trasporti e della Logistica” represents business categories that operate in the freight transportation sector and in the political, economic, social, and trade union fields) (2011) [
72], national trips cover a daily average distance of 97.2 km (118.6 km in 2003 [
73], a decrease of 18%), divided between 37.5 km (48.8 km in 2003, a decrease of 23%) of trips on own account (not outsourced) and 119.8 km (165.1 km in 2003, a decrease of 27%) in transport for hire. This data is in line with an aforementioned report by Autostrade per l’Italia, since freight transport takes place mostly on motorways. Considering international trips, the daily average distance is 597.0 km (863.1 km in 2003, a decrease of 31%). This is divided between 149.5 km (279.5 km in 2003, a decrease of 47%) of trips on own account and 623.6 km (897.9 km in 2003, a decrease of 31%) of trips for third parties. Finally, considering both national and international trips, the daily average distance was 106.6 km (140 km in 2003, a decrease of 24%), divided between 37.9 km (49.7 km in 2003, a decrease of 24%) of trips on own account and 132.1 km (197.7 km in 2003, a decrease of 33%) of trips for third parties. Trips for third parties have a significantly greater weight than do trips on own account, and national is more frequent than international transport. To the authors’ knowledge, an estimation of the number of vehicles that cover a certain distance is not available; therefore, a statistical distribution of trip frequency by average daily distance cannot be determined.
Data reported in a study by the Ministry for Environmental protection (Ministero dell’Ambiente e della Tutela del Territorio e del Mare, 2013 [
74]) refers to 2008. The study describes a national daily average distance of 102.5 km. This is divided between 36.6 km of trips on own account and 133.2 km of trips for third parties. It also cites 727.4 km in international trips, divided between 110.1 km of trips on own account and 768.8 km of trips for hire. Considering both national and international trips, a daily average distance of 118.7 km was obtained. The data confirm the overall decreasing trend in average daily distances between 2003 and 2011, with the exception of trips on own account, which seem to have had a slightly increasing trend between 2008 and 2011. Analysing traffic distribution of heavy-duty vehicles, the greater average distances, 149.7 km (2008 data), involve trips originating in the south of Italy, while the lower average distances are estimated at 89.3 km (2008 data) and correspond to trips originating on the islands. This distribution can be explained by several reasons: as an example, the greater concentration of urban areas in northern Italy leads to shorter trips, whereas trips originating on the islands require alternative transport modes for connecting with the peninsula, thus creating shorter distances.
This implies that if we want to direct freight transport toward solutions alternative to ICEs, typically based on gasoil—which represents almost the entire energy carrier for heavy-duty vehicles—we cannot do so because of a lack of data, the high variability of both masses (from 3.5 up to 44 tons on the ground) and runs as well as, as average, and a prevalence of long trips, which are not compliant with the current energy stored in batteries. Short ranges and lighter vehicles for urban distribution might be compliant with alternative solutions (BEVs, R-HEVs, PHEVs); however, there is no possibility of quantifying this potential market.
9. Discussion of Results
Many constraints or preferences, sometimes also State subsidies, of modern society are pushing toward road transport electrification. Many variables influence this possible transition and one of these is autonomy (range), with related charging times, consequent queues and actual plug-in possibilities, which leads to considering the main usage of electric traction in urban and metropolitan contexts, according also to our results.
The automobile, though remaining the most utilised transport mode with a weight of approximately 80% of the Italian motorized mobility in urban contexts, has a higher use for extra-urban trips as well as in small cities, given the reduced availability of public transportation services.
This unexplored compared analysis of daily motorized mobility and related data—undertaken in Italy, in some EU countries and in the United States—shows that this type of mobility has nearly maintained its values with starting from the new century, approximately, though sometimes dropped in magnitude, both in Italy and in the other considered Countries. The trend has changed after a well-known nearly constant growth in the last half century, perhaps in part because of the period of consumption contraction that characterizes the economy, possibly also because of a change in daily behavior related to the new diffusion of mobile communications and teleconferences.
Having understood that we might not expect a substantial change in daily covered distances by automobile and focusing on trip characterization, this analysis has shown that the different studies considered, even though they inevitably refer to different samples and use different approaches, achieved comparable results.
Specifically, the result of our analysis is a range of daily average distances traveled by Italians that falls between 32.1 km and 38.7 km and is characterized by an average trip distance between 4.6 and 6.2 km in urban areas and between 11.9 and 25 km in extra-urban contexts. As expected, daily average distances traveled in the United States are greater than those traveled in Italy and the other European countries; the U.S. average distances range between 29.0 and 32.6 miles (46.5–52.5 km).
We may comment that charging spots are expected to be positioned and used as much as possible (e.g., 90–95%) at home as well as in the extended areas of companies, universities, public institutions, markets, interchange areas (park and ride), and stadiums, leaving a smaller market to the charging spots on public land, given the typically shorter and charged parking times, with high frequency turning—and consequent queues—within metropolitan areas.
Referring to freight transport, the collected data reveals the impossibility of classifying them in our context and indicates relevant differences in average distances traveled by light and heavy-duty vehicles on own account and for third parties (for hire). Daily average distances have decreased in 2003–2011, primarily for international trips. An exception is represented by trips on own account, which seem to have a slightly increasing trend between 2008 and 2011. Some reliable sources indicate that almost half of heavy-duty vehicles cover an average distance of less than 50 km.
Considering then the need to develop more oil independent and less locally polluting vehicles according to the EU goals in 2014, this study might be used as a support for industrial choices and decisions concerning the suitable propulsion—either by ICEs, electric motors or both—of future motor vehicles.
In the authors’ opinion, emerged distance requirements can be satisfied by a set of vehicles: a hybrid powertrain with an ICE and an electric motor as well as independent recharging, which means using the electric motor on short trips and engine propulsion for longer ones, would be a good although more expensive combination.
This approach might be able to mitigate overall consumption and emissions. Traditional ICEs can also be combined with full-electric vehicles in a road vehicle sharing modality in urban contexts for another interesting solution, thereby satisfying mobility needs with two different concepts: a multipurpose private vehicle, excluded from urban contexts, and a shared one, purposely conceived for electric mobility in metropolitan areas, as the increase of urban car sharing services based on BEVs has demonstrated. Given the nature of this study, the analysis of sharing mobility is evidently a limitation of the current analysis and possibly a subject to consider in future studies.
Another important emission aspect affects automobile makers: penalties on CO2 emissions which are over the limits. In fact, they could find it difficult to satisfy only with traditional engines both the environmental constraints imposed, for example, by the European community (Regulation (CE) n. 443/2009 and modification n. 333/2014) and recent homologous cycle WLTP, which has been in force since 2017. In particular, the European target for 2020 will be 95 grams of CO2 per kilometer for passenger cars, and the new driving cycle will be longer than the previous NEDC cycle, thus better simulating real driving conditions. These constraints especially affect diesel engines since there are many technological limits to further reduce gases emissions. In other words, diesel vehicles might have a very hard and maybe short life in the near future as pure ICE, while quite long if hybridized.
Nowadays, the best solution to achieve European Community goals, meet the needs of users, and avoid damaging car makers economically is by electrifying—with hybridization—new automobiles. In fact, much scientific evidence confirms that the electric motor can break down the low efficiencies of traditional ICEs at low loads (starting, low loads, etc.), especially in cities. New social and economic benefits may be achieved if local and continental transport policies focus on renewable energies and low carbon emission power generation plants.
According to our more specific economic results, plug-in hybrid vehicles (PHEV) appear to be the best traction solution. Furthermore, if batteries fall in price in the near future thanks to economies of scale, new automobiles can be cheaper and the cost of ownership also reduced.
As already argued, driver behavior is not expected neither required to change significantly, except for drivers needing to charge their vehicle once a day or every two days at home or at work. Plug-in hybrid vehicles allow for both ordinary urban and extra-urban daily trips with the electric unit and longer trips with traditional ICEs, thus matching the needs of stakeholders. Generally, this type of traction could be seen as a recommended compromise between actual traditional engines (which seem to have almost reached best efficiency optimization) and future traction types such as fuel cells or hydrogen. In addition, policies regarding transport can be sustained without sacrificing private mobility.
The subsidies to producers could ensure coverage of the costs for the conversion of production, willing to let PHEVs available on the market at affordable prices. Consumer subsidies could allow for even greater accessibility to that part of the market reluctant to pay more for electric or hybrid cars.
10. Conclusions
The aim of this paper has been to build a framework which allows for a general characterization of the average distance of trips in order to understand if automobiles based only on ICEs might be replaced by those also, but not exclusively, based on electric traction with related batteries, without the need to change mobility average run and to provide a data crossing interpretation for a subsequent quantification of the market, out of the scope of this paper. Certainly, the battery autonomy or range is not the only constraint; however, it is a relevant variable when considering electric traction and related autonomy constraints.
Small batteries (e.g., with autonomies of around 60–70 km) turn out to be compliant with most of the daily motorized mobility by automobiles, as demonstrated—at least for the Italian market—in this critical review: the range of daily average distances traveled by Italians falls between 32.1 km and 38.7 km, and seem conservative in the last years. These distances are compliant with both light masses and domestic or workplace slow charging as well as other uses of electricity, without compromising daily scheduling, as the shared use of charging spots would usually imply (i.e., for leaving the equipped parking areas to other plug-in automobiles). It is necessary to remember that most batteries have an energy density at least 1/20 lower than that of oil-derived fuels, which means that—given a certain amount of energy on board an automobile—the battery for a BEV is quite heavier than the fuel tank for a traditional ICE, with consequent energy consumption, namely in acceleration phases.
The need to induce the automobile market to move toward solutions different from the near-monopoly of oil-based engines, such as BEVs and various HEV solutions compliant with the range of batteries, on the one hand, and the lack of data analysis on average distances daily covered on the other, has motivated the direct collection and a critical comparative review of different studies and surveys. A final economic analysis has demonstrated also the conveniences, for most users, or PHEV, however such economic results depend much on the actual distribution—in terms of frequency—of distances run with the automobile on a yearly basis.
The actual usage of roads can also be useful for road pricing policies in order to calculate yearly well-balanced vehicle taxation per traveled km so that, on average, a national income can be adequately calculated.

 ,
, 


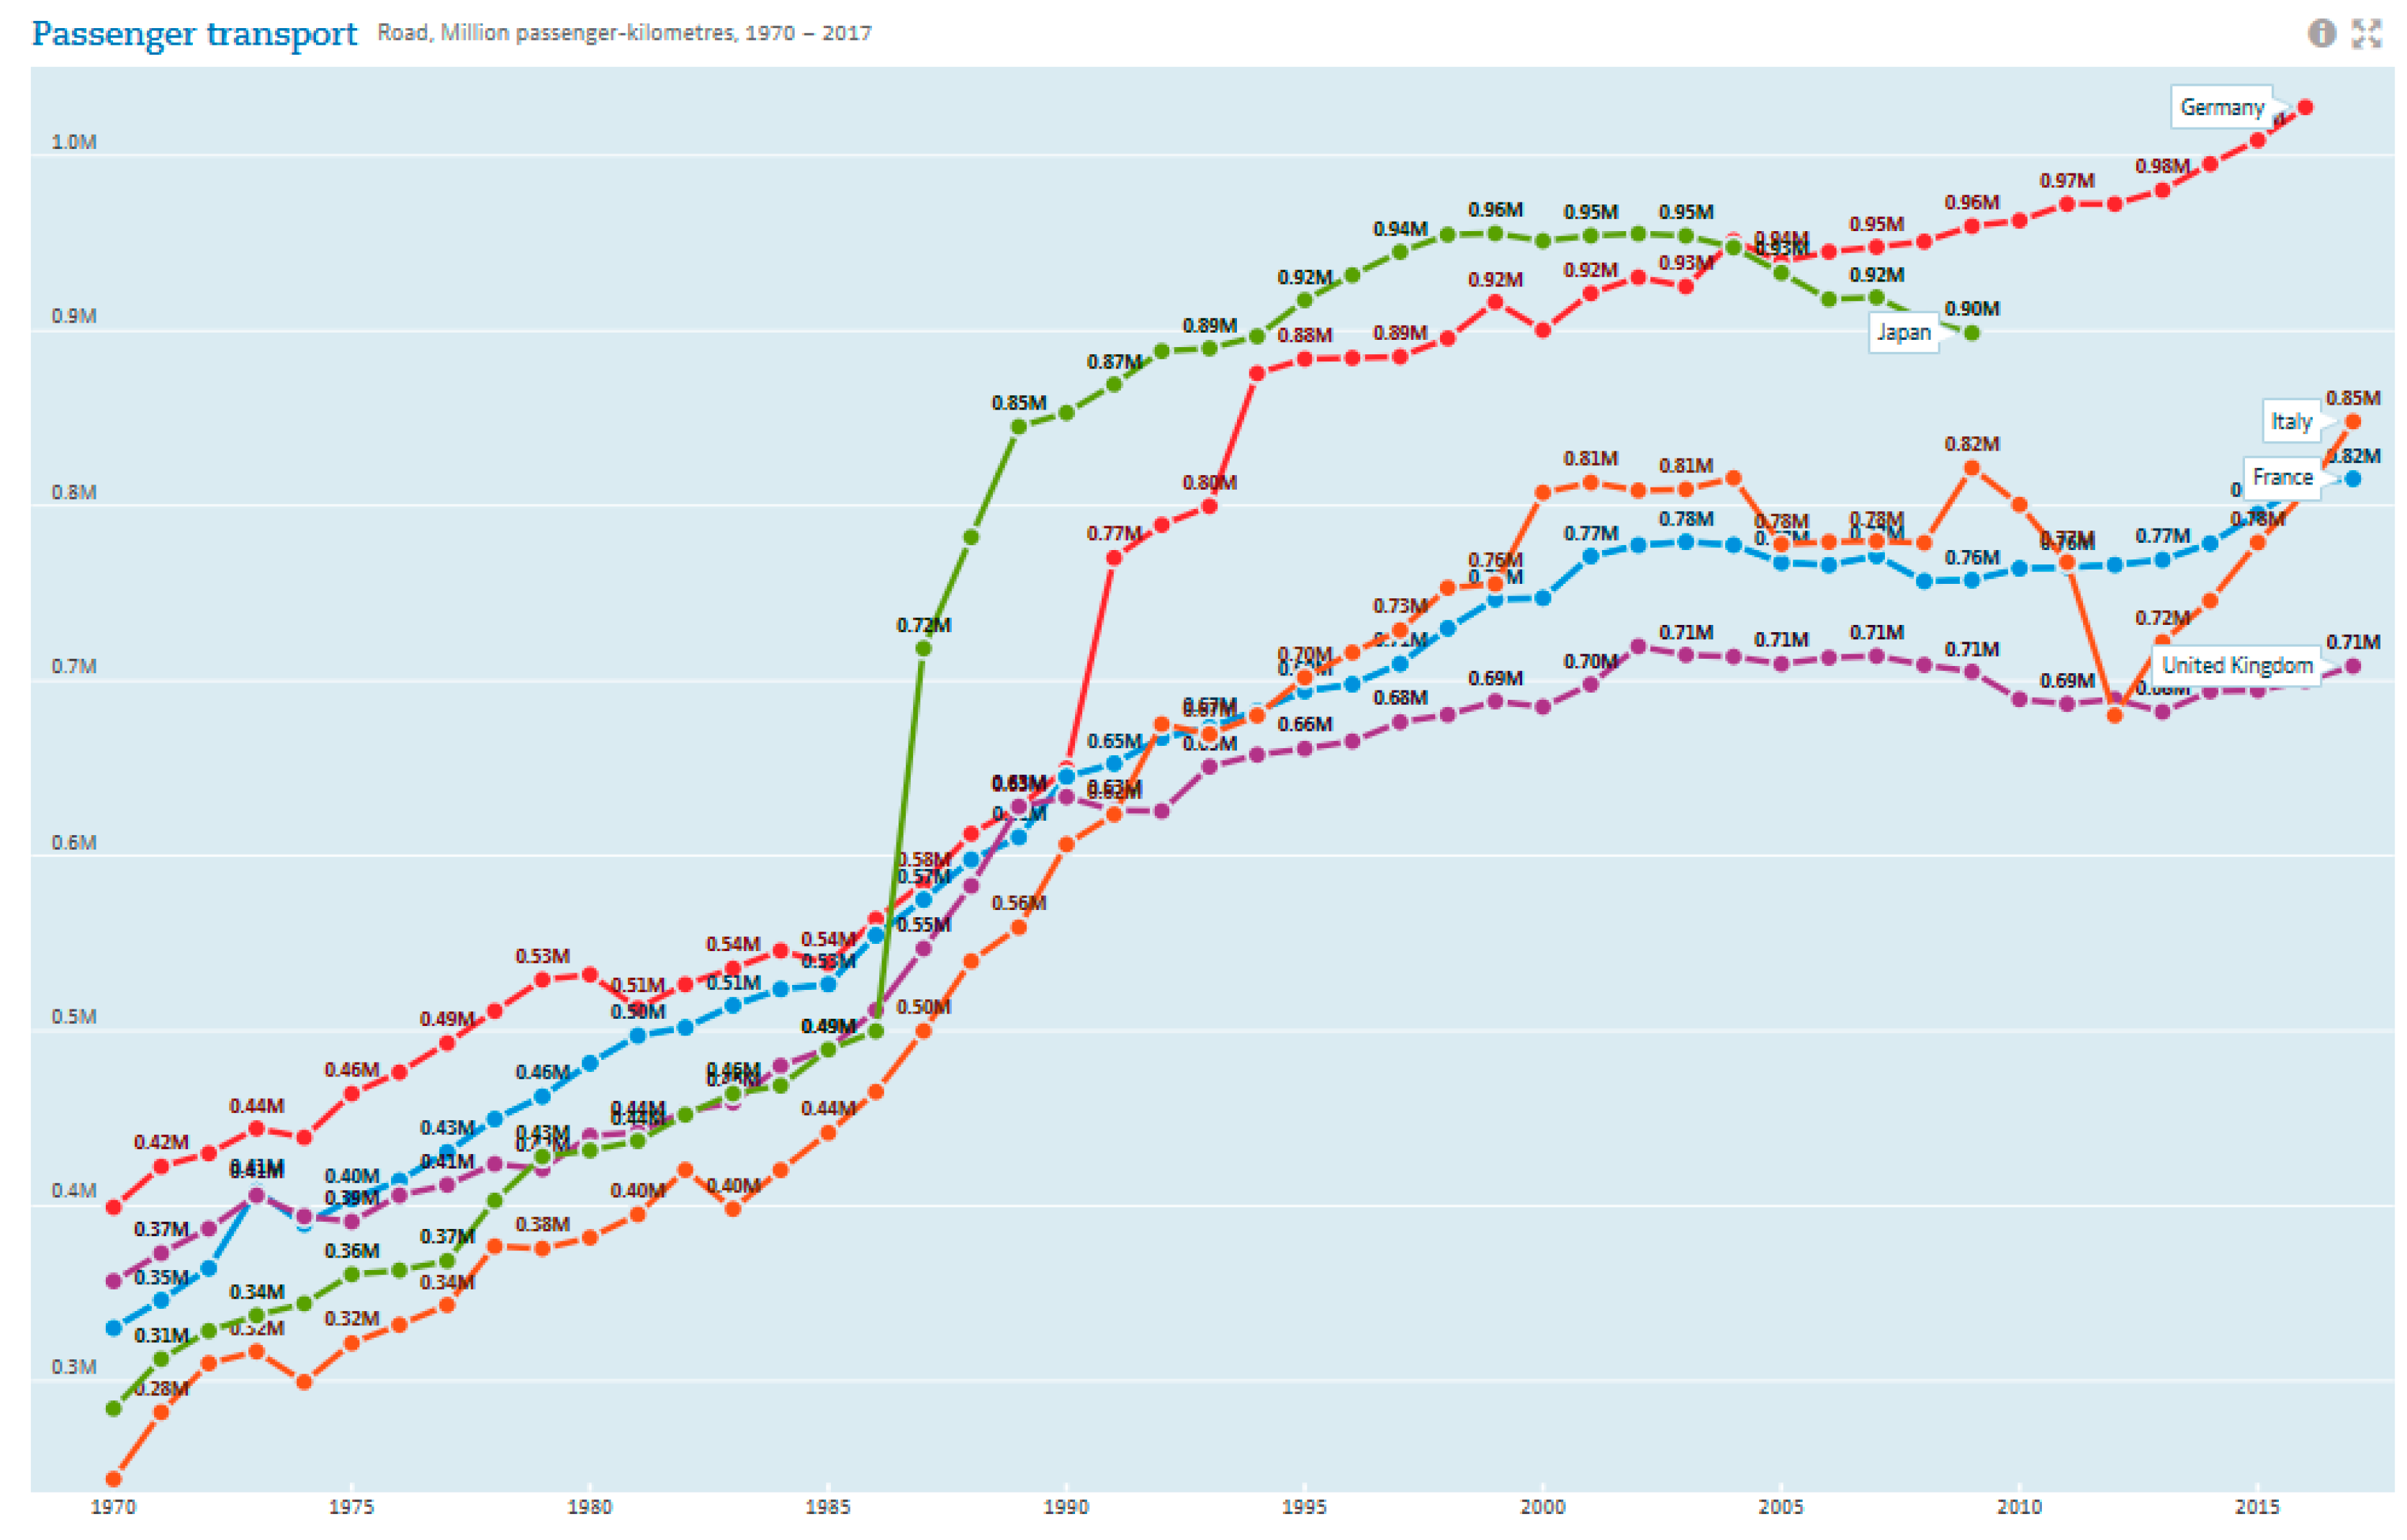
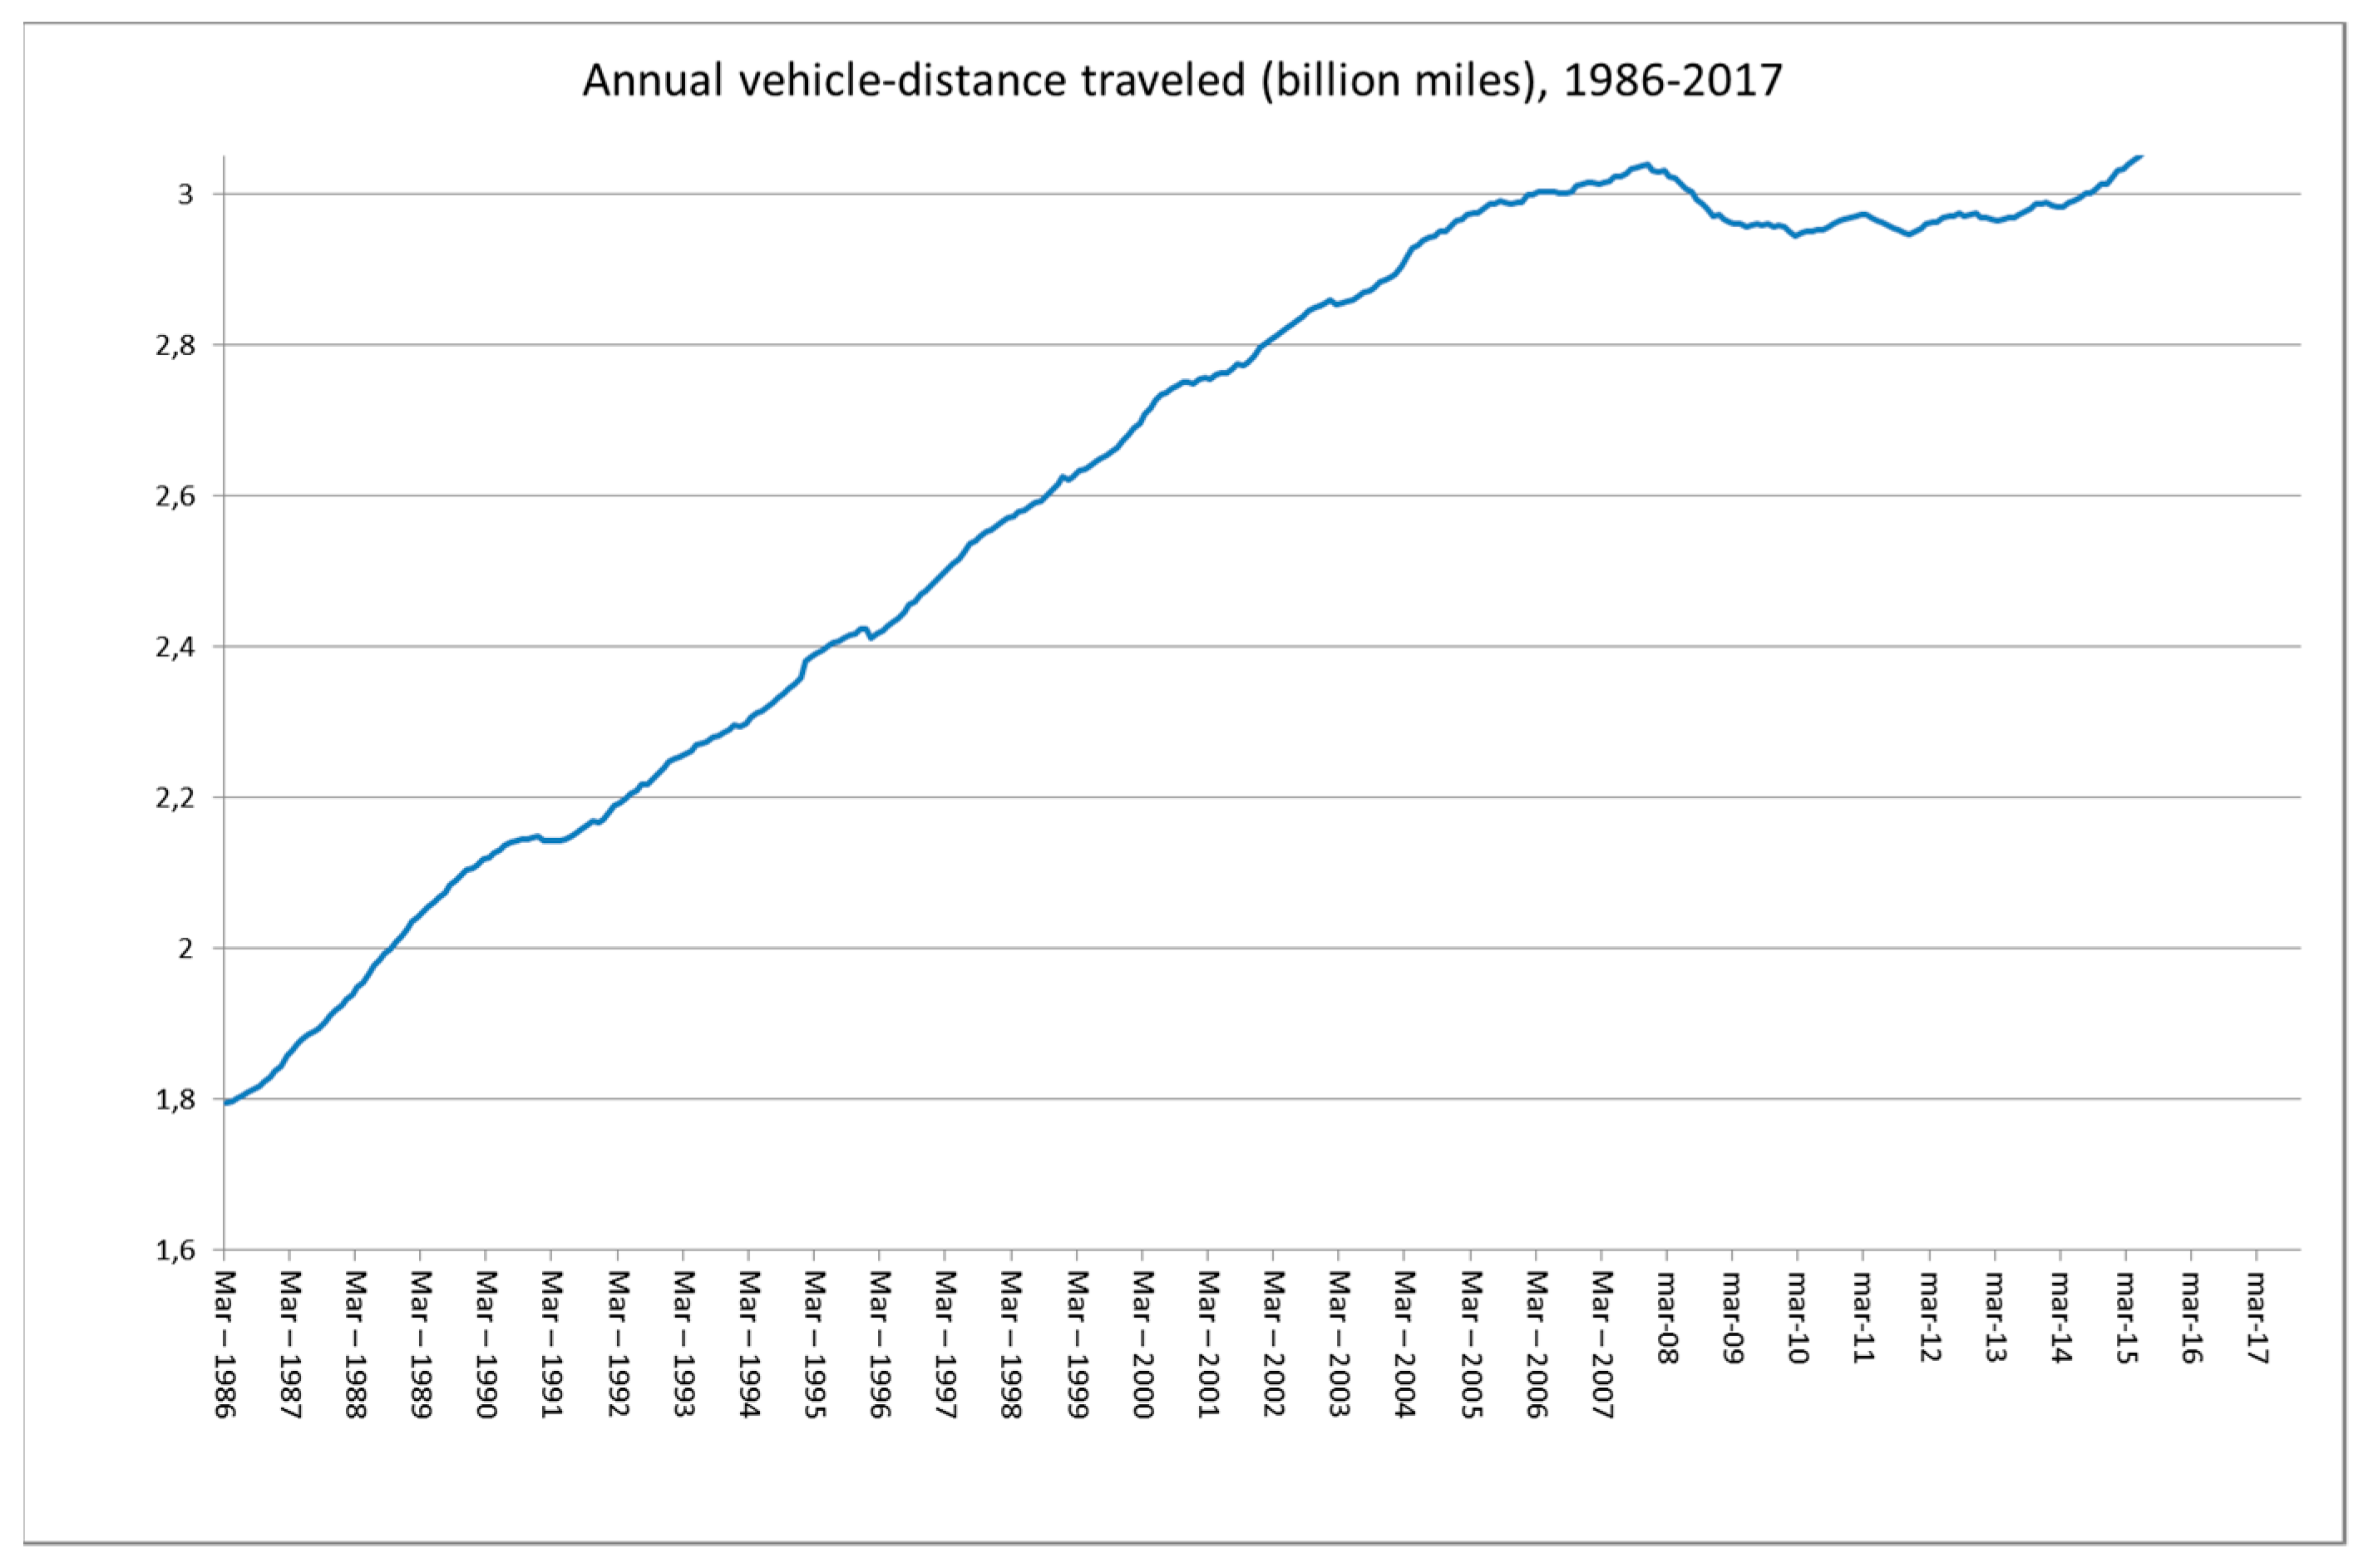
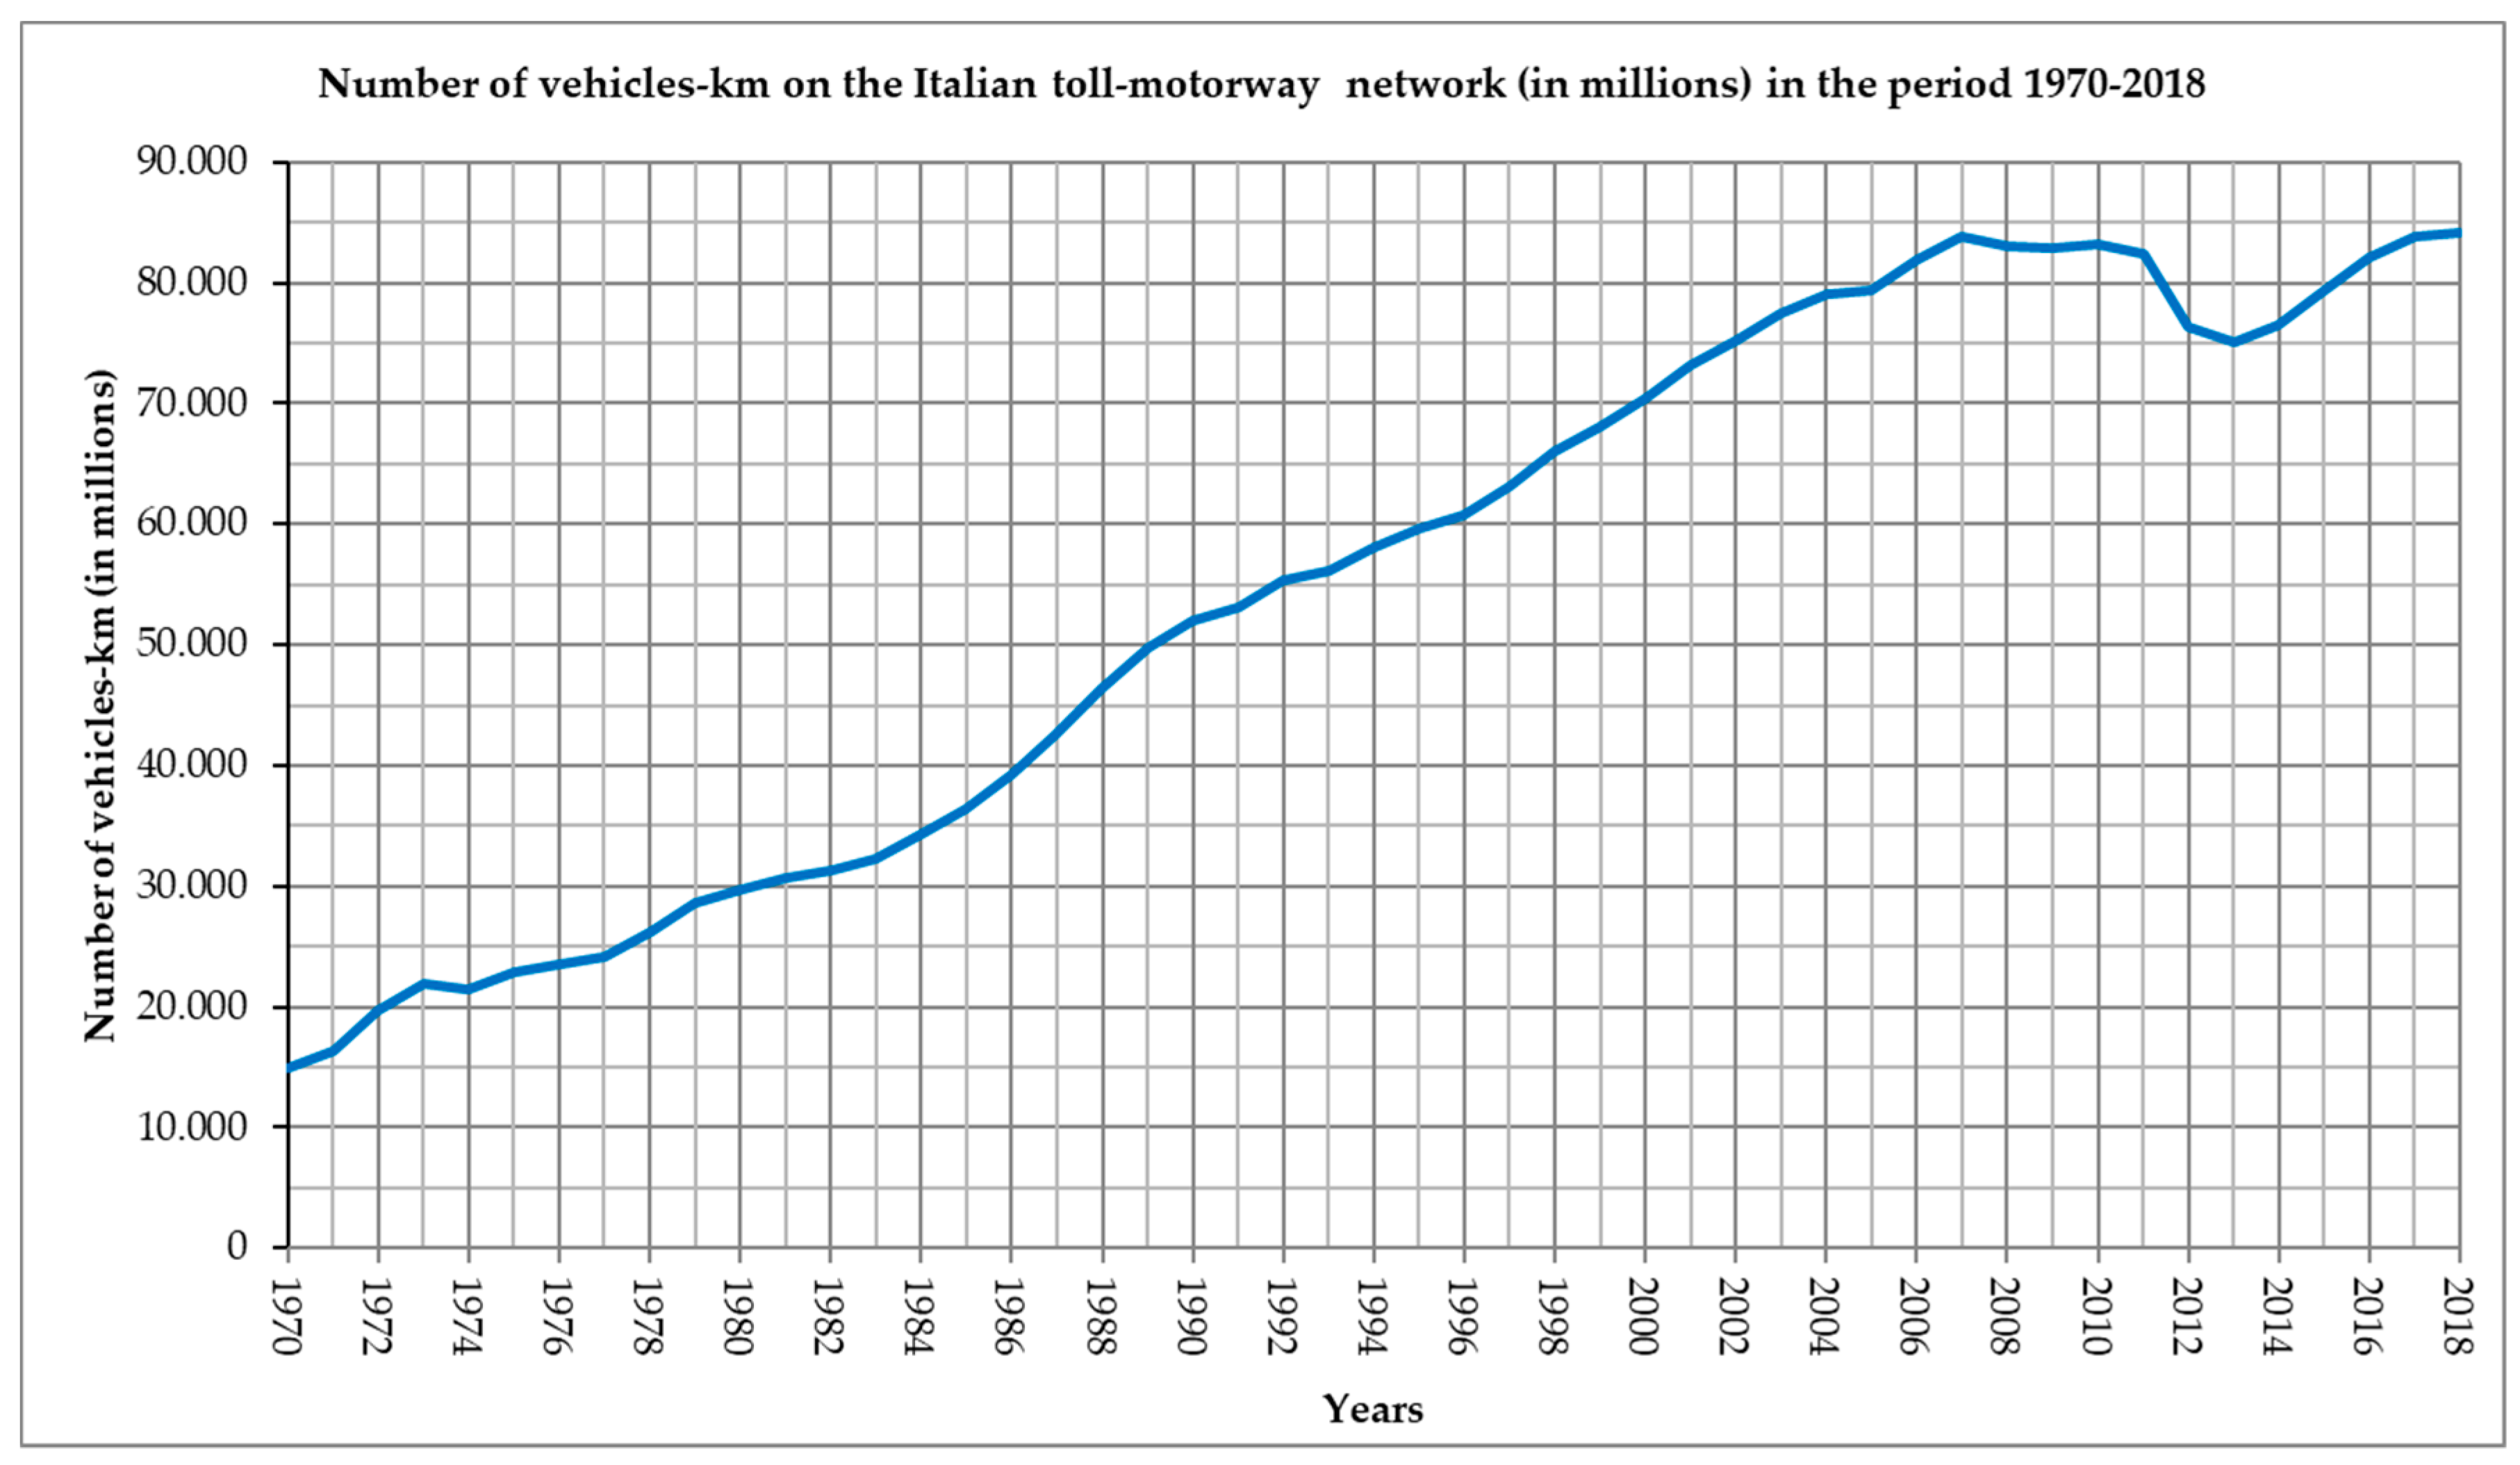
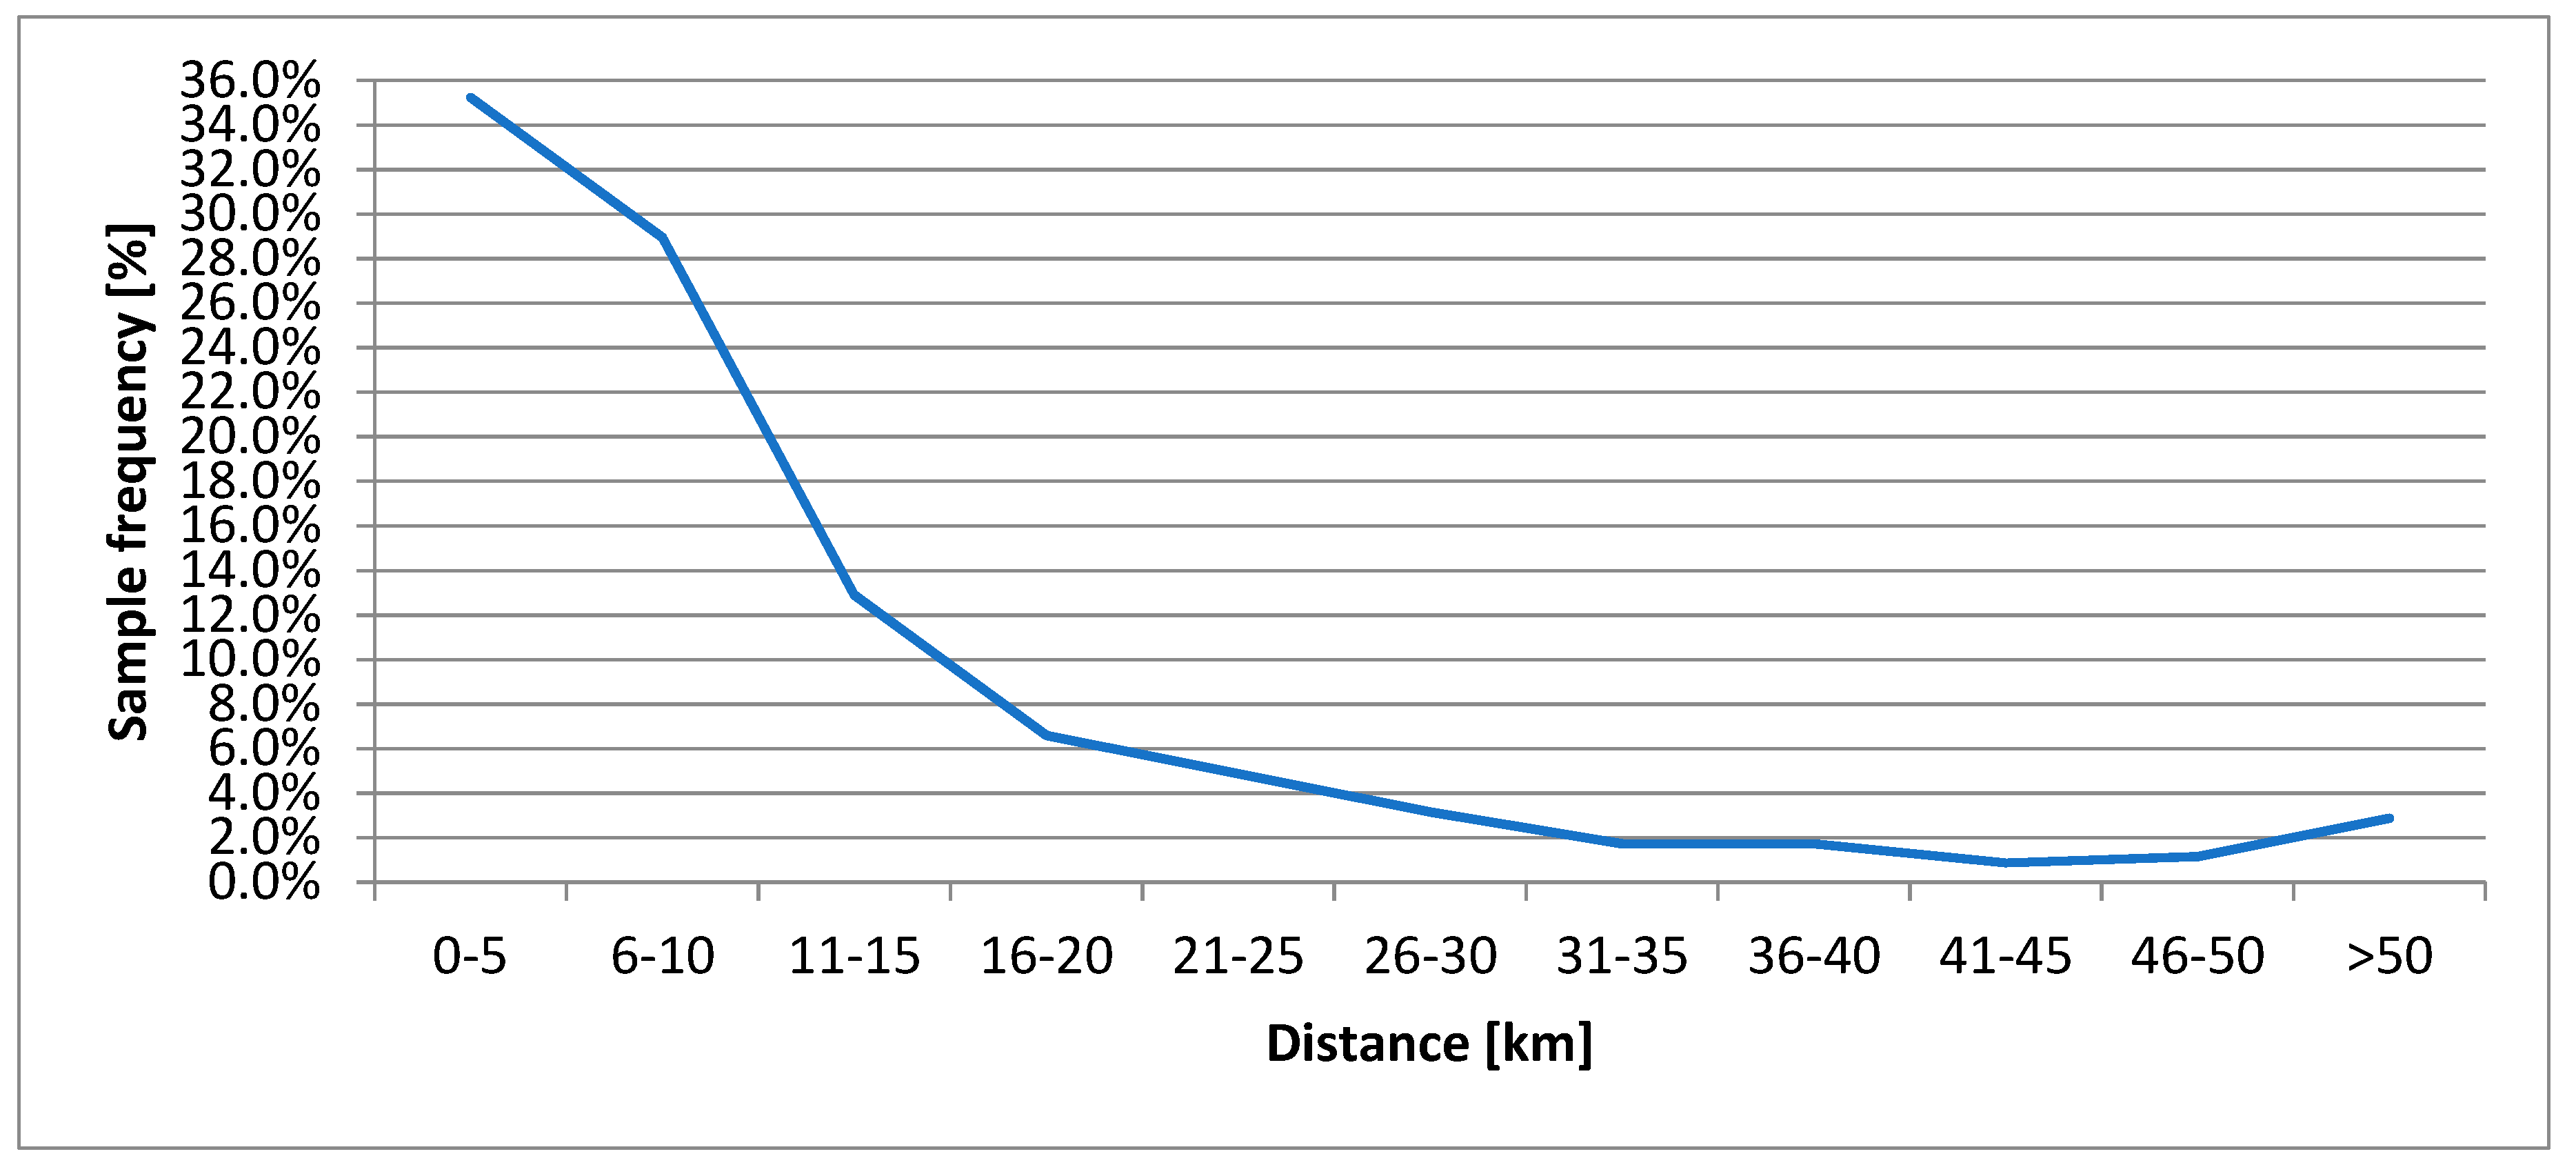
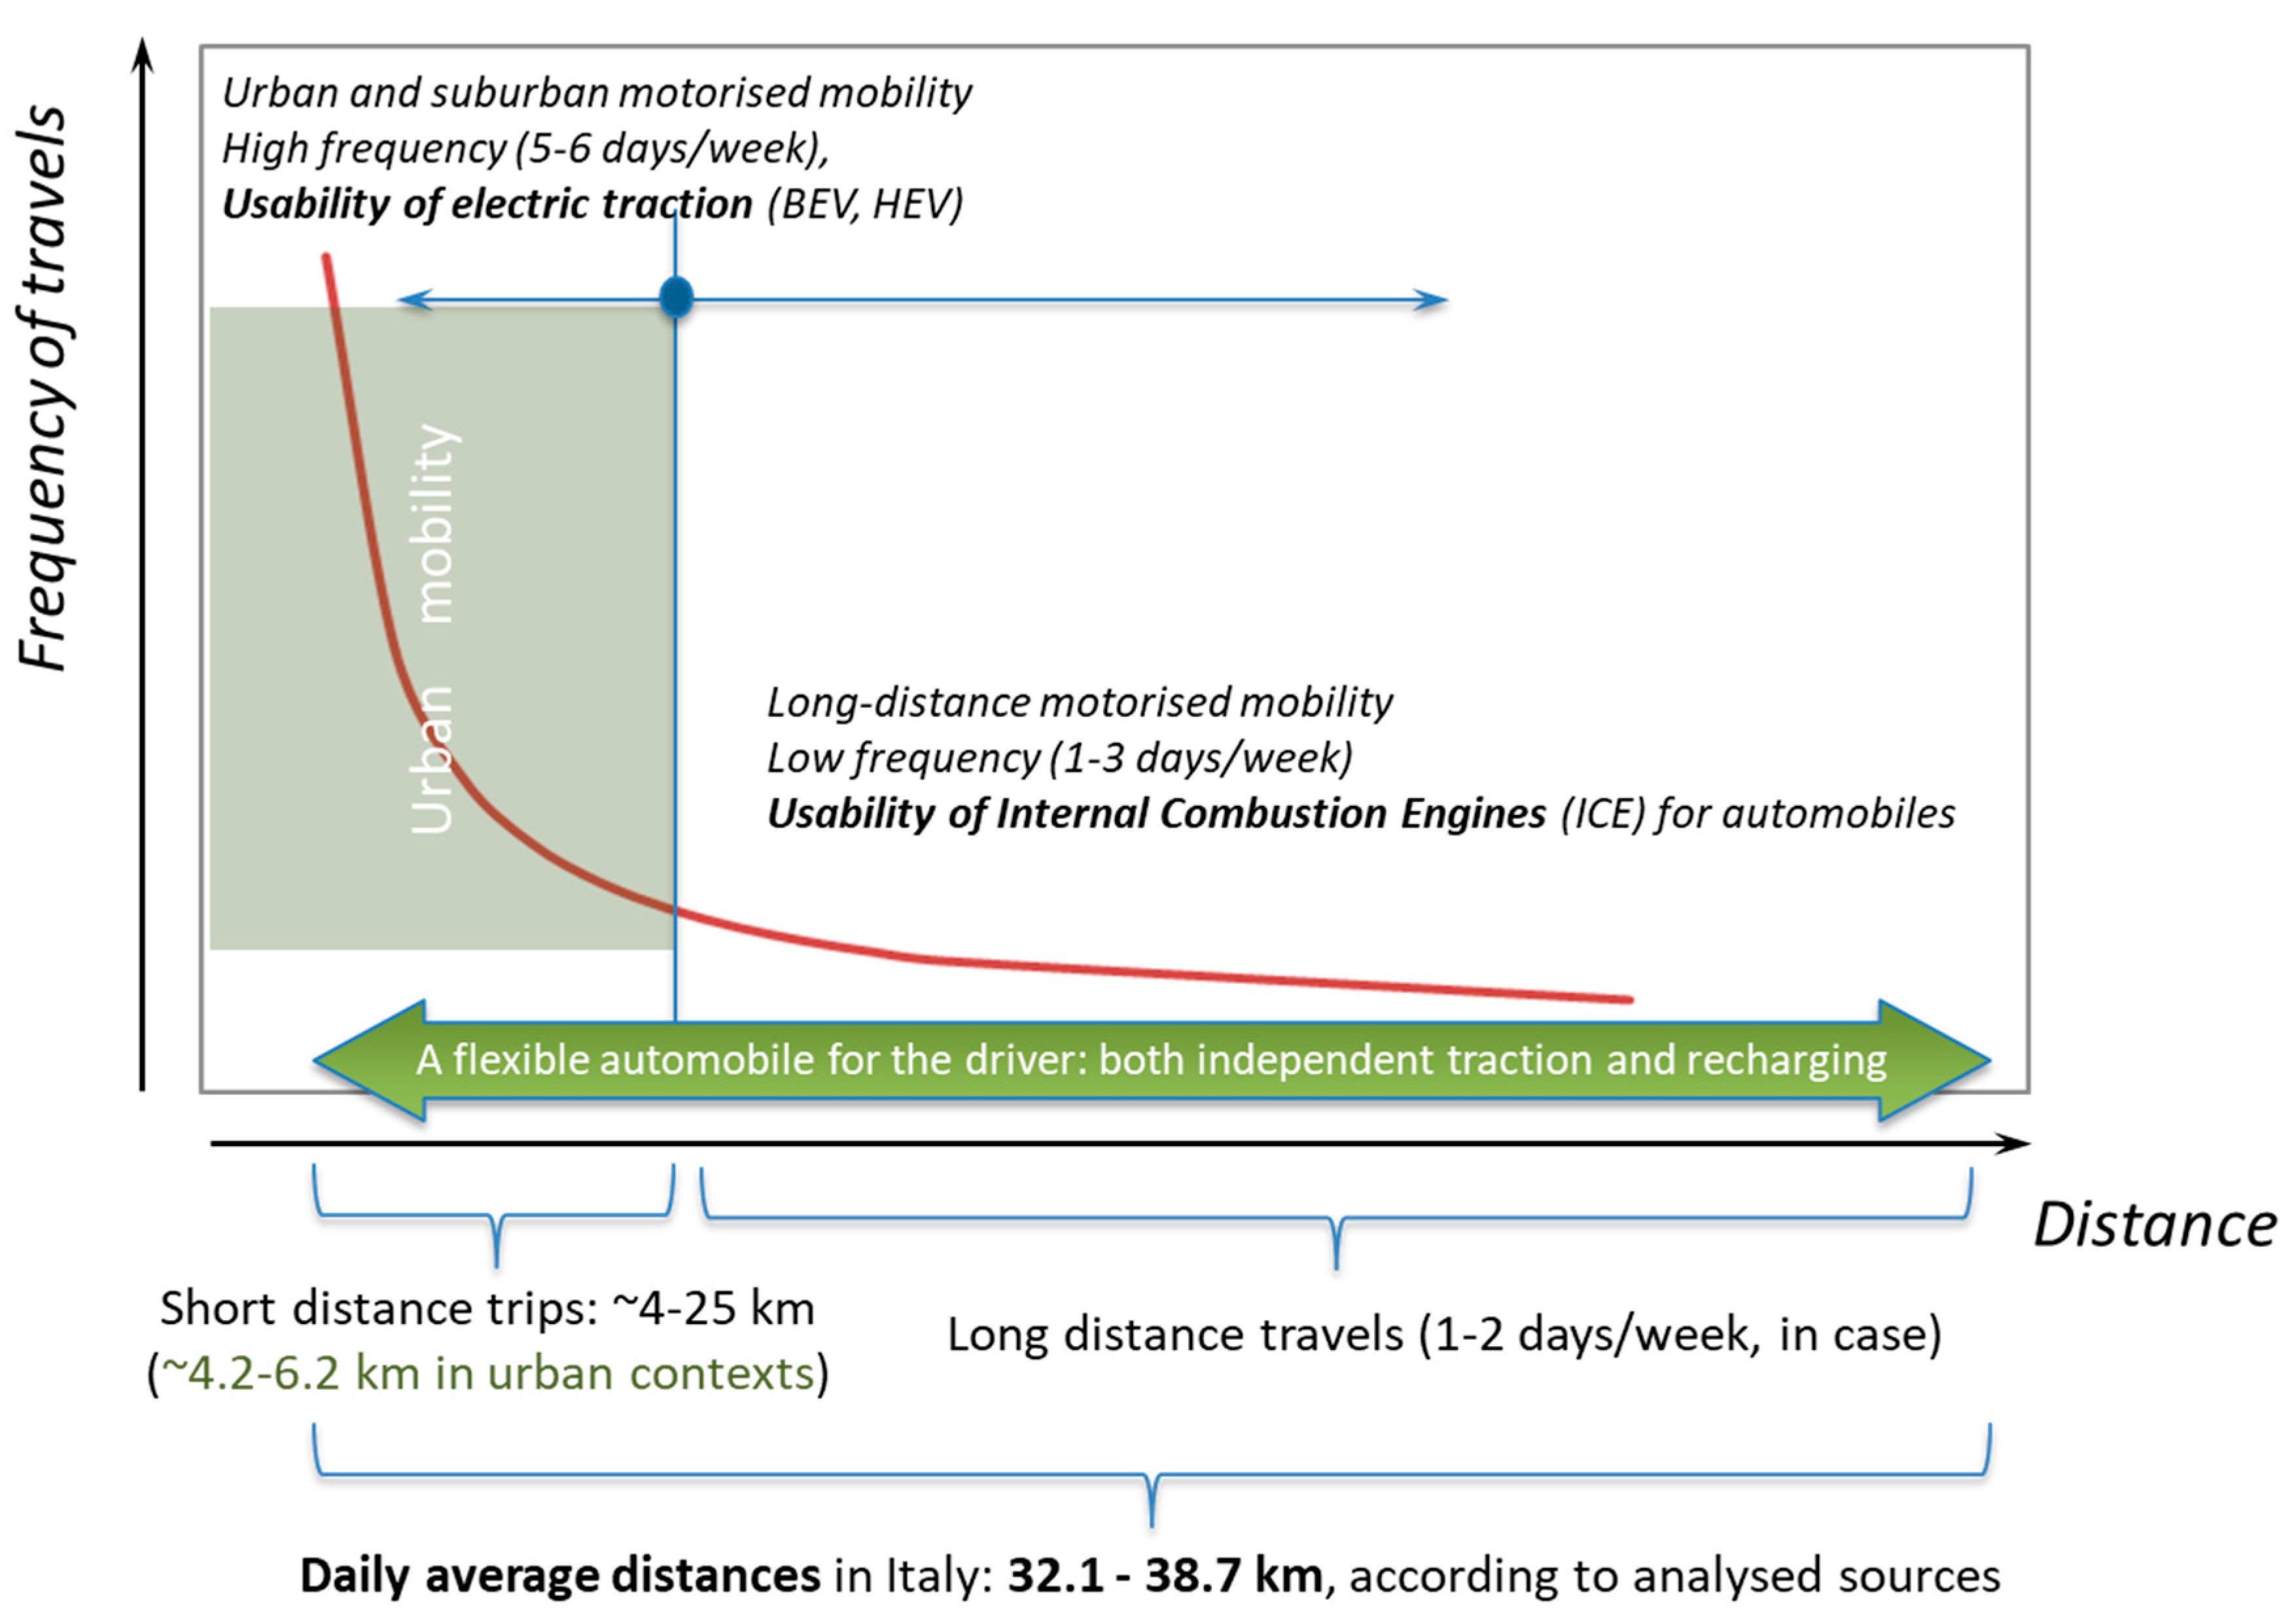
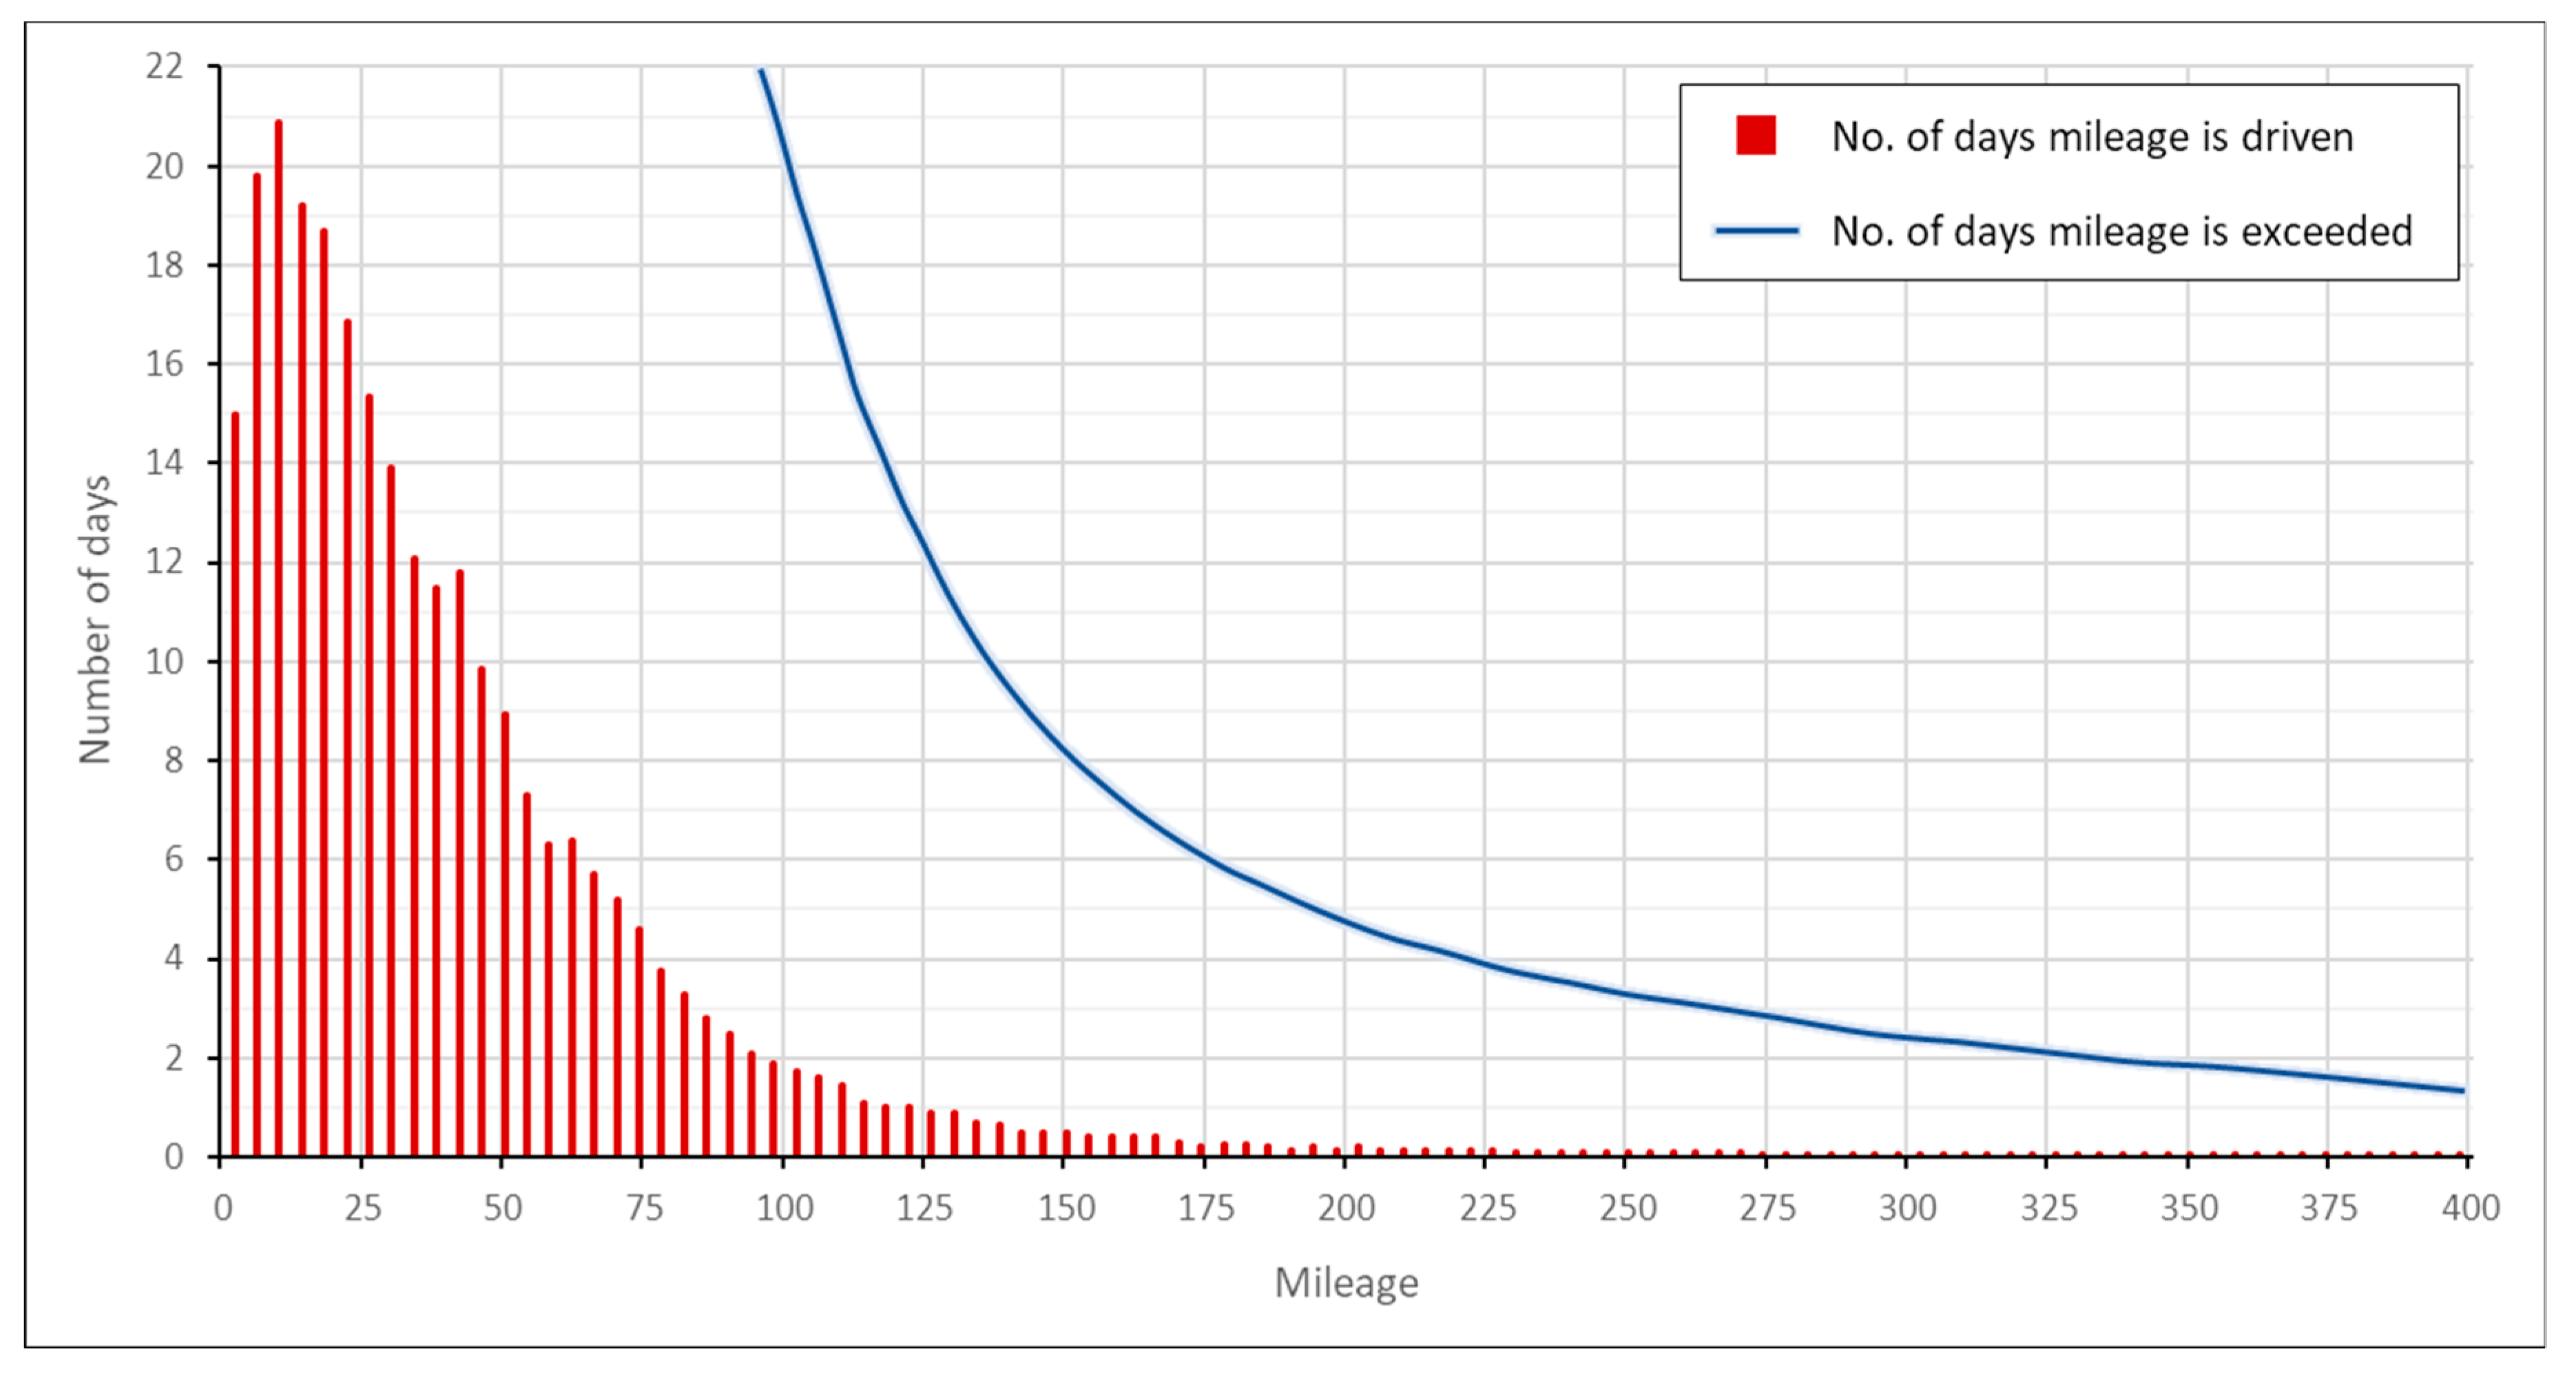
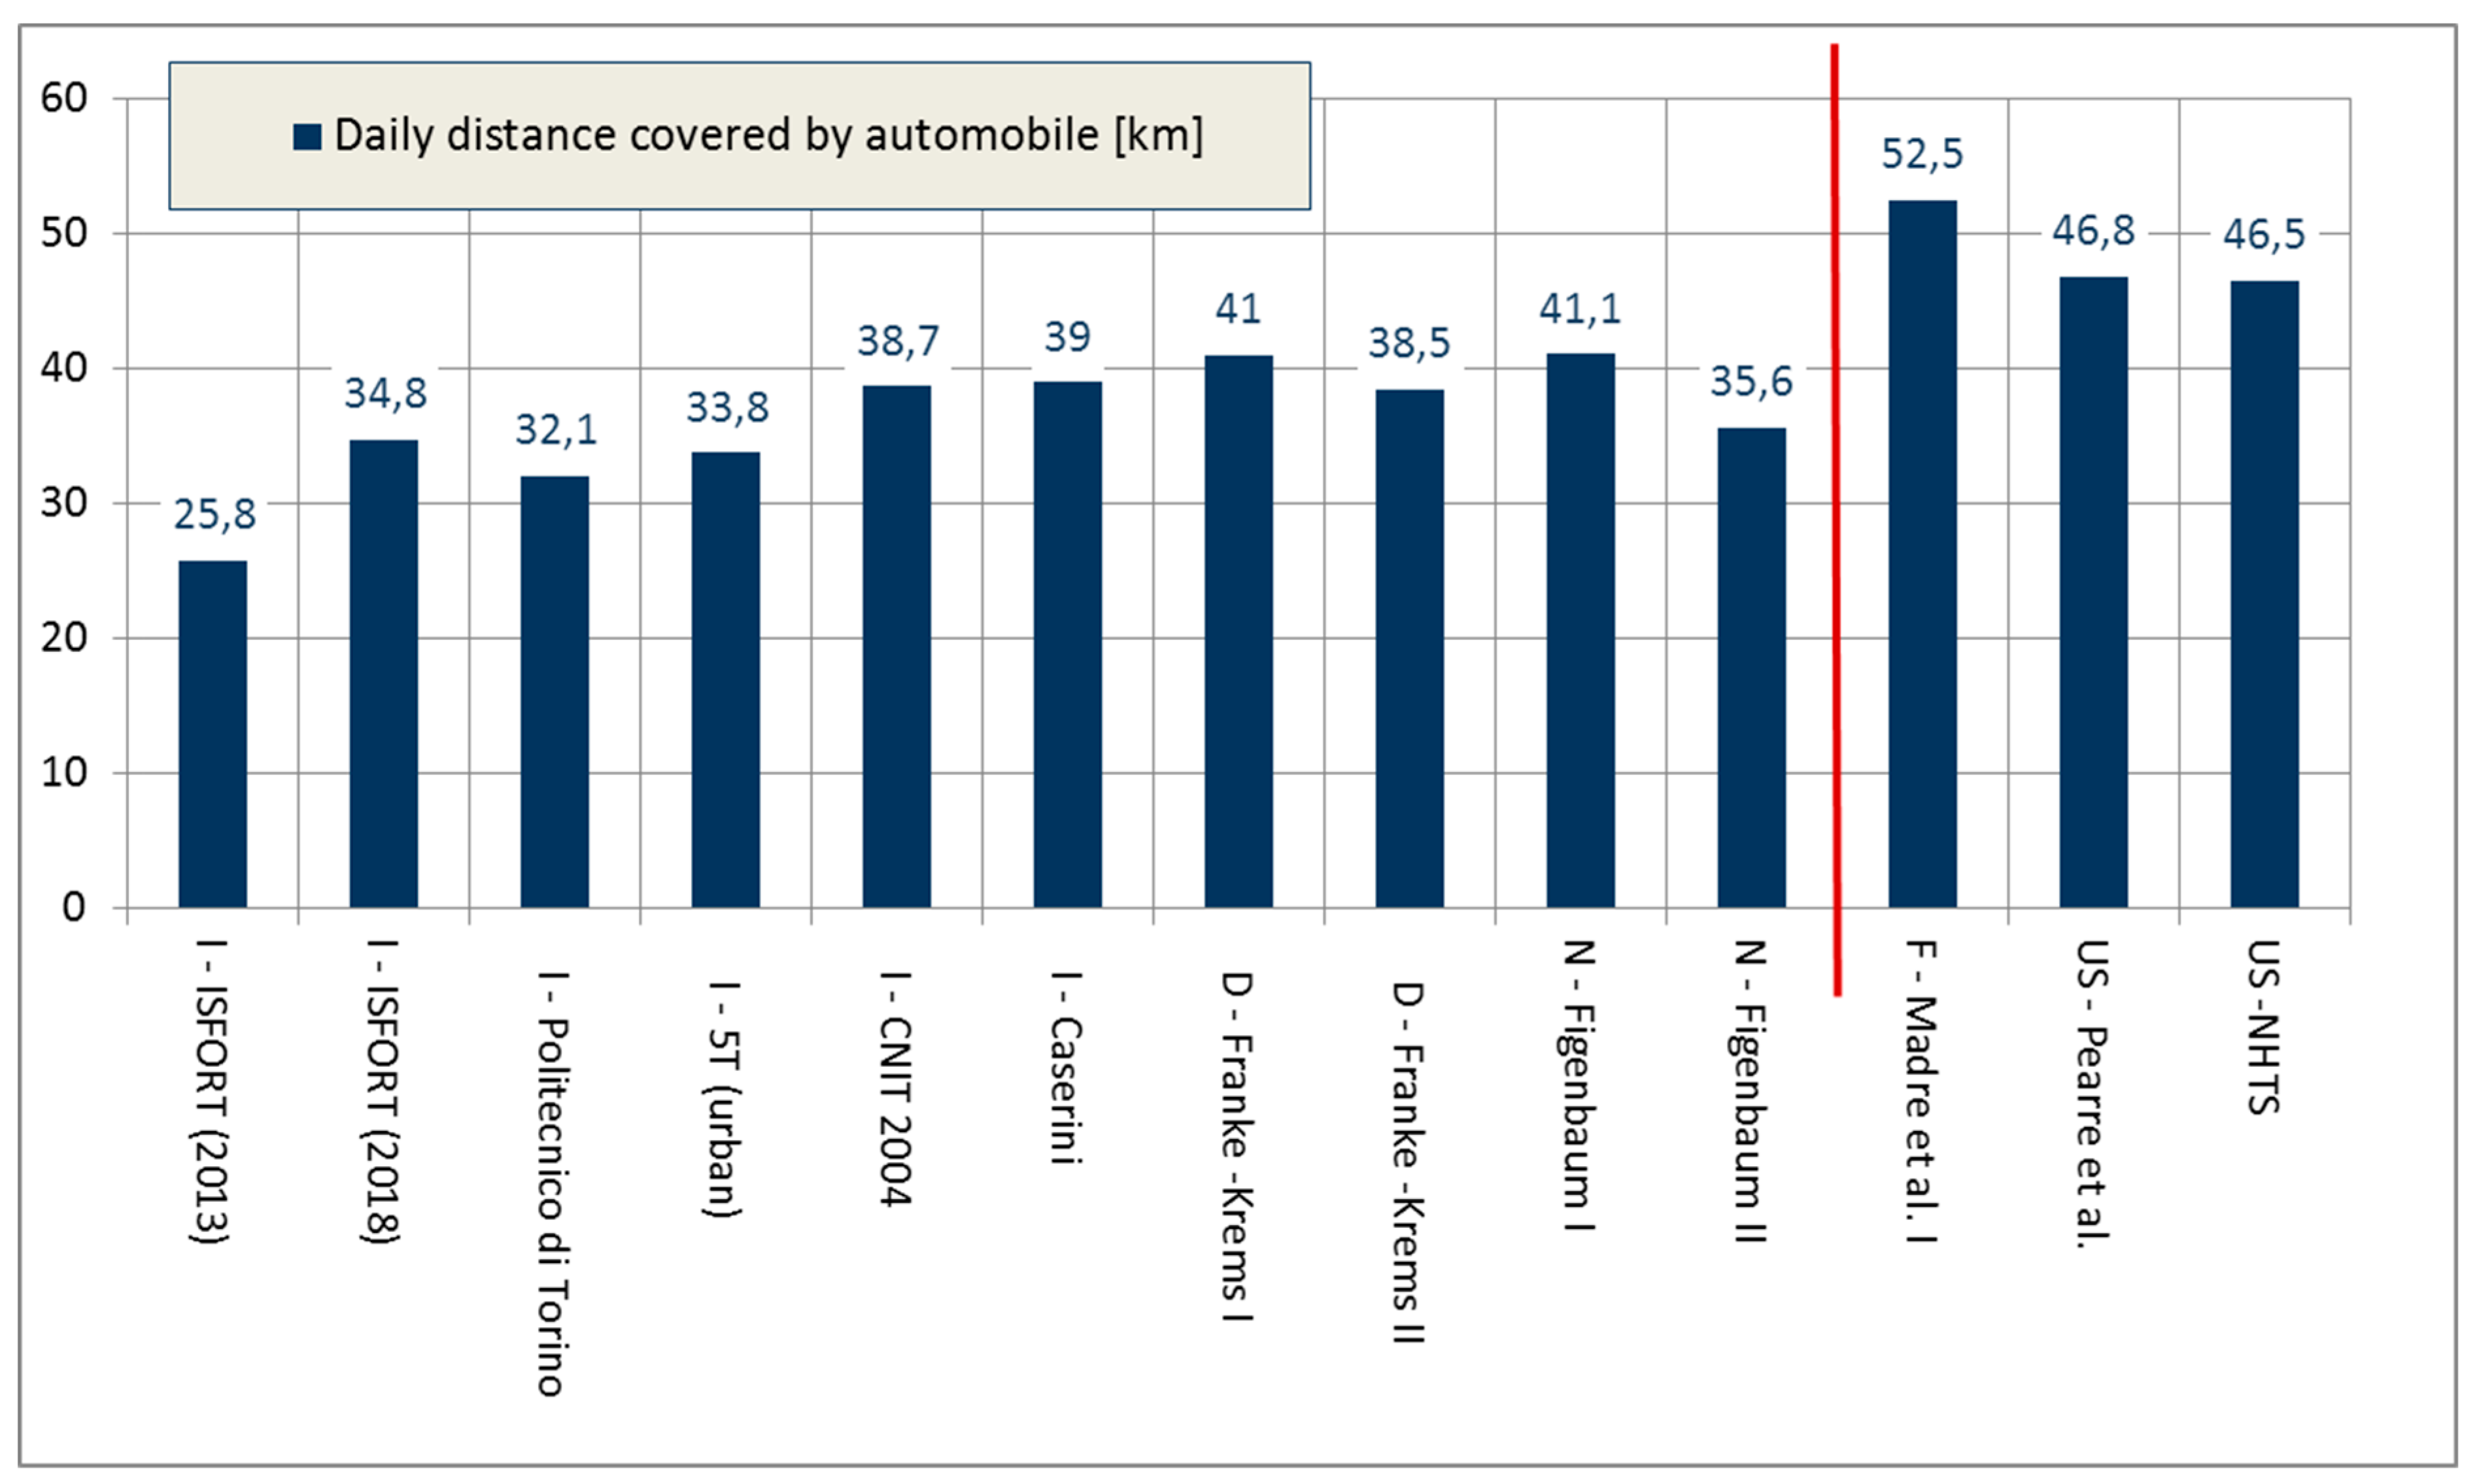
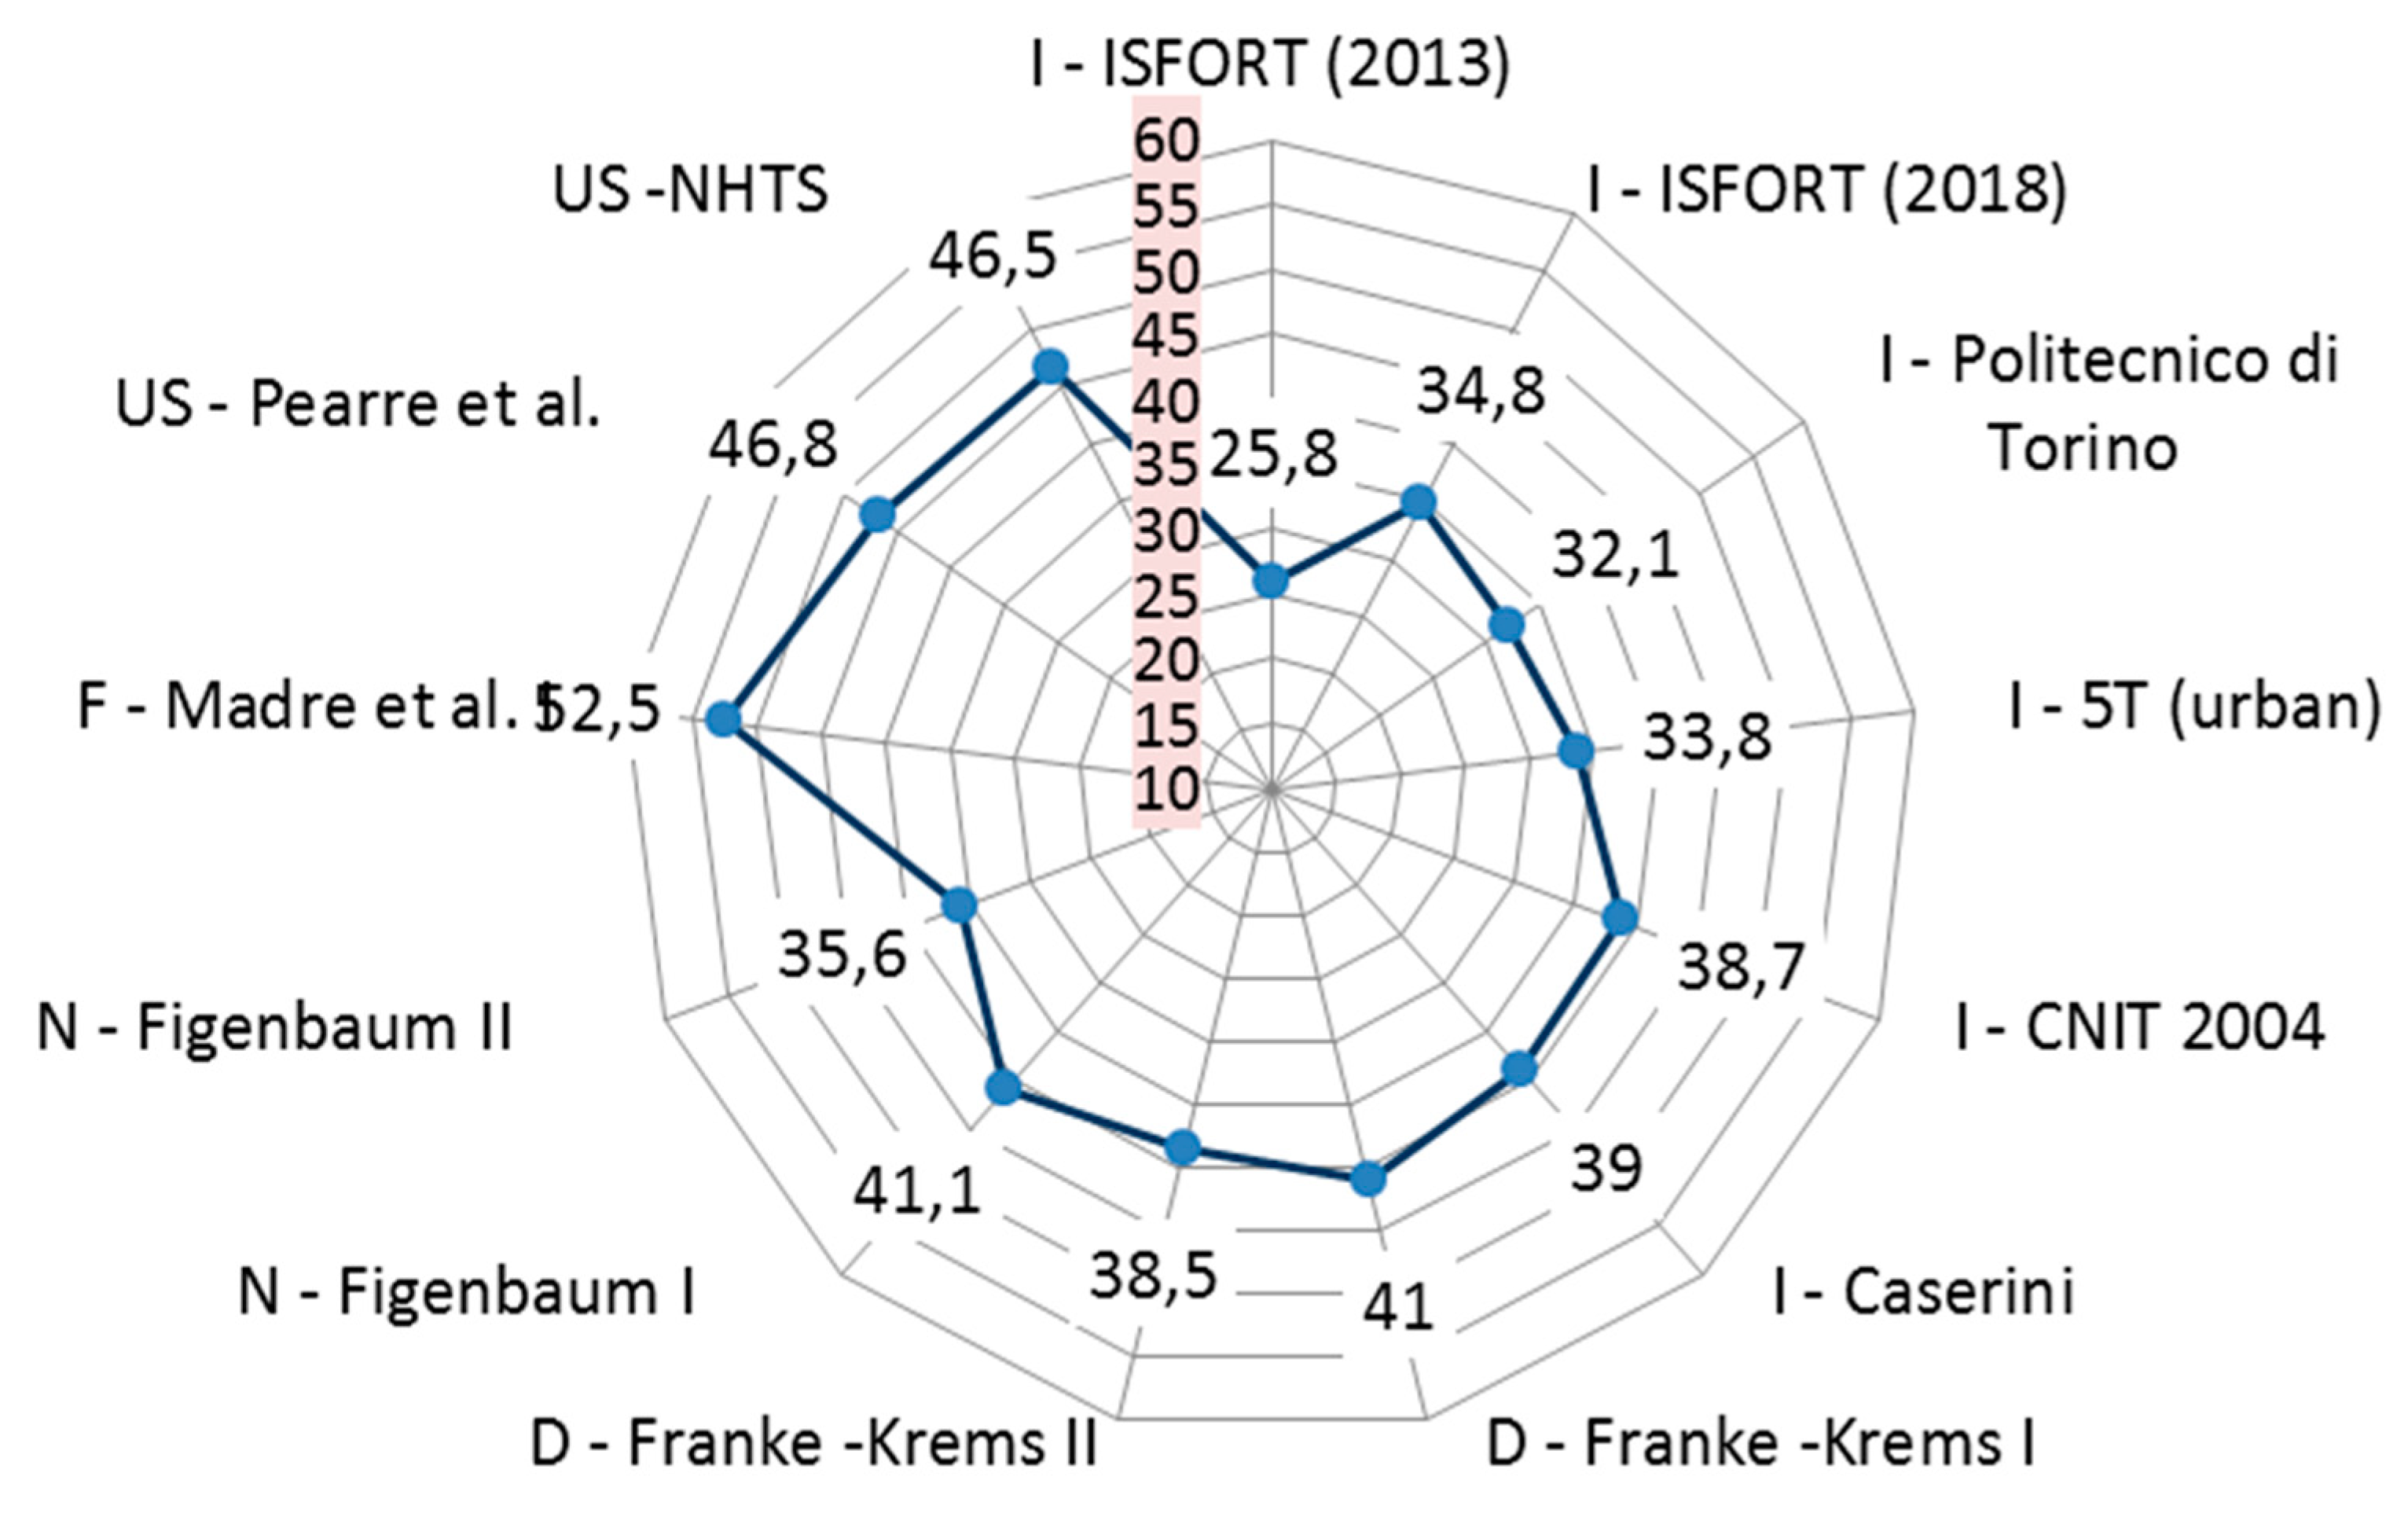
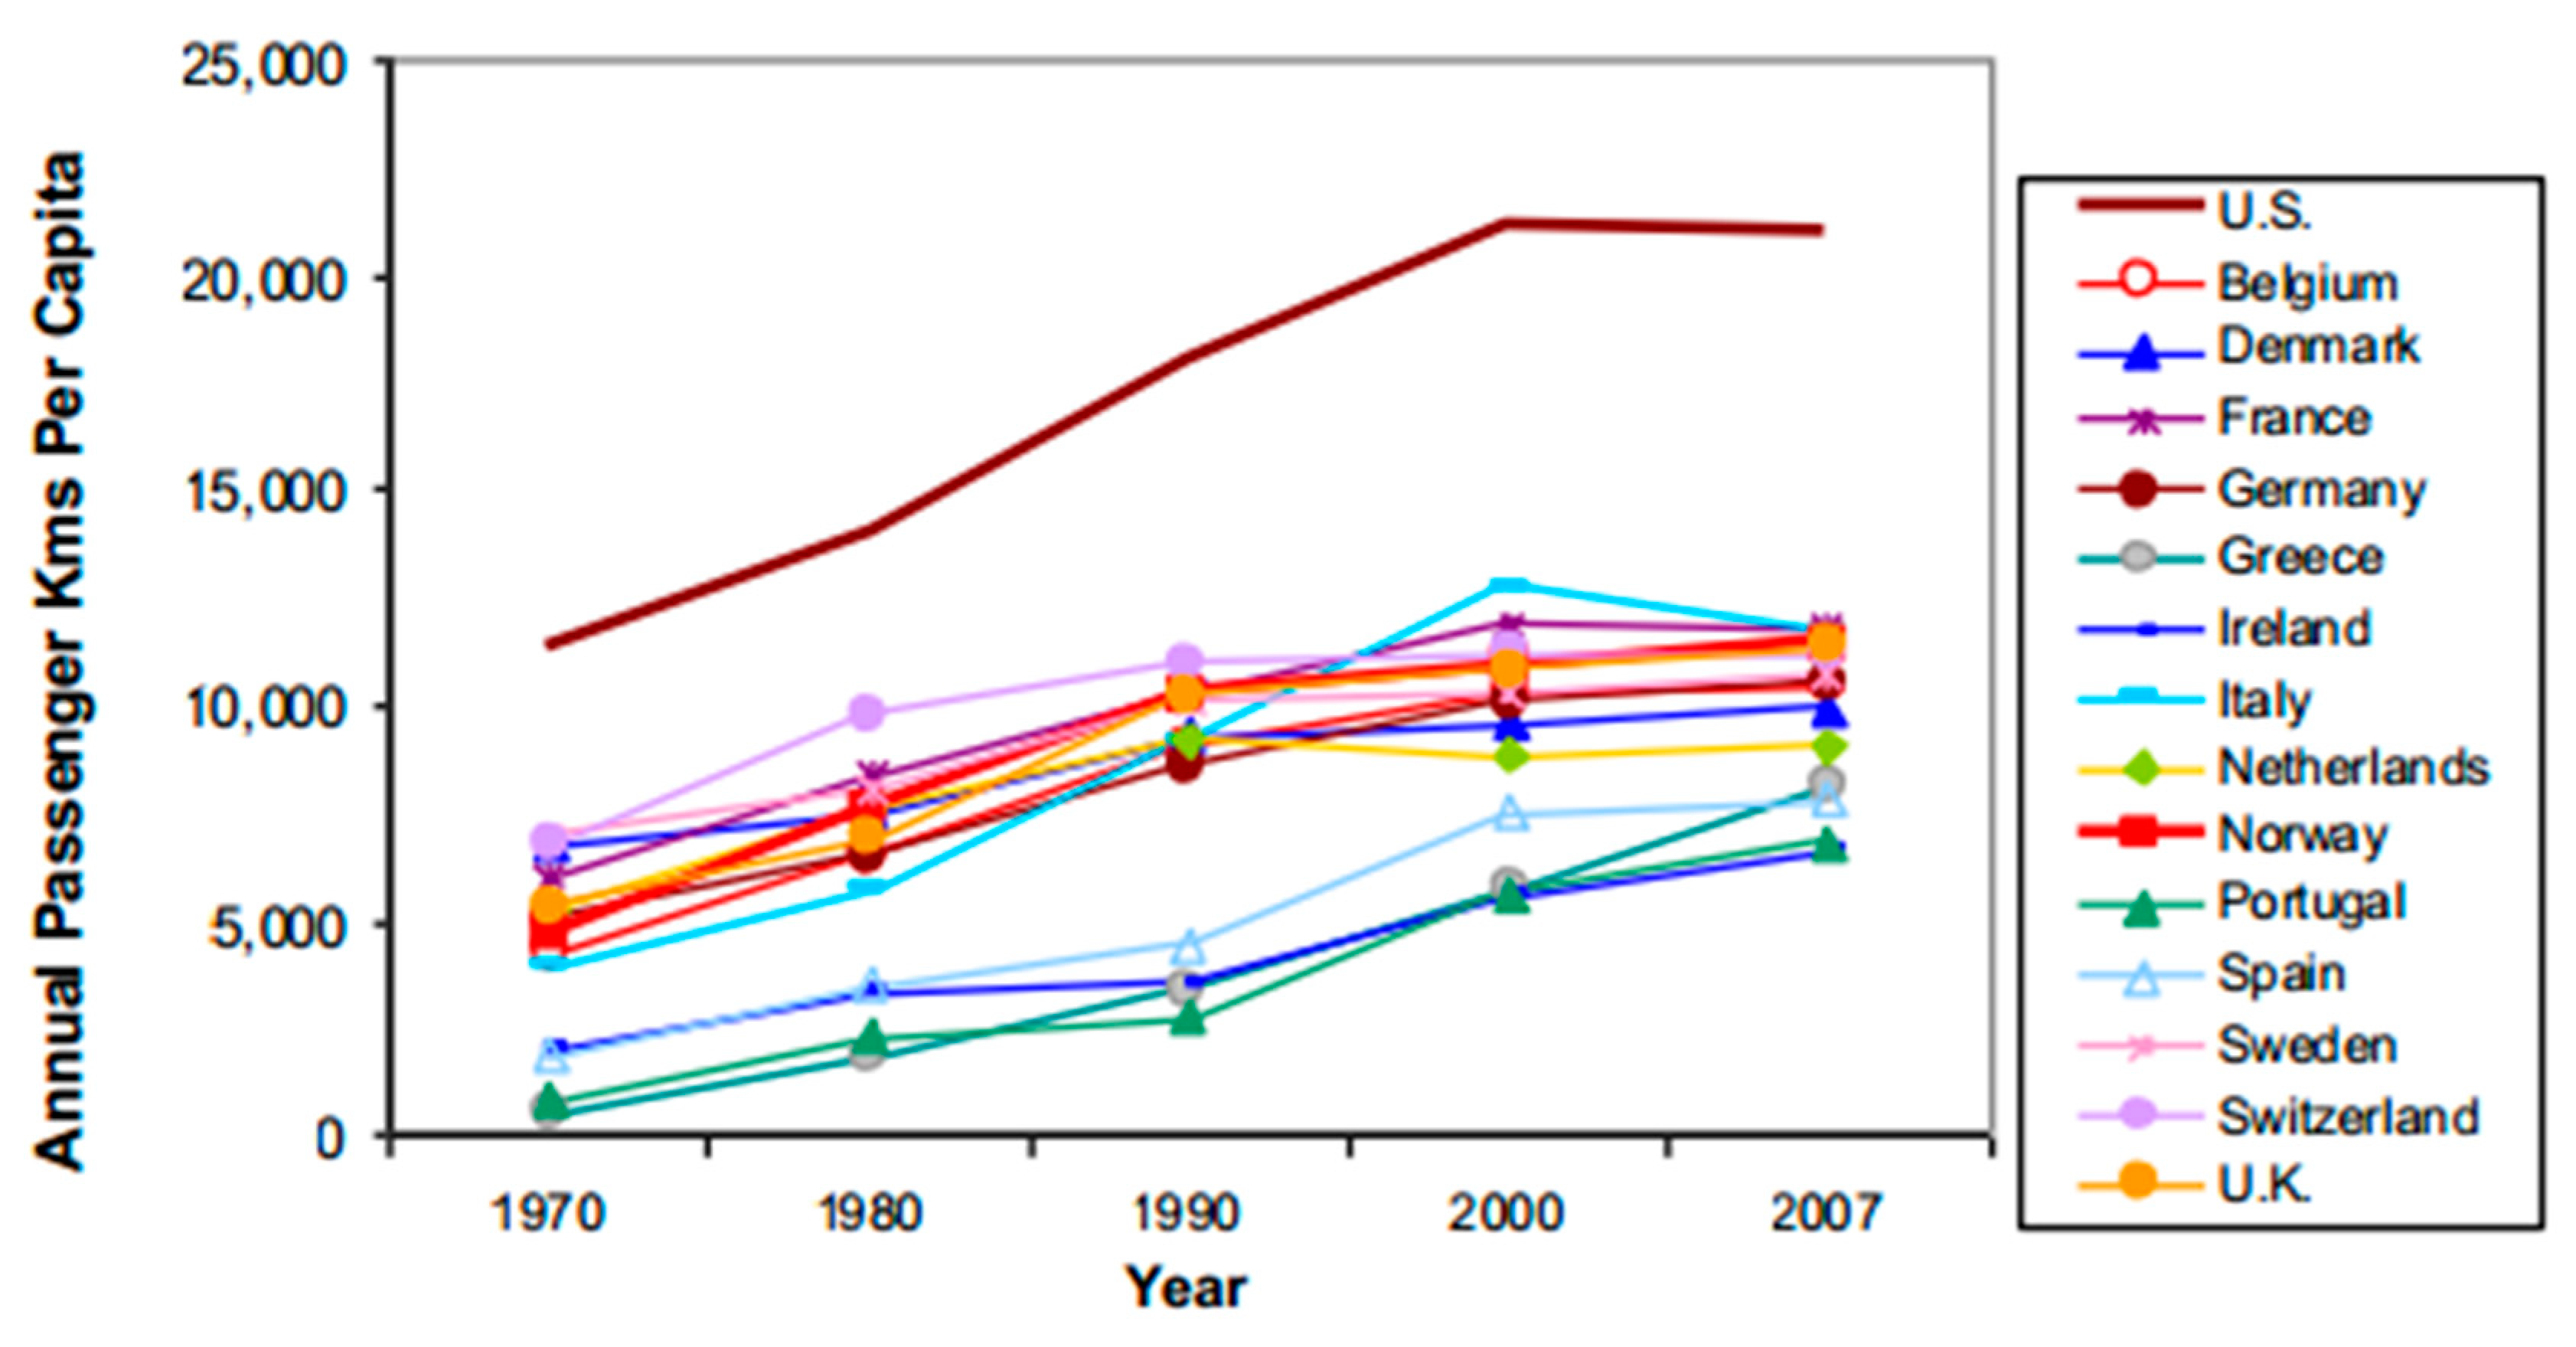
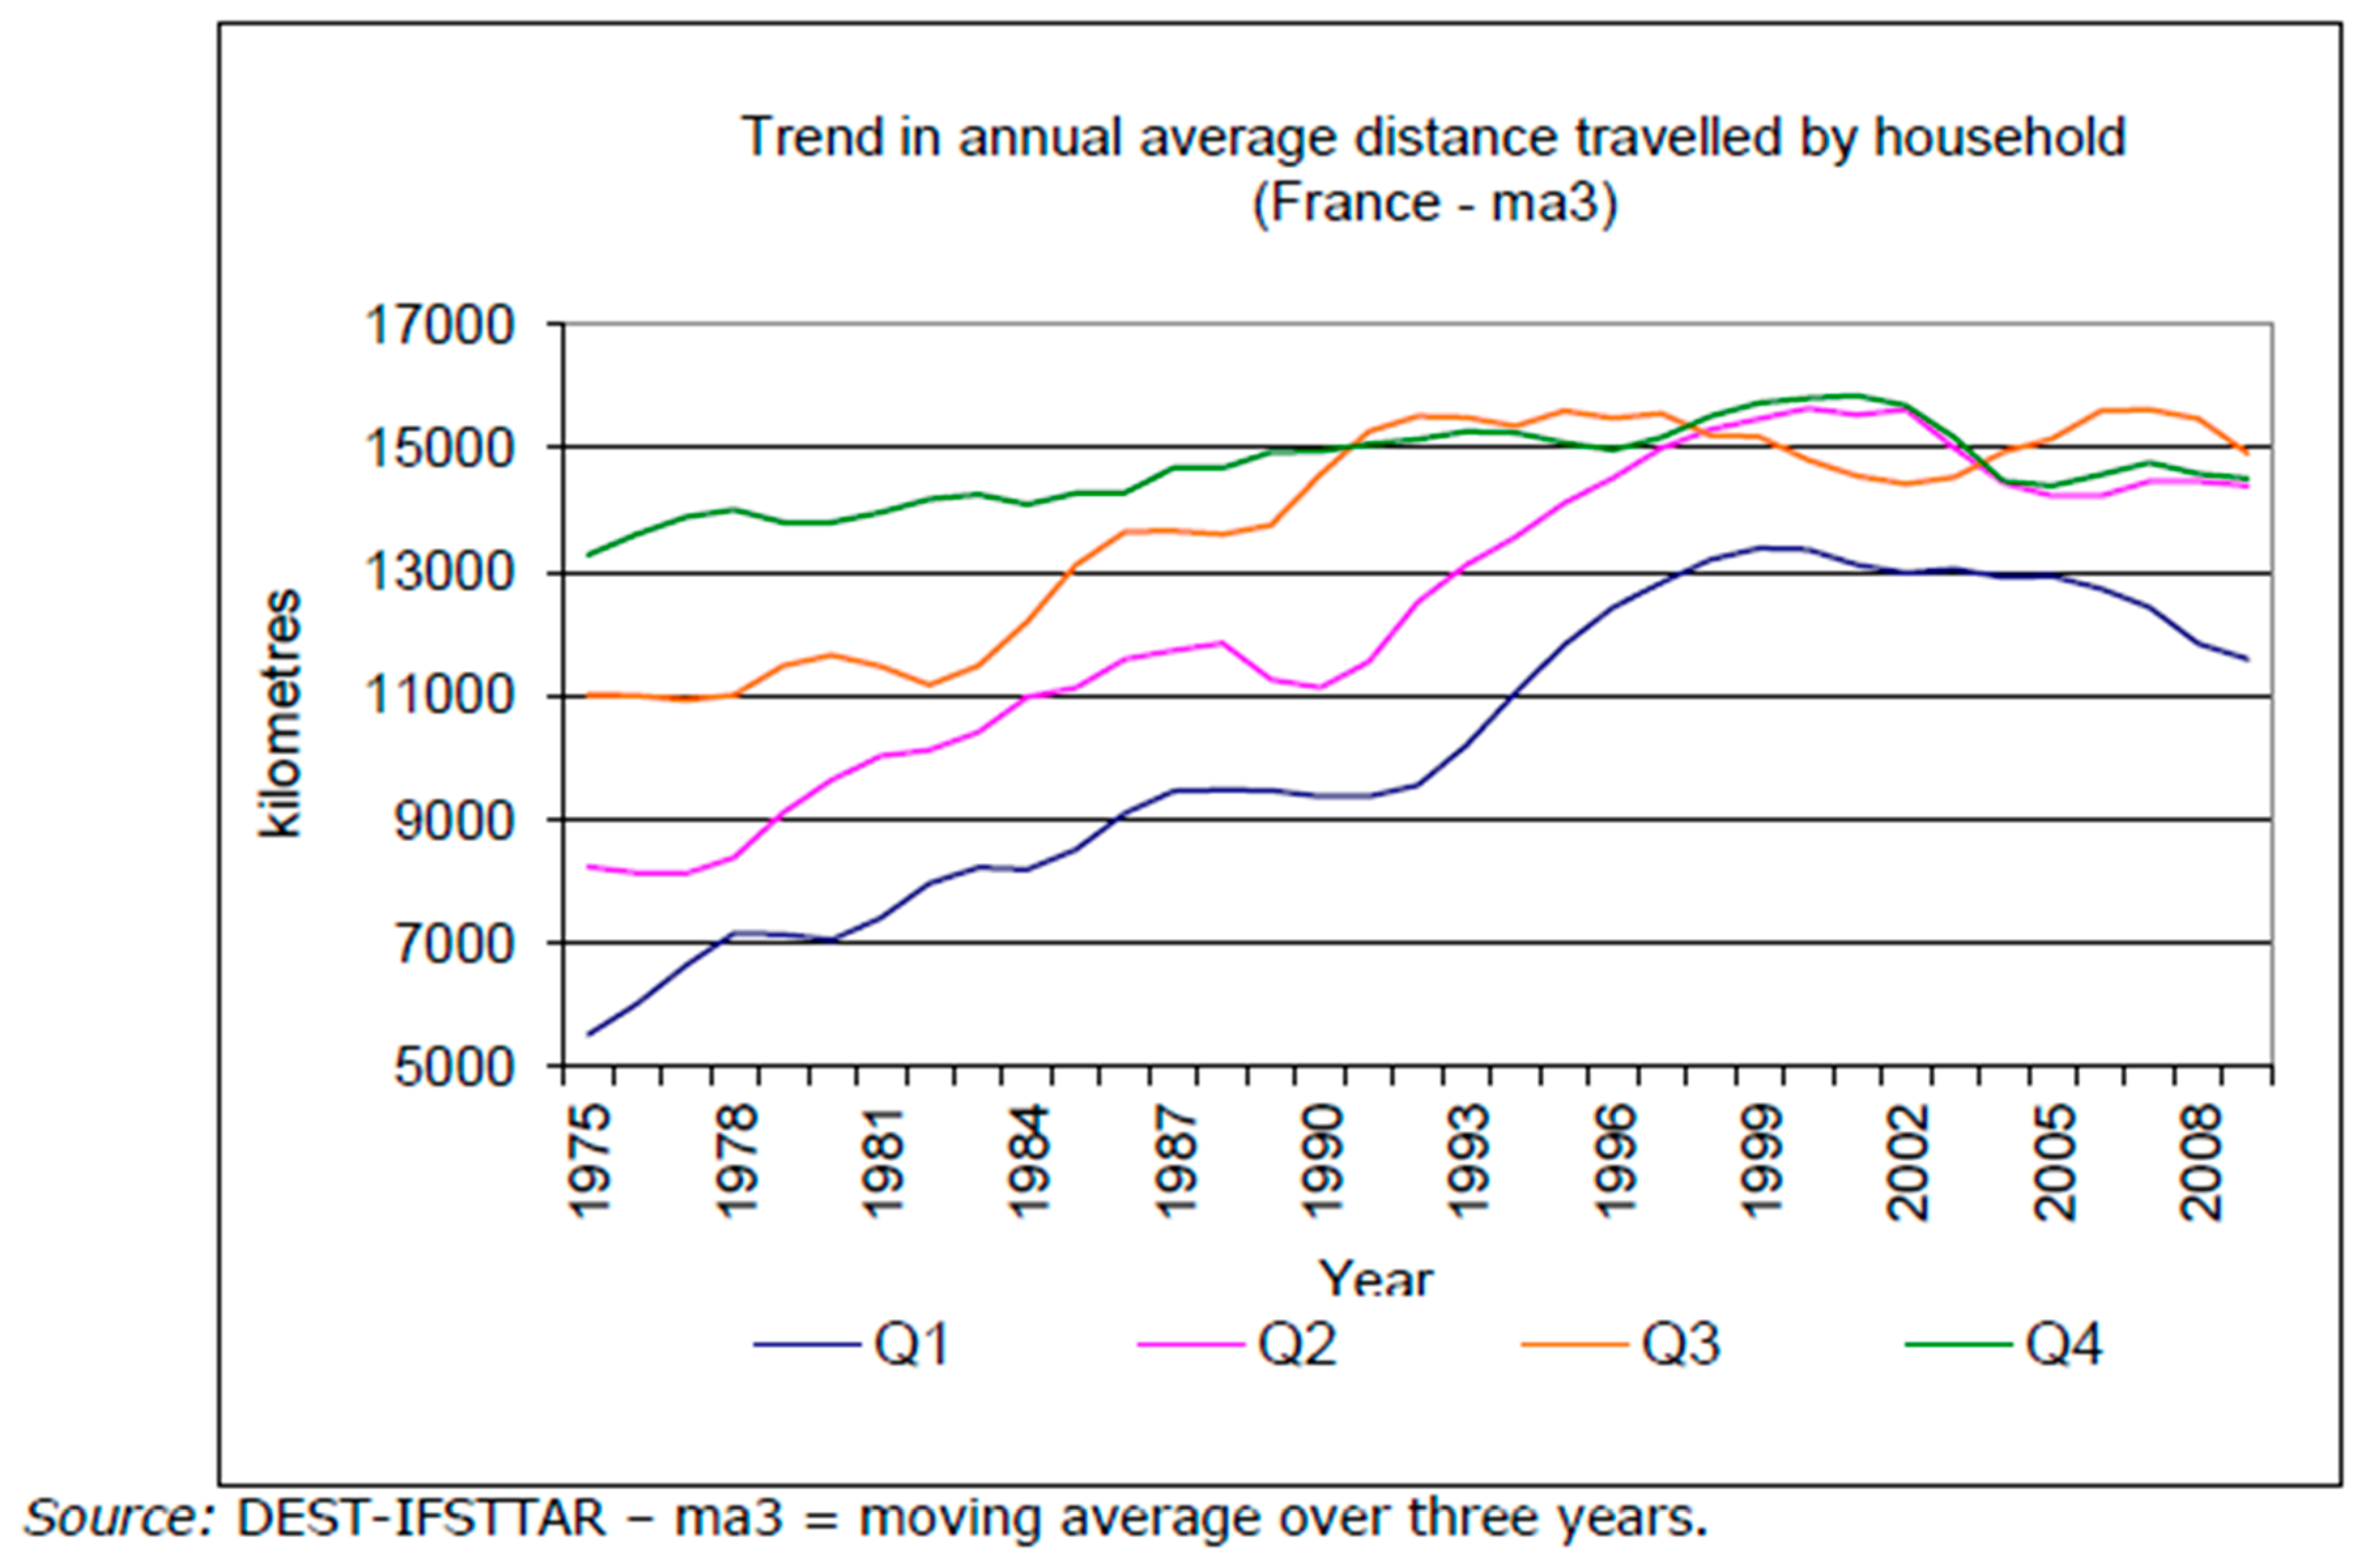
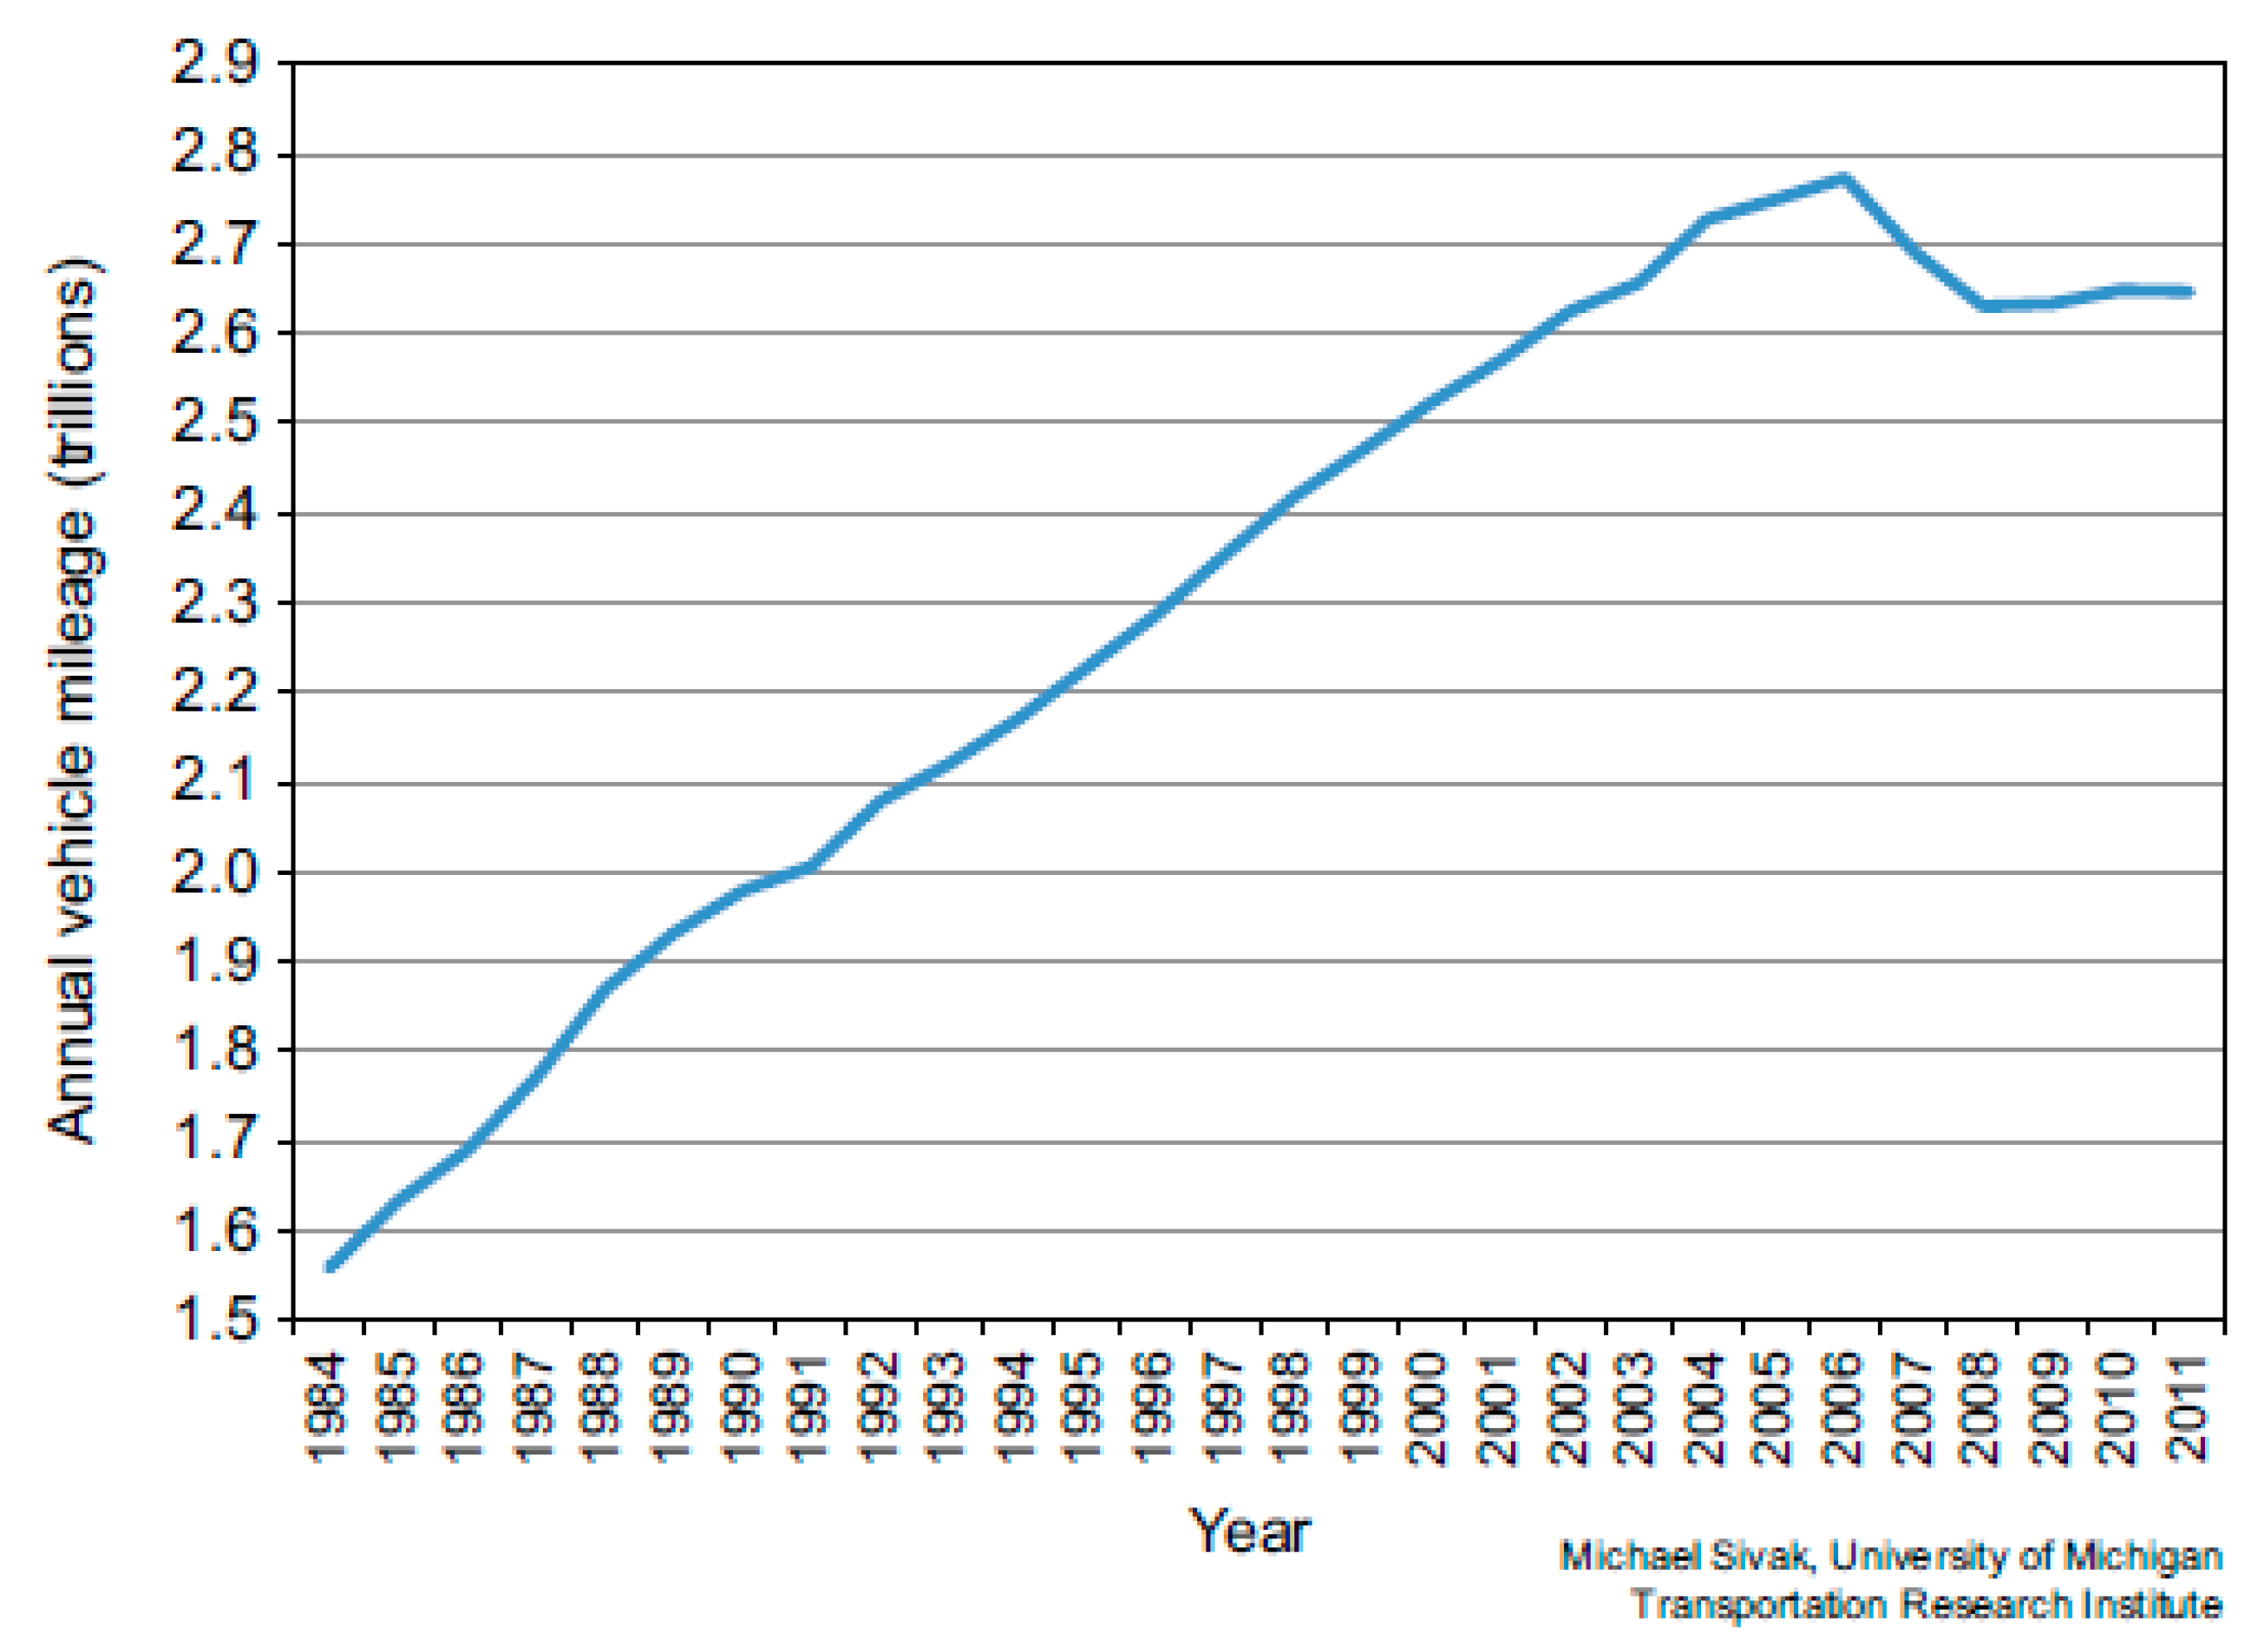
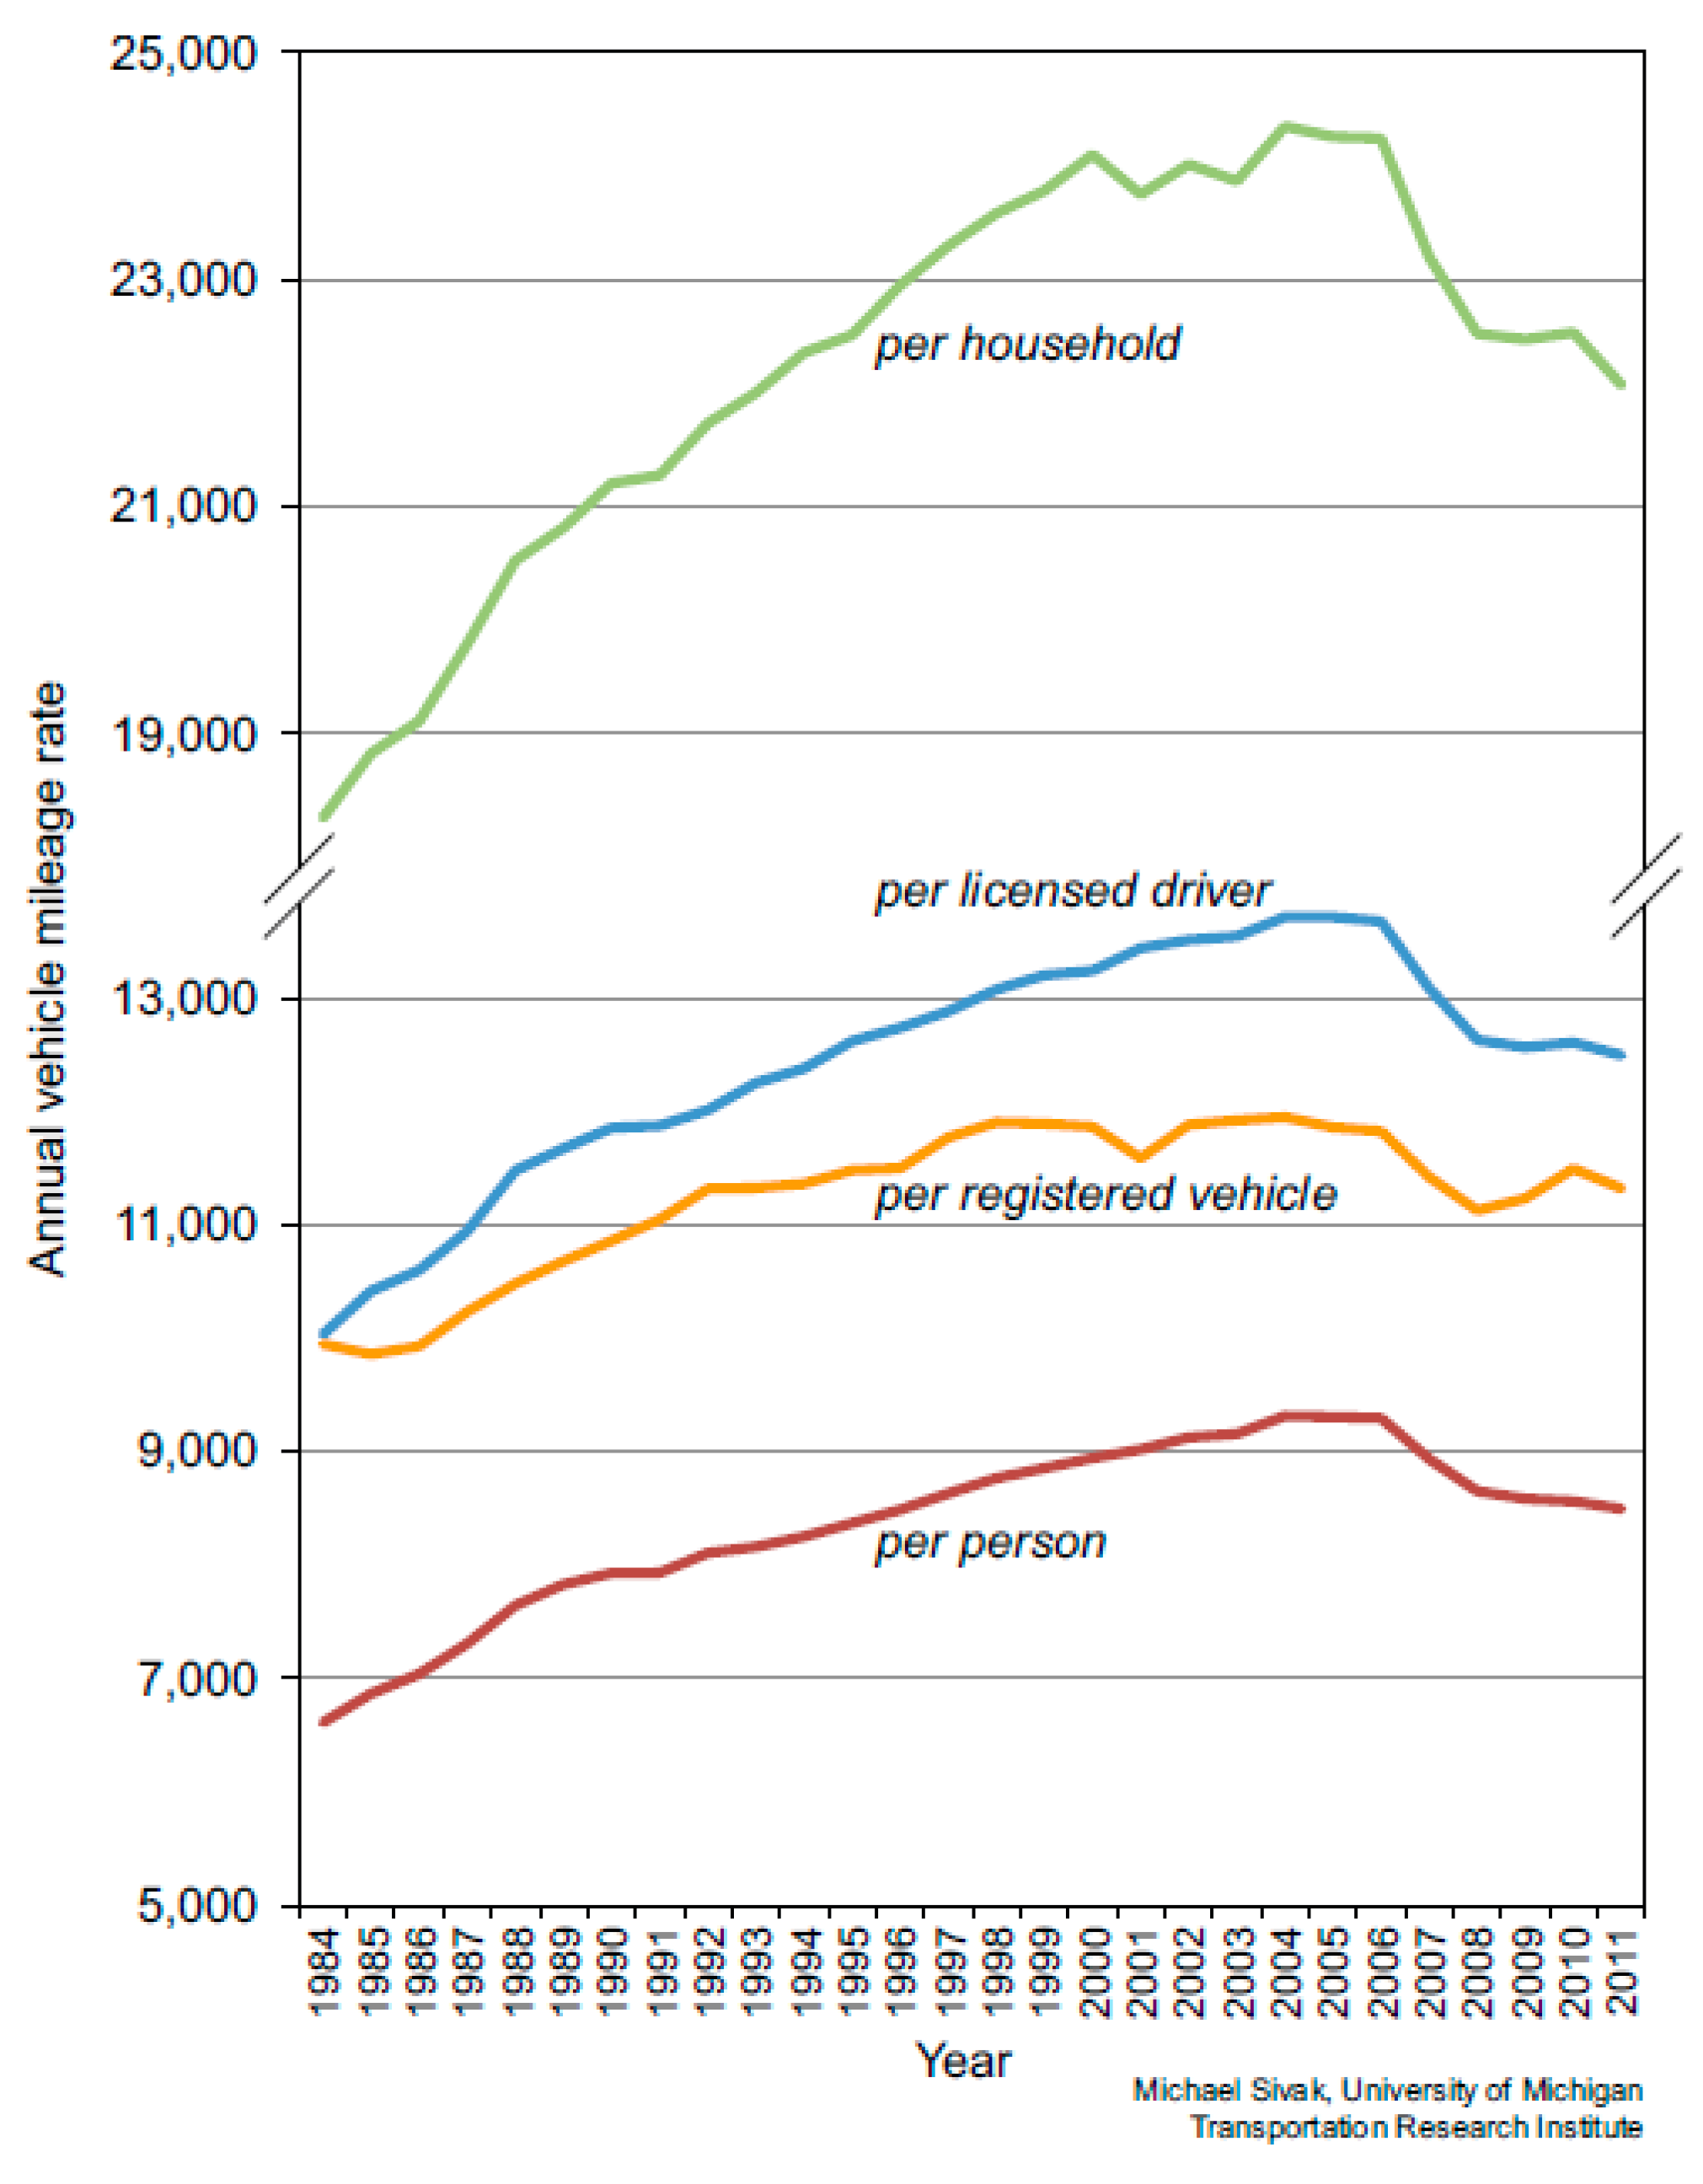
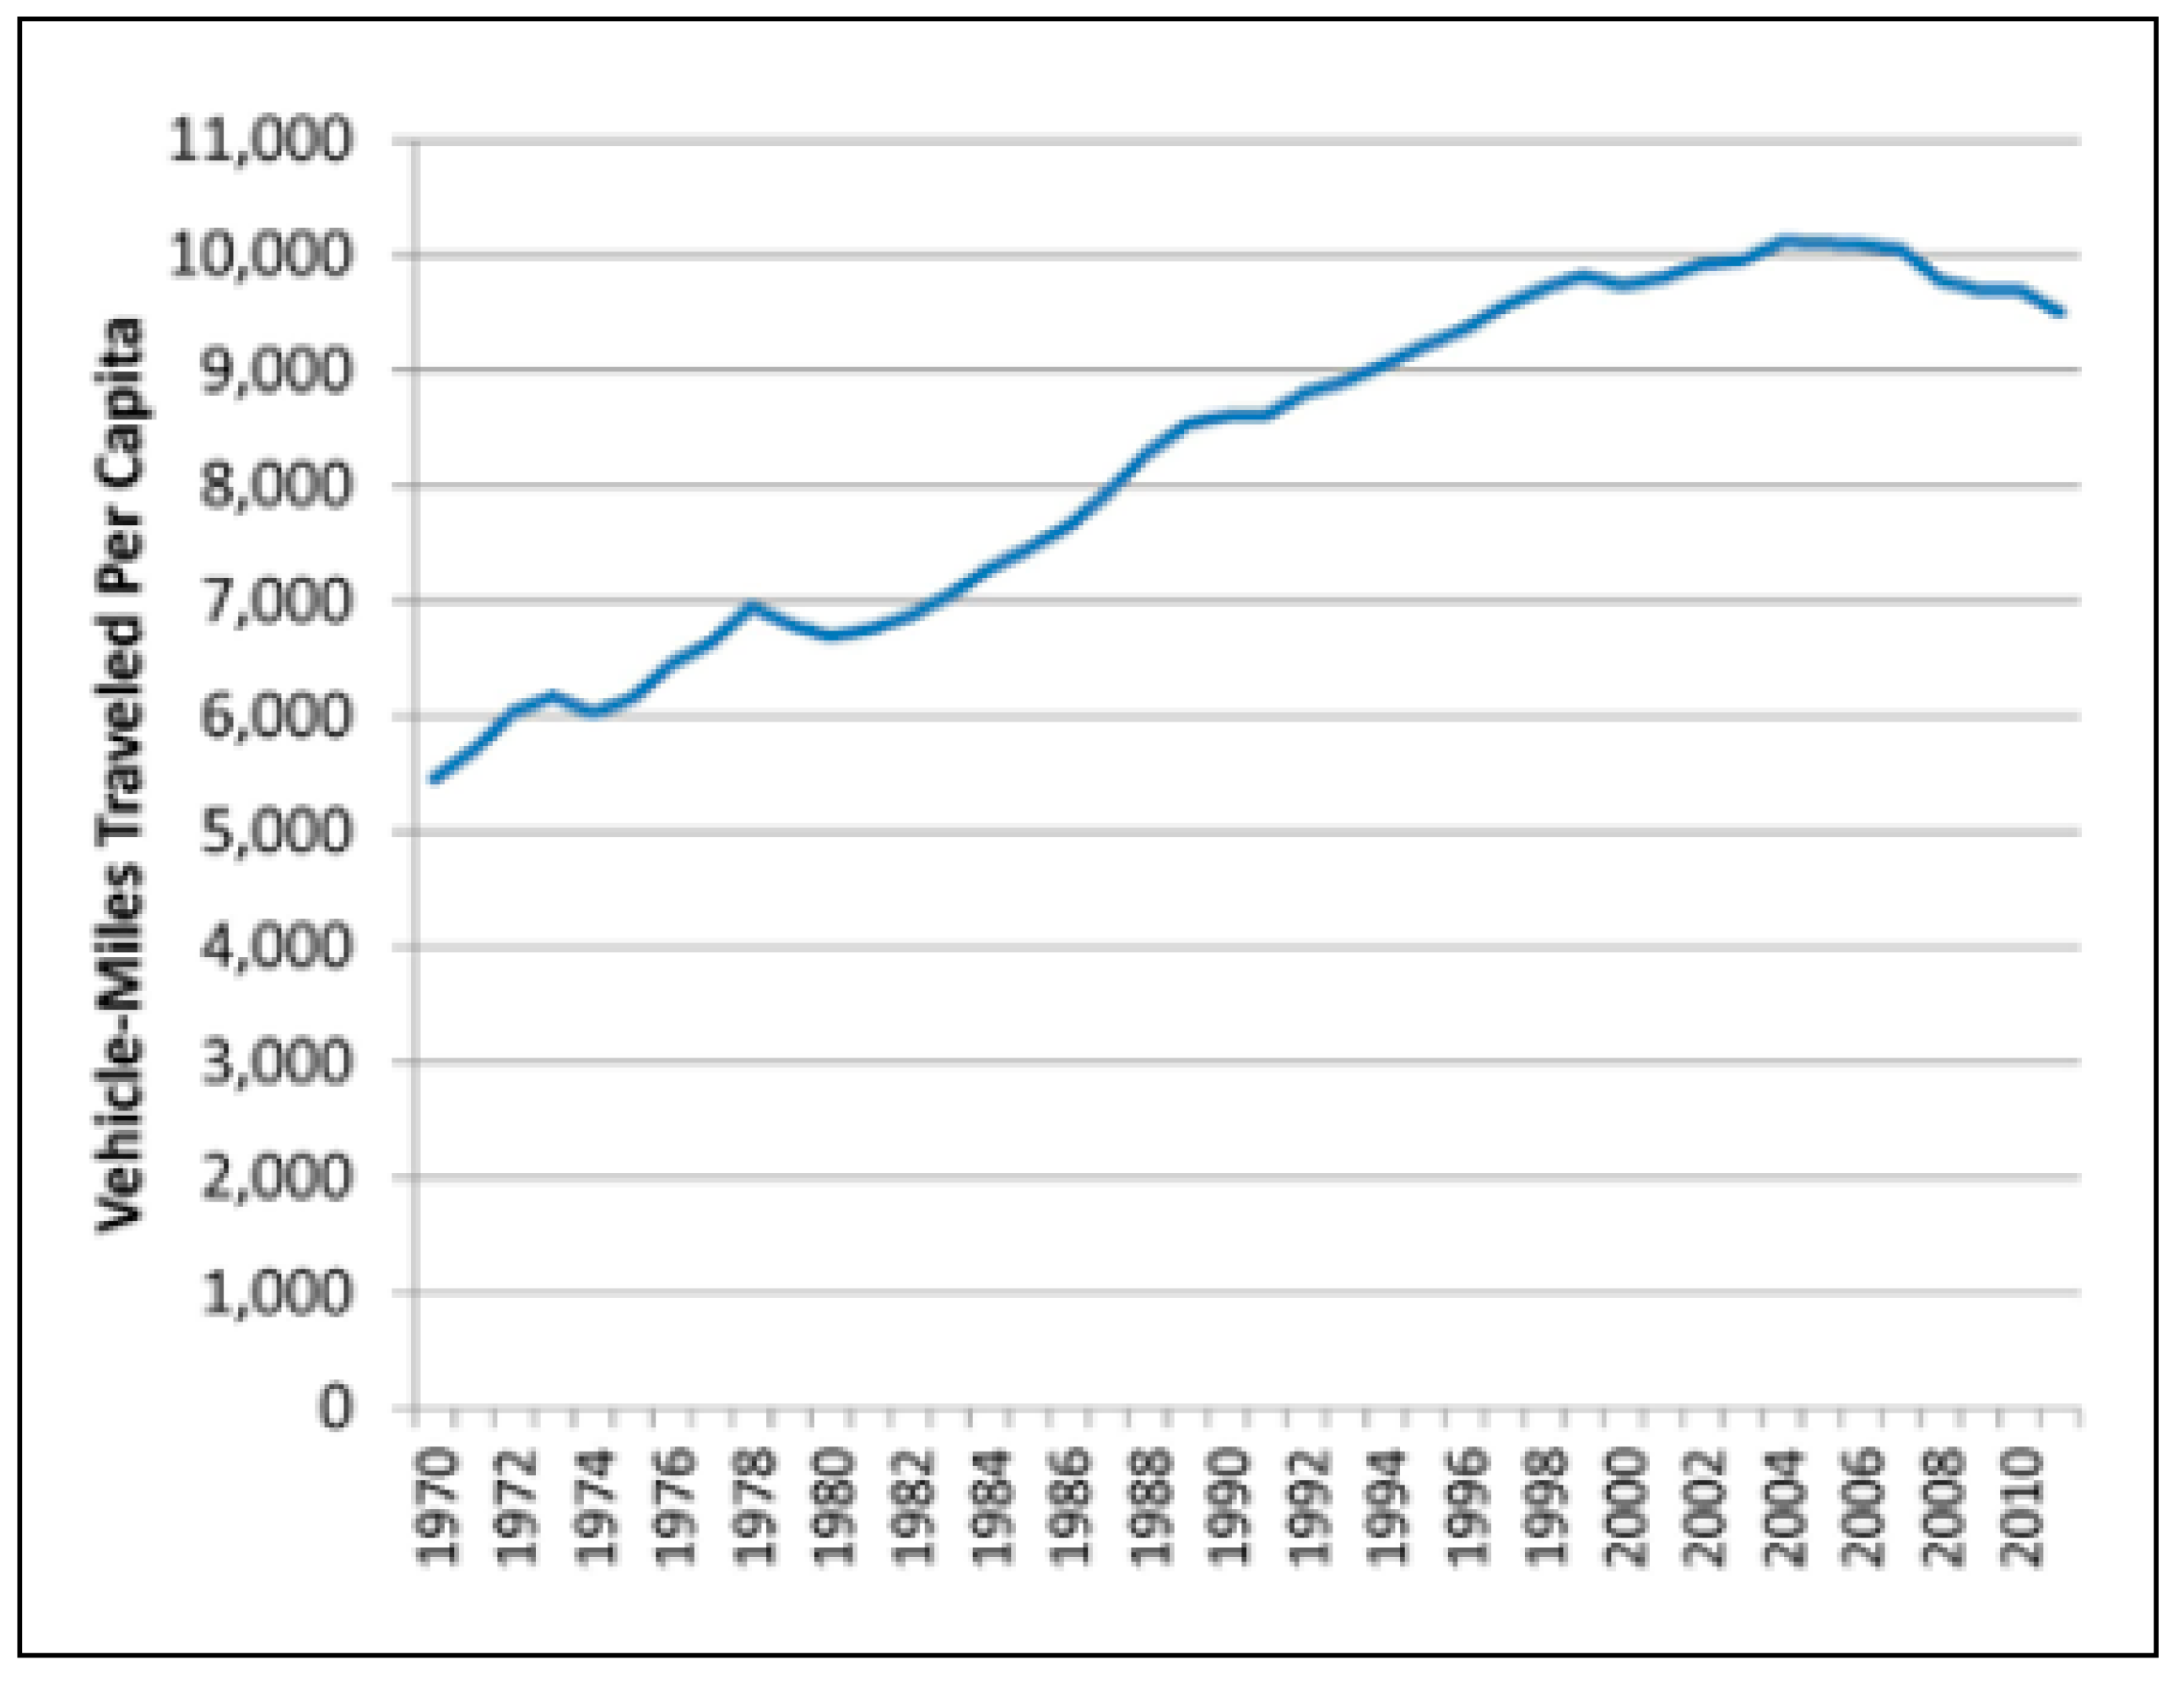
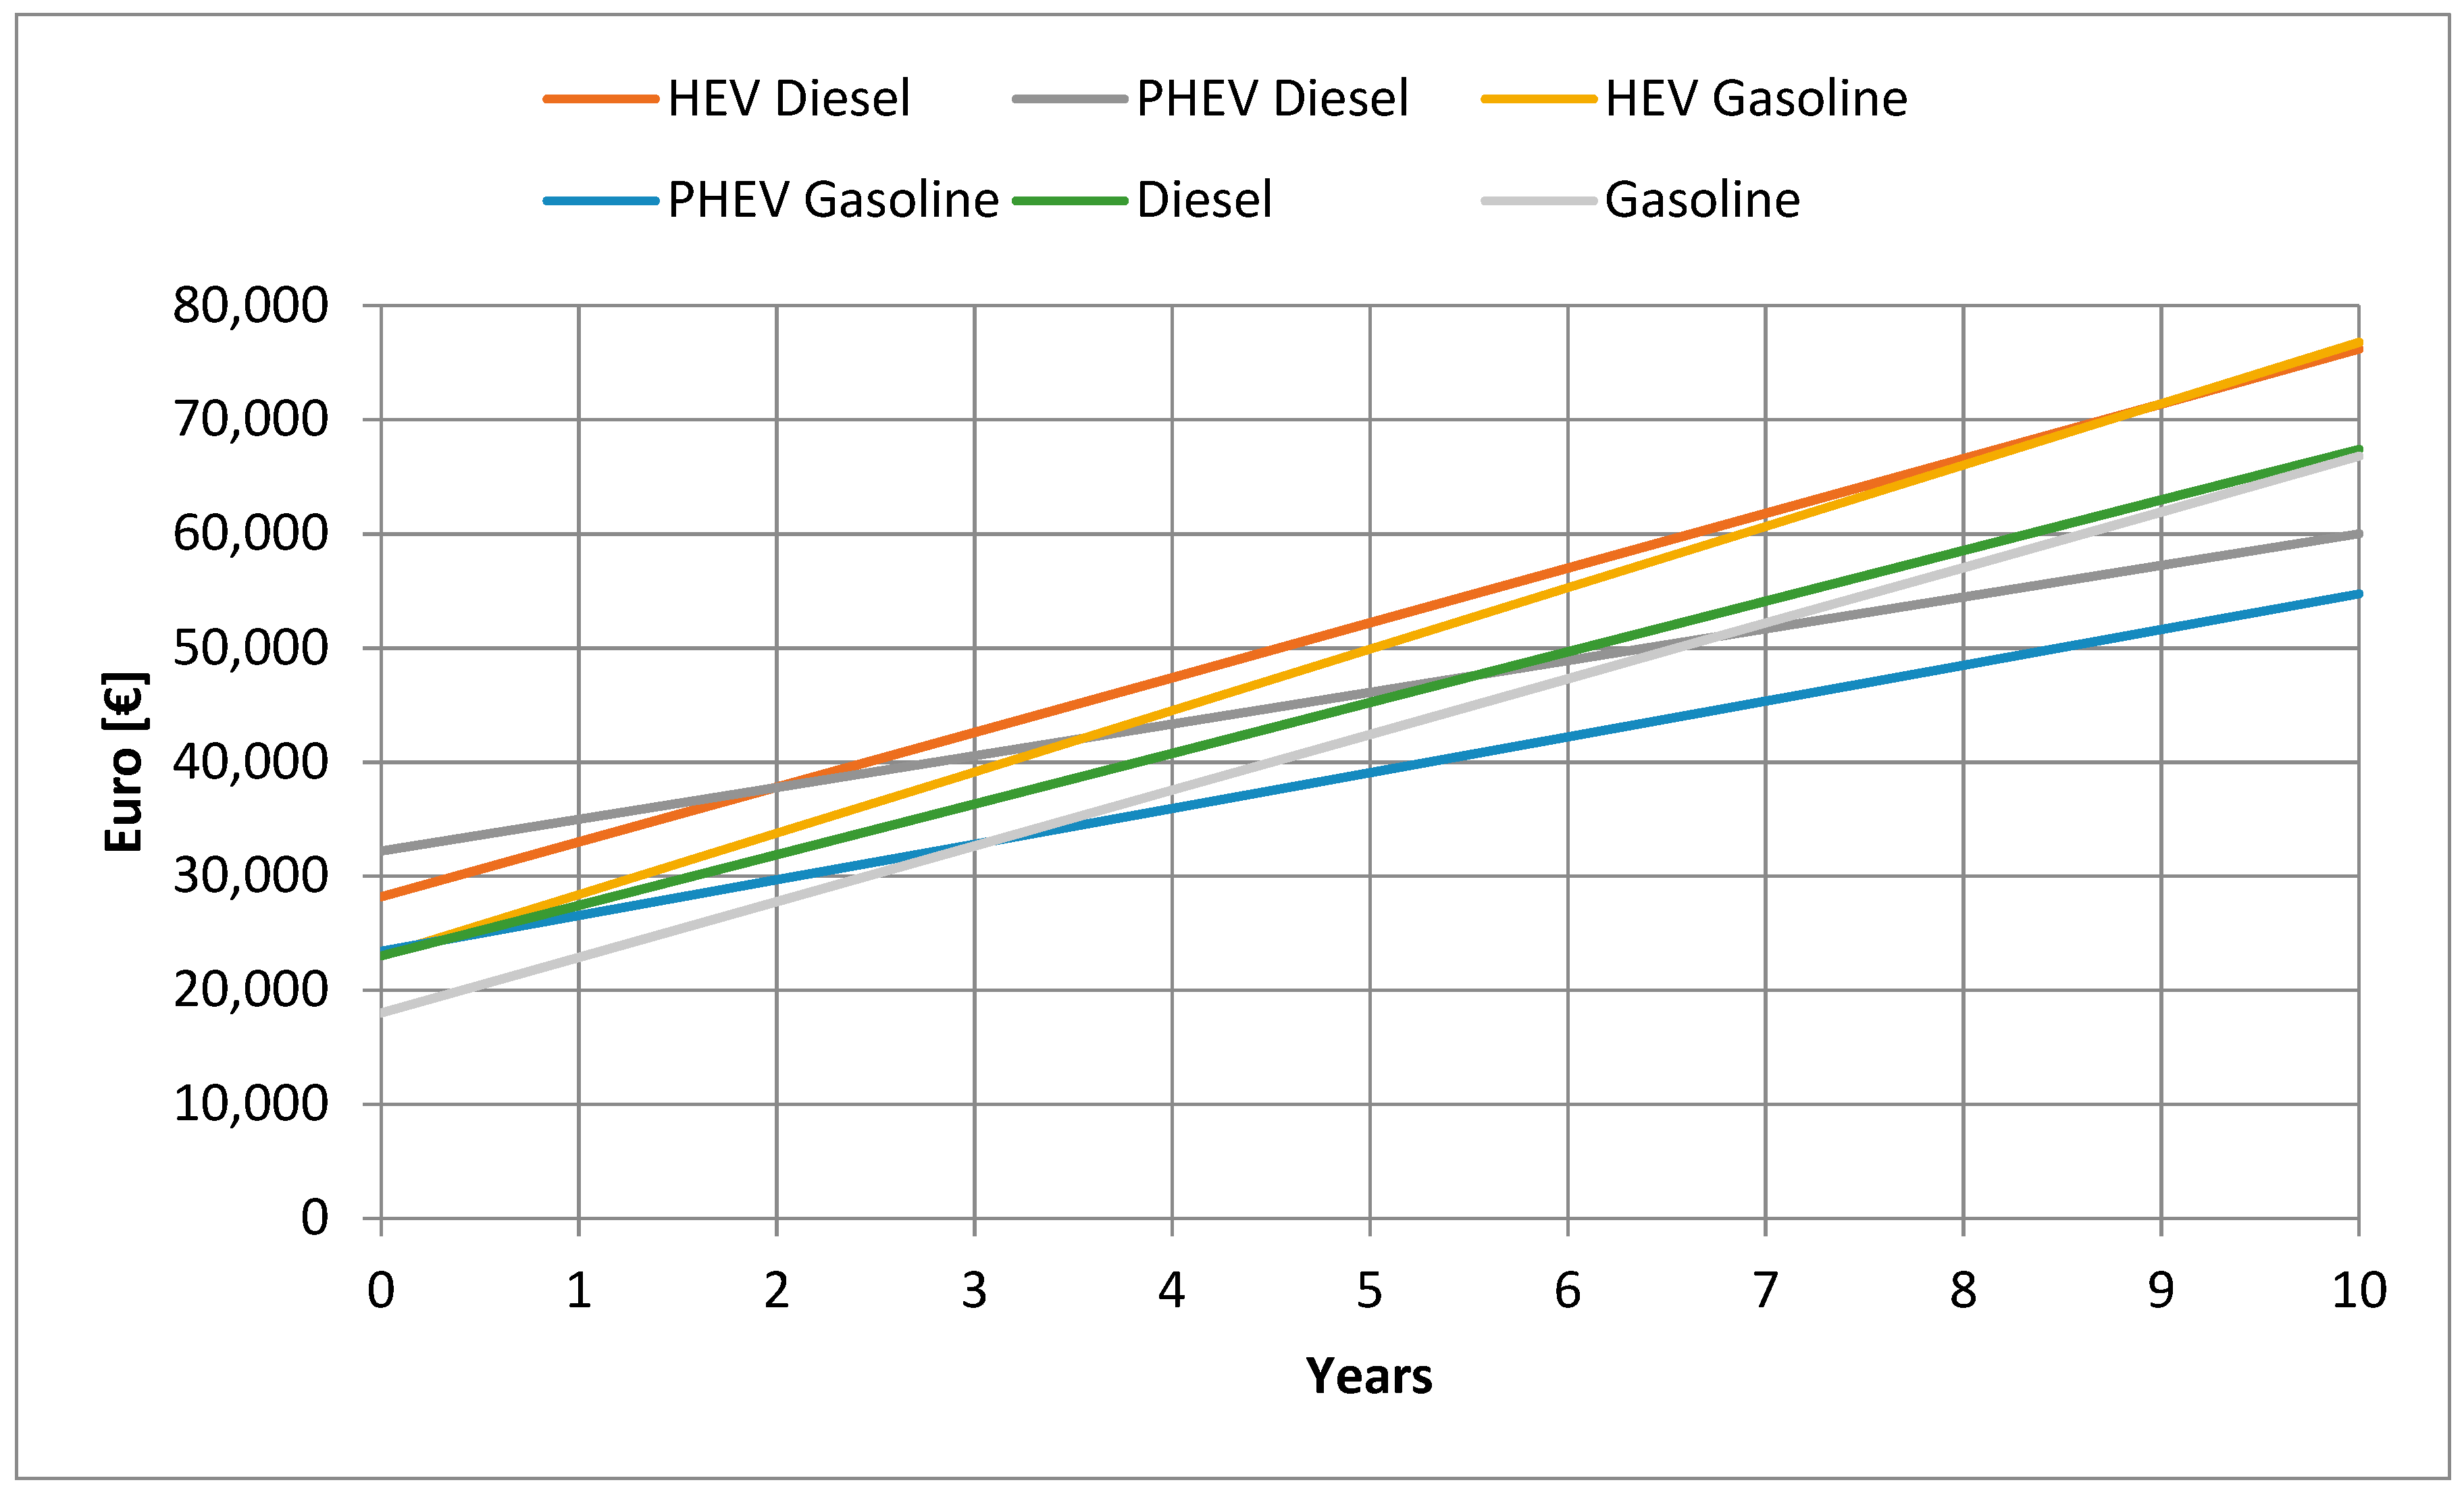
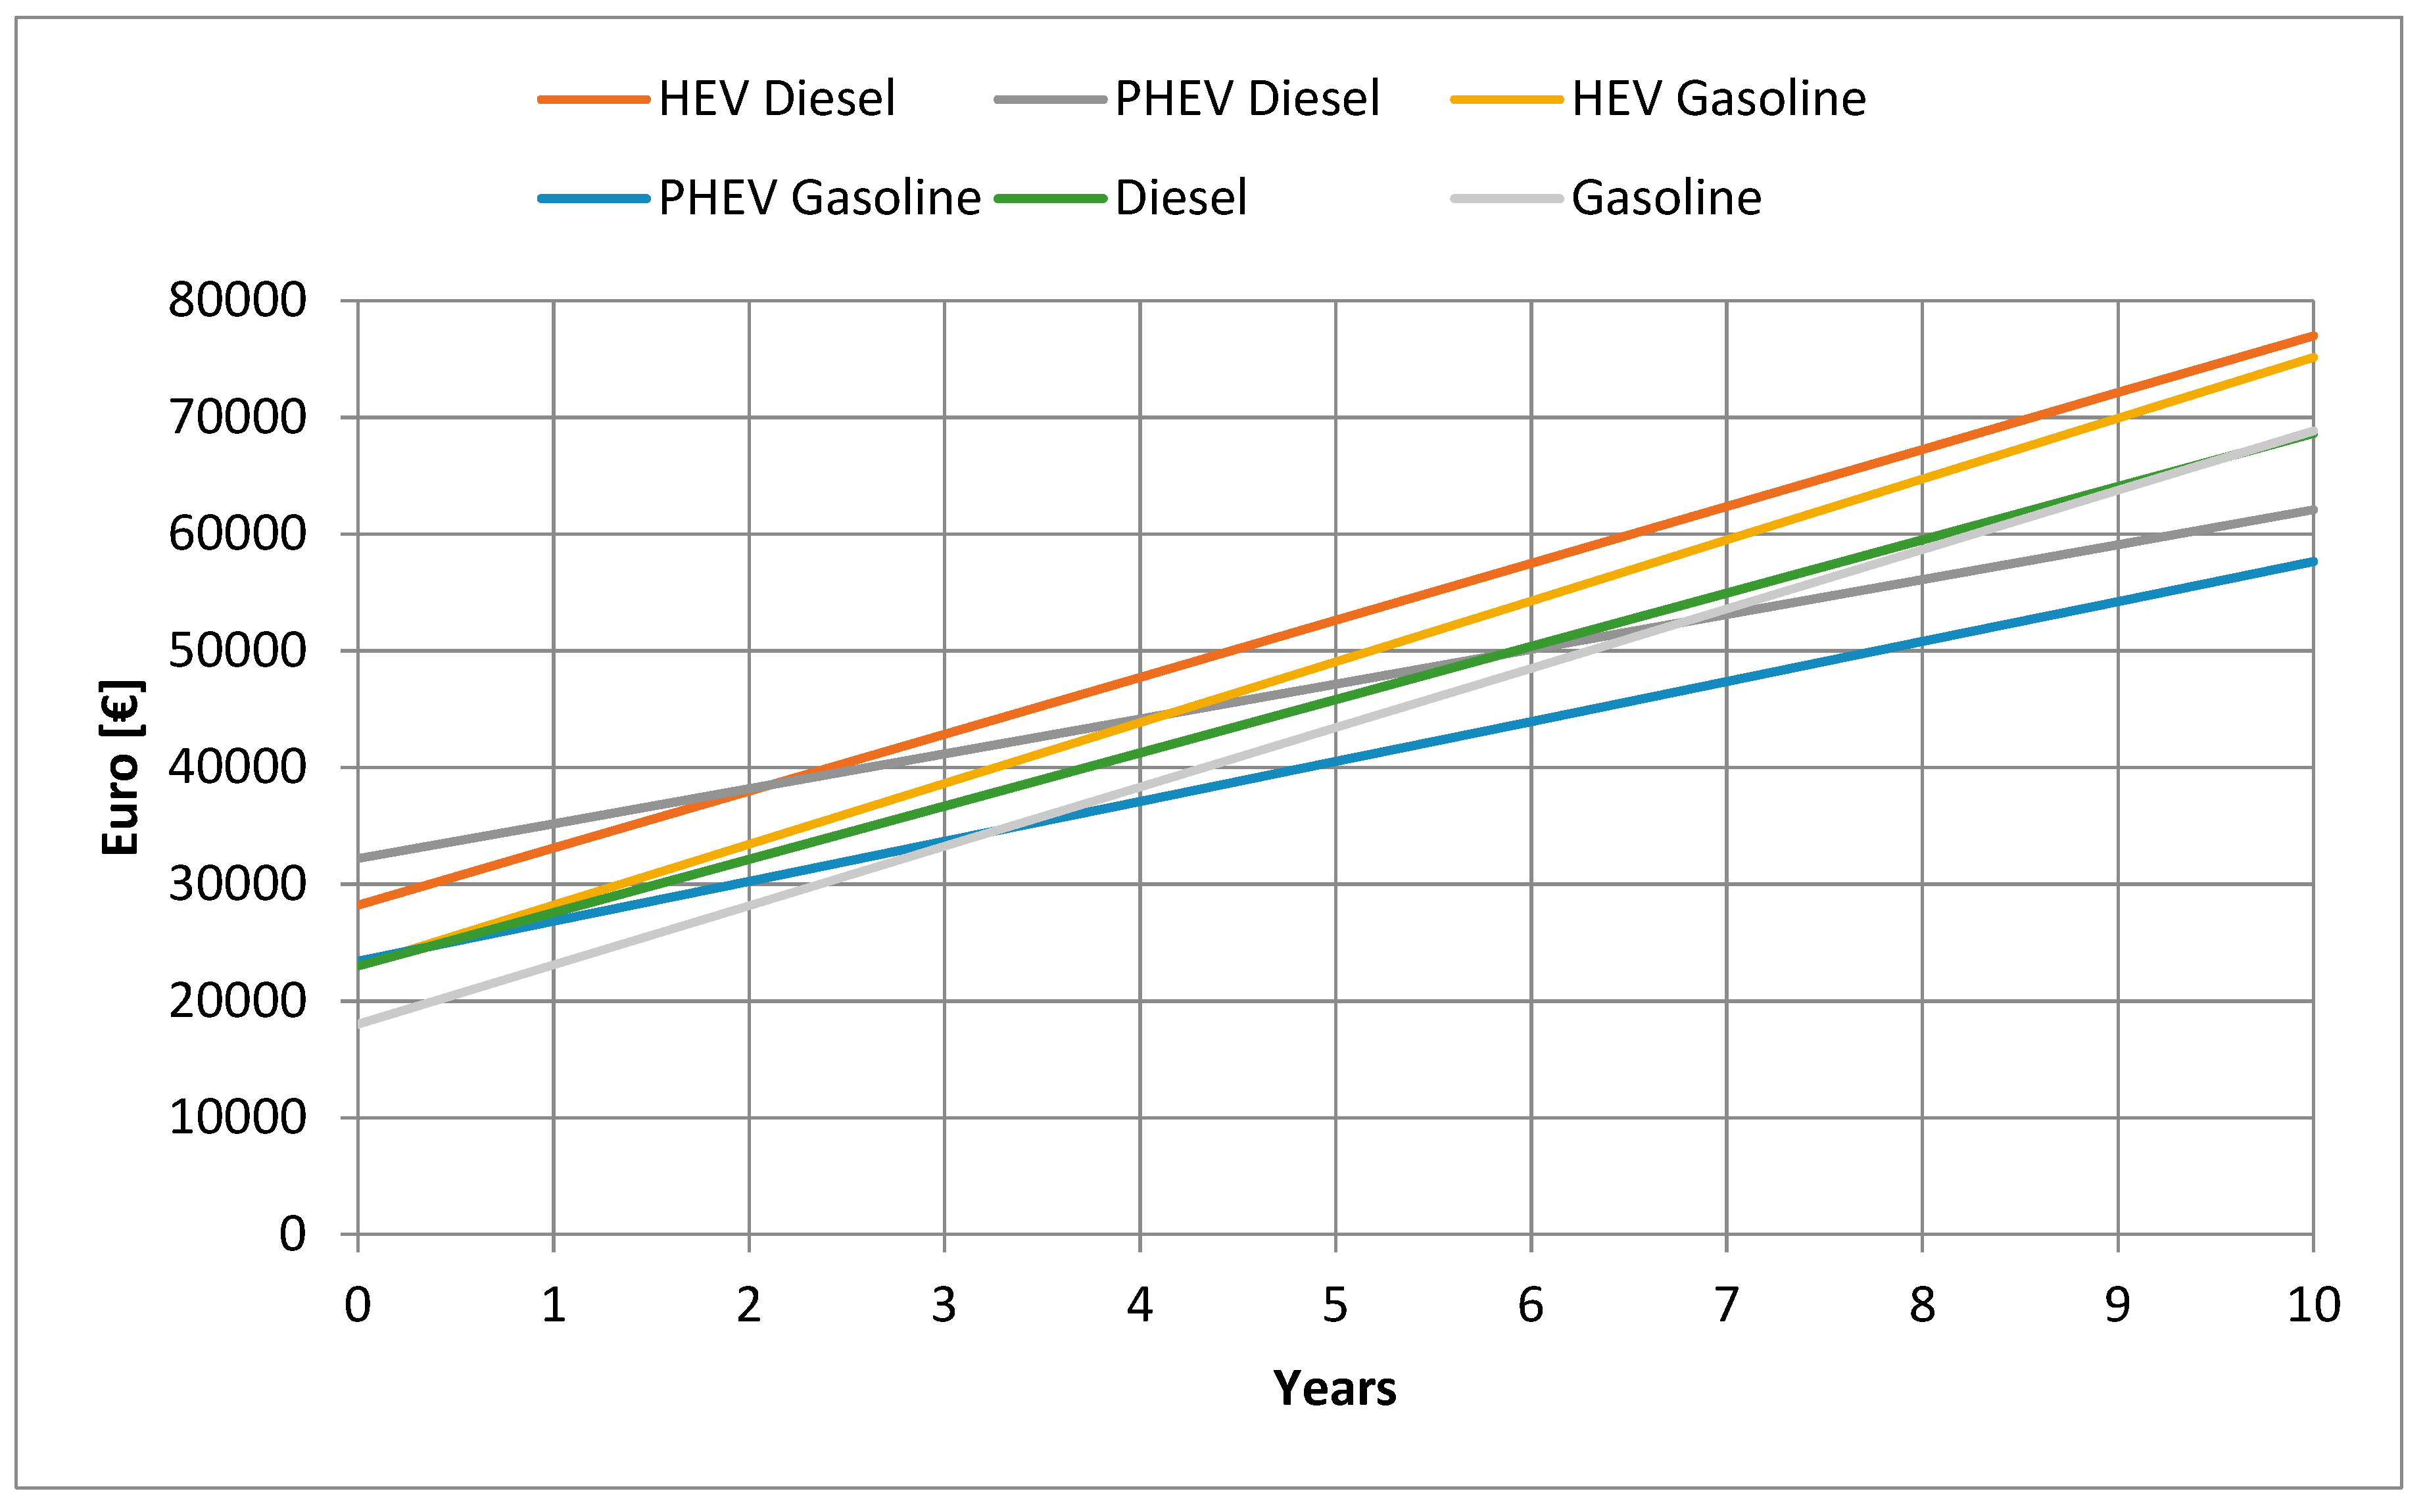