Article

Economic Dispatch Optimization of Multi-Water Resources: A Case Study of an Island in South Korea

1
Graduate School of Water Resources, Sungkyunkwan University, Suwon 16419, Korea
2
Smart Water Grid Research Group, Sungkyunkwan University, Suwon 16419, Korea
3
Department of Energy and Information Technology, Gachon University, Seongnam 13120, Korea
*
Author to whom correspondence should be addressed.
Sustainability 2019, 11(21), 5964; https://doi.org/10.3390/su11215964
Submission received: 9 October 2019 / Revised: 23 October 2019 / Accepted: 24 October 2019 / Published: 26 October 2019
(This article belongs to the Special Issue Sustainability with Optimization Techniques)

Abstract

:
Ensuring stable and continuous water supplies in isolated but populated areas, such as islands, where the water supply is highly dependent on external factors, is crucial. Sudden loss of function in the water supply system can have enormous social costs. To strengthen water security and to meet multiple water demands with marginal quality, the optimized selection of locally available, diversified multi-water resources is necessary. This study considers a sustainable water supply problem of Yeongjong Island, 30 km west from Seoul, South Korea. The self-sufficiency of several locally available water resources is calculated for four different scenarios based on the volume and quality of the various water sources. Our optimization results show that using all the available local sources can address the water security issues of the island in the case of interruption in the existing supply system, which is fed from a single source of mainland Korea. This optimization framework can be useful for areas where water must be secured in the event of emergency.

1. Introduction

Water scarcity has become the main problem the world is facing in the 21st century [1,2]. In recent years, due to global population growth and climate change, the global demand for water has increased [3,4]. Worldwide, water security issues have been rising and adding challenges and complexity to water authorities and water utilities for the continuous supply of water, and Korea is no exception [5,6]. The country’s population has grown, industrialization has increased, and the uncertainties due to climate change have put increased pressures on limited available water resources, creating water use conflicts between stakeholders in Korea [7]. It is essential to ensure the water security of islands like Yeongjong, where the water supply is highly dependent on external factors. Sudden loss of function in the existing water supply system can cause enormous social costs.
Currently, somewhat limited water resources, such as reclaimed waste water, harvested rain water, desalinated sea water, and imported water have been widely introduced in Korea to meet the challenge of water security [8]. Accordingly, water resources managers need to determine the optimal water withdrawal rates from multiple sources to satisfy multiple water demands, while meeting the water quality constraints, at the lowest possible overall economic and environmental cost, and enhancing sustainability [9]. Because of the complexity of multi-source combined water supply systems, their optimization presents significant challenges in practice [10]. Multi-objective algorithms are the main tool for determining the optimal allocation of water resources and can effectively reduce the conflicts between competing water user sectors [11].
In the literature, several optimization methodologies have been proposed to deal with the multi-water resource management problem [12]. Zhang et al. [3] developed a multi-water source joint scheduling model using a refined water supply network and proposed the concept of a water treatment and distribution station (water station). They generalized the water supply system into three modules: the water supply source, the water station, and the water user. Wei et al. [13] established an urban water supply system (UWSS), optimization framework for alternative water resources configuration, considering the trade-offs among total cost, life-cycle greenhouse gas (GHG) emissions, and an extended water ecosystem objective by integrating a multi-objective optimization model based on a non-dominated sorting genetic algorithm (NSGA II) with life-cycle assessment and a water distribution system simulation model. Liu et al. [14] studied a “two-stage multi-water sources allocation model in regional water resources management under uncertainty” to solve for optimized water allocation among multiple sectors and water sources and made recommendations for the future of sustainable utilization of regional water resources.
Verdaguer et al. [1] developed a methodological approach for optimal freshwater blending to improve the resilience of water supply systems, based on a virtual case study. They also simulated the decision-making process of selecting the most suitable mixture of fresh water from eight different sources, including surface water, groundwater, brackish groundwater, potable waste reuse water, and desalinated sea water. The procedure achieves an optimal water blend at the lowest overall cost and improves the resilience and sustainability of urban water supplies. Byeon et al. [15] proposed a new water balance assessment system as part of a smart water grid project in Korea and suggested a smart water management system to counter potential risks to the water distribution system for Yeongjong Island. Park et al. [16] developed a decision support system for blending multiple water resources and system diagnoses in water treatment plants and tested it in the demo plant of the city of Incheon. Puleo et al. [12] studied the optimal control of a multi-source water supply system (desalination/surface water/groundwater, etc.), while reducing the source cost and energy cost (pumping) in addition to maintaining satisfactory water quality. Avni et al. [17] developed and tested an optimization (Q and C domain) model to provide recommendations for a water distribution system (WDS) quality control in terms of meeting optimal water quality requirements; they carried out computational experiments based on an actual regional WDS.
For many years the optimization concept of economic dispatch (ED) for optimally matching multiple power sources to multiple demands has been popular in the energy system field, and has been solved by various optimization techniques including genetic algorithm (GA), evolutionary programming (EP), honey bee mating optimization (HBMO), tabu search (TS), particle swarm optimization (PSO), harmony search (HS), and firefly algorithm (FA) [18,19]. For the first time we adopt that ED concept from the power supply field into the water supply field for optimally matching multiple water sources to multiple demands in this study.
Considering this background, the main objective of this study is to propose a methodological approach that provides the optimal withdrawal of water from multiple sources with different qualities, while minimizing the total costs and complying with the source constraints of varying supply capacities, marginal water quality, and different types of water demands. In other words, we propose a decision support system to improve the resilience of contributing water systems to ensure a continuous supply of water at a given location. This developed approach is applied to Yeongjong Island, where currently the only water source is piped from Seoul, under the sea. This underwater pipeline is vulnerable to failure due to damage at any time.

2. Materials and Methods

2.1. Study Area

Yeongjong Island, the gateway to South Korea is located about 30 km west from the capital city, Seoul (Figure 1). It is the site of Incheon International Airport (ICN), currently the major airport in South Korea. As of October 2018, the population of this island was 72,939; its total area, including reclaimed land, is 116.8 km2, of which 14.9 km2 is dedicated to agriculture, 35.9 km2 to forest, 2.6 km2 to parks, 0.7 km2 to industrial zones, 7.4 km2 to residential areas, and 15.3 km2 to public spaces and other purposes [6]. The annual rainfall of the area is 1412 mm and the annual average air temperature is 12.5 °C.

2.2. Existing Water Supply System and Possible Risks to the System

The island’s water supply system is based on a unique resource, the Han River via the Gongchon Water Treatment Plant (WTP) located in Incheon city. There are no fallback options in the event of equipment failure, drought, or accidental pollution [5]. The single water source is piped through undersea from the mainland. If this pipeline is damaged, no alternative water source is available for the island.
To distribute the water from this single source, four distributing reservoirs currently exist in the island and two more are under construction, expected to be completed by 2020 (Figure 1). Total storage capacity of the Yeongjong reservoir, Unbuk reservoir, original airport reservoir, and the new airport reservoir are 40,000 m3, 11,000 m3, 42,000 m3, and 15,000 m3, respectively. The Yongyu and Muui reservoirs now under construction will have storage capacities of 11,000 m3 and 1500 m3, respectively.

2.3. Data Source and Collection

Data on the available water resources (Table 1) and predicted water demand (Table 2) were collected from the recent master plan for Incheon waterworks maintenance [20] and Byeon [21]. Our optimization scenarios were considered based on predicted water demand for the year 2025.

2.4. Methodology

2.4.1. Optimization Problem Formulation

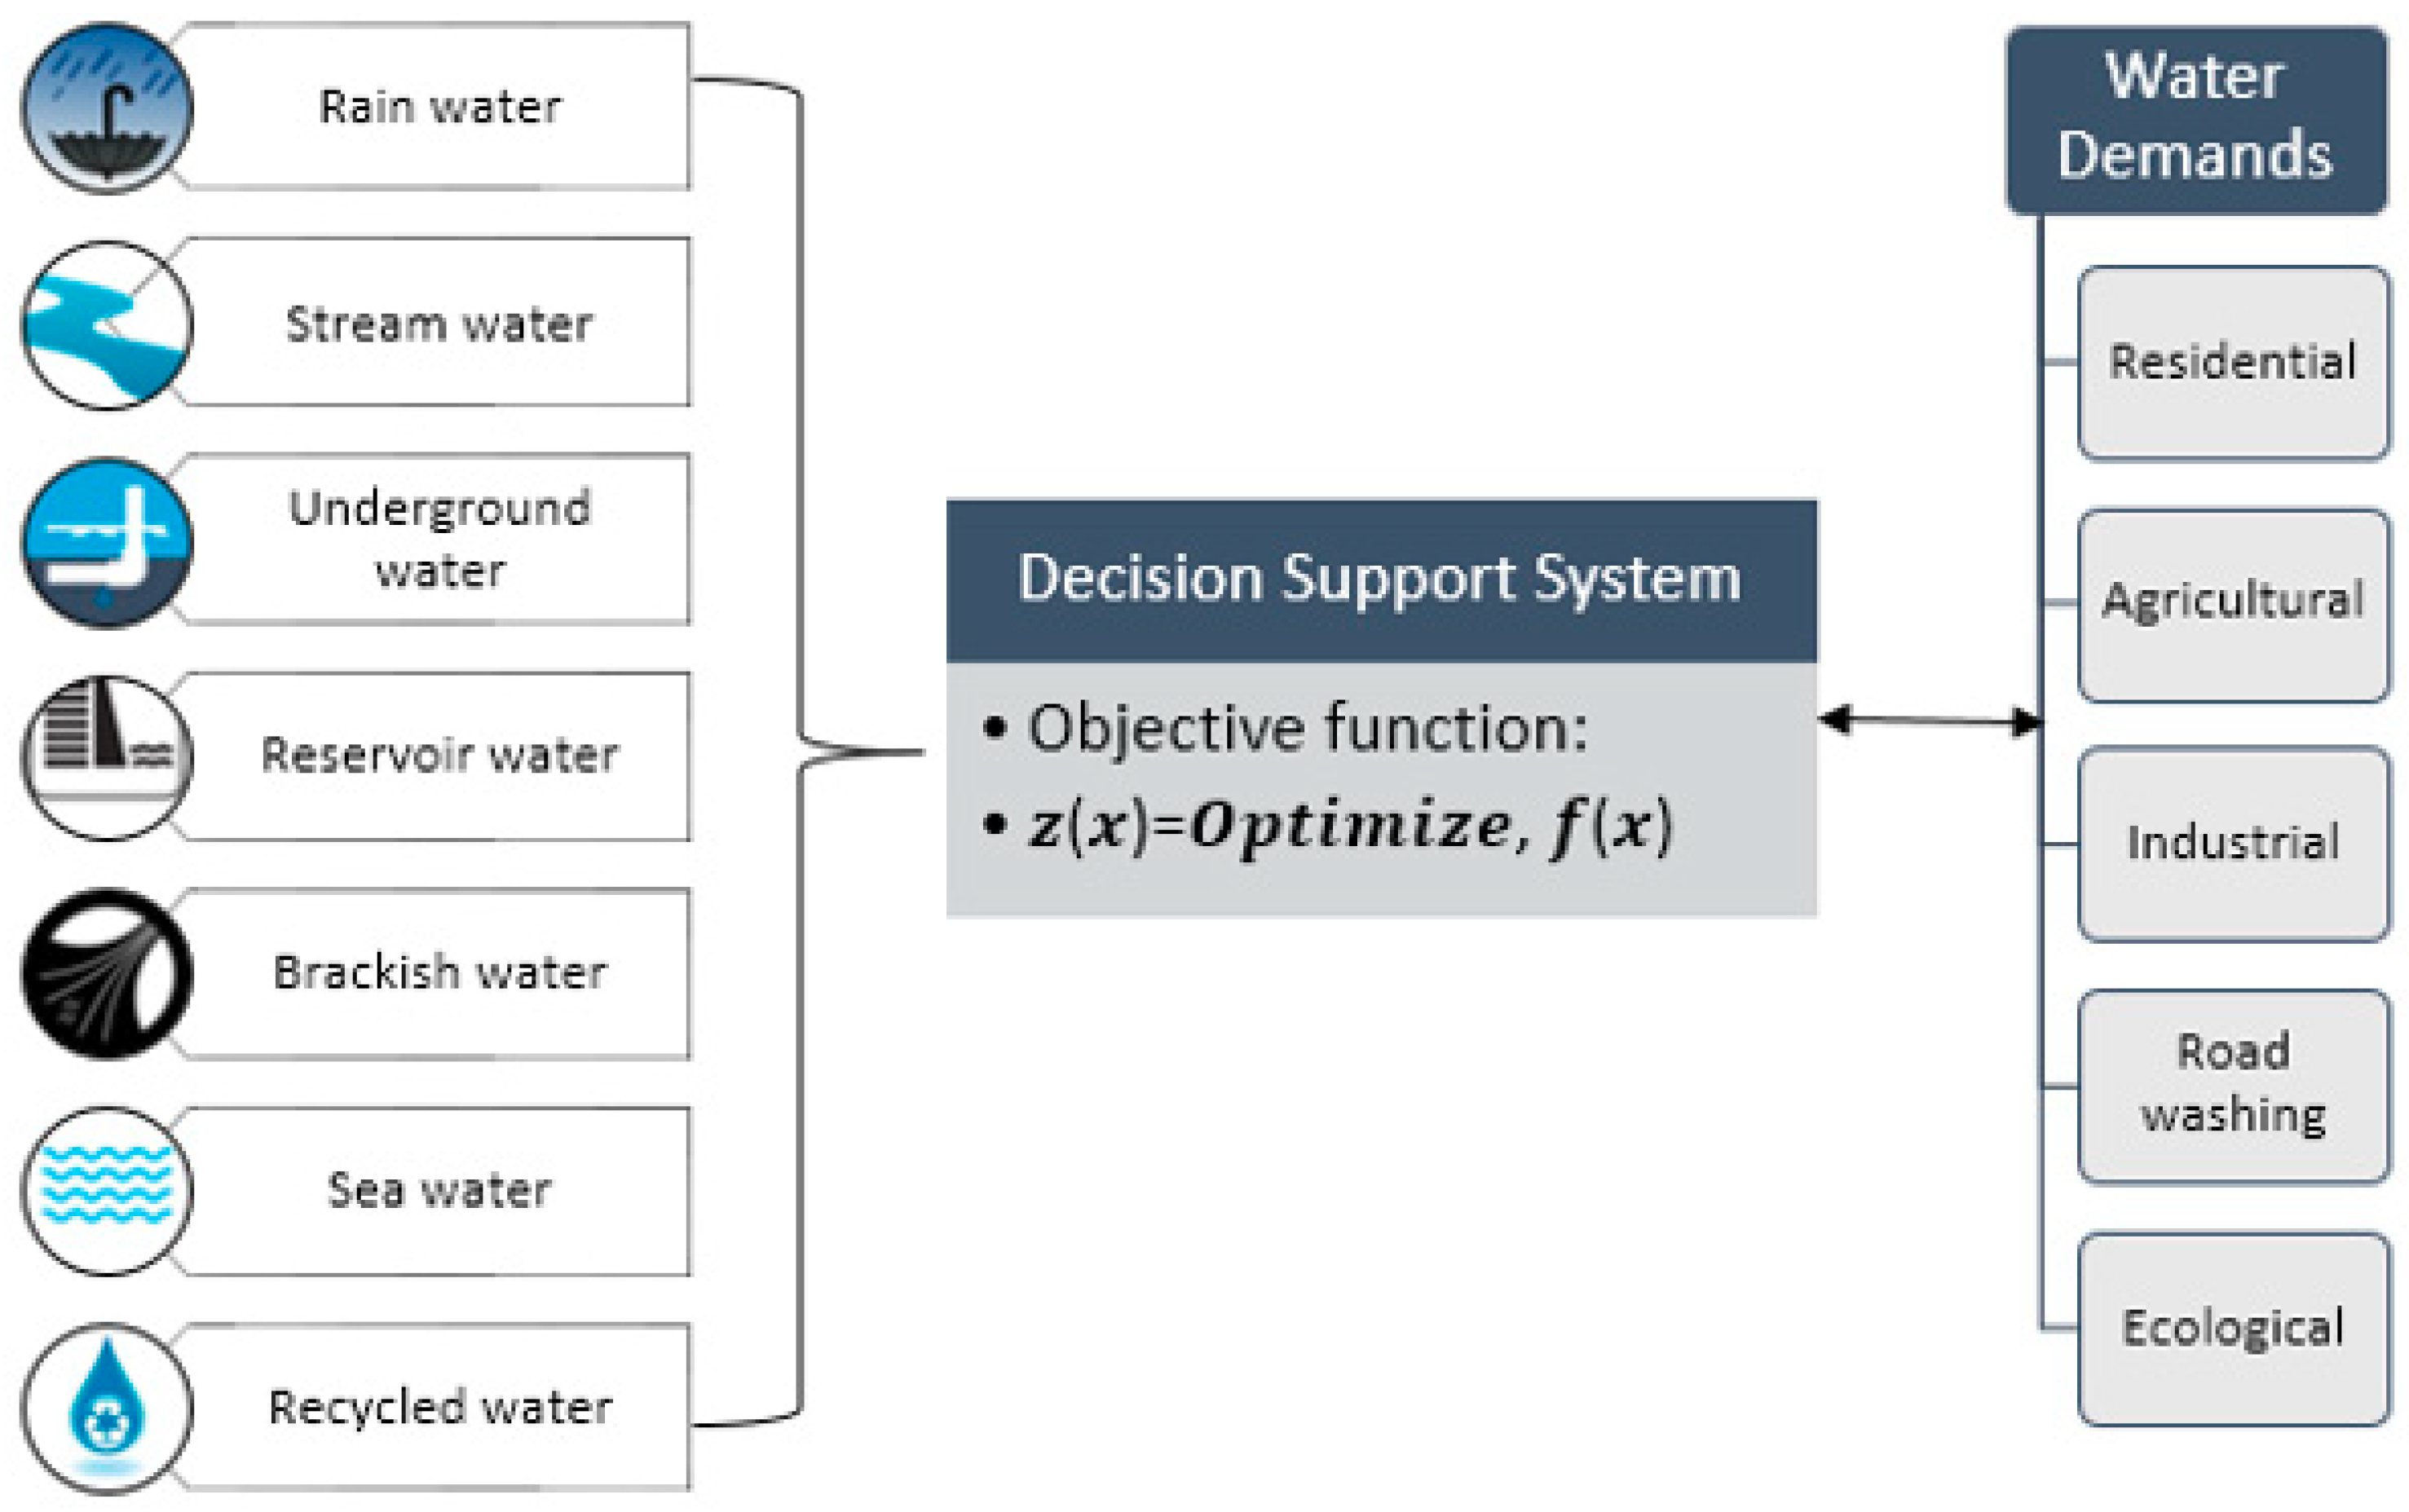
There are seven local alternative water sources for Yeongjong Island: rain water, streams, underground water, reservoirs, brackish water, sea water, and waste water (Figure 2), which might supply water sustainably and economically. We developed an optimal selection model for these water resources, using the treatment plant capacities for harvesting rain water (20,000 m3/day), stream water (45,000 m3/day), underground water (20,000 m3/day), reservoir water (1000 m3/day), brackish water (60,000 m3/day), and sea water (50,000 m3/day). We proposed the use of untreated waste water (grey water) for road washing, and ecological water demands. However, for agricultural water demand, untreated grey water is supplied only if the total dissolved solids (TDS) is less than 2000 ppm. If the TDS of grey water is greater than 2000 ppm, blending of grey water with other sources like rain, stream, underground, reservoir water is proposed in order to reduce the TDS value below 2000 ppm. Finally, the water can be supplied to agricultural purposes.
For simplicity, we set the diameter and total length of the pipeline as 400 mm and 10 km, respectively, for all the water sources. For estimating the capital cost, we assumed the polyvinyl chloride (PVC) pipe was used for conveyance of rain water, brackish water, sea water, and waste water, and we assumed cast the iron pipe was used for conveyance of stream water, underground water, and reservoir water.
In this section, we explain the proposed mathematical model, including notations, the decision variables, objective functions, and the model’s constraints. The research methodology follows the procedure as shown in Figure 3.

2.4.2. Objective Functions

The cost functions used here are taken from [22,23] and the cost estimation standards are those developed by the Ministry of Environment, Republic of Korea [24].
To minimize the total water supply cost, the following objective function is used:
M i n i m i z e   f ( x )   = i = 1 I j = 1 J i j ( X i j ) ,
in which f(x) = total cost of water supply;
  • Xij = supplied water volume from the water source i to the user j;
  • i = water source type, i = 1, 2, 3, 4, 5, 6, and 7;
  • j = water user or demand type, j = 1, 2, 3, 4, and 5;
  • ij = cost function of water supply from source i to user j. The cost function ∝ij is dependent on capital cost, operation and maintenance (O&M) cost, and environmental cost.
The capital cost includes the construction cost of the purification plant and pipeline. The manpower cost, chemicals cost, and energy cost are covered within the annual operation and maintenance (O&M) cost. The environmental cost includes the cost of GHG emissions, per ton of water production from brackish water reverse osmosis (BWRO) and sea water reverse osmosis (SWRO), taken as 0.624 and 1.81 kg CO2 –e/ton, respectively, and were obtained from Tarnacki et al. [25]. The cost of GHG emissions for the Korean peninsula is taken as $19 USD/t-CO2 [26].

2.4.3. Water Withdrawal Constraints/Conditions

Constraints Related to Water Volume

  • The volume of water withdrawn must be less than or equal to the maximum capacity of the supply available from the sources considered (Si):
    j = 1 5 X i j   S i ,                 i = 1 ,   2 , , 7 ,
    where, Si = 20, 43.78, 18.7, 0.76, 55.18, 50, and 121, are the maximum supply capacity of water sources: rain water, stream water, underground water, reservoir water, brackish water, sea water, and recycled water, respectively. Unit of Si = 103 m3/day.
  • The volume of water withdrawn from each water source, which undergoes treatment, must be less than or equal to the maximum capacity (Qi) of the respective water treatment plant (WTP):
    j = 1 5 X i j     Q i ,                 i = 1 ,   2 , , 6 ,
    where, Qi = 20, 45, 20, 1, 60, and 50 are the maximum treatment capacity of WTPs for rain water, stream water, underground water, reservoir water, brackish water, and sea water, respectively. Unit of Qi = 103 m3/day.
  • Reclaimed (Grey) water must not be considered for domestic/residential use:
    X i = 7 ,   j = 1 = 0 .
  • Decision variables involved in the optimization calculation must be greater than or equal to zero (non-negativity constraint of decision variables):
    X i j 0 .

Constraints Related to Water Quality in Total Dissolved Solids (TDS; unit = ppm)

We have 3 brackish water wells (retention ponds) at close proximity to sea water in the study area. Sometimes, sea water intrusion into the wells increases the TDS amounts of brackish water. So, to decide the requirement of blending, and the use of either BWRO or SWRO, the following constraints are considered.
  • For the case of waste water/grey water:
    • If TDS < 2000, supply to the agricultural purpose without any treatment.
    • If TDS > 2000, blend with available rain/stream/underground/reservoir water until TDS value falls below 2000 ppm and supply it to agricultural purpose.
  • If 2000 < TDS < 10,000, use the BWRO process for purification of water, and for more than TDS > 10,000, use the SWRO process.

2.5. Water Withdrawal Rules

Given the various types of locally available water sources in Yeongjong Island (Figure 2), the water quality of these water sources also varies. Different water users have different water quantity and quality requirements, and it is therefore necessary to match the water users to the adequate water sources. We propose that harvested rain water, stream water, underground water, and reservoir water be used for all five types of water demands after treatment of the source water. Brackish water will be used for domestic and agricultural purposes, and sea water will be used only for domestic purposes due to its high cost of treatment. Recycled water as a marginal quality water will be used only for agricultural, road washing, and ecological purposes due to its perceived quality issues. The details are shown below in Table 3.

2.6. Water Withdrawal Scenarios

We have developed four scenarios to evaluate the water security of the study area and produce relevant simulations. In scenario 1, we used readily available local water sources: stream water, ground water, reservoir water, and recycled water, which are less costly than the other sources. In scenario 2, we used harvested rain water at 20,000 m3/day (proposed amount) in addition to the sources used in scenario 1. In scenario 3 we added brackish water at 55,000 m3/day, and in scenario 4 we added sea water at 50,000 m3/day. The scenario details are shown below in Table 4.

2.7. Generalized Reduced Gradient Algorithm

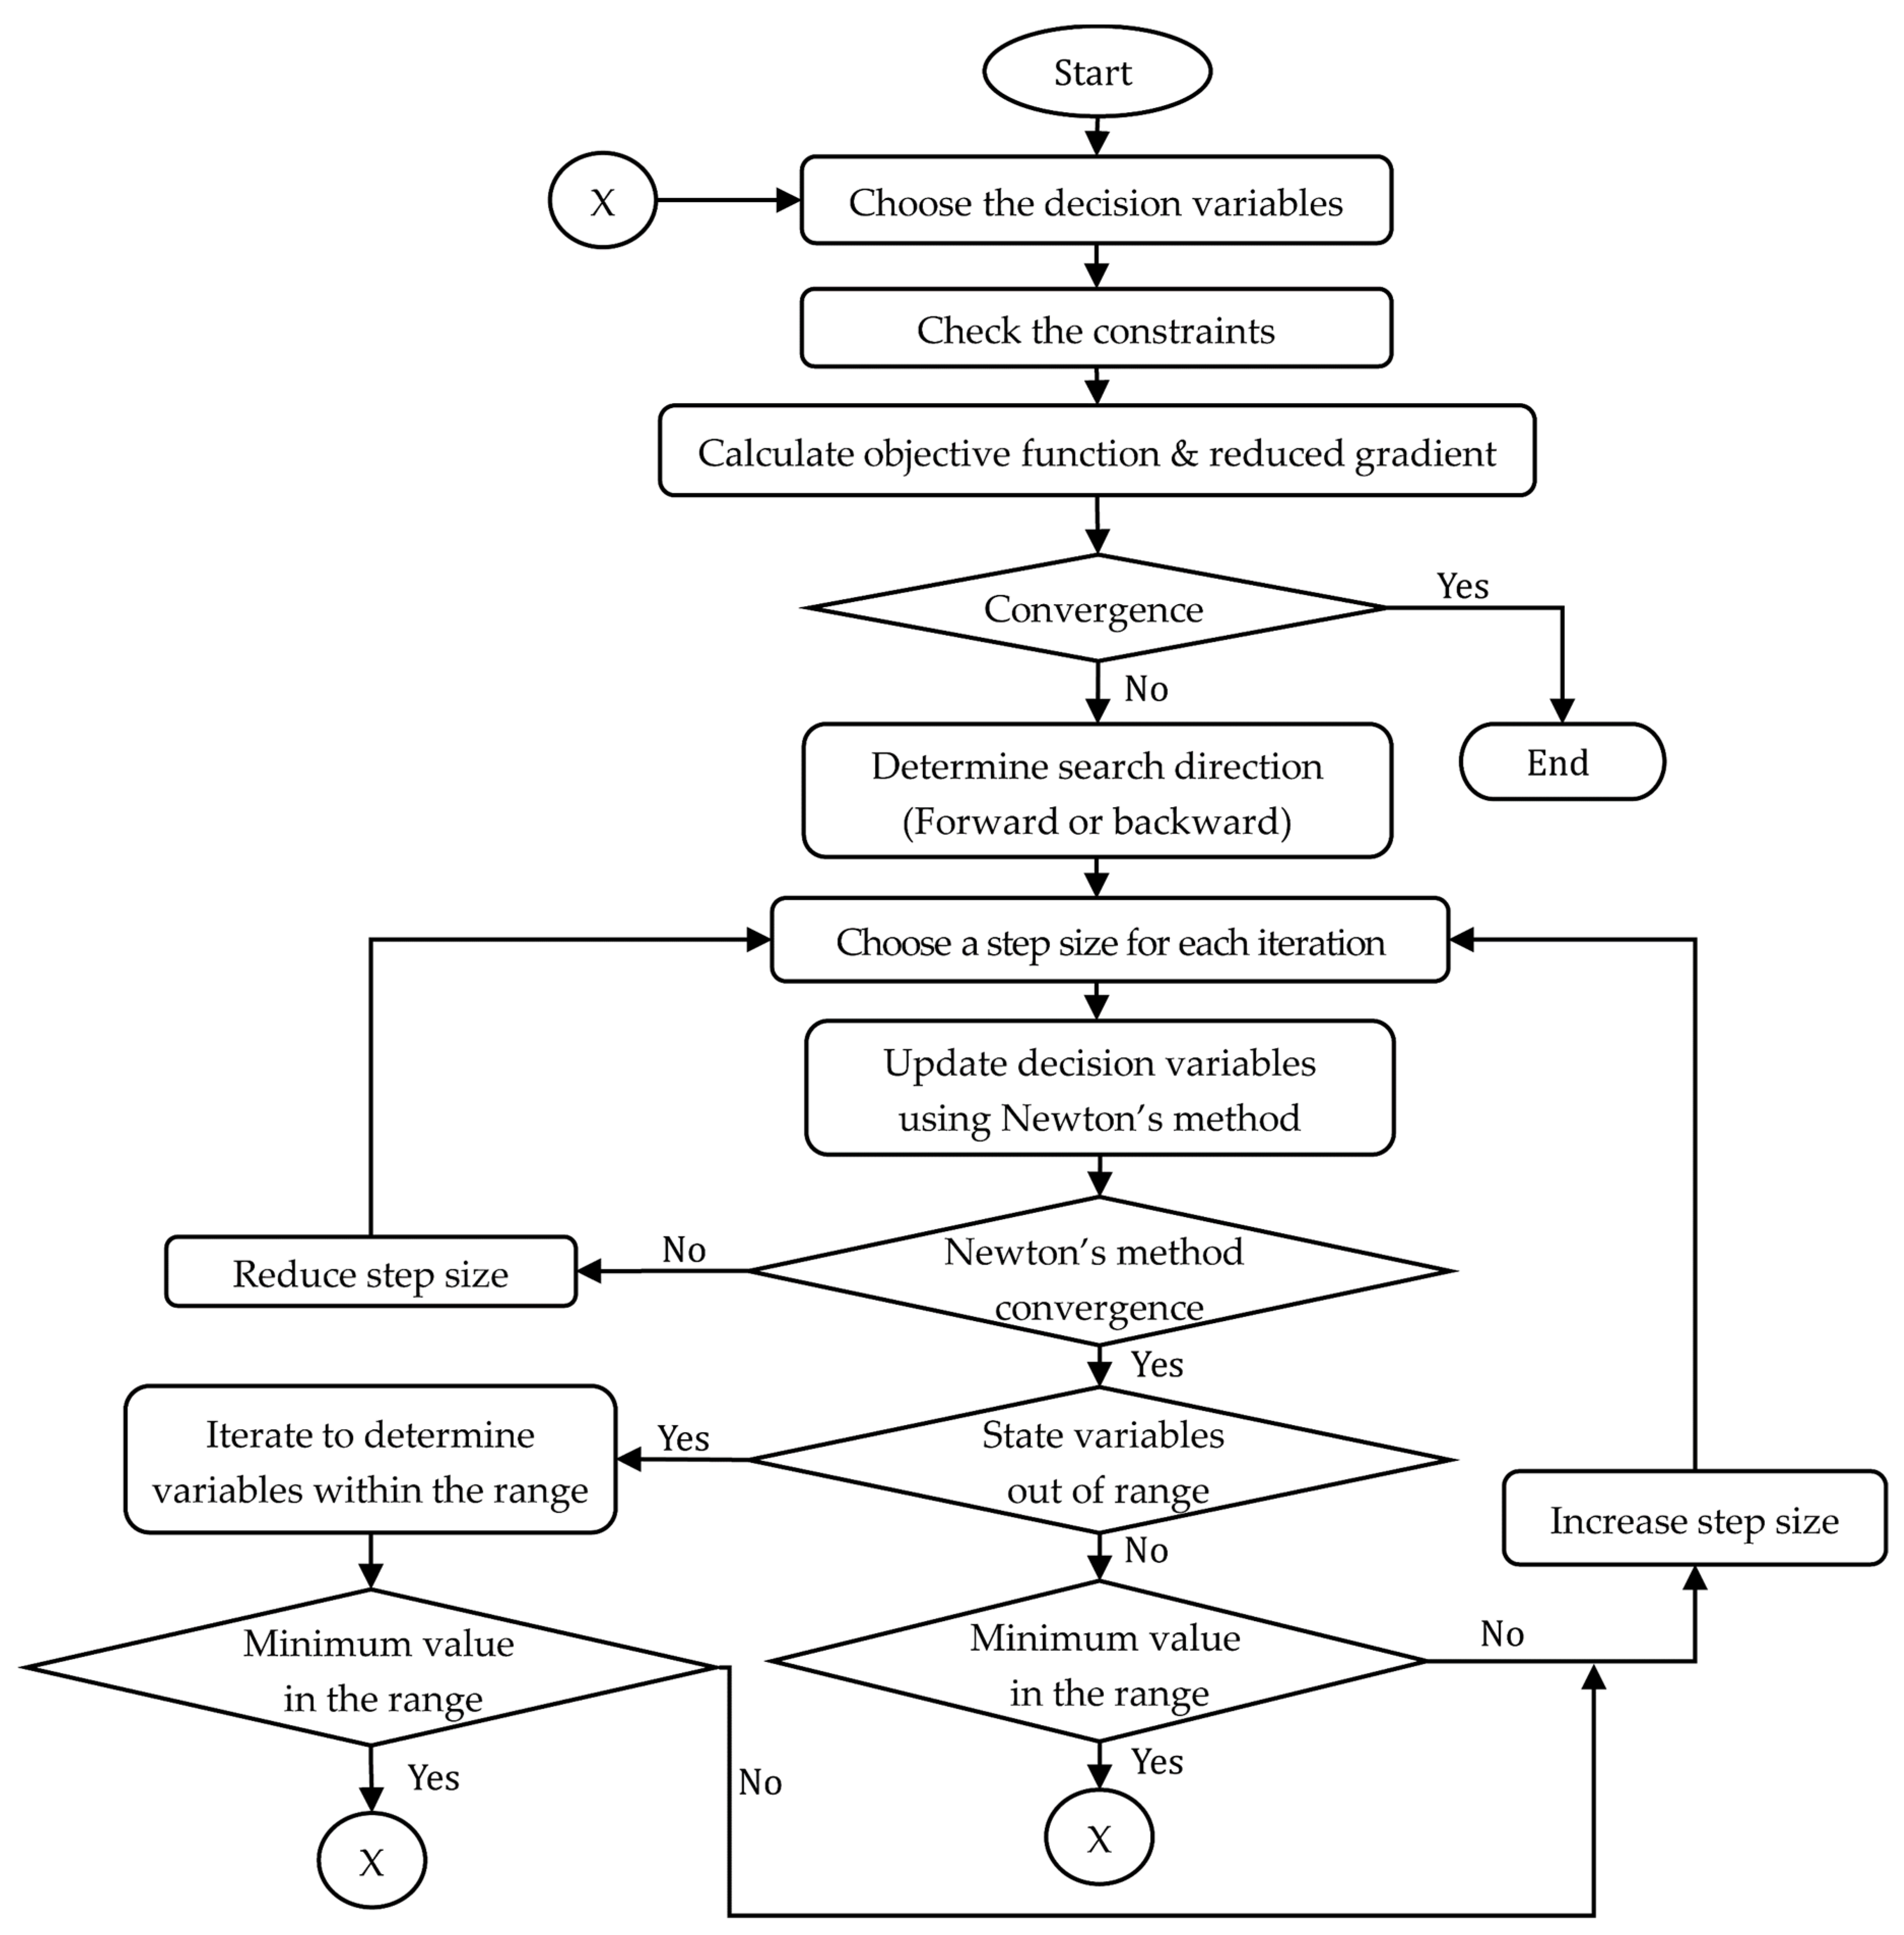
The reduced gradient (RG) was first developed by Wolfe [27] and was based on a simple variable elimination technique for equality-constrained problems. The generalized reduced gradient (GRG) method is an extension of the RG method to handle nonlinear programming problems with linear and nonlinear constraints [28].
The basic concept of the GRG method is to linearize the nonlinear objective and constraint functions at a local solution with a Taylor expansion equation [29]. Then, the RG method is employed to find the minimum in the search direction which divides the variable set into two subsets of basic (dependent) variables and non-basic (independent) variables. Finally, implicit variable elimination is applied to express the basic variable by the non-basic variable. In this method, a search direction is found such that for any small move, the current active constraints remain precisely active. If some active constraints are not precisely satisfied because of nonlinearity of constraint functions, the Newton–Raphson method is used to return to the constraint boundary. Finally, the constraints are eliminated and the variable space is reduced to only non-basic variables. This process is repeated until the convergence is obtained. The details about this method are given by Lasdon et al. [30] and Gabriele et al. [31]. The flow chart of the algorithm prepared by Sakhaei et al. [32] is shown in Figure 4. Here, the GRG method has been implemented in the Excel Solver program.

2.8. Genetic Algorithm

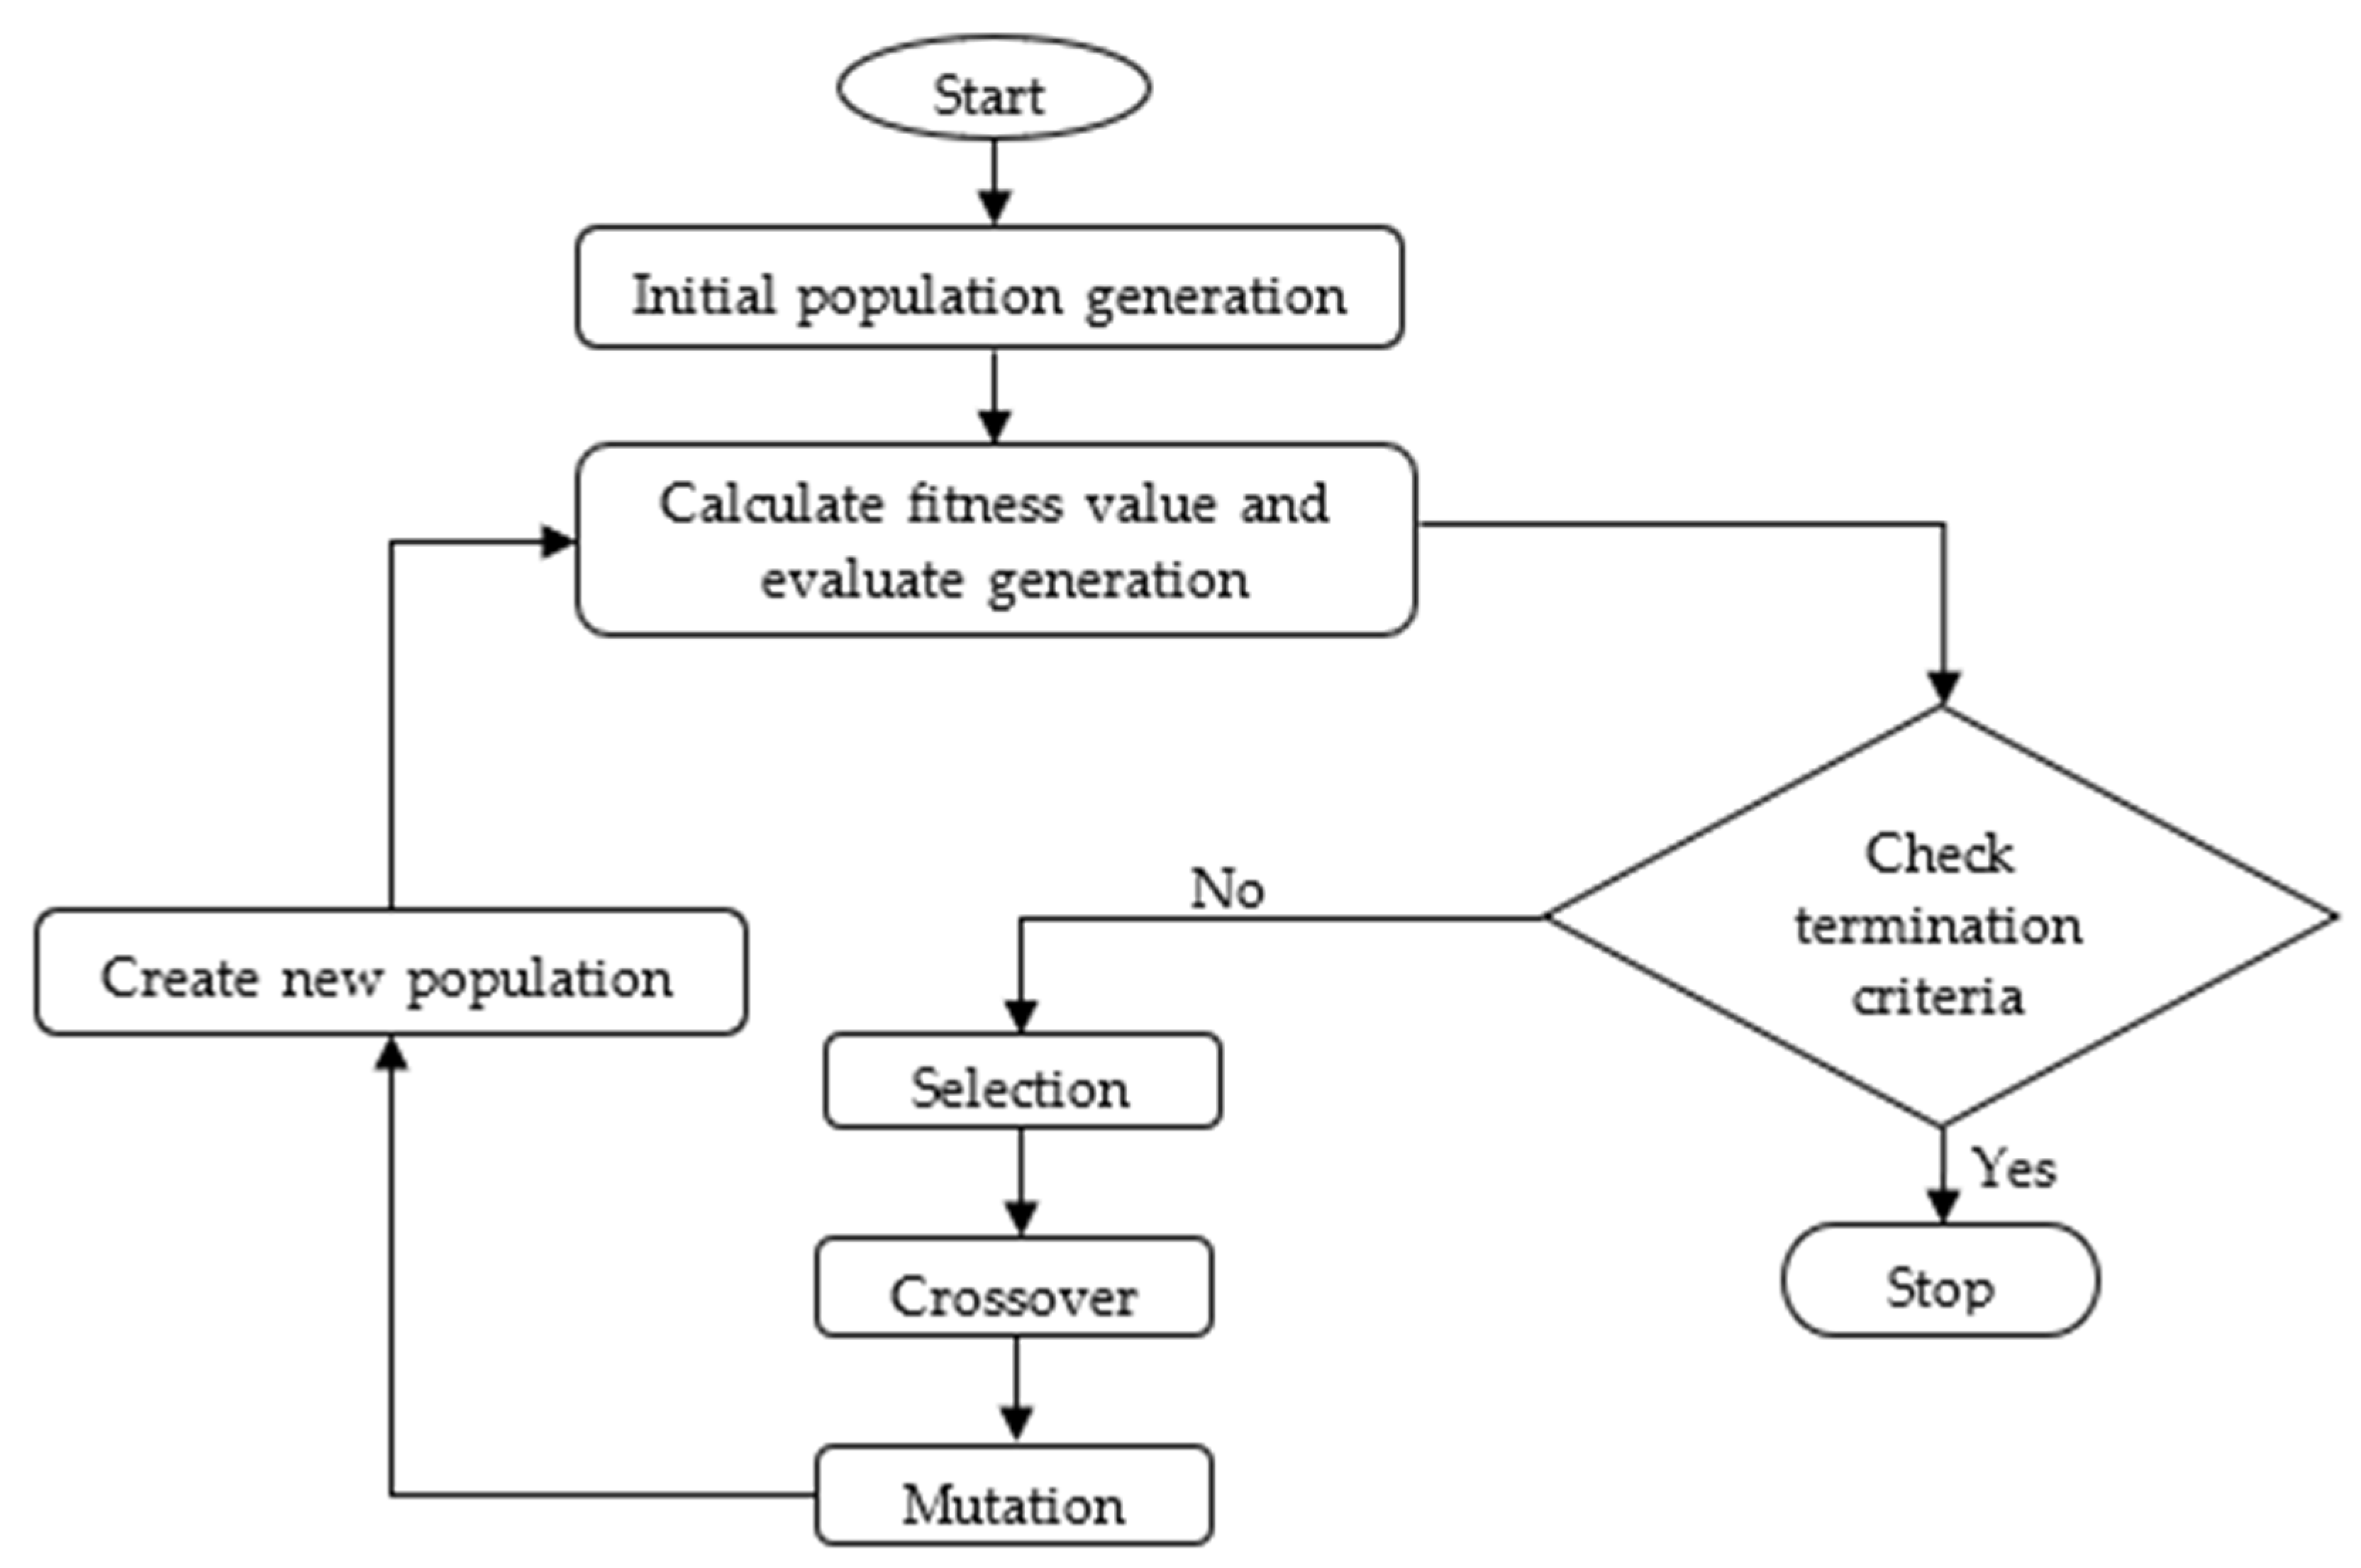
GAs were invented by John Holland in the 1960s [33] and were further developed by Holland and his students and colleagues at the University of Michigan in the later 1960s and updated in 1970 [34]. GAs are heuristic search and optimization techniques that mimic the process of natural evolution, making them random-based, classical evolutionary algorithms. They are commonly used to generate high-quality solutions to optimization and search problems by relying on bio-inspired operators such as mutation, crossover, and selection. The evolution usually starts from a population of randomly generated individuals and occurs in generations. In each generation, the fitness of every individual in the population is evaluated, and multiple individuals are selected from the current population (based on their fitness) and modified to form a new population. The new population is used in the next iteration of the algorithm. The algorithm terminates when either a maximum number of generations has been produced, or a satisfactory fitness level has been reached for the population.
To find the optimal solution, the algorithm follows the steps in the flow chart in Figure 5.

2.9. Self-Reliance of the Island Using Locally Available Multiple Water Sources

To make a populated area sustainable and capable of dealing with uncertainty, it is vital to have a highly independent water supply. To describe the water security and sustainability of a city, region, or island, Han et al. [35] and Rygaard et al. [36] proposed an index called “self-reliance” or “self-sufficiency.” It is defined as the ratio of the volume of water that is supplied from the locally available sources of the region to the volume of all the water that is used in the region [36]. This index is calculated using Equation (6):
S e l f   r e l i a n c e   ( % ) = Q l Q d × 100 ,
where Ql is the amount of water supplied from the locally available water resources within a given area (i.e., harvested rain water, desalinated sea water, stream water, and brackish water) and Qd is the total water demand in the same area. There are two possible methods to increase the self-reliance of an area. One is to reduce the water demand by demand-side management, and the second is to increase the use of locally available multi-water resources by rain water harvesting, sea water desalination, better utilization of groundwater, waste water reuse, use of brackish water, and stream water use [35]. Our study is focused on the second approach to increase the self-reliance of Yeongjong Island.

3. Results and Discussion

3.1. Self-Reliance (%) from Locally Available Multi-Water Sources in Different Scenarios

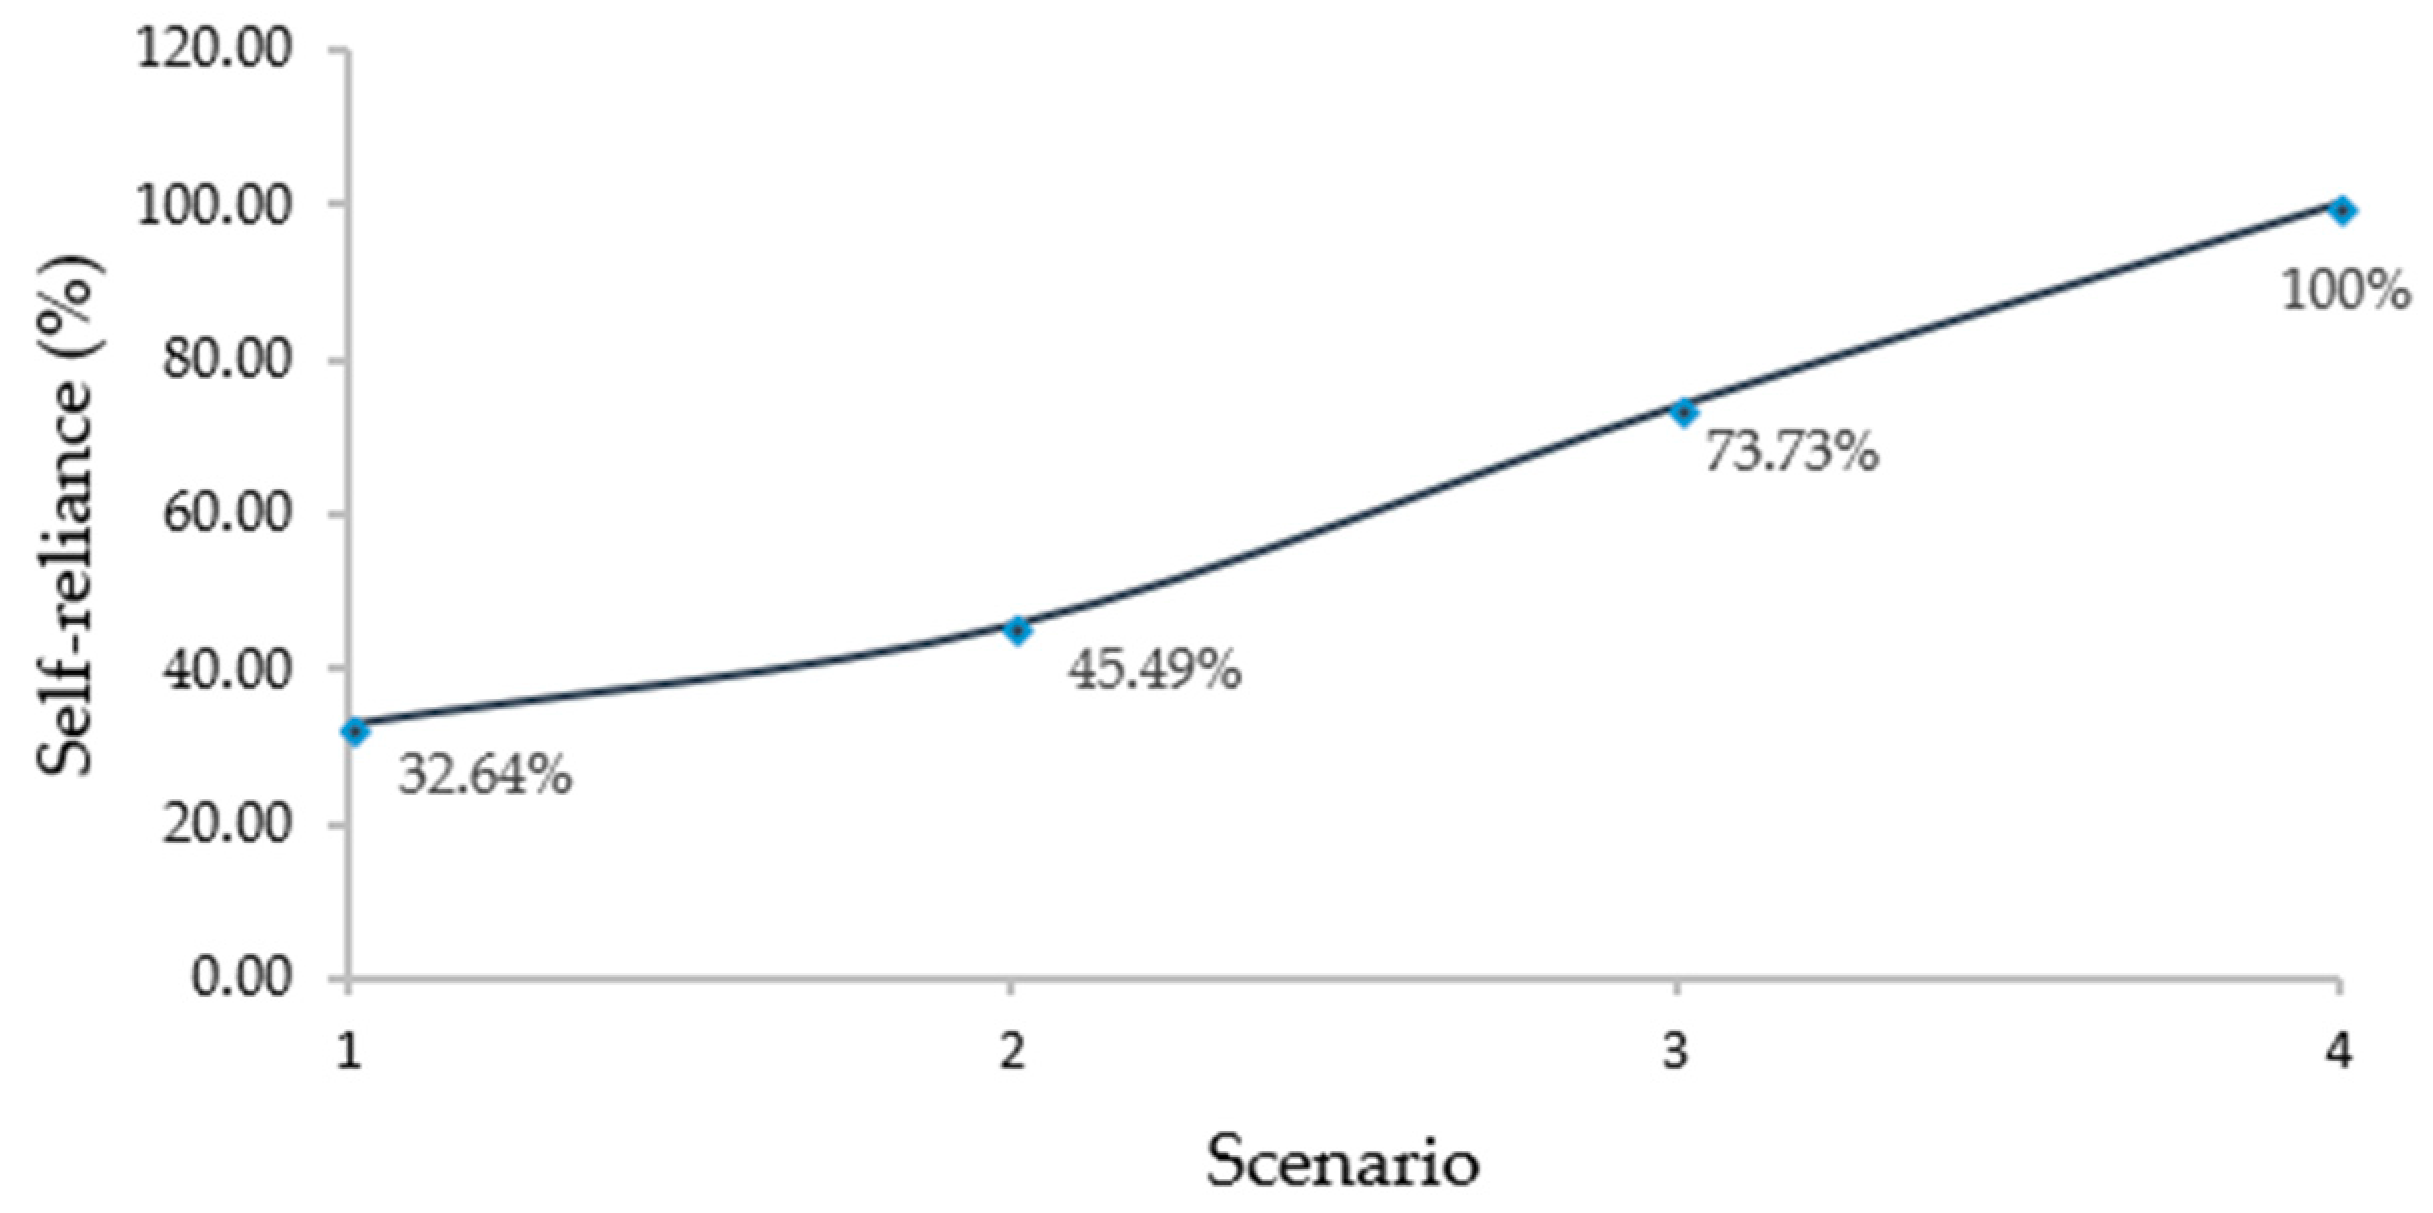
Yeongjong Island is 100% self-reliant in terms of non-drinking water, and reclaimed water is sufficient to meet the demands for irrigation, road washing, and ecology. For residential purposes, we used GA and GRG methods to assess the self-reliance in terms of the four scenarios described above. The results indicate that locally available water resources will meet 32.64%, 45.49%, 73.73%, and 100% of the residential demands in scenarios 1, 2, 3, and 4 in 2025, respectively, as shown in Figure 6.

3.2. Optimal Total Cost and Water Withdrawal Scenario for Different Scenarios

The total costs of water production (including capital investment cost and O&M cost) were calculated using both GRG and GA techniques. The optimal water withdrawal cost increased with the increase in use of water technologies like BWRO and SWRO. The environmental cost was calculated for the BWRO and SWRO processes only; we considered grey water as reclaimed water and supplied it without any treatment to road washing and ecological uses. For the case of agricultural purposes, we supplied it with or without blending with other sources of water wherever necessary. Thus, the reclaimed water did not emit any GHG in the study area. Since reclaimed water was abundant in the study area, the demand for agriculture, road washing, and ecological water was fulfilled from reclaimed water in all 4 scenarios.

3.2.1. Meeting the Demand Without Use of Rain Water, Brackish Water, or Sea Water

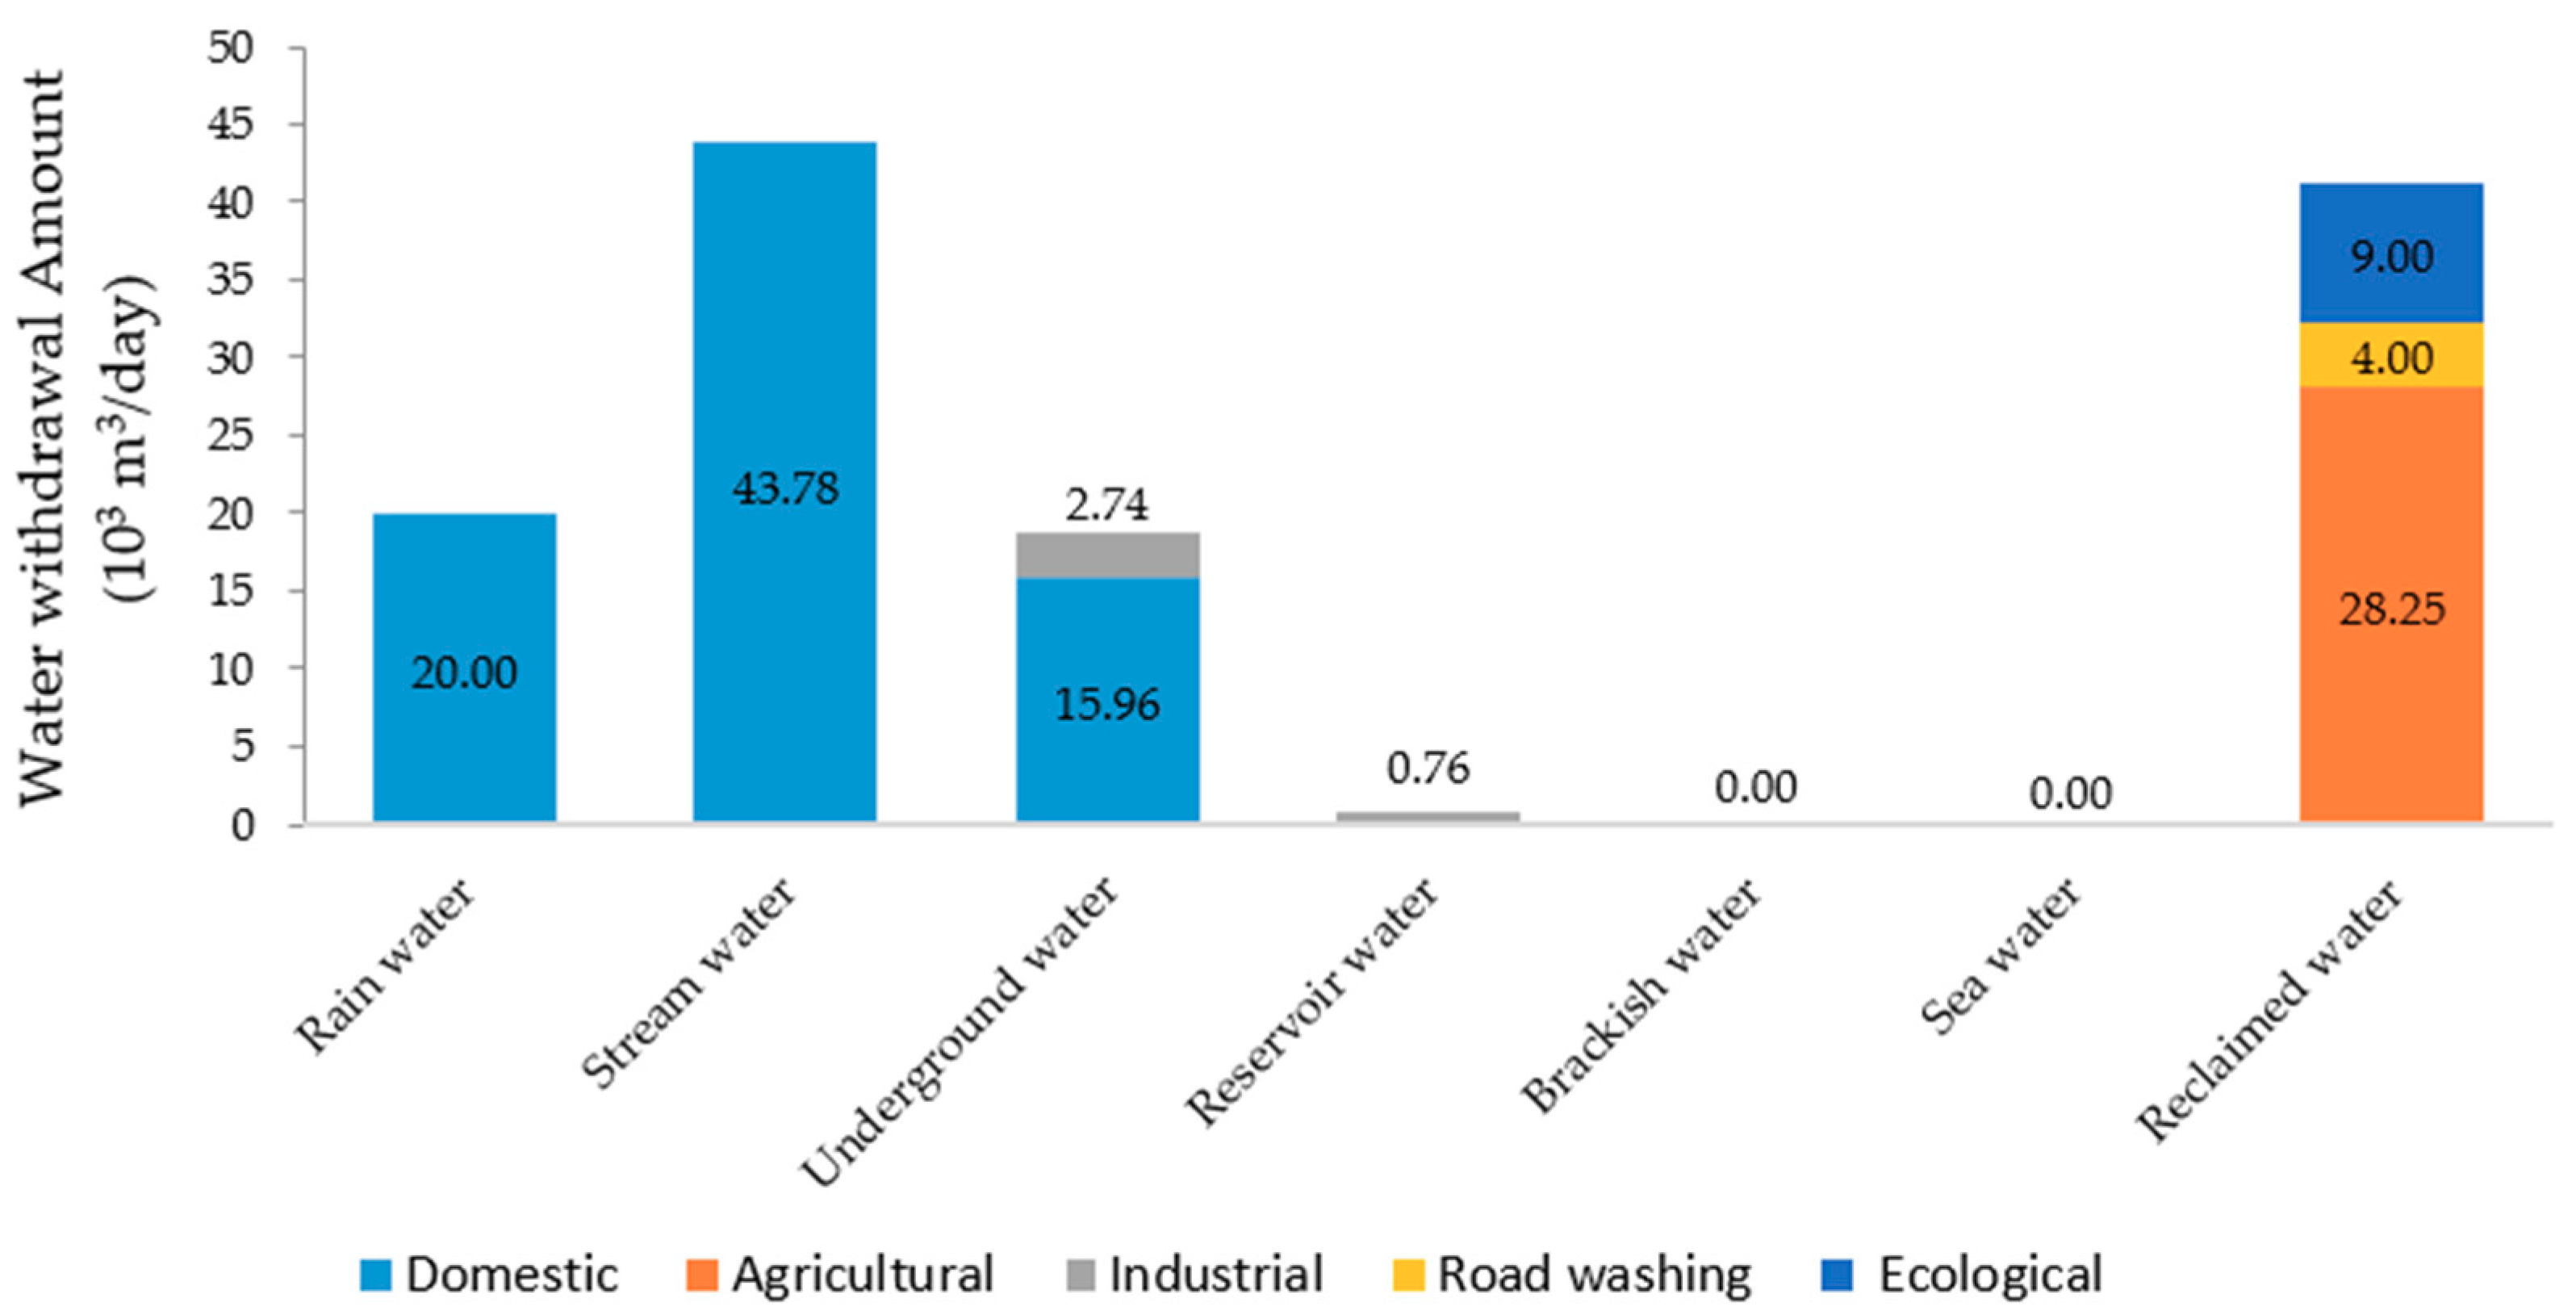
For water demand greater than the available water from selected sources, the GRG and GA methods gave the same results of optimal water selection from multi-water sources. The total water production in scenario 1 was 104,490 m3/day (Figure 7). Optimization results showed that domestic water was supplied from stream and underground sources whereas industrial water was supplied from underground and reservoir sources.
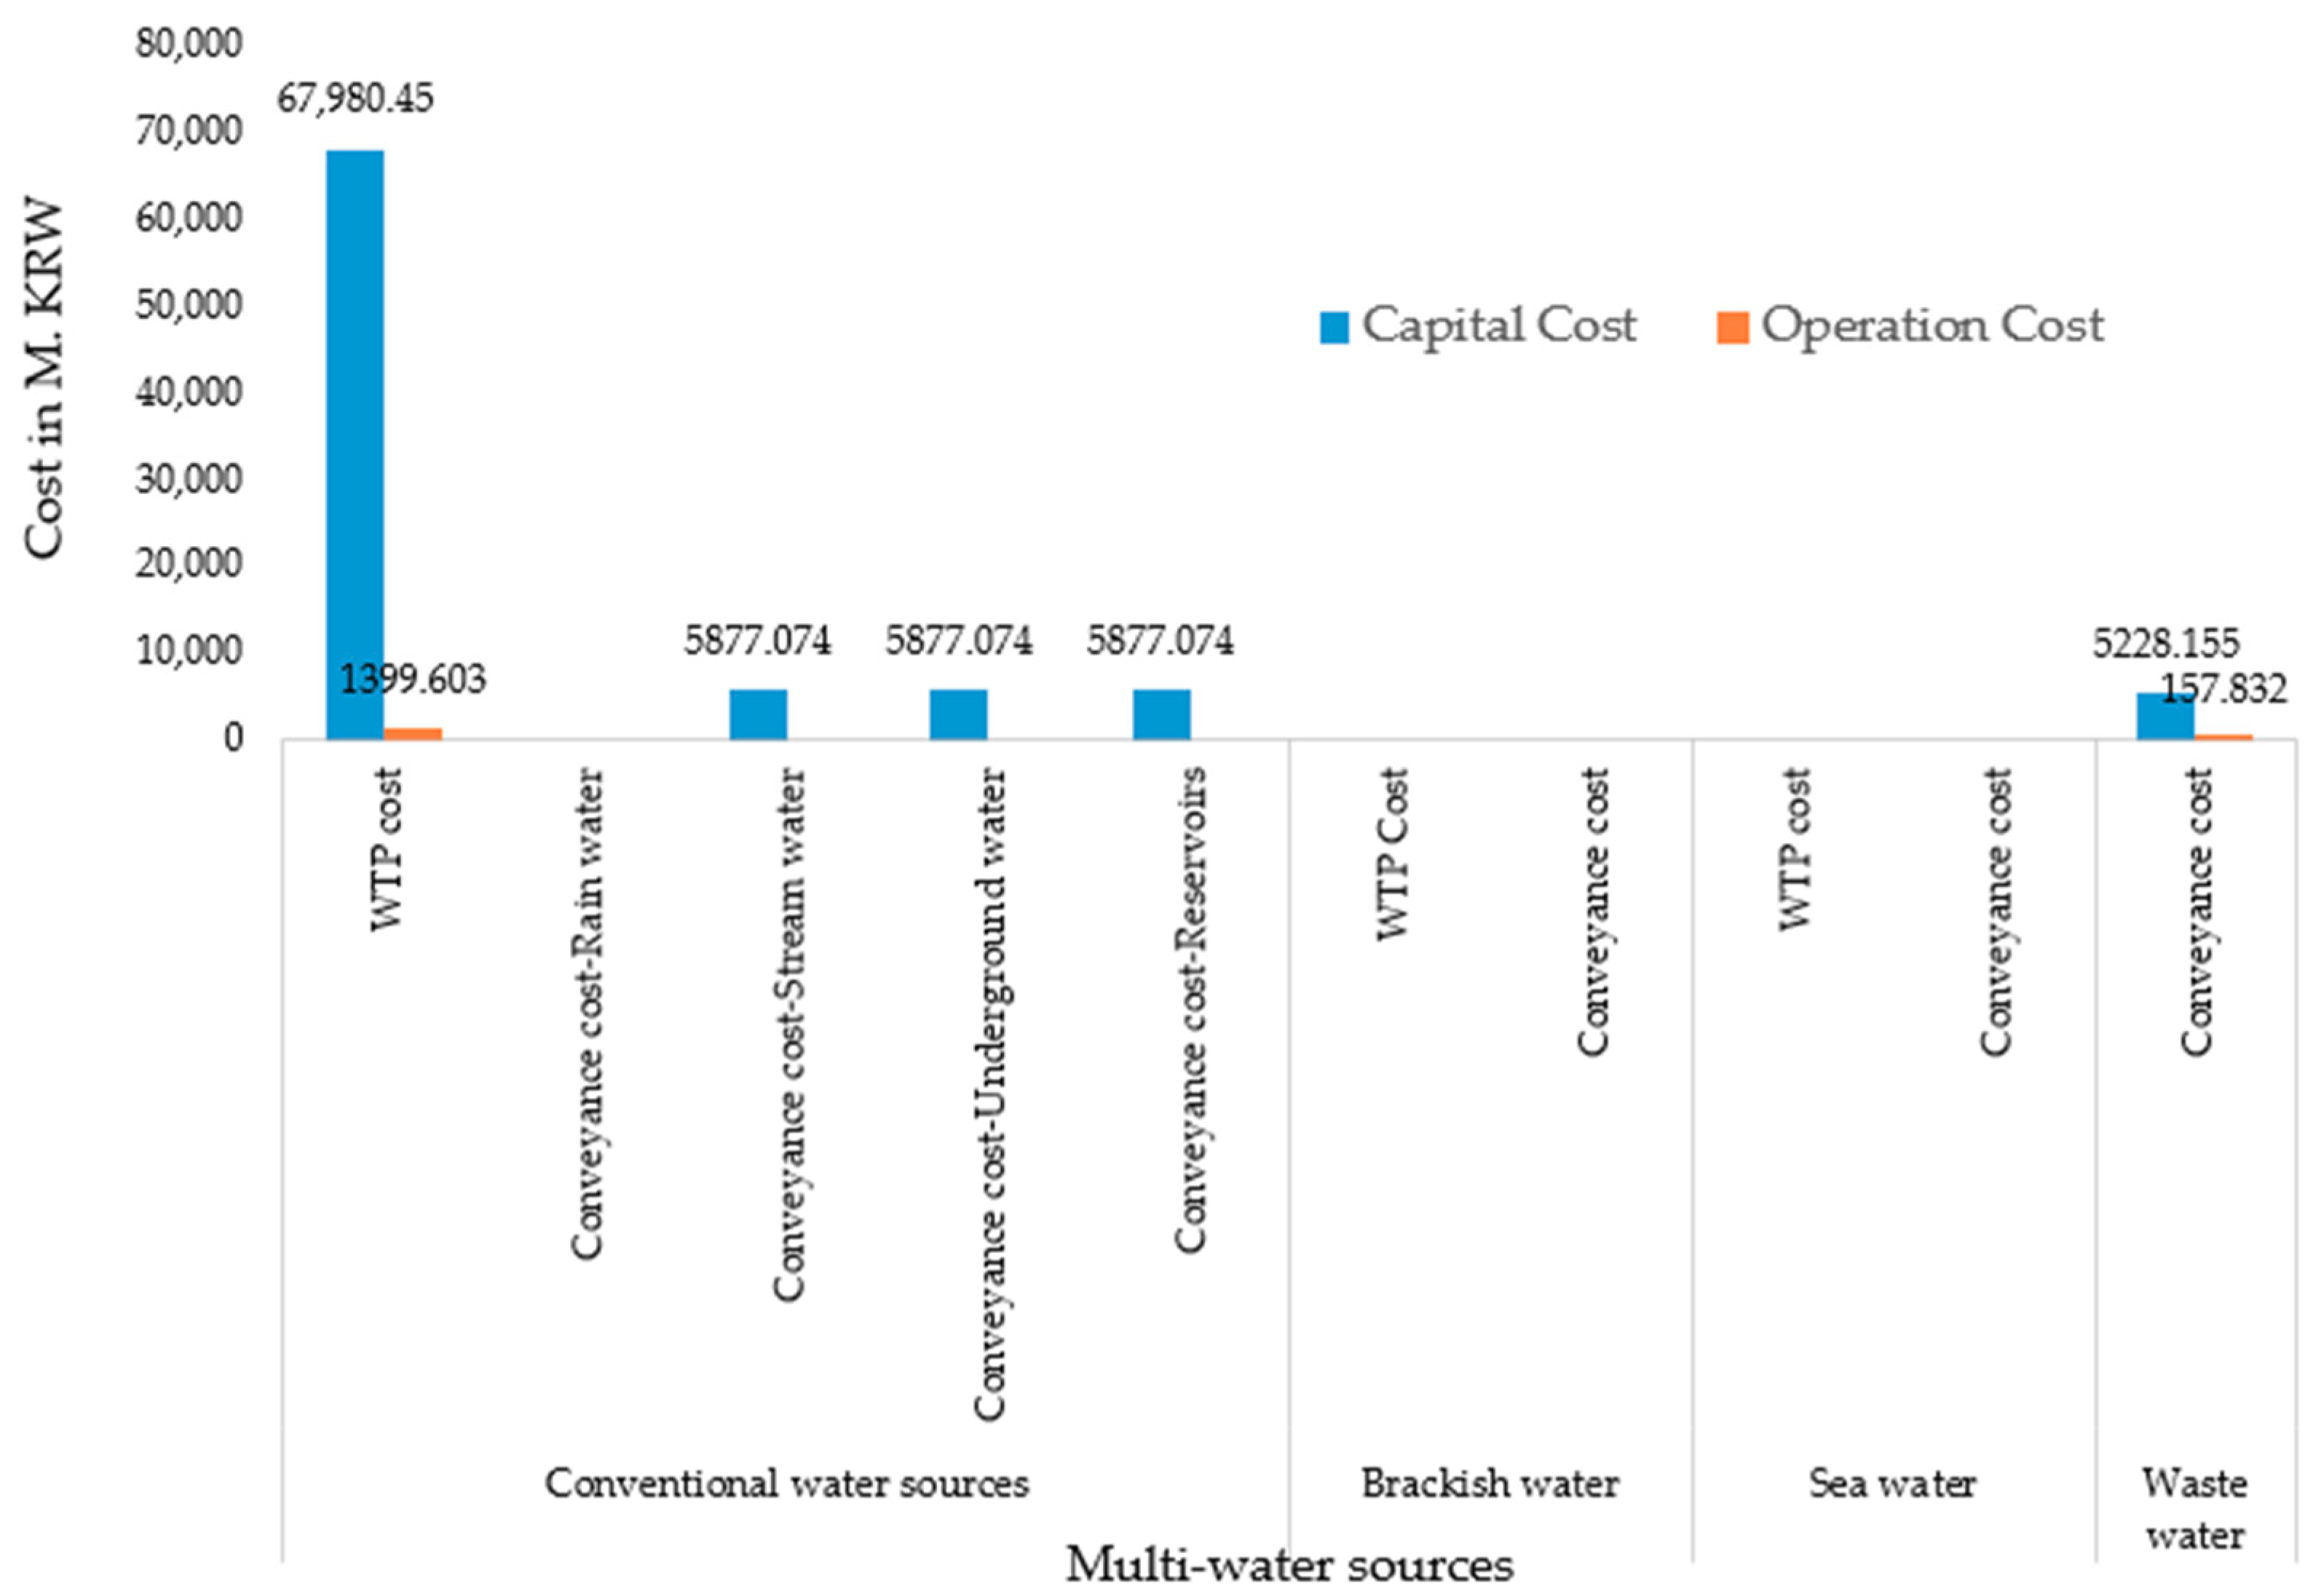
The capital cost and O&M cost were 90,840 million KRW (Korean Won) and 1557 million KRW, respectively. Cost of water production for scenario 1, is shown in Figure 8.

3.2.2. Meeting the Demand with Rain Water but without Brackish or Sea Water

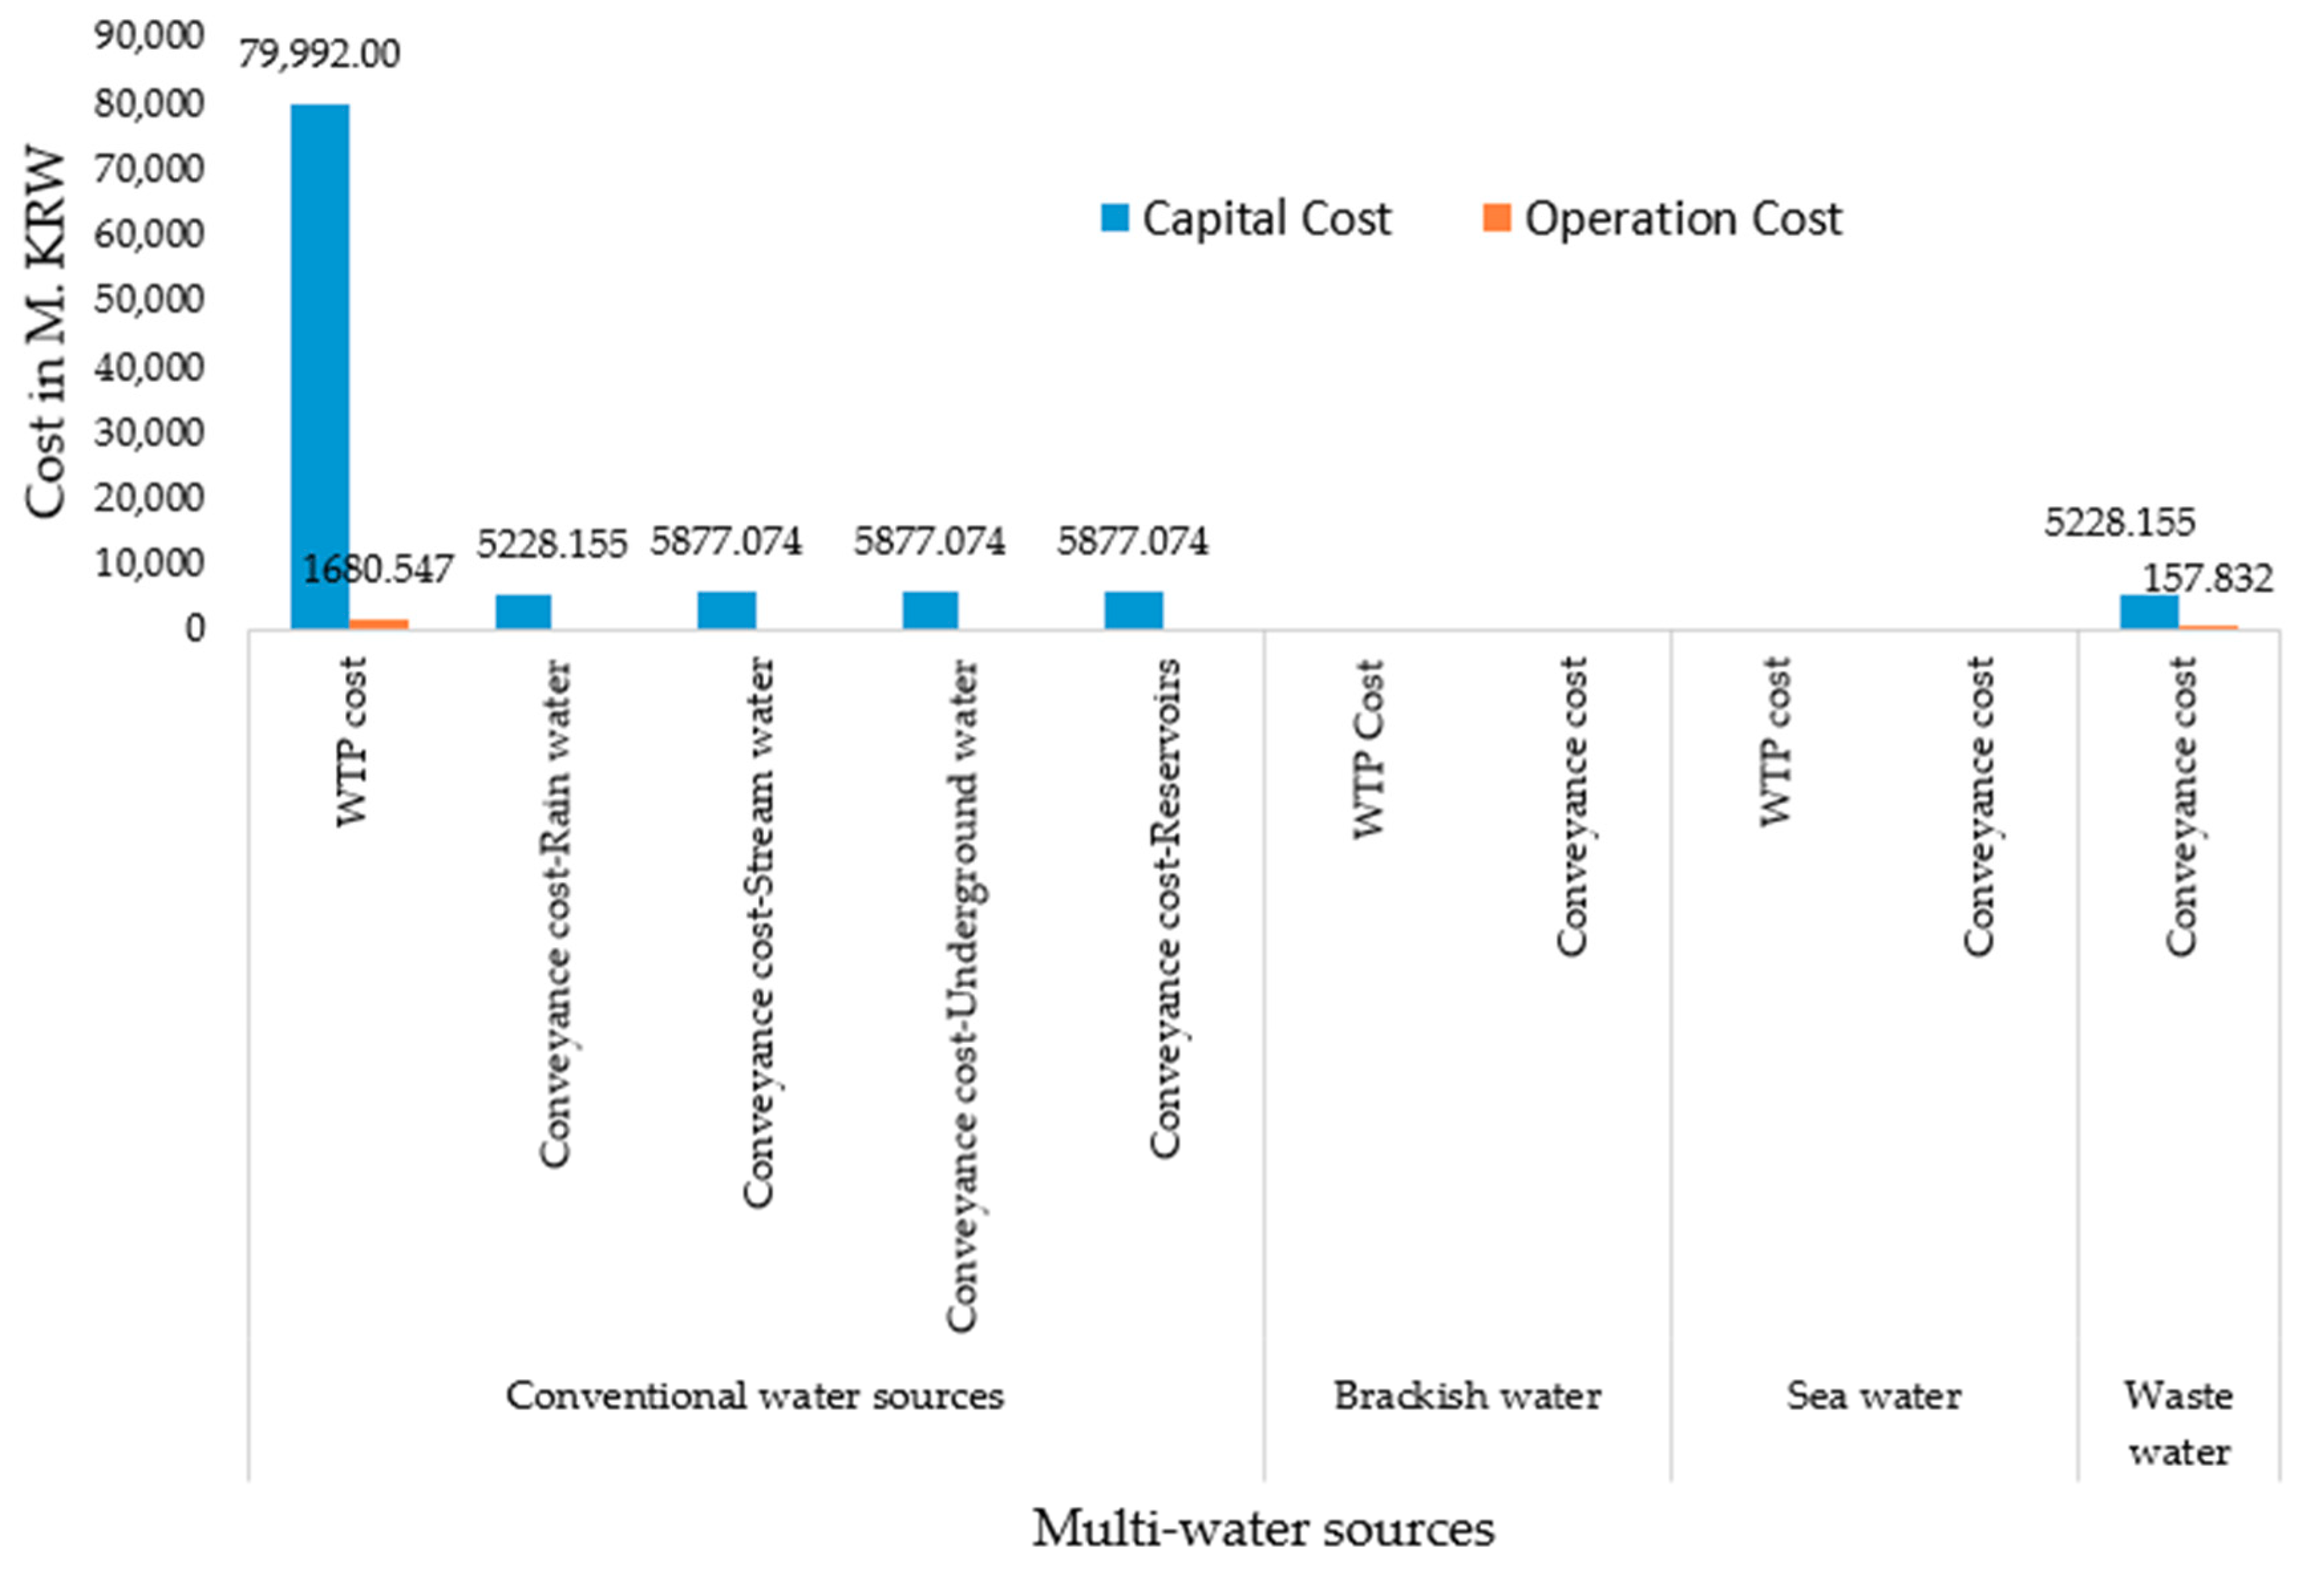
In scenario 2 as well, both GRG and GA gave the same results for optimal selection from multi-water sources. The total water production in scenario 2 was 124,490 m3/day (Figure 9). Optimization results in scenario 2 showed that domestic water was supplied from rain, stream, and underground sources whereas industrial water was supplied from underground and reservoir sources. The capital and O&M costs were 108,080 million KRW and 1839 million KRW, respectively (Figure 10).

3.2.3. Meeting the Demand with Rain Water and Brackish Water, but without Sea Water

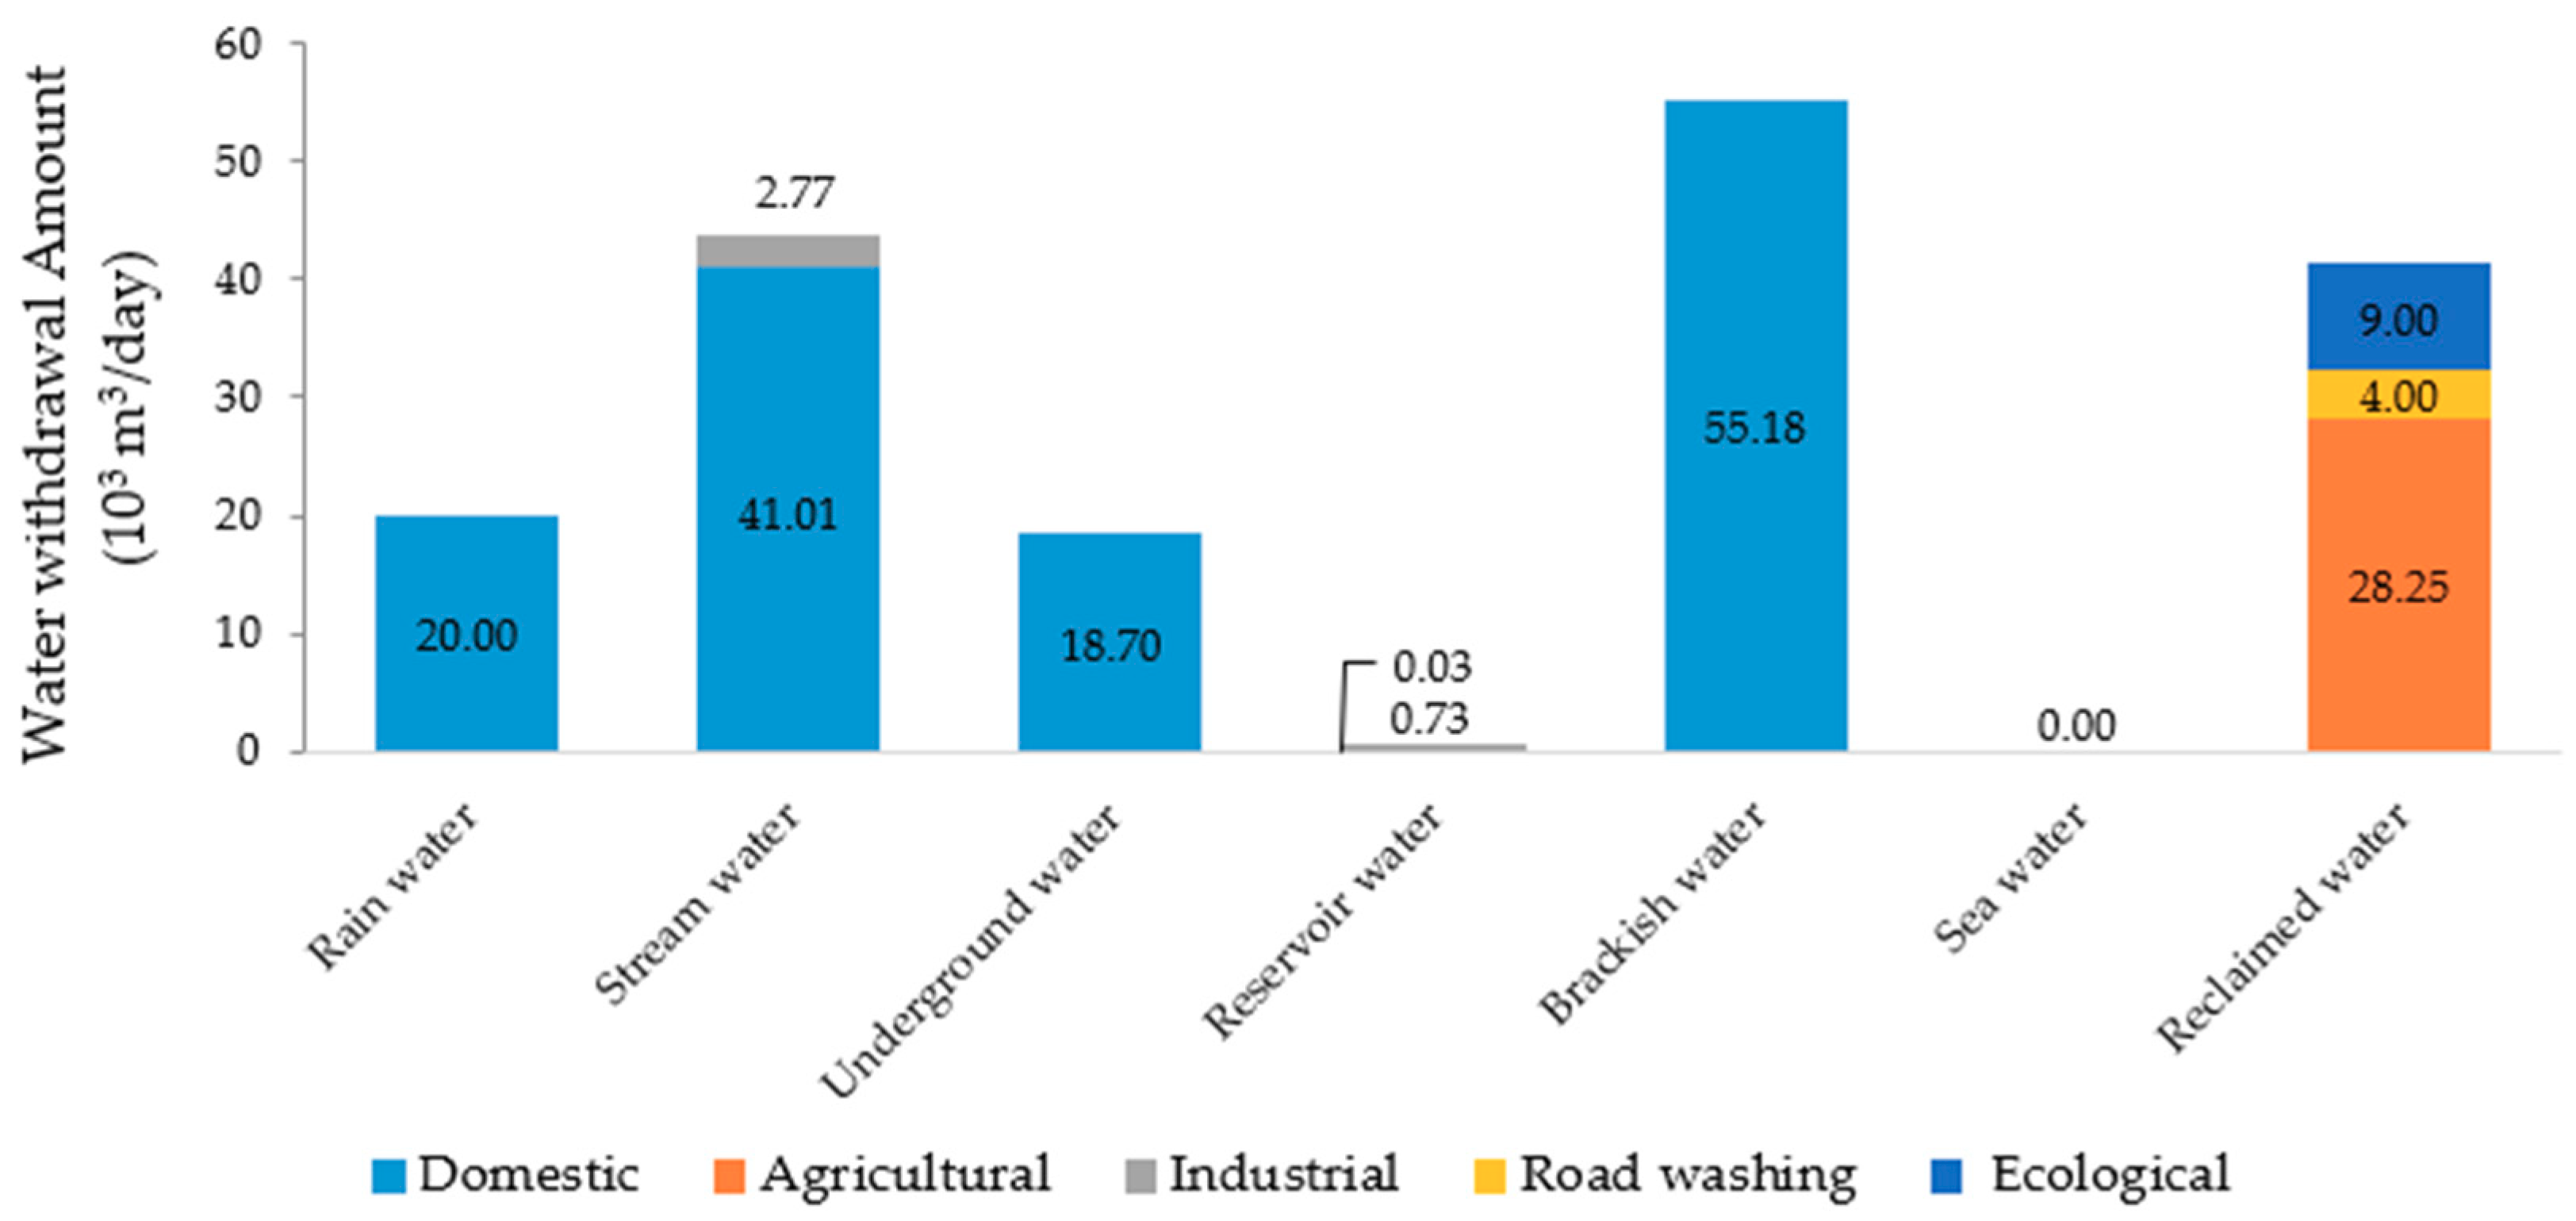
In scenario 3, both GRG and GA gave the same results for optimal water selection from multi-water sources. The total water production in scenario 3 was 179,670 m3/day (Figure 11). In this scenario, domestic water was supplied from rain (20,000 m3/day), stream (41,010 m3/day), underground (18,700 m3/day), reservoir (30 m3/day), and brackish water (55,180 m3/day) sources, whereas industrial water was supplied from stream (2770 m3/day) and reservoir sources (730 m3/day). The capital cost and O&M costs were 143,685 million KRW and 4877 million KRW, respectively (Figure 12). The environmental cost was 0.654 million KRW.

3.2.4. Meeting the Demand with Rain Water, Brackish Water, and Sea Water

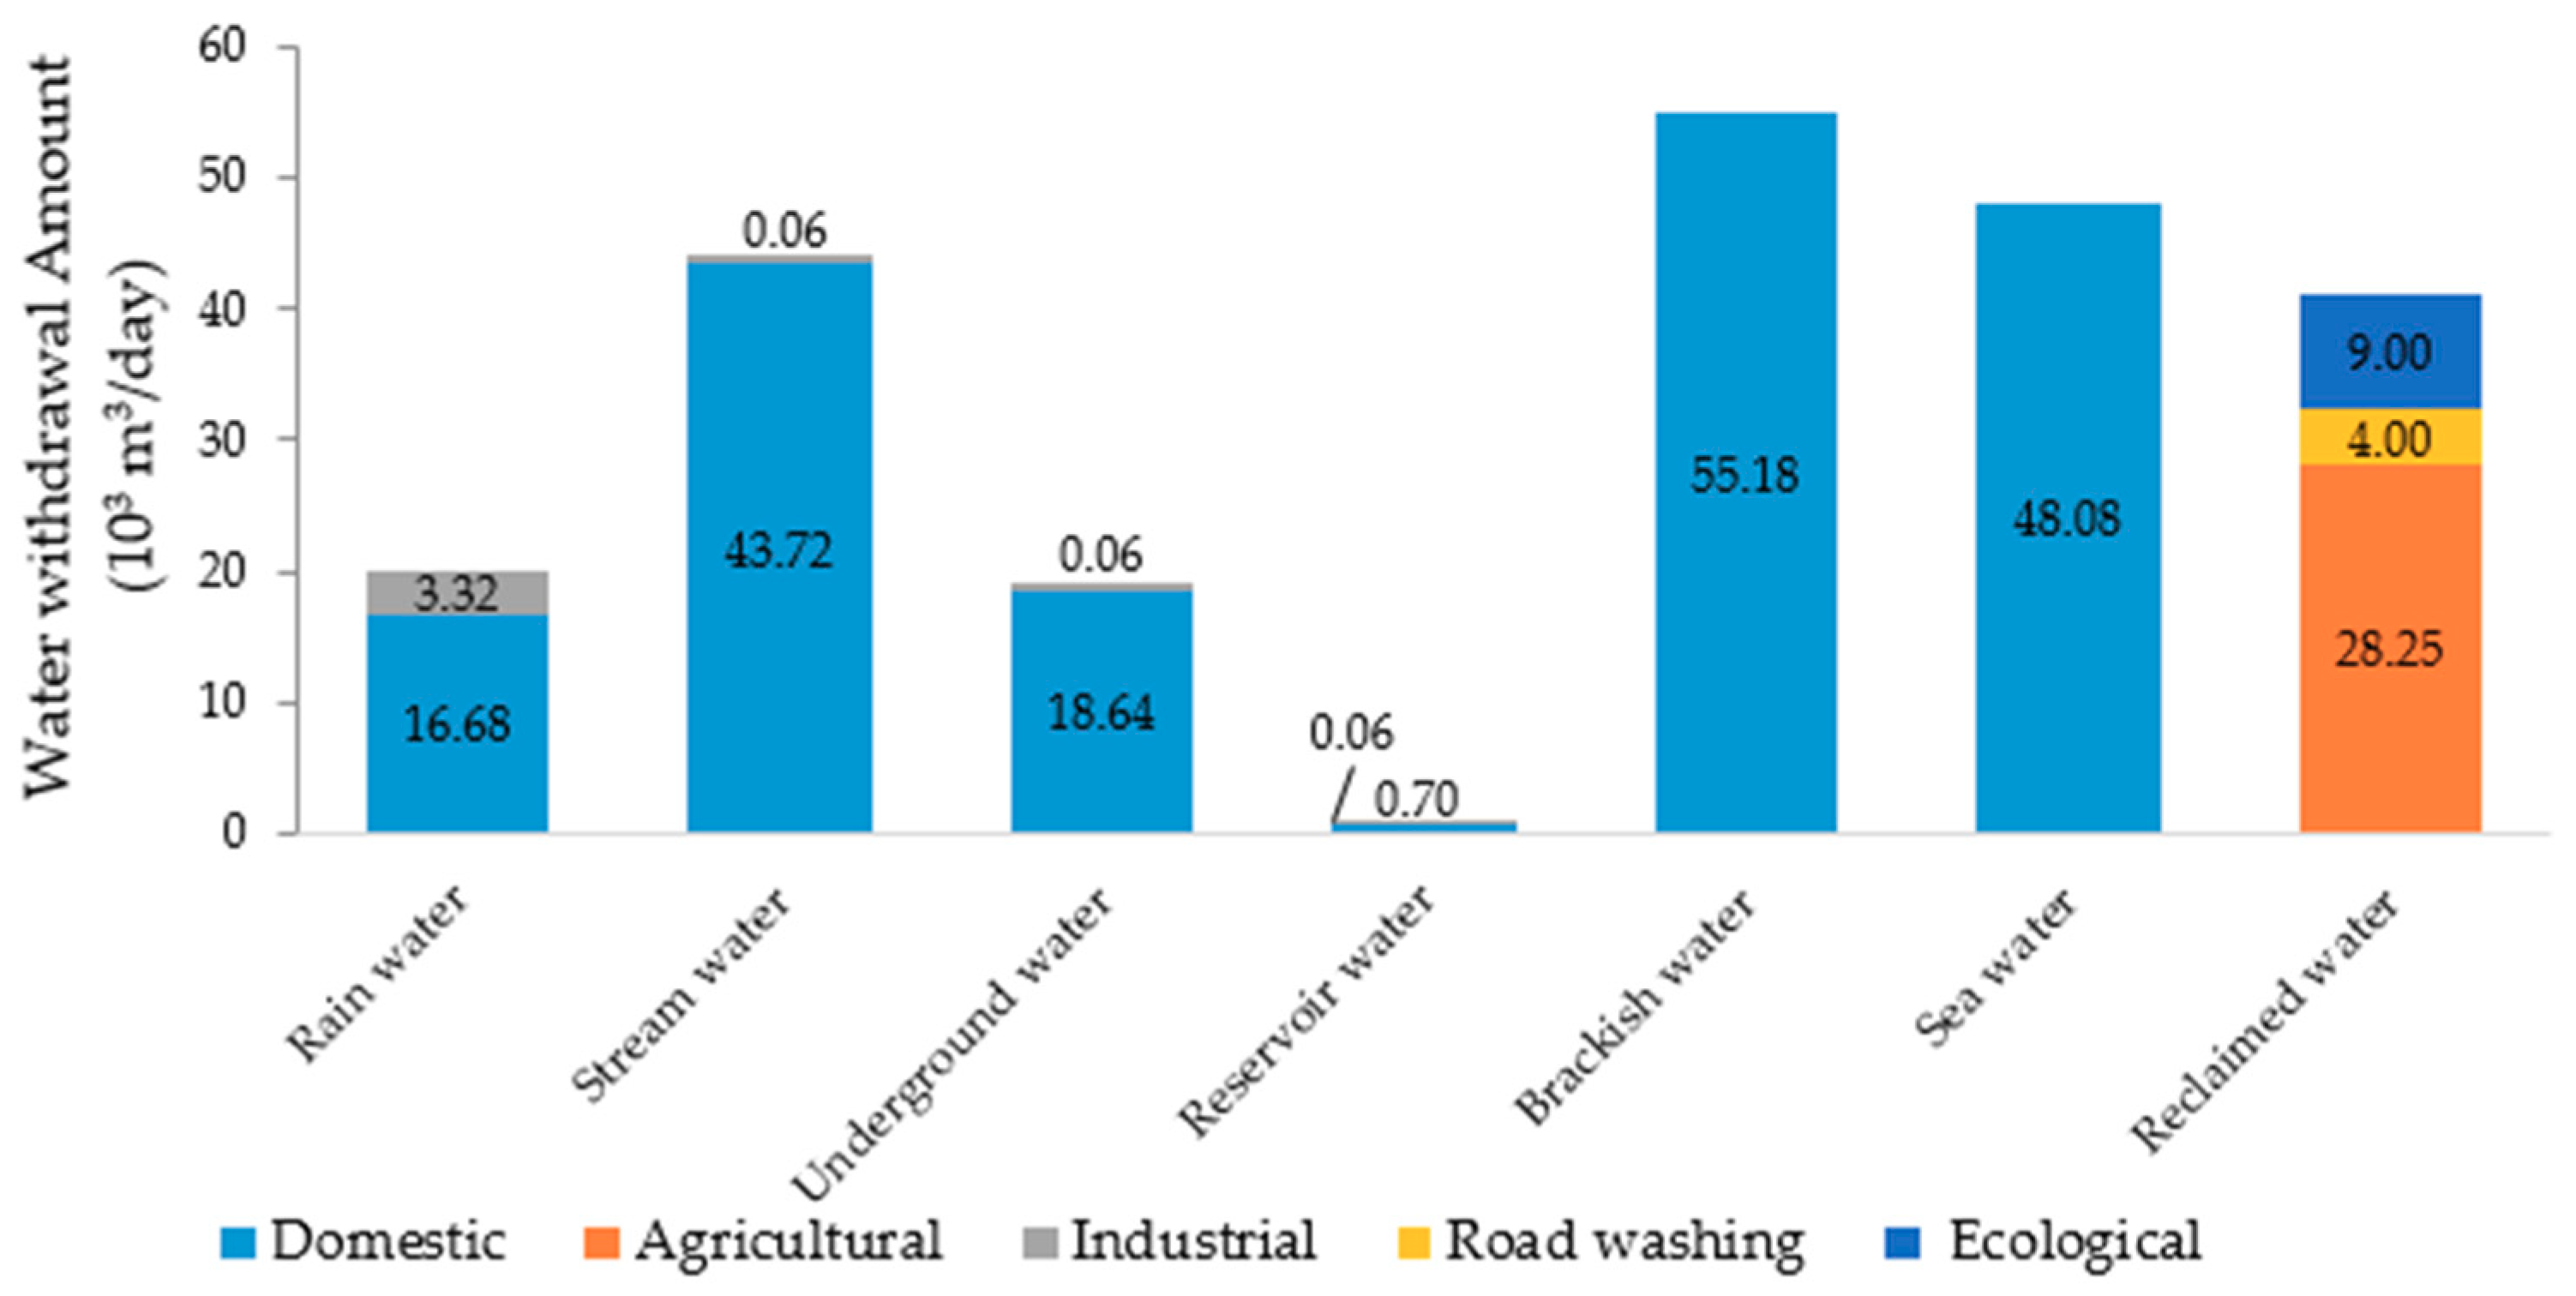
The GRG and GA methods gave slightly different results for optimal water selection from multi-water sources. The total water production in scenario 4 was 227,760 m3/day (Figure 13). GRG method withdraws water from rain (3320 m3/day), stream (60 m3/day), underground (60 m3/day), and reservoir sources (60 m3/day), whereas GA method withdraws only rain water to supply the industrial water demand. In this scenario, all other water sources except reclaimed water were used to supply domestic water. The result of the GRG method is shown in Figure 13.
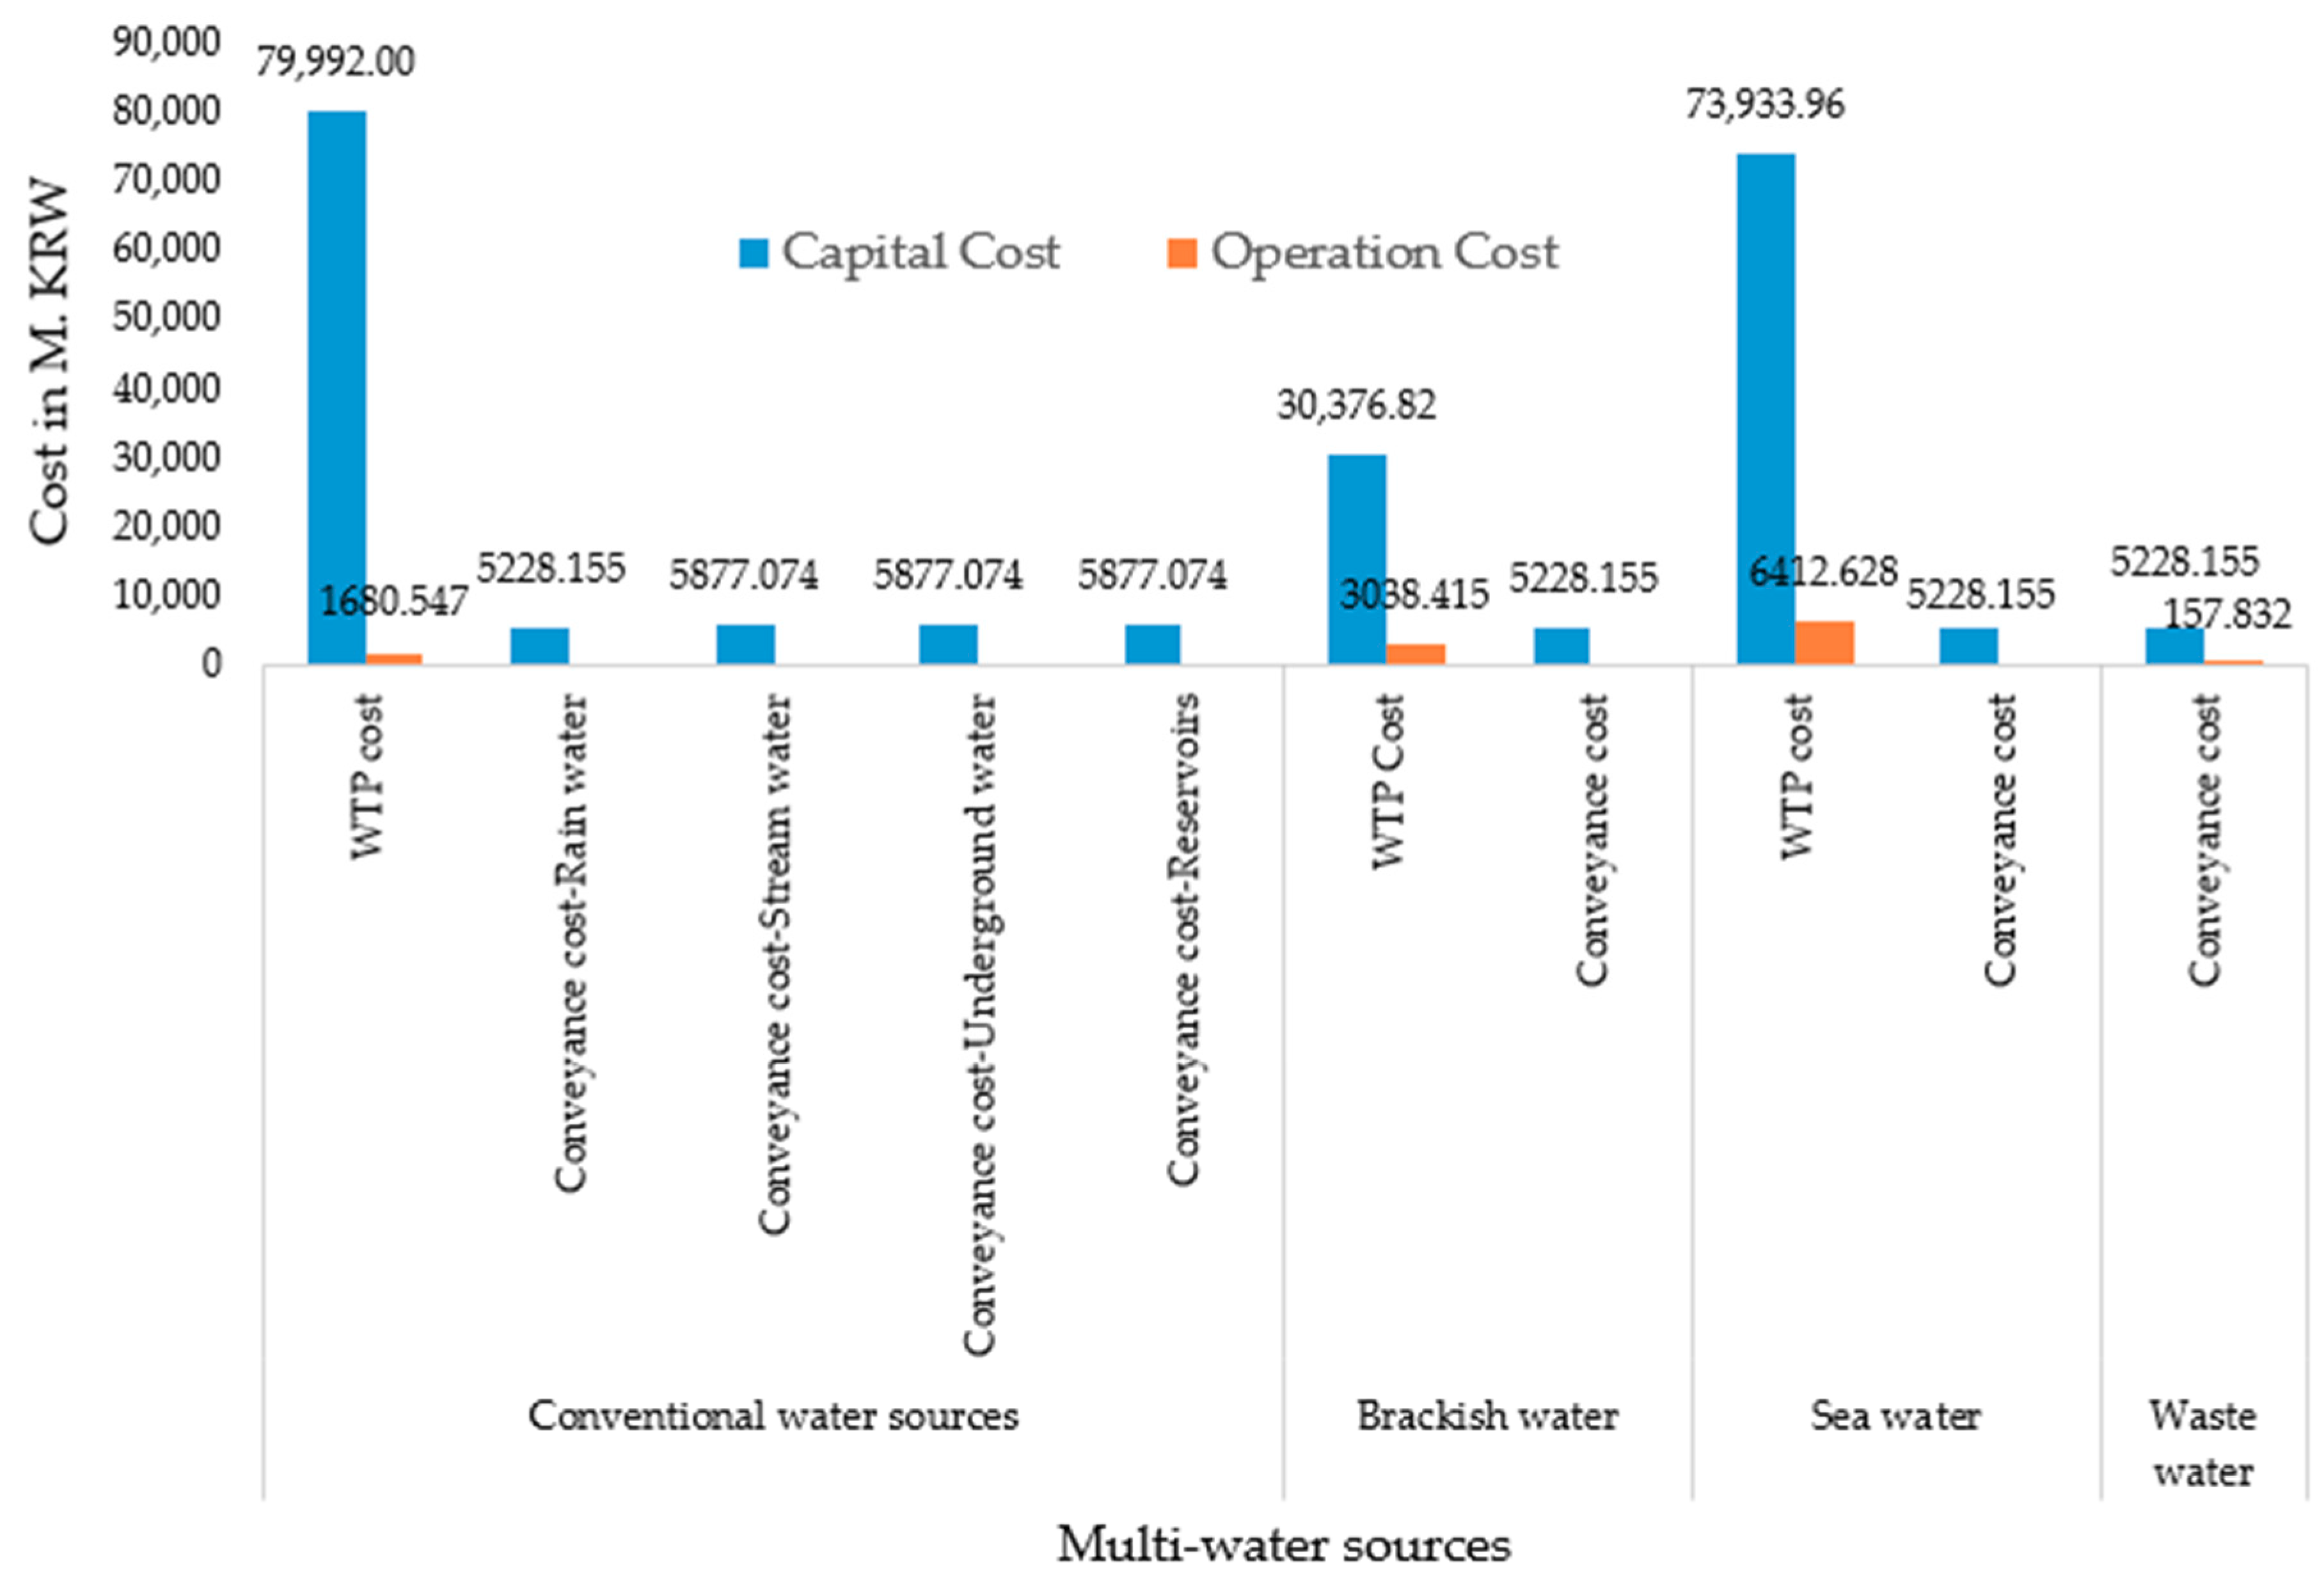
The capital cost was 222,846 million KRW, while the O&M cost from GRG and GA were 11,289.42 million KRW and 11,289.63 million KRW, respectively. The detailed cost of water production from each source is shown in Figure 14. Also, in this scenario the environmental costs for brackish water and sea water treatment were 0.654 million KRW and 1.653 million KRW, respectively.
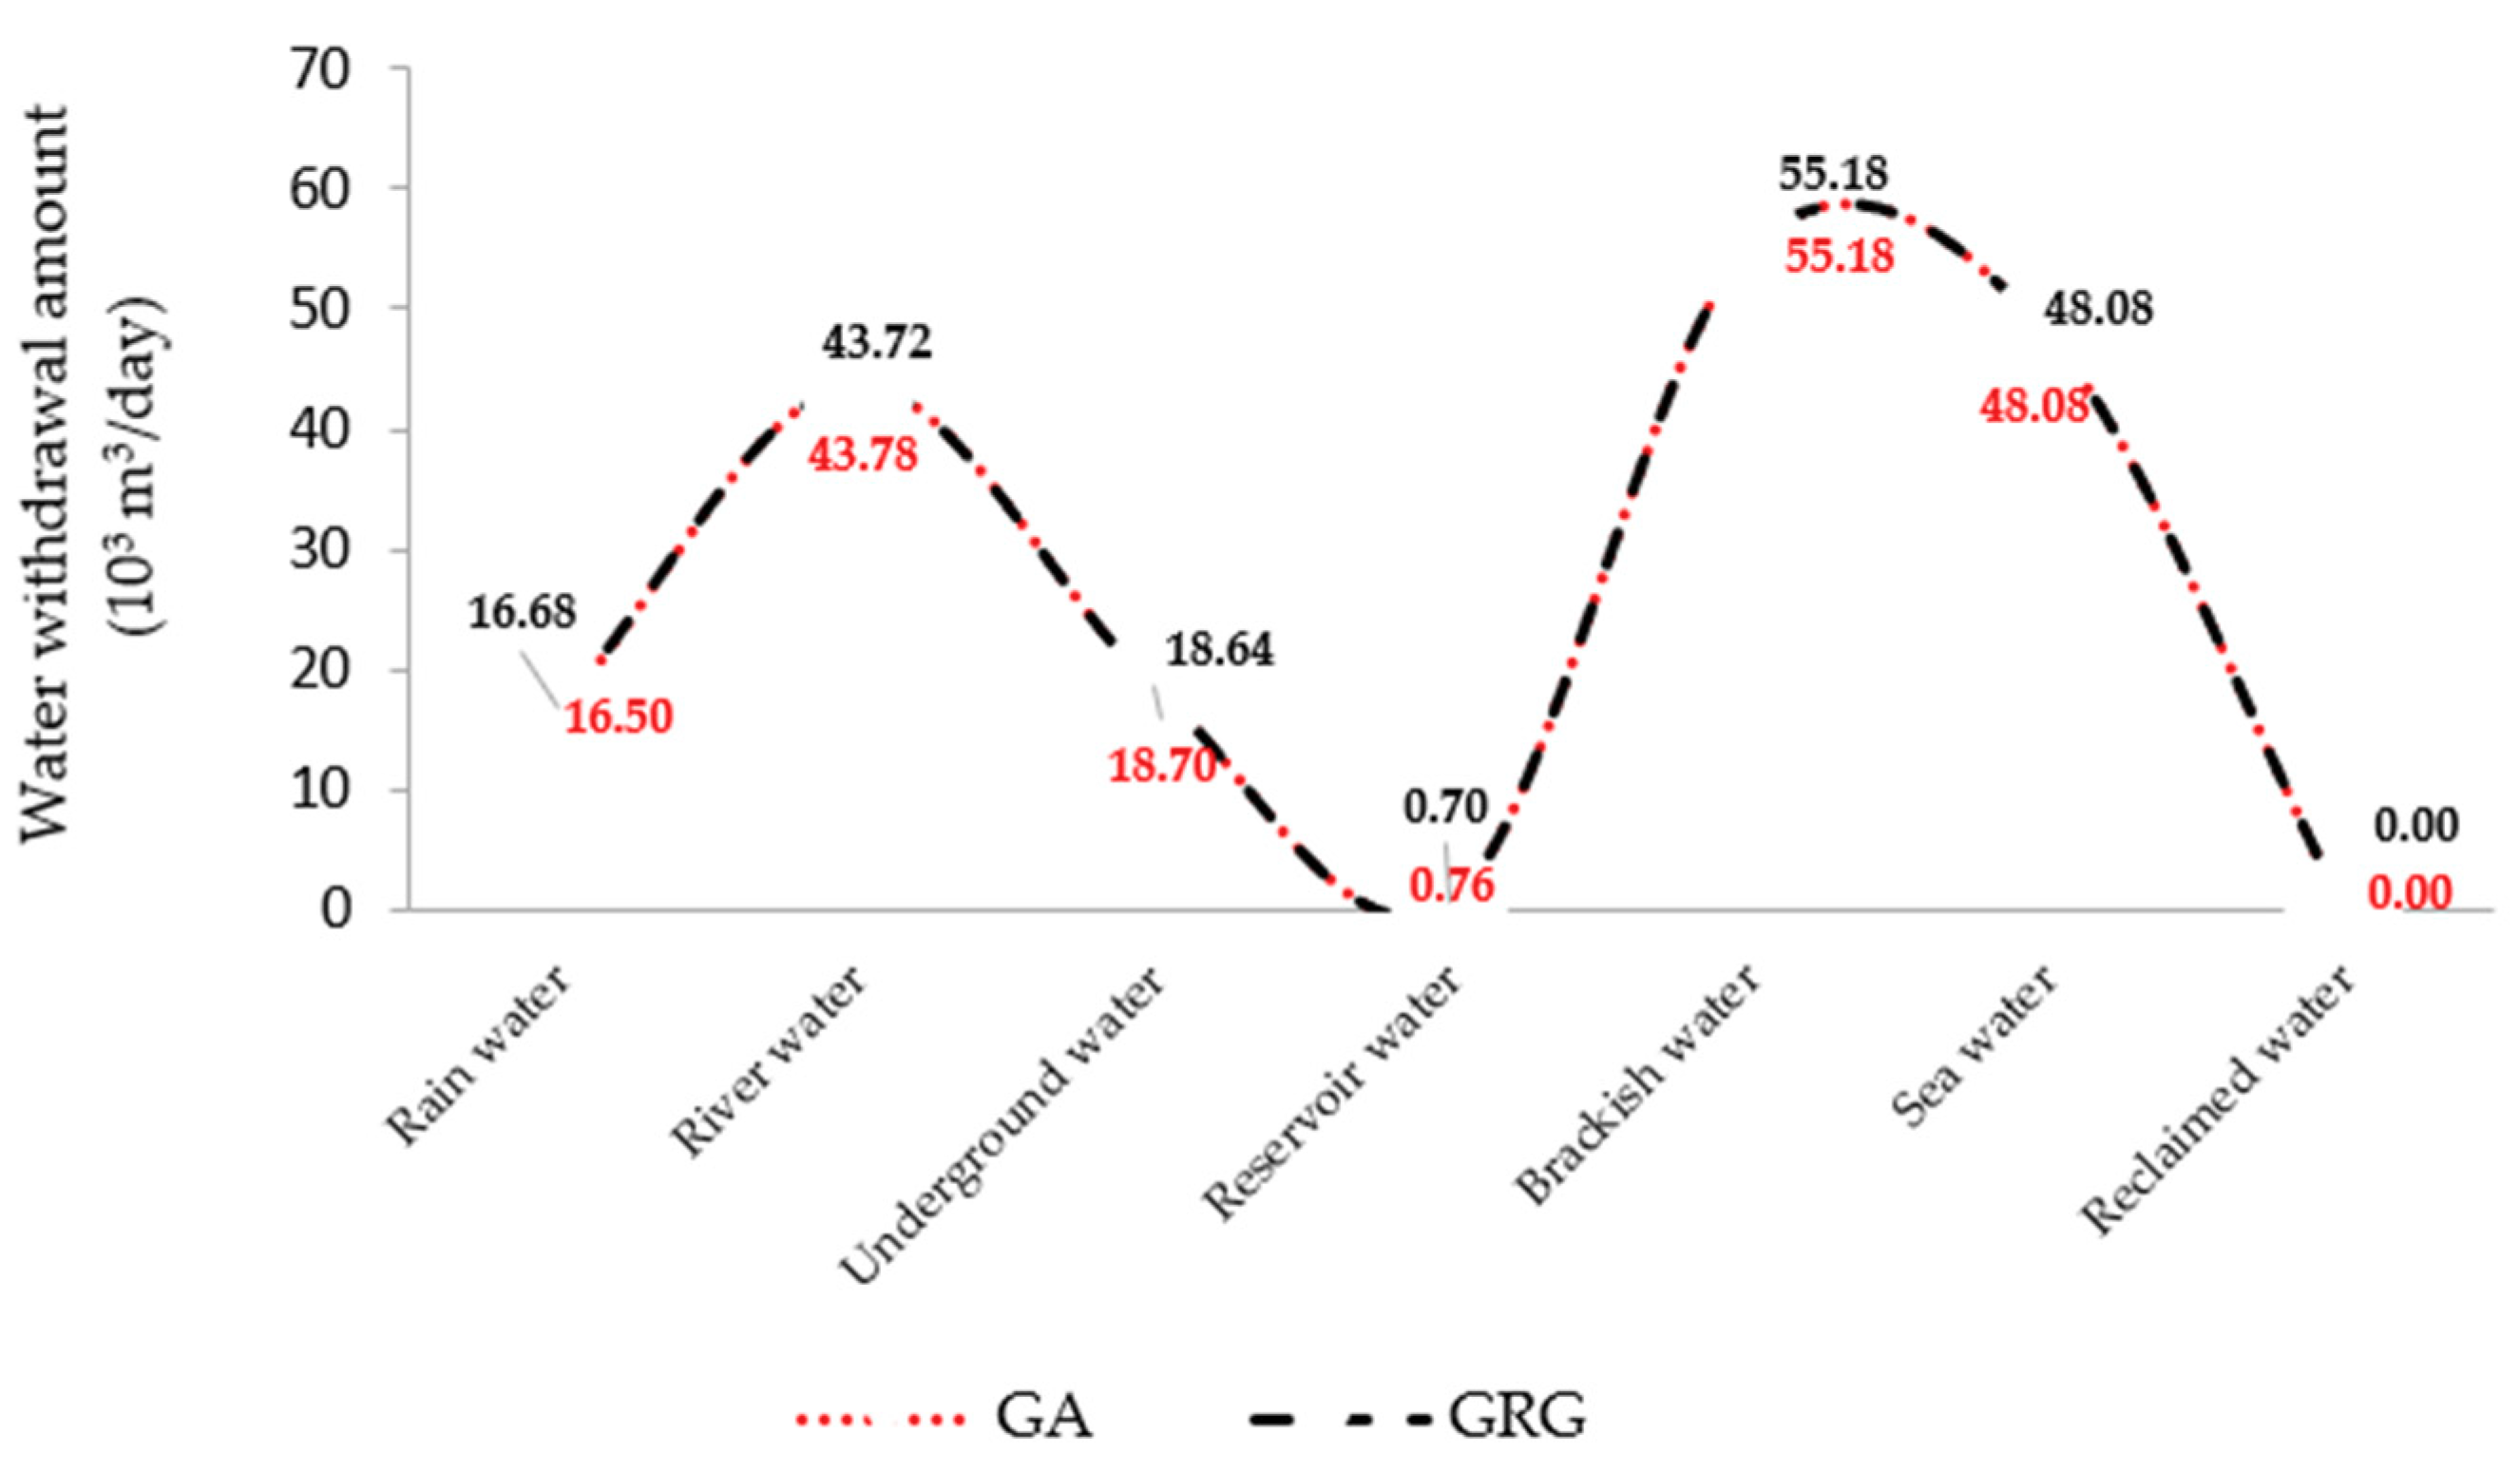
Water withdrawal for domestic use, calculated by GA and GRG, is shown in Figure 15, in which reclaimed water is not used for domestic purposes due to its quality issues. The intake of water by both methods was slightly different for rainwater, river water, and underground water, but was the same for the remaining sources.

4. Conclusions

In this study, a framework for the economic dispatch of multi-water sources in water supply emergency was developed and applied to Yeongjong Island of Korea. The optimal water withdrawal scenarios were developed in order to meet the different types of water demands with proper water quality, by utilizing locally available multi-water sources. The results from both methods, GA and GRG showed that locally available water resources in the study area were 32.64%, 45.49%, 73.73%, and 100% self-reliant to meet the domestic water demands for scenarios 1, 2, 3, and 4, respectively. Furthermore, the optimization results in the case of scenario 4 showed that, the use of locally available water resources (including sea water at 50,000 m3/day and brackish water at 55,000 m3/day), can ensure the water security of the island in case of a malfunction of the existing water supply system, which is sourced from mainland Korea. The environmental cost was found to be negligible when compared to the capital and O&M costs. The GRG and GA algorithms gave the same results for optimal water withdrawal when the water supply is less than the demand, but the results were slightly different in the reverse case.
The application of the framework to a case study added evidence that it can be used for assisting water managers and decision makers in determining the optimal supply of available water resources to meet multi-water demands, especially in case of an emergency. In addition, the framework not only reduces the dependence on a single source in an existing water supply system but also contributes in securing cost and energy reduction, thereby contributing to sustainability. The simplicity and flexibility of the proposed method demonstrates that it is versatile, and can be implemented effectively in other locations that are facing water scarcity or where water is supplied only from a single vulnerable source.

Author Contributions

K.G. conceptualized the framework of the research work, analyzed the data, and wrote the manuscript of this study; K.H.H. provided data; Z.W.G., K.S.J. and K.T.Y. provided significant suggestions on the methodology and structure of the manuscript. All authors have read and approved the final manuscript.

Funding

This work was supported by Korea Environment Industry & Technology Institute (KEITI) through “Demand Responsive Water Supply Service Project” funded by Korea Ministry of Environment (MOE) (1485016211). This research was also supported by the Energy Cloud R&D Program through the National Research Foundation of Korea (NRF) funded by the Ministry of Science, ICT (2019M3F2A1073164).

Acknowledgments

The authors would like to thank Jung Lyul Lee, Min Ha Choi and KangMin Koo, Graduate School of Water Resources, Sungkyunkwan University, Korea for their valuable suggestions and advice during the preparation of this manuscript.

Conflicts of Interest

The authors declare no conflict of interest.

References

  1. Verdaguer, M.; Molinos-Senante, M.; Clara, N.; Santana, M.; Gernjak, W.; Poch, M. Optimal fresh water blending: A methodological approach to improve the resilience of water supply systems. Sci. Total Environ. 2018, 624, 1308–1315. [Google Scholar] [CrossRef] [PubMed]
  2. Li, Y.; Xiong, W.; Zhang, W.; Wang, C.; Wang, P. Life cycle assessment of water supply alternatives in water-receiving areas of the South-to-North Water Diversion Project in China. Water Res. 2016, 89, 9–19. [Google Scholar] [CrossRef] [PubMed]
  3. Zhang, S.; Yang, J.; Wan, Z.; Yi, Y. Multi-water source joint scheduling model using a refined water supply network: Case study of Tianjin. Water 2018, 10, 1580. [Google Scholar] [CrossRef]
  4. Durán-Sánchez, A.; Álvarez-García, J.; del Río-Rama, M. Sustainable water resources management: A bibliometric overview. Water 2018, 10, 1191. [Google Scholar] [CrossRef]
  5. Choi, I.-C.; Shin, H.-J.; Nguyen, T.; Tenhunen, J. Water policy reforms in South Korea: A historical review and ongoing challenges for sustainable water governance and management. Water 2017, 9, 717. [Google Scholar] [CrossRef]
  6. Byeon, S.; Choi, G.; Maeng, S.; Gourbesville, P. Sustainable water distribution strategy with smart water grid. Sustainability 2015, 7, 4240–4259. [Google Scholar] [CrossRef]
  7. Labadie, J.W.; Fontane, D.G.; Lee, J.-H.; Ko, I.H. Decision support system for adaptive river basin management: Application to the Geum River basin, Korea. Water Int. 2007, 32, 397–415. [Google Scholar] [CrossRef]
  8. Mo, W.; Wang, R.; Zimmerman, J.B. Energy-water nexus analysis of enhanced water supply scenarios: A regional comparison of Tampa Bay, Florida, and San Diego, California. Environ. Sci. Technol. 2014, 48, 5883–5891. [Google Scholar] [CrossRef]
  9. Abdulbaki, D.; Al-Hindi, M.; Yassine, A.; Najm, M.A. An optimization model for the allocation of water resources. J. Clean. Prod. 2017, 164, 994–1006. [Google Scholar] [CrossRef]
  10. Han, Y.; Xu, S.-G.; Xu, X.-Z. Modeling multisource multiuser water resources allocation. Water Resour. Manag. 2008, 22, 911–923. [Google Scholar] [CrossRef]
  11. Huang, G.; Chang, N. The perspectives of environmental informatics and systems analysis. J. Environ. Inform. 2003, 1, 1–7. [Google Scholar] [CrossRef]
  12. Puleo, V.; Fontanazza, C.; Notaro, V.; Freni, G. Multi sources water supply system optimal control: A case study. Procedia Eng. 2014, 89, 247–254. [Google Scholar] [CrossRef]
  13. Wei, S.; Yang, H.; Abbaspour, K.; Mousavi, J.; Gnauck, A. Game theory based models to analyze water conflicts in the Middle Route of the South-to-North Water Transfer Project in China. Water Res. 2010, 44, 2499–2516. [Google Scholar] [CrossRef] [PubMed]
  14. Liu, D.; Liu, W.; Fu, Q.; Zhang, Y.; Li, T.; Imran, K.M.; Abrar, F.M. Two-stage multi-water sources allocation model in regional water resources management under uncertainty. Water Resour. Manag. 2017, 31, 3607–3625. [Google Scholar] [CrossRef]
  15. Byeon, S.; Cho, W.; Lee, K.; Hwang, J.W. A Study on Development and Application of Island Type Water Balance Evaluation System. Int. J. Control Autom. 2015, 8, 49–58. [Google Scholar] [CrossRef]
  16. Park, H.; Woo, D.-S. Decision Support System for Blending of Multiple Water Resources and System Diagnosis in Water Treatment Plant. Int. J. Softw. Eng. Its Appl. 2014, 8, 43–54. [Google Scholar]
  17. Avni, N.; Eben-Chaime, M.; Oron, G. Optimizing desalinated sea water blending with other sources to meet magnesium requirements for potable and irrigation waters. Water Res. 2013, 47, 2164–2176. [Google Scholar] [CrossRef]
  18. Kim, J.; Kim, C.S.; Geem, Z.W. A memetic approach for improving minimum cost of economic load dispatch problems. Math. Probl. Eng. 2014, 2014, 906028. [Google Scholar] [CrossRef]
  19. Geem, Z.W. Economic dispatch using parameter-setting-free harmony search. J. Appl. Math. 2013, 2013, 427936. [Google Scholar] [CrossRef]
  20. Incheon Water Supply Basic Plan; Waterworks Headquarters Incheon Metropolitan City: Incheon, Korea, 2014.
  21. Byeon, S.J. Water Balance Assessment for Stable Water Management in Island Region. Ph.D. Thesis, University of Nice Sophia Antipolis, Nice, France, 28 November 2014. [Google Scholar]
  22. Wittholz, M.K.; O’Neill, B.K.; Colby, C.B.; Lewis, D. Estimating the cost of desalination plants using a cost database. Desalination 2008, 229, 10–20. [Google Scholar] [CrossRef]
  23. Hwang, M.-H.; Han, D.; Kim, I.S. Estimation of Water Production Cost from Seawater Reverse Osmosis (SWRO) Plant in Korea. J. Korean Soc. Environ. Eng. 2017, 39, 169–179. [Google Scholar] [CrossRef] [Green Version]
  24. Calculation Standards for Water Supply and Operation Costs; Ministry of Environment: Sejong, Korea, 2015.
  25. Tarnacki, K.; Meneses, M.; Melin, T.; Van Medevoort, J.; Jansen, A. Environmental assessment of desalination processes: Reverse osmosis and Memstill®. Desalination 2012, 296, 69–80. [Google Scholar] [CrossRef]
  26. Suk, S. An Estimate of Internal Carbon Pricing of Korean Companies under the Emission Trading Scheme. In Proceedings of the Korea Environmental Economics Association Joint Conference, Chuncheon, Korea, 1–2 February 2018; pp. 185–204. [Google Scholar]
  27. Wolfe, P. Methods of Non-Linear Programming; McGraw-Hill: New York, NY, USA, 1963. [Google Scholar]
  28. Duffuaa, S.O.; Shuaib, A.N.; Alam, M. Evaluation of optimization methods for machining economics models. Comput. Oper. Res. 1993, 20, 227–237. [Google Scholar] [CrossRef]
  29. Lee, H.-T.; Chen, S.-H.; Kang, H.-Y. A study of generalized reduced gradient method with different search directions. J. Quant. Manag. 2004, 1, 25–38. [Google Scholar]
  30. Lasdon, L.S.; Fox, R.L.; Ratner, M.W. Nonlinear optimization using the generalized reduced gradient method. Rev. Française DautomatiqueInform. Rech. Opérationnelle. Rech. Opérationnelle 1974, 8, 73–103. [Google Scholar] [CrossRef] [Green Version]
  31. Gabriele, G.; Ragsdell, K. The generalized reduced gradient method: A reliable tool for optimal design. J. Eng. Ind. 1977, 99, 394–400. [Google Scholar] [CrossRef]
  32. Sakhaei, Z.; Azin, R.; Osfouri, S. Assessment of empirical/theoretical relative permeability correlations for gas-oil/condensate systems. In Proceedings of the 1st Biennial Persian Gulf Oil, Gas and Petrochemical Energy and Environment Conference, Bushehr, Iran, 20 April 2016. [Google Scholar]
  33. Holland, J.H. Adaptation in Natural and Artificial Systems: An Introductory Analysis with Applications to Biology, Control, and Artificial Intelligence; MIT Press: Cambridge, MA, USA, 1992. [Google Scholar]
  34. Mitchell, M. An Introduction to Genetic Algorithms; MIT Press: Cambridge, MA, USA, 1998. [Google Scholar]
  35. Han, M.; Kim, S. Local water independency ratio (LWIR) as an index to define the sustainability of major cities in Asia. Water Sci. Technol. Water Supply 2007, 7, 1–8. [Google Scholar] [CrossRef]
  36. Rygaard, M.; Binning, P.J.; Albrechtsen, H.-J. Increasing urban water self-sufficiency: New era, new challenges. J. Environ. Manag. 2011, 92, 185–194. [Google Scholar] [CrossRef] [Green Version]
Figure 1. Location map of Yeongjong Island with existing and planned water supply systems.
Sustainability 11 05964 g001
Figure 2. Conceptual layout of producing water from multi-sources.
Sustainability 11 05964 g002
Figure 3. Flow chart of research methodology.
Sustainability 11 05964 g003
Figure 4. Flow chart of a generalized reduced gradient algorithm.
Sustainability 11 05964 g004
Figure 5. Flow chart of a genetic algorithm.
Sustainability 11 05964 g005
Figure 6. Self-reliance of residential water demand for different scenarios.
Sustainability 11 05964 g006
Figure 7. Optimal withdrawal of water for scenario 1.
Sustainability 11 05964 g007
Figure 8. Optimal capital and, operation and maintenance costs of water production for scenario 1.
Sustainability 11 05964 g008
Figure 9. Optimal withdrawal of water for scenario 2.
Sustainability 11 05964 g009
Figure 10. Optimal capital and, operation and maintenance costs of water production for scenario 2.
Sustainability 11 05964 g010
Figure 11. Optimal withdrawal of water for scenario 3.
Sustainability 11 05964 g011
Figure 12. Optimal capital and, operation and maintenance costs of water production for scenario 3.
Sustainability 11 05964 g012
Figure 13. Optimal withdrawal of water for scenario 4.
Sustainability 11 05964 g013
Figure 14. Optimal capital and, operation and maintenance cost of water production for scenario 4.
Sustainability 11 05964 g014
Figure 15. Optimal domestic water supply from multi-sources, scenario 4.
Sustainability 11 05964 g015
Table 1. Available local water resources.
Type of Water SourceAvailable Amount of Water (103 m3/day)
Rain water20 (proposed)
Stream water43.78
Underground water18.7
Reservoir water0.76
Brackish water55.18
Sea water50 (proposed)
Recycled water121
Table 2. Predicted water demand for year 2025 of different water sectors.
Type of Water DemandPredicted Amount of Water Demand for Year 2025 (103 m3/day)
Residential (Domestic) 183
Industrial3.5
Agricultural28.25
Gardening/Road Cleaning4.0
Ecological 9.0
Table 3. Water sources available for various water users.
Water SourcesWater Users
DomesticAgriculturalIndustrialRoad WashingEcological
Rain water
Stream water
Underground water
Reservoir water
Brackish water
Sea water
Recycled water
Table 4. Water withdrawal scenarios.
TypeMulti-Water Sources
Rain WaterStream WaterGround WaterReservoir WaterBrackish WaterSea WaterRecycled Water
Scenario 1
Scenario 2
Scenario 3
Scenario 4