Carbon Footprints and Consumer Lifestyles: An Analysis of Lifestyle Factors and Gap Analysis by Consumer Segment in Japan

 ,
, 

Abstract
1. Introduction
2. Materials and Methods
2.1. Estimation of the Carbon Footprints of Japanese Households
2.2. Analyzing the Individual Determinants of High-Carbon Households by Regression Analysis
2.3. Analyzing the Lifestyle Factors Contributing to Carbon Footprints in Various Items by Factor Analysis
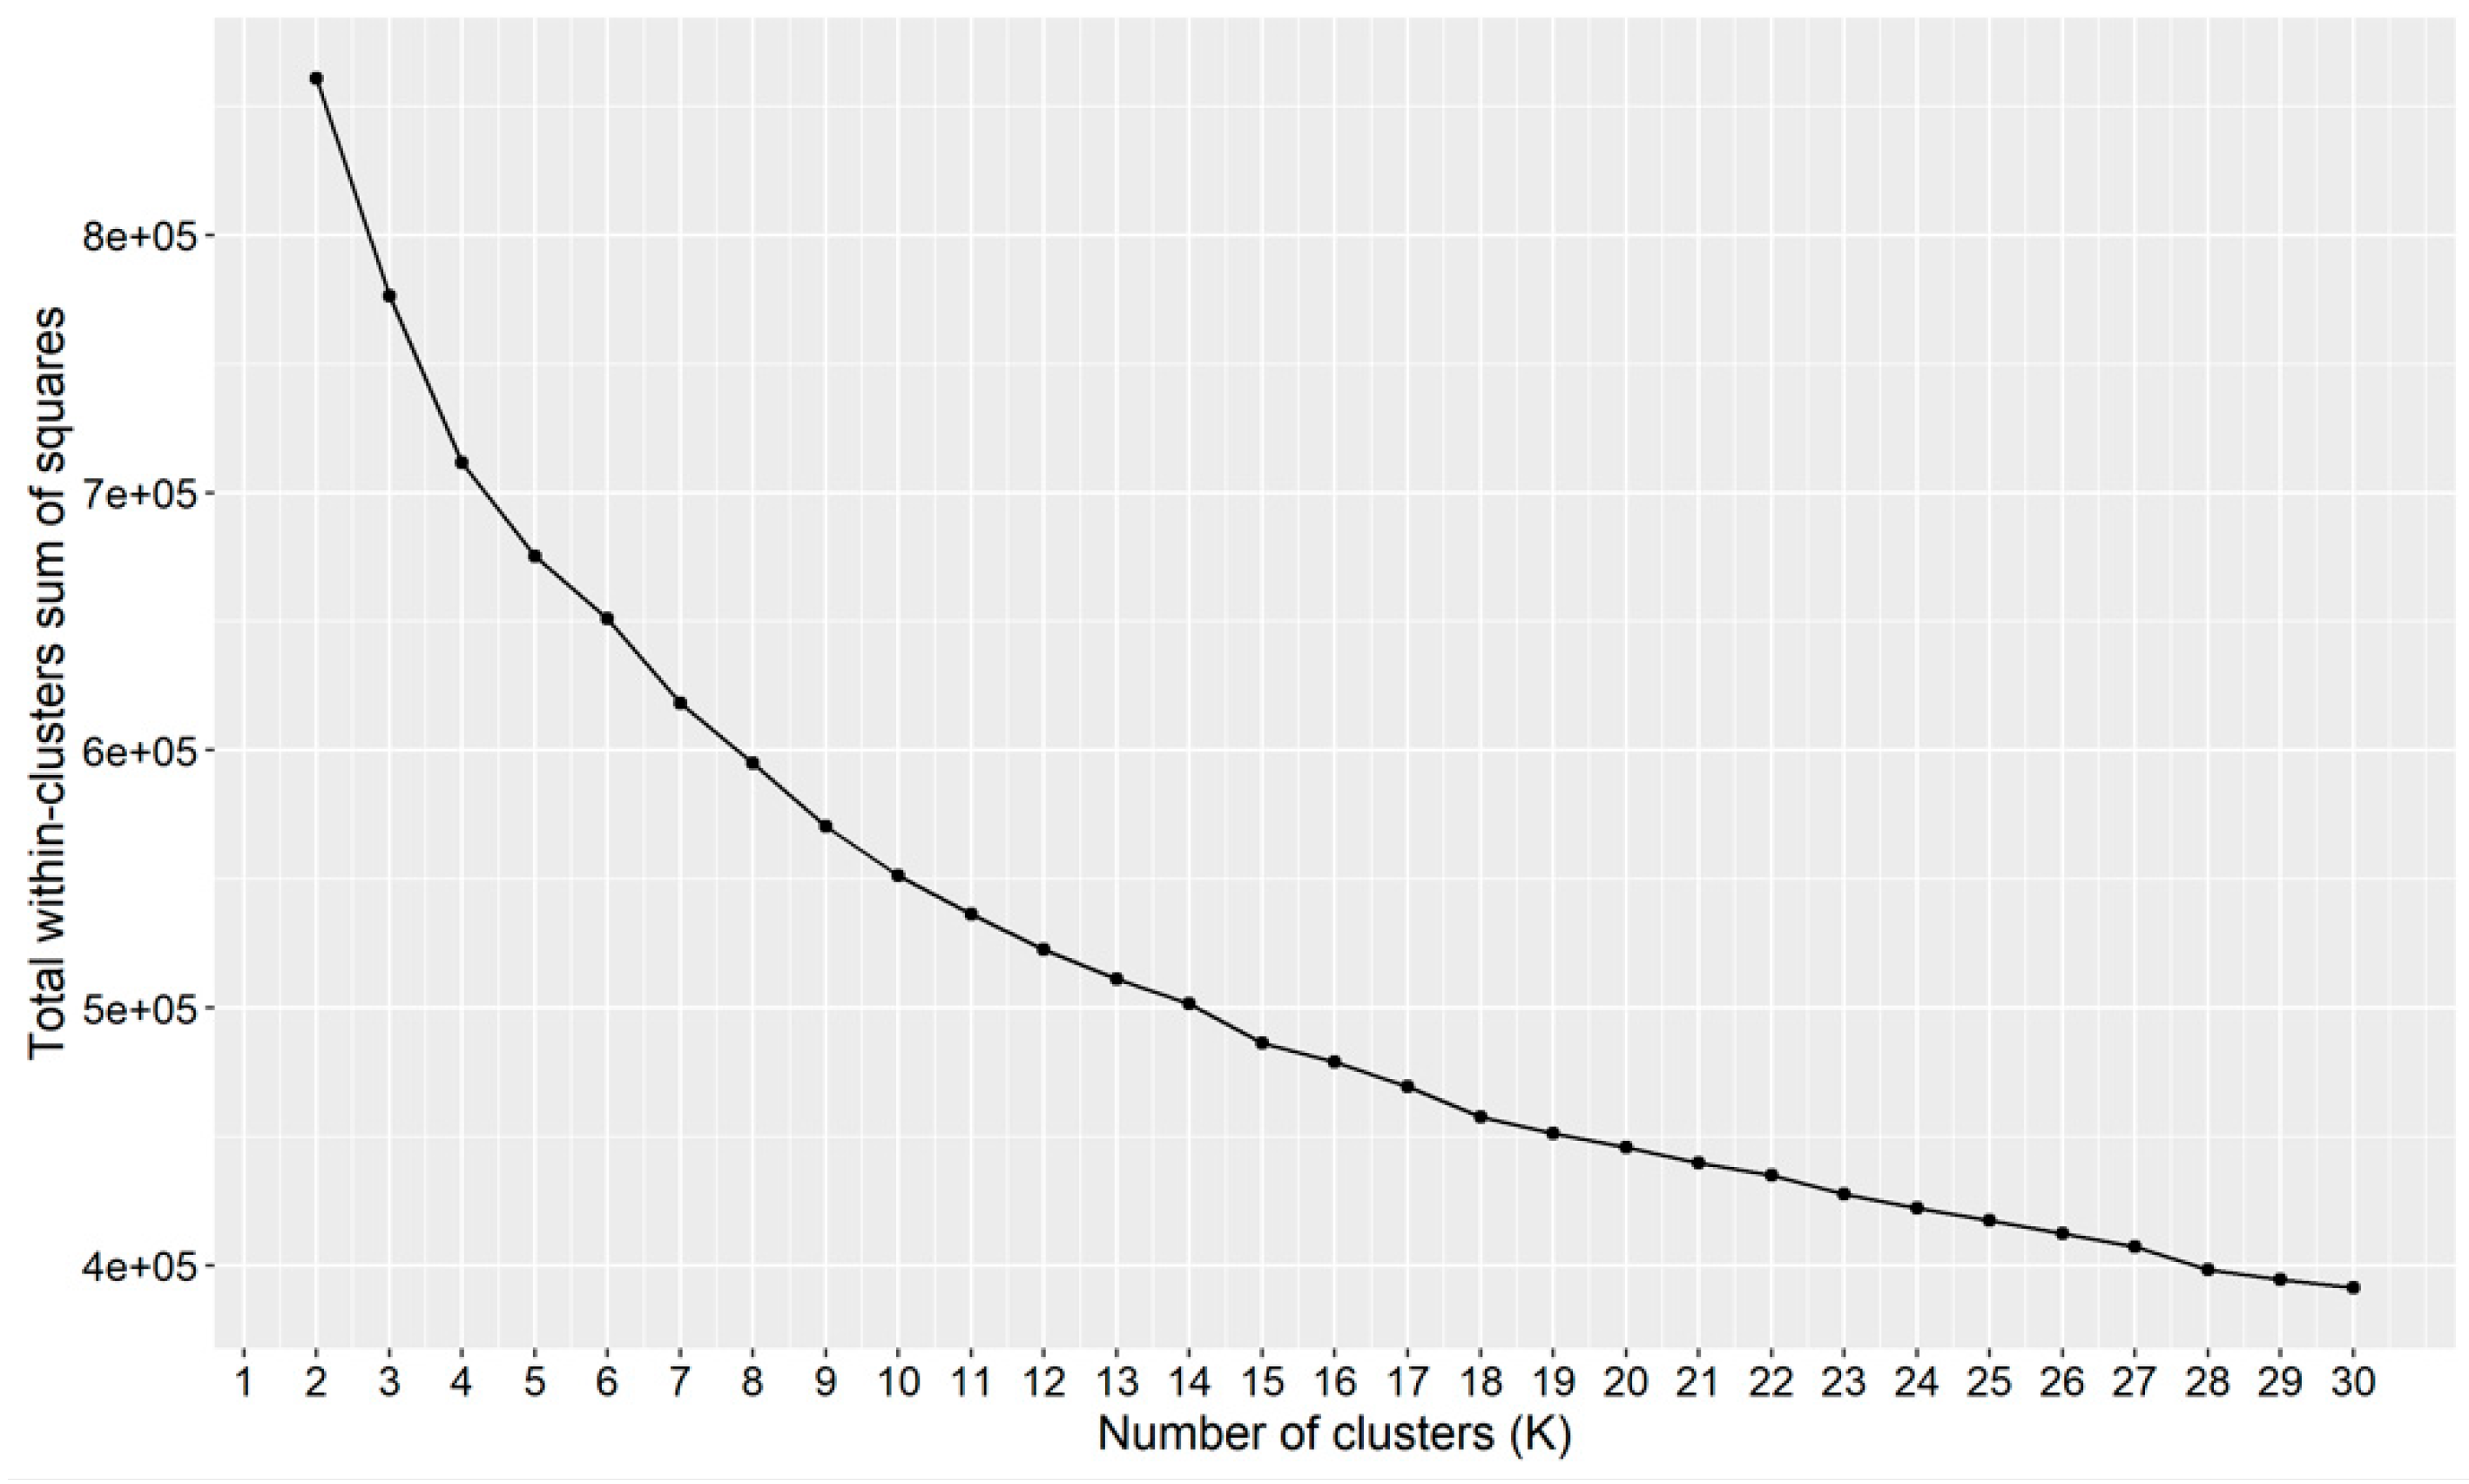
2.4. Identifying Consumer Segments by Cluster Analysis and Analyzing Gaps with Footprint Targets
3. Results and Discussion
3.1. The Estimated Carbon Footprints of Japanese Households
3.2. The Individual Determinants of High-Carbon Households in Japan
3.3. The Lifestyle Factors Contributing to Carbon Footprints in Various Consumption Items in Japan
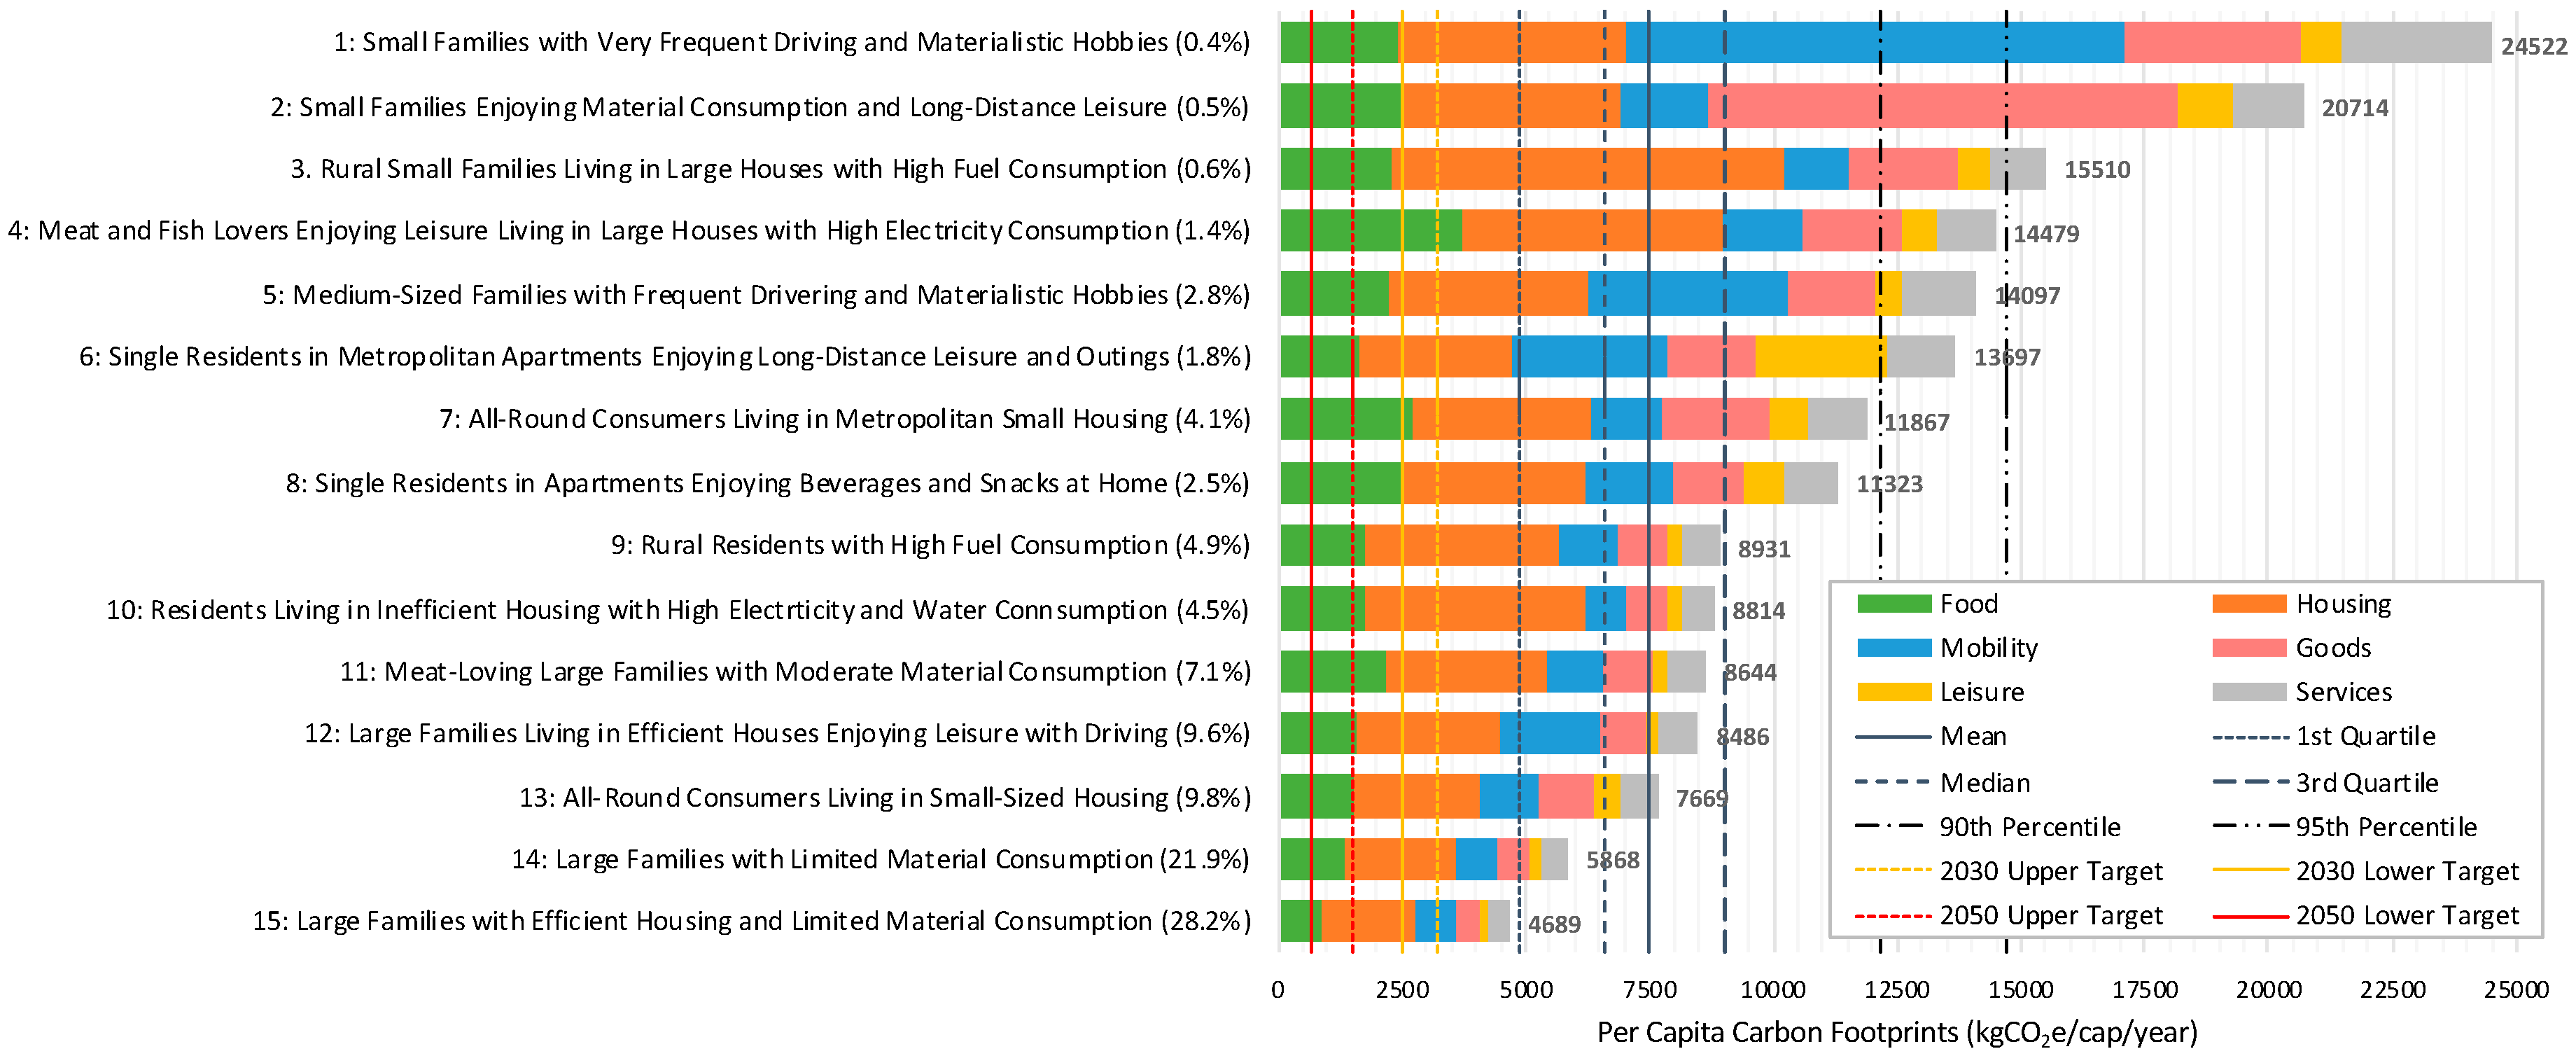
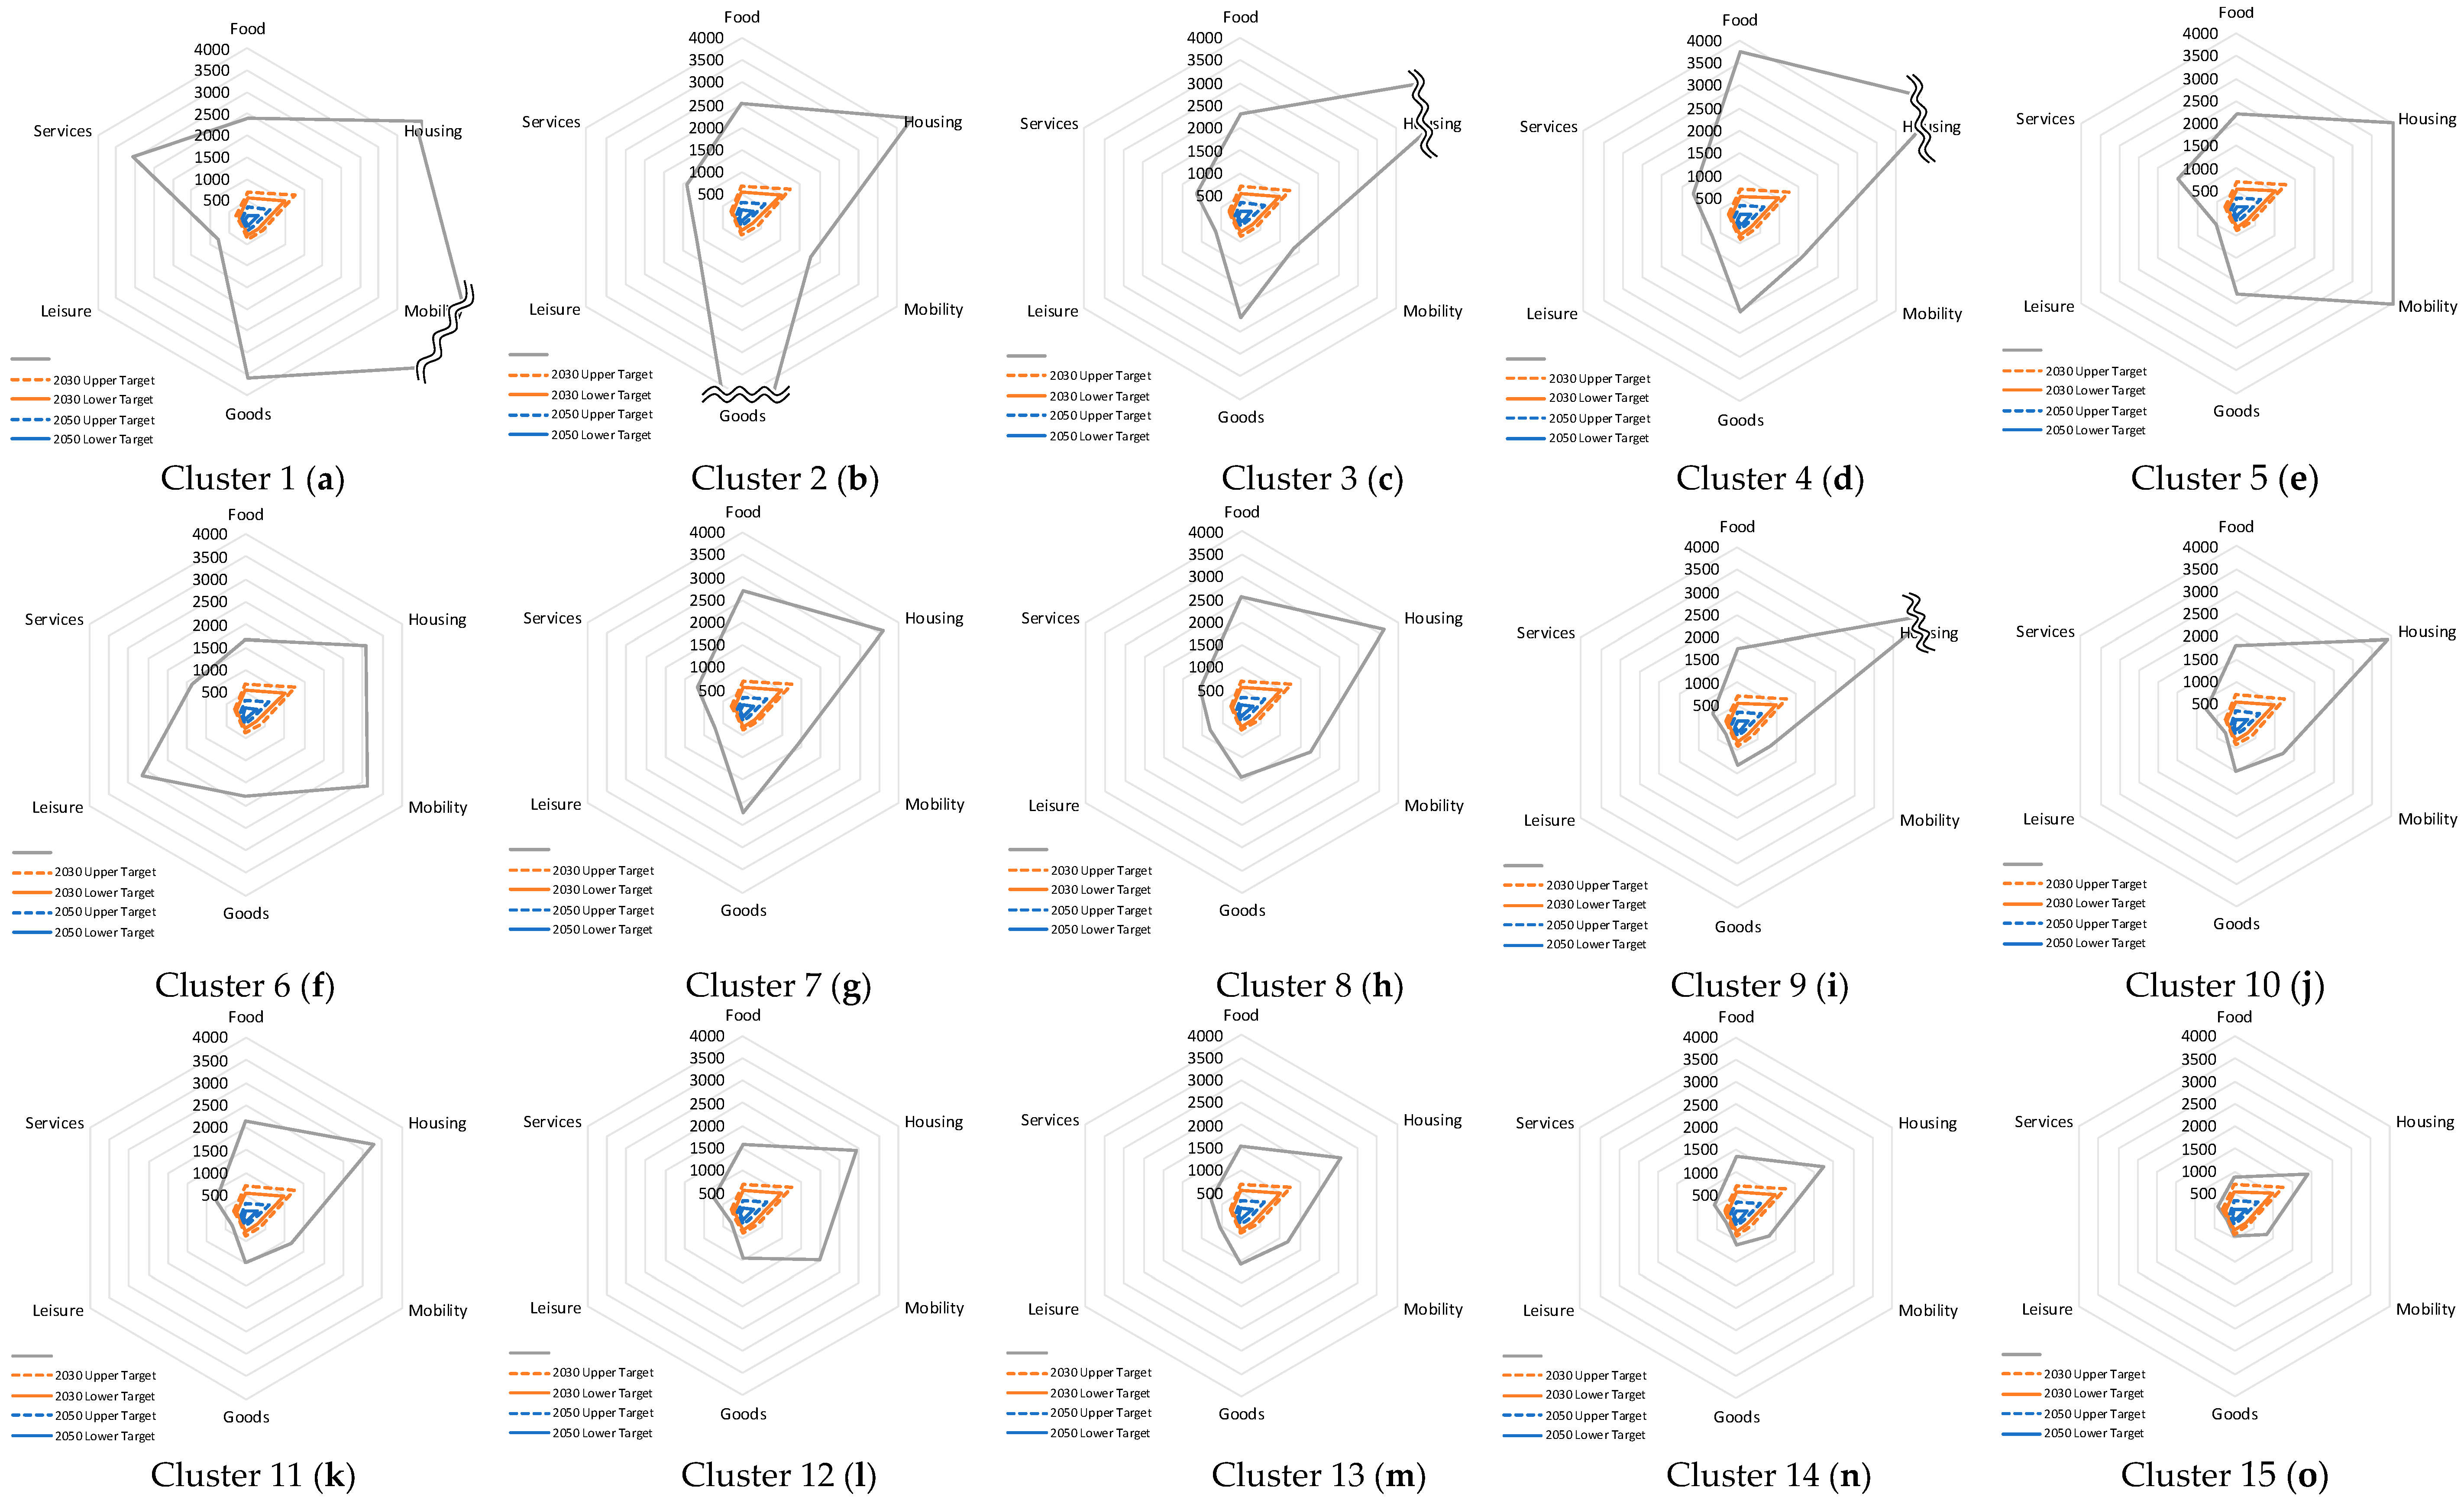
3.4. Consumer Segments of Japanese Households and Gaps with Footprint Targets by 2030 and 2050
4. Conclusions
Author Contributions
Funding
Acknowledgments
Conflicts of Interest
Appendix A

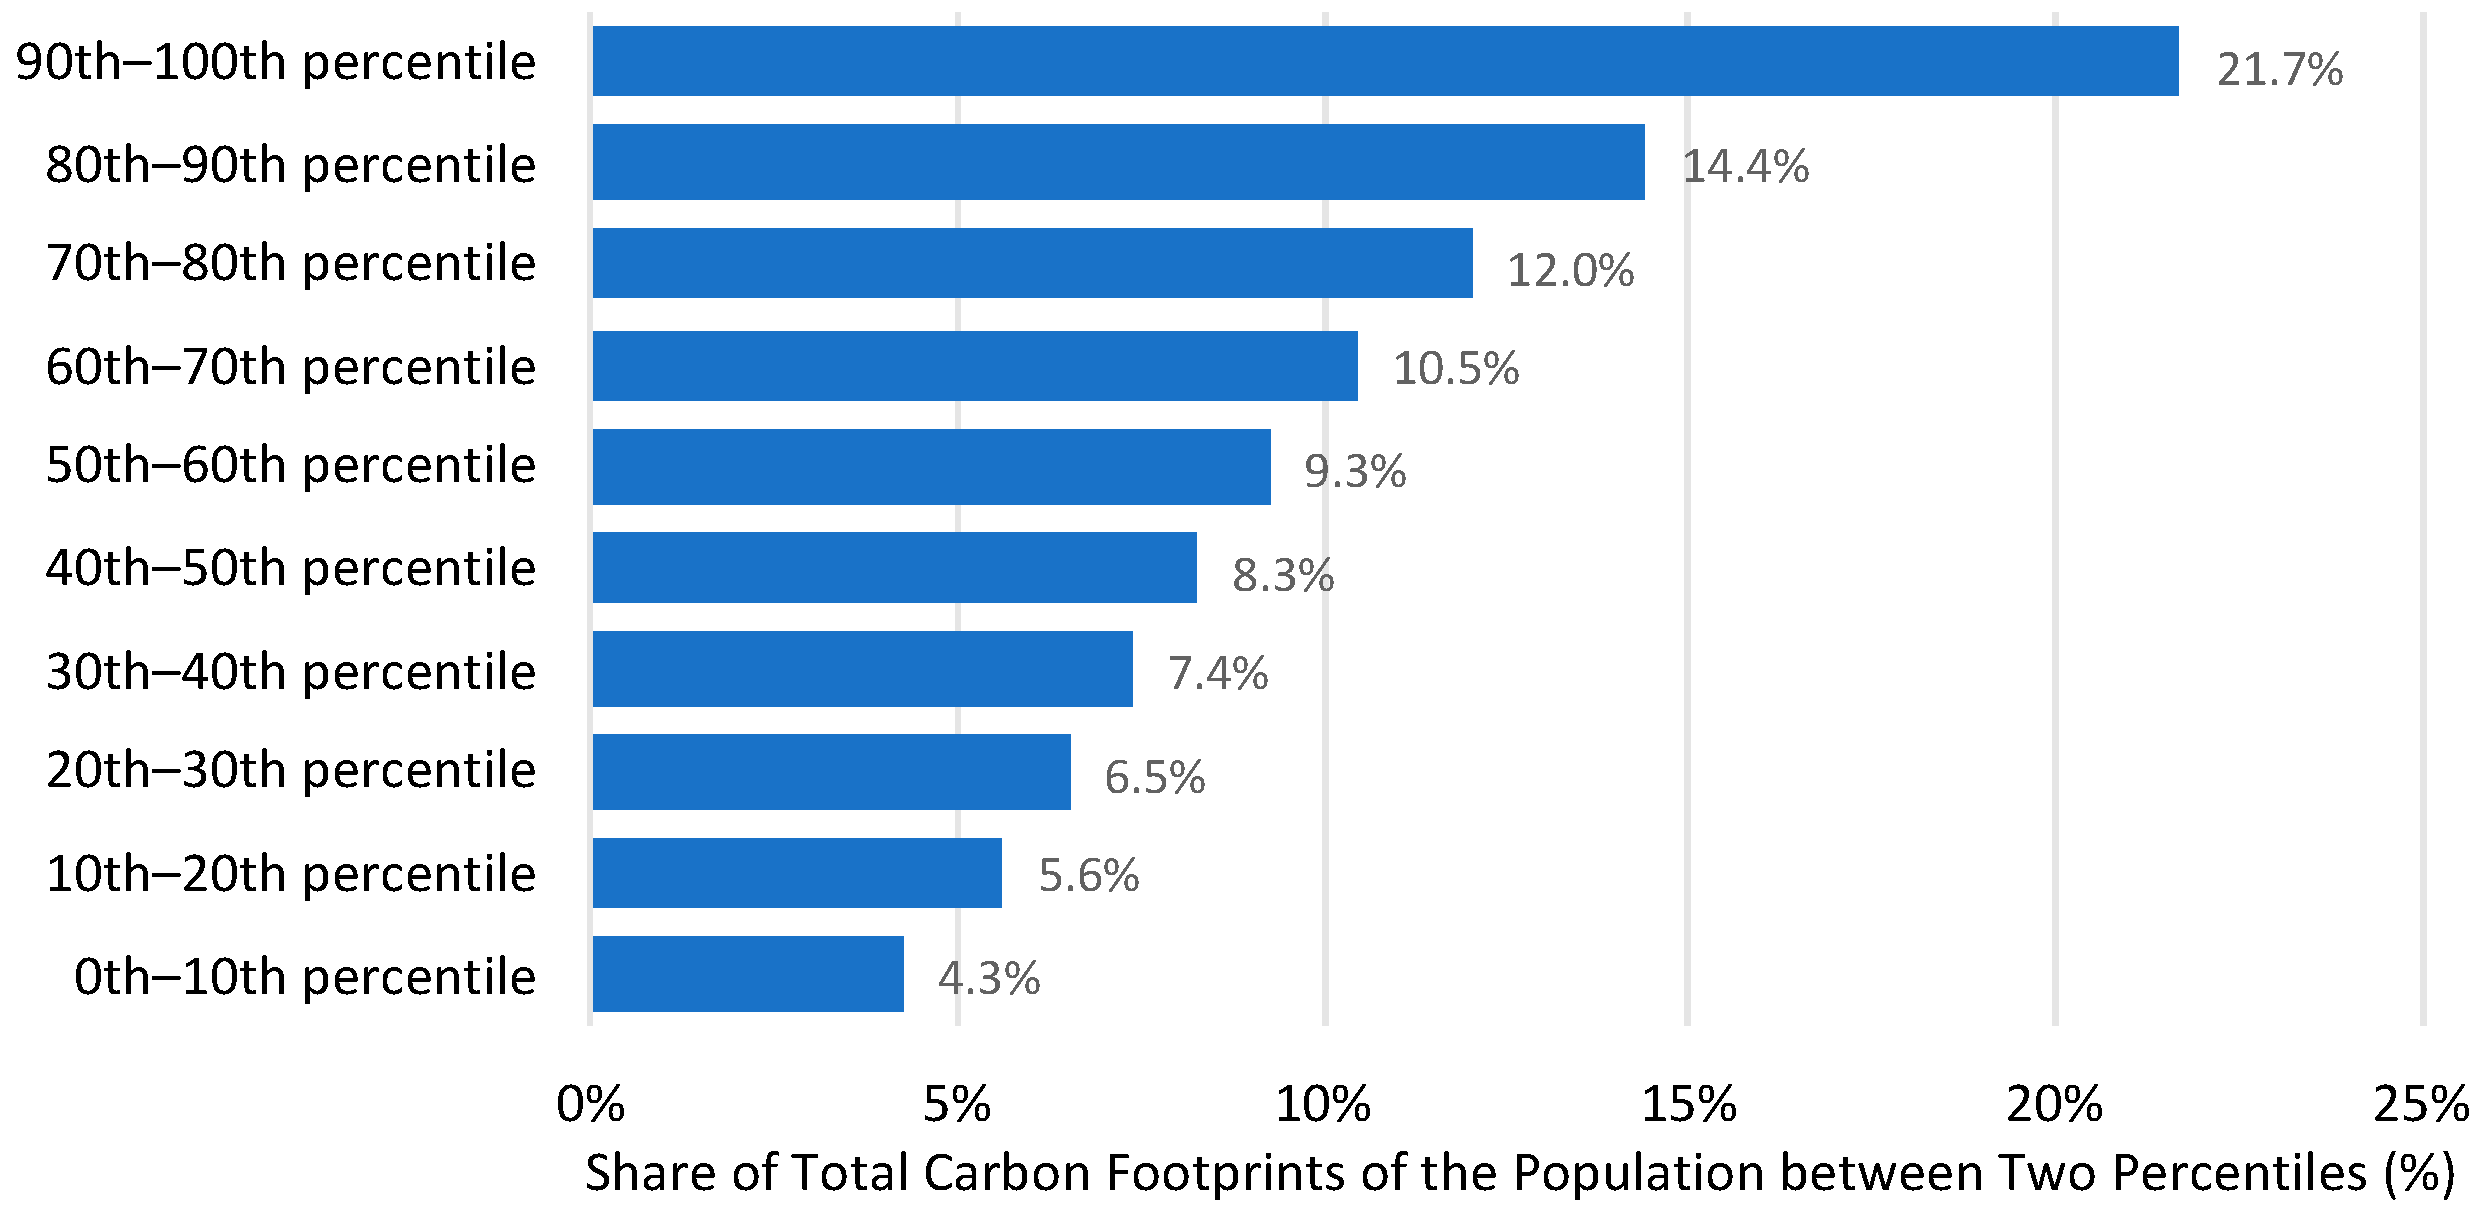
| Percentile | Break Footprint 1 | Mean Footprint 2 | Footprint Share % 3 | Accumulated % (Top) 4 | Accumulated % (Bottom) 5 |
|---|---|---|---|---|---|
| 100th percentile (Maximum) | 111,703 | ||||
| 16,300 | 21.7% | 21.7% | 100.0% | ||
| 90th percentile | 12,145 | ||||
| 10,843 | 14.4% | 36.1% | 78.3% | ||
| 80th percentile | 9812 | ||||
| 9037 | 12.0% | 48.2% | 63.9% | ||
| 70th percentile | 8363 | ||||
| 7859 | 10.5% | 58.6% | 51.8% | ||
| 60th percentile | 7376 | ||||
| 6960 | 9.3% | 67.9% | 41.4% | ||
| 50th percentile (Median) | 6570 | ||||
| 6223 | 8.3% | 76.2% | 32.1% | ||
| 40th percentile | 5879 | ||||
| 5551 | 7.4% | 83.6% | 23.8% | ||
| 30th percentile | 5237 | ||||
| 4907 | 6.5% | 90.1% | 16.4% | ||
| 20th percentile | 4572 | ||||
| 4225 | 5.6% | 95.7% | 9.9% | ||
| 10th percentile | 3835 | ||||
| 3203 | 4.3% | 100.0% | 4.3% | ||
| 0th percentile (Minimum) | 1049 | ||||
Appendix B
| Food | Housing | Mobility | Goods | Leisure | Services | |
|---|---|---|---|---|---|---|
| Footprints | 0.2306 *** (0.00051) | 0.4105 *** (0.00086) | 0.09613 *** (0.0012) | 0.1208 *** (0.00074) | 0.0526 *** (0.00040) | 0.0893 *** (0.00068) |
| (Square Term) | −3.485 × 10⁻⁶ *** (2.85 × 10⁻⁸) | −5.847 × 10⁻⁶ *** (4.80 × 10⁻⁸) | 7.755 × 10⁻⁶ *** (6.74 × 10⁻⁸) | 9.362 × 10⁻⁷ *** (4.12 × 10⁻⁸) | 5.722 × 10⁻⁸ ** (2.20 × 10⁻⁸) | 5.831 × 10⁻⁷ *** (3.76 × 10⁻⁸) |
| Adjusted R2 | 0.869 | 0.883 | 0.624 | 0.618 | 0.474 | 0.508 |
Appendix C

| Cluster | Factor 1 | Factor 2 | Factor 3 | Factor 4 | Factor 5 | Factor 6 | Factor 7 | Factor 8 | Income | Savings | Family Size | Member Under 18 | Member Over 65 | Member 18 to 64 | Age | House Size | Car | Motorbike | Refrigerator | Air Conditioner | TV | PC |
|---|---|---|---|---|---|---|---|---|---|---|---|---|---|---|---|---|---|---|---|---|---|---|
| 1 | 0.22 | 0.81 | −3.19 | 1.09 | 0.23 | 0.04 | 12.55 | 1.05 | 613 | 1579 | 1.5 | 0.0 | 0.5 | 1.0 | 55.5 | 107.4 | 1.2 | 0.3 | 1.4 | 2.2 | 2.0 | 0.9 |
| 2 | 0.11 | 1.30 | 3.61 | 11.46 | 0.98 | 1.40 | −0.41 | 0.84 | 579 | 1879 | 1.3 | 0.0 | 0.4 | 1.0 | 55.8 | 91.2 | 0.7 | 0.0 | 1.3 | 2.1 | 1.5 | 1.0 |
| 3 | 0.44 | 1.17 | 0.76 | 2.71 | 1.21 | 1.20 | 0.73 | 9.49 | 363 | 1515 | 1.3 | 0.0 | 0.7 | 0.5 | 55.9 | 101.5 | 0.5 | 0.1 | 1.1 | 1.0 | 1.5 | 0.7 |
| 4 | 2.75 | 2.69 | 0.11 | 1.06 | 3.62 | 1.73 | 2.58 | −5.57 | 668 | 2390 | 1.8 | 0.0 | 0.7 | 1.0 | 54.5 | 129.4 | 1.0 | 0.1 | 1.4 | 3.3 | 2.3 | 0.9 |
| 5 | 0.54 | 0.79 | −1.01 | 0.34 | 0.57 | 0.20 | 4.34 | 0.32 | 561 | 1724 | 1.8 | 0.1 | 0.6 | 1.1 | 55.0 | 118.4 | 1.3 | 0.2 | 1.3 | 2.3 | 2.0 | 0.9 |
| 6 | −0.95 | 0.34 | 7.31 | 1.04 | −0.49 | 1.70 | −1.10 | 1.24 | 566 | 1126 | 1.2 | 0.0 | 0.2 | 1.0 | 53.6 | 55.7 | 0.5 | 0.1 | 1.0 | 1.1 | 1.1 | 0.9 |
| 7 | 0.75 | 2.21 | 1.44 | 1.77 | 0.96 | 1.10 | 0.14 | −0.58 | 622 | 2133 | 1.8 | 0.1 | 0.7 | 1.1 | 55.0 | 104.1 | 0.8 | 0.1 | 1.2 | 2.5 | 1.8 | 0.8 |
| 8 | −0.37 | 0.71 | 1.06 | 0.91 | 0.43 | 5.59 | 0.87 | 0.83 | 484 | 939 | 1.3 | 0.0 | 0.3 | 1.0 | 56.0 | 70.6 | 0.7 | 0.2 | 1.0 | 1.3 | 1.4 | 0.7 |
| 9 | 0.40 | 0.28 | −0.19 | 0.23 | 0.18 | 0.01 | 0.15 | 3.07 | 381 | 1252 | 1.7 | 0.0 | 0.9 | 0.8 | 55.4 | 99.9 | 0.8 | 0.1 | 1.2 | 1.4 | 1.7 | 0.4 |
| 10 | 0.34 | 0.14 | −0.02 | −0.03 | 2.70 | 0.15 | −0.47 | 0.13 | 552 | 1319 | 2.3 | 0.2 | 0.8 | 1.3 | 54.3 | 115.1 | 1.0 | 0.2 | 1.3 | 2.4 | 2.1 | 0.8 |
| 11 | 0.89 | 0.62 | −0.35 | −0.13 | 1.06 | 0.17 | 0.65 | −2.84 | 740 | 1614 | 2.8 | 0.4 | 0.5 | 2.0 | 54.7 | 121.4 | 1.4 | 0.2 | 1.3 | 3.0 | 2.3 | 1.1 |
| 12 | 0.03 | −0.15 | −0.62 | −0.23 | −0.23 | −0.11 | 1.13 | 0.26 | 602 | 1354 | 2.6 | 0.3 | 0.7 | 1.6 | 54.1 | 116.2 | 1.5 | 0.2 | 1.3 | 2.2 | 2.1 | 0.9 |
| 13 | −0.59 | 0.13 | 1.23 | 0.45 | −0.34 | 0.52 | −0.97 | 0.91 | 544 | 1199 | 2.1 | 0.3 | 0.4 | 1.4 | 54.3 | 76.5 | 0.8 | 0.1 | 1.1 | 1.6 | 1.6 | 0.9 |
| 14 | −0.20 | −0.26 | −0.14 | −0.43 | −0.23 | −0.39 | −0.57 | −1.02 | 713 | 1123 | 3.8 | 1.1 | 0.4 | 2.3 | 54.4 | 111.6 | 1.5 | 0.2 | 1.2 | 2.5 | 2.2 | 1.1 |
| 15 | −0.72 | −0.93 | −0.16 | −0.54 | −0.96 | −0.72 | −0.90 | 0.63 | 556 | 787 | 3.7 | 1.2 | 0.4 | 2.1 | 54.2 | 99.8 | 1.4 | 0.2 | 1.2 | 1.7 | 1.9 | 0.9 |
| Cluster | Population Share | Household Share | Footprint Share | Single | Husband Wife | Child-Raising Family | Single Parent | Three Or More Generations | Other Household | Male | Female | One Full Time Only | Multiple Full-Time | One Full And Part-Time | Part-time Only | Seeking Job Only | Not In Labor Force Only | Metropolitan | Not Metropolitan | Detached | High Rise | Mid Rise | Other House |
|---|---|---|---|---|---|---|---|---|---|---|---|---|---|---|---|---|---|---|---|---|---|---|---|
| 1 | 0.4% | 0.6% | 1.2% | 57% | 32% | 4% | 1% | 1% | 6% | 78% | 22% | 58% | 9% | 4% | 3% | 1% | 26% | 49% | 51% | 68% | 8% | 10% | 14% |
| 2 | 0.5% | 0.9% | 1.3% | 74% | 18% | 4% | 2% | 0% | 2% | 29% | 71% | 57% | 10% | 1% | 6% | 1% | 25% | 63% | 37% | 53% | 22% | 20% | 5% |
| 3 | 0.6% | 1.1% | 1.2% | 78% | 16% | 2% | 1% | 1% | 2% | 47% | 53% | 28% | 4% | 1% | 6% | 2% | 59% | 24% | 76% | 71% | 5% | 3% | 21% |
| 4 | 1.4% | 2.0% | 2.7% | 41% | 41% | 11% | 2% | 1% | 4% | 77% | 23% | 39% | 17% | 3% | 4% | 5% | 32% | 60% | 40% | 83% | 9% | 4% | 4% |
| 5 | 2.8% | 4.1% | 5.3% | 44% | 35% | 12% | 2% | 3% | 5% | 77% | 23% | 36% | 18% | 5% | 4% | 3% | 34% | 40% | 60% | 79% | 5% | 10% | 6% |
| 6 | 1.8% | 4.0% | 3.3% | 83% | 13% | 2% | 0% | 0% | 1% | 77% | 23% | 79% | 5% | 2% | 2% | 0% | 12% | 72% | 28% | 21% | 18% | 33% | 28% |
| 7 | 4.1% | 5.9% | 6.5% | 39% | 41% | 12% | 3% | 1% | 4% | 64% | 36% | 38% | 14% | 5% | 5% | 1% | 37% | 68% | 32% | 67% | 15% | 11% | 7% |
| 8 | 2.5% | 4.9% | 3.7% | 75% | 17% | 4% | 1% | 0% | 1% | 78% | 22% | 63% | 6% | 2% | 4% | 1% | 24% | 54% | 46% | 39% | 13% | 20% | 27% |
| 9 | 4.9% | 7.4% | 5.8% | 49% | 34% | 8% | 2% | 3% | 5% | 62% | 38% | 27% | 10% | 4% | 6% | 2% | 51% | 30% | 70% | 70% | 3% | 10% | 17% |
| 10 | 4.5% | 5.2% | 5.2% | 27% | 35% | 22% | 4% | 6% | 6% | 74% | 26% | 34% | 21% | 7% | 6% | 2% | 31% | 49% | 51% | 79% | 6% | 8% | 6% |
| 11 | 7.1% | 6.6% | 8.2% | 10% | 30% | 40% | 5% | 9% | 7% | 87% | 13% | 32% | 34% | 13% | 4% | 1% | 16% | 57% | 43% | 81% | 7% | 6% | 6% |
| 12 | 9.6% | 9.8% | 10.9% | 20% | 30% | 27% | 4% | 10% | 9% | 86% | 14% | 33% | 29% | 10% | 4% | 2% | 22% | 41% | 59% | 80% | 5% | 8% | 7% |
| 13 | 9.8% | 12.1% | 10.0% | 39% | 24% | 26% | 3% | 4% | 4% | 73% | 27% | 46% | 18% | 8% | 5% | 2% | 21% | 60% | 40% | 44% | 12% | 21% | 24% |
| 14 | 21.9% | 15.2% | 17.1% | 3% | 10% | 63% | 4% | 17% | 4% | 92% | 8% | 35% | 35% | 20% | 3% | 1% | 6% | 54% | 46% | 73% | 10% | 11% | 6% |
| 15 | 28.2% | 20.2% | 17.6% | 8% | 9% | 56% | 5% | 17% | 4% | 88% | 12% | 40% | 30% | 16% | 4% | 2% | 8% | 44% | 56% | 63% | 8% | 16% | 13% |
References
- Wiedmann, T.; Minx, J. A Definition of ‘Carbon Footprint’. In Ecological Economics Research Trends; Pertsova, C.C., Ed.; Nova Science Publishers: Hauppauge, NY, USA, 2008; Chapter 1; pp. 1–11. [Google Scholar]
- Hertwich, E.G.; Peters, G.P. Carbon footprint of nations: A global, trade-linked analysis. Environ. Sci. Technol. 2009, 43, 6414–6420. [Google Scholar] [CrossRef] [PubMed]
- Ivanova, D.; Stadler, K.; Steen-Olsen, K.; Wood, R.; Vita, G.; Tukker, A.; Hertwich, E.G. Environmental Impact Assessment of Household Consumption. J. Ind. Ecol. 2016, 20, 526–536. [Google Scholar] [CrossRef]
- Hirano, Y.; Ihara, T.; Yoshida, Y. Estimating residential CO2 emissions based on daily activities and consideration of methods to reduce emissions. Build. Environ. 2016, 103, 1–8. [Google Scholar] [CrossRef]
- United Nations. United Nations Conference on Environment and Development: Agenda 21; United Nations Division for Sustainable Development: New York, NY, USA, 1992. [Google Scholar]
- United Nations. Transforming Our World: The 2030 Agenda for Sustainable Development; United Nations: New York, NY, USA, 2015. [Google Scholar]
- IPCC. Global Warming of 1.5 °C: An IPCC Special Report on the Impacts of Global Warming of 1.5 °C above Pre-Industrial Levels and Related Global Greenhouse Gas Emission Pathways, in the Context of Strengthening the Global Response to the Threat of Climate Change, Sustainable Development, and Efforets to Eradicate Poverty; The Intergovernmental Panel on Climate Change: Geneva, Switzerland, 2018. [Google Scholar]
- European Commission. A Clean Planet for all: A European Strategic Long-Term Vision for a Prosperous, Modern, Competitive and Climate Neutral Economy; European Commission: Brussels, Belgium, 2018. [Google Scholar]
- The Government of Japan. The Long-term Strategy under the Paris Agreement; The Government of Japan: Tokyo, Japan, 2019.
- Akenji, L.; Lettenmeier, M.; Koide, R.; Toivio, V.; Amellina, A. 1.5 Degree Lifestyles: Targets and Options for Reducing Lifestyle Carbon Footprints; Institute for Global Environmental Strategies: Hayama, Japan, 2019. [Google Scholar]
- Fang, K.; Dong, L.; Ren, J.; Zhang, Q.; Han, L.; Fu, H. Carbon footprints of urban transition: Tracking circular economy promotions in Guiyang, China. Ecol. Modell. 2017, 365, 30–44. [Google Scholar] [CrossRef]
- Akenji, L.; Chen, H. A Framework for Shaping Sustainable Lifestyles; United Nations Environment Programme: Nairobi, Kenya, 2016. [Google Scholar]
- Weber, C.; Perrels, A. Modelling lifestyle effects on energy demand and related emissions. Energy Policy 2000, 28, 549–566. [Google Scholar] [CrossRef]
- Bin, S.; Dowlatabadi, H. Consumer lifestyle approach to US energy use and the related CO2 emissions. Energy Policy 2005, 33, 197–208. [Google Scholar] [CrossRef]
- Druckman, A.; Jackson, T. The bare necessities: How much household carbon do we really need? Ecol. Econ. 2010, 69, 1794–1804. [Google Scholar] [CrossRef]
- Hirvilammi, T.; Laakso, S.; Lettenmeier, M.; Lähteenoja, S. Studying Well-being and its Environmental Impacts: A Case Study of Minimum Income Receivers in Finland. J. Hum. Dev. Capab. 2013, 14, 134–154. [Google Scholar] [CrossRef]
- Tukker, A.; Cohen, M.J.; Hubacek, K.; Mont, O. The Impacts of household consumption and options for change. J. Ind. Ecol. 2010, 14, 13–30. [Google Scholar] [CrossRef]
- Kerkhof, A.C.; Nonhebel, S.; Moll, H.C. Relating the environmental impact of consumption to household expenditures: An input-output analysis. Ecol. Econ. 2009, 68, 1160–1170. [Google Scholar] [CrossRef]
- Weber, C.L.; Matthews, H.S. Quantifying the global and distributional aspects of American household carbon footprint. Ecol. Econ. 2008, 66, 379–391. [Google Scholar] [CrossRef]
- Gill, B.; Moeller, S. GHG Emissions and the Rural-Urban Divide. A Carbon Footprint Analysis Based on the German Official Income and Expenditure Survey. Ecol. Econ. 2018, 145, 160–169. [Google Scholar] [CrossRef]
- Ala-Mantila, S.; Heinonen, J.; Junnila, S. Relationship between urbanization, direct and indirect greenhouse gas emissions, and expenditures: A multivariate analysis. Ecol. Econ. 2014, 104, 129–139. [Google Scholar] [CrossRef]
- Jones, C.; Kammen, D.M. Spatial distribution of U.S. household carbon footprints reveals suburbanization undermines greenhouse gas benefits of urban population density. Environ. Sci. Technol. 2014, 48, 895–902. [Google Scholar] [CrossRef] [PubMed]
- Büchs, M.; Schnepf, S.V. Who emits most? Associations between socio-economic factors and UK households’ home energy, transport, indirect and total CO2 emissions. Ecol. Econ. 2013, 90, 114–123. [Google Scholar] [CrossRef]
- Shigetomi, Y.; Nansai, K.; Kagawa, S.; Tohno, S. Changes in the carbon footprint of Japanese households in an aging society. Environ. Sci. Technol. 2014, 48, 6069–6080. [Google Scholar] [CrossRef] [PubMed]
- Lenzen, M.; Wier, M.; Cohen, C.; Hayami, H.; Pachauri, S.; Schaeffer, R. A comparative multivariate analysis of household energy requirements in Australia, Brazil, Denmark, India and Japan. Energy 2006, 31, 181–207. [Google Scholar] [CrossRef]
- Lettenmeier, M.; Hirvilammi, T.; Laakso, S.; Lähteenoja, S.; Aalto, K. Material Footprint of Low-Income Households in Finland-Consequences for the Sustainability Debate. Sustainability 2012, 4, 1426–1447. [Google Scholar] [CrossRef]
- Stewart, D.W. The Application and Misapplication of Factor Analysis in Marketing Research. J. Mark. Res. 1981, 18, 51–62. [Google Scholar] [CrossRef]
- Tewathia, N. Consumption Behaviour and Conservation of Household Electricity in Delhi: A Factor Analysis Approach. Asian Bull. Energy Econ. Technol. 2018, 4, 22–35. [Google Scholar] [CrossRef]
- Oskamp, S.; Harrington, M.J.; Okuda, S.M.; Edwards, T.C.; Sherwood, D.L.; Swanson, D.C. Factors influencing household recycling behavior. Environ. Behav. 1991, 23, 494–519. [Google Scholar] [CrossRef]
- Árnadóttir, Á.; Czepkiewicz, M.; Heinonen, J. The geographical distribution and correlates of pro-environmental attitudes and behaviors in an urban region. Energies 2019, 12, 1540. [Google Scholar] [CrossRef]
- Dolničar, S. Using cluster analysis for market segmentation—Typical misconceptions, established methodological weaknesses and some recommendations for improvement. Australas. J. Mark. Res. 2003, 11, 5–12. [Google Scholar]
- Baiocchi, G.; Minx, J.; Hubacek, K. The Impact of social factors and consumer behavior on carbon dioxide emissions in the United Kingdom. J. Ind. Ecol. 2010, 14, 50–72. [Google Scholar] [CrossRef]
- Froemelt, A.; Dürrenmatt, D.J.; Hellweg, S. Using Data Mining to Assess Environmental Impacts of Household Consumption Behaviors. Environ. Sci. Technol. 2018, 52, 8467–8478. [Google Scholar] [CrossRef]
- Veeramani, A.; Dias, G.M.; Kirkpatrick, S.I. Carbon footprint of dietary patterns in Ontario, Canada: A case study based on actual food consumption. J. Clean. Prod. 2017, 162, 1398–1406. [Google Scholar] [CrossRef]
- Vetoné Mózner, Z. Sustainability and consumption structure: Environmental impacts of food consumption clusters. A case study for Hungary. Int. J. Consum. Stud. 2014, 38, 529–539. [Google Scholar] [CrossRef]
- Teubler, J.; Buhl, J.; Lettenmeier, M.; Greiff, K.; Liedtke, C. A Household’s Burden—The Embodied Resource Use of Household Equipment in Germany. Ecol. Econ. 2018, 146, 96–105. [Google Scholar] [CrossRef]
- Anand, S.; Padmanabham, P.; Govardhan, A. Application of Factor Analysis to k-means Clustering Algorithm on Transportation Data. Int. J. Comput. Appl. 2014, 95, 40–46. [Google Scholar] [CrossRef]
- Desai, P. Creating Low Carbon Communities: One Planet Living Solutions. Globalizations 2008, 5, 67–71. [Google Scholar] [CrossRef]
- Nykvist, B.; Persson, Å.; Moberg, F.; Persson, L.; Cornell, S.; Rockström, J. National Environmental Performance on Planetary Boundaries: A study for the Swedish Environment Protection Agency; The Swedish Environmental Protection Agency: Stockholm, Sweden, 2013; ISBN 9789162065768. [Google Scholar]
- Ihara, T.; Ohashi, T.; Dowaki, K.; Kudoh, Y. Analysis and evaluation of CO2 emissions from consumers’ daily lives (Shouhisha No Seikatsu Koudou Ni Tomonau CO2 Haishutsu No Bunseki To hyouka) [In Japanese]. In Proceedings of the Abstracts for the 4th Meeting of the Institute of Life Cycle Assessment Japan, Kitakyushu, Japan, March 2009; pp. 256–257. [Google Scholar]
- Ministry of Internal Affairs and Communications, Japan. National Survey of Family Income and Expenditure 2004 (Heisei 16 Nen Zenkoku Shouhi Jittai Chousa); Ministry of Internal Affairs and Communications: Tokyo, Japan, 2004.
- Nansai, K.; Kondo, Y.; Kagawa, S.; Suh, S.; Nakajima, K.; Inaba, R.; Tohno, S. Estimates of embodied global energy and air-emission intensities of japanese products for building a Japanese input-output life cycle assessment database with a global system boundary. Environ. Sci. Technol. 2012, 46, 9146–9154. [Google Scholar] [CrossRef]
- National Institute for Environmental Studies. Embodied Energy and Emission Intensity Data for Japan Using Input-Output Tables (3EID); National Institute for Environmental Studies: Tsukuba, Japan, 2005. [Google Scholar]
- Ministry of Internal Affairs and Communications, Japan. Input-Output Tables for Japan 2005 (Heisei 17 Nen Sangyou Renkan Hyou); Ministry of Internal Affairs and Communications: Tokyo, Japan, 2009.
- Ihara, T.; Motose, R.; Kudoh, Y. Consideration of Analysis on CO2 Emissions From Household Expenditure with Input-Output Tables (Sangyou Renkan Hyou Wo Mochiita Kakei Shouhi Sishutsu Ni Tomonau CO2 Haishutsu Kaiseki No Kousatsu) [in Japanese]. In Proceedings of the 37th Annual Meeting of Environmental Systems Research, Tokyo, Japan, October 2009; pp. 267–273. [Google Scholar]
- Ministry of Internal Affairs and Communications. Family Income and Expenditure Survey 2004–2005 (Heise 16-17 Nen Kakei Chousa); Ministry of Internal Affairs and Communications: Tokyo, Japan, 2004–2005.
- Horn, J.L. A rationale and test for the number of factors in factor analysis. Psychometrika 1965, 30, 179–185. [Google Scholar] [CrossRef]
- Moran, D.; Wood, R. Convergence Between the Eora, Wiod, Exiobase, and Openeu’S Consumption-Based Carbon Accounts. Econ. Syst. Res. 2014, 26, 245–261. [Google Scholar] [CrossRef]
- Jalas, M.; Juntunen, J.K. Energy intensive lifestyles: Time use, the activity patterns of consumers, and related energy demands in Finland. Ecol. Econ. 2015, 113, 51–59. [Google Scholar] [CrossRef]
- Buhl, J.; Acosta, J. Work less, do less?: Working time reductions and rebound effects. Sustain. Sci. 2016, 11, 261–276. [Google Scholar] [CrossRef]
- Nässén, J.; Larsson, J. Would shorter working time reduce greenhouse gas emissions? An analysis of time use and consumption in Swedish households. Environ. Plan. C Gov. Policy 2015, 33, 726–745. [Google Scholar] [CrossRef]
- Koide, R.; Akenji, L. Assessment of Policy Integration of Sustainable Consumption and Production into National Policies. Resources 2017, 6, 48. [Google Scholar] [CrossRef]


| Mean | Standard Deviation | Minimum | 1st Quartile | Median | 3rd Quartile | Maximum | ||
|---|---|---|---|---|---|---|---|---|
| Per Household 1 | Total | 19,622 | 10,758 | 1396 | 12,146 | 17,922 | 24,736 | 209,437 |
| Food | 3990 | 2323 | 366 | 2204 | 3655 | 5317 | 33,776 | |
| Housing | 7160 | 3803 | 545 | 4393 | 6530 | 9100 | 58,827 | |
| Mobility | 3277 | 5263 | 0 | 437 | 1944 | 4383 | 128,585 | |
| Goods | 2403 | 2511 | 53 | 916 | 1739 | 3047 | 65,958 | |
| Leisure | 967 | 1068 | 0 | 266 | 677 | 1300 | 21,295 | |
| Services | 1826 | 2465 | 85 | 801 | 1323 | 2142 | 104,863 | |
| Per Capita 2 | Total | 7511 | 4026 | 1049 | 4907 | 6570 | 9007 | 111,703 |
| Food | 1527 | 776 | 366 | 983 | 1371 | 1891 | 12,882 | |
| Housing | 2741 | 1362 | 545 | 1848 | 2462 | 3318 | 29,414 | |
| Mobility | 1254 | 2036 | 0 | 254 | 784 | 1560 | 91,583 | |
| Goods | 920 | 1125 | 53 | 349 | 612 | 1100 | 52,934 | |
| Leisure | 370 | 547 | 0 | 100 | 214 | 416 | 10,224 | |
| Services | 699 | 934 | 85 | 329 | 514 | 802 | 52,431 |
| Mean | Standard Deviation | Minimum | 1st Quartile | Median | 3rd Quartile | Maximum | |
|---|---|---|---|---|---|---|---|
| Income 1 | 584 | 384 | 1 | 319 | 500 | 753 | 2500 |
| Savings 2 | 1254 | 1628 | 0 | 200 | 670 | 1621 | 9500 |
| Family size 3 | 2.6 | 1.4 | 1 | 1 | 2 | 4 | 7 |
| Members under 18 4 | 0.5 | 0.9 | 0 | 0 | 0 | 1 | 5 |
| Members over 65 5 | 0.5 | 0.7 | 0 | 0 | 0 | 1 | 4 |
| Members 18 to 64 6 | 1.6 | 1.1 | 0 | 1 | 2 | 2 | 7 |
| Age 7 | 54.5 | 15.8 | 18 | 43 | 58 | 68 | 88 |
| House size 8 | 101.0 | 51.8 | 7 | 60 | 97 | 137 | 200 |
| Car 9 | 1.2 | 1.0 | 0 | 0 | 1 | 2 | 5 |
| Motorbike 10 | 0.2 | 0.5 | 0 | 0 | 0 | 0 | 5 |
| Refrigerator 10 | 1.2 | 0.5 | 0 | 1 | 1 | 1 | 8 |
| Air Conditioner 10 | 2.0 | 1.7 | 0 | 1 | 2 | 3 | 11 |
| TV 10 | 1.9 | 1.2 | 0 | 1 | 2 | 3 | 11 |
| PC 10 | 0.9 | 0.9 | 0 | 0 | 1 | 1 | 9 |
| Variables | Categories | % | Variables | Categories | % |
|---|---|---|---|---|---|
| Household type | Single 1 | 28.2% | Employment | One full-time only 8 | 40.1% |
| Husband and wife 2 | 22.0% | Multiple full-time 9 | 23.1% | ||
| Child-raising family 3 | 32.8% | One full- and part-time 10 | 10.5% | ||
| Single parent 4 | 3.6% | Part-time only 11 | 4.2% | ||
| Three or more generations 5 | 8.7% | Seeking job only 12 | 1.6% | ||
| Other household | 4.6% | Not in labor force only 13 | 20.5% | ||
| Sex 6 | Male | 79.7% | House type | Detached 14 | 64.9% |
| Female | 20.3% | High rise 15 | 9.1% | ||
| Metropolitan 7 | Metropolitan | 50.4% | Mid rise 16 | 13.4% | |
| Non-metropolitan | 49.6% | Other house | 12.6% |
| Model 1 | Model 2 | Model 3 | Model 4 | Model 5 | Model 6 | Model 7 | |
|---|---|---|---|---|---|---|---|
| (Intercept) | 11,100 *** (40.5) | 8821 *** (216) | 8969 *** (217) | 7941 *** (220) | 7800 *** (224) | 7346 *** (230) | 7132 *** (223) |
| Income 1 | 3.81 *** (0.056) | 3.74 *** (0.059) | 3.77 *** (0.059) | 3.51 *** (0.059) | 3.24 *** (0.060) | 3.31 *** (0.063) | 3.06 *** (0.063) |
| Saving 2 | 0.290 *** (0.012) | 0.335 *** (0.012) | 0.340 *** (0.012) | 0.260 *** (0.012) | 0.267 *** (0.012) | 0.266 *** (0.013) | 0.217 *** (0.012) |
| Family Size | −1925 *** (14.2) | ||||||
| (Base case: Husband and wife) | |||||||
| Single | 1281 *** (72.7) | 1309 *** (72.7) | 1613 *** (72.8) | 1639 *** (74.5) | 1635 *** (74.9) | 1620 *** (72.0) | |
| Child-raising Family | −2031 *** (76.3) | −2008 *** (76.2) | −1945 *** (75.4) | −1966 *** (77.0) | −2012 *** (77.5) | −2007 *** (74.7) | |
| Single Parent | −1709 *** (116) | −1680 *** (116) | −1488 *** (115) | −1600 *** (118) | −1622 *** (119) | −1622 *** (114) | |
| Three Or More Generation | −1529 *** (127) | −1556 *** (127) | −1640 *** (125) | −1897 *** (129) | −2027 *** (130) | −2086 *** (125) | |
| Other Household | −1301 *** (98.3) | −1330 *** (98.2) | −1395 *** (97.2) | −1463 *** (99.5) | −1624 *** (101.3) | −1651 *** (97.2) | |
| Member Under 18 | −1250 *** (32.2) | −1257 *** (32.2) | −1312 *** (31.9) | −1344 *** (32.5) | −1365 *** (32.6) | −1377 *** (31.4) | |
| Member Over 65 | −1514 *** (48.1) | −1523 *** (48.0) | −1830 *** (48.6) | −1905 *** (49.7) | −1737 *** (52.2) | −1726 *** (50.6) | |
| Member 18 to 64 | −1049 *** (41.7) | −1053 *** (41.7) | −1196 *** (41.5) | −1443 *** (43.4) | −1305 *** (44.4) | −1400 *** (43.0) | |
| (Base case: Male) | |||||||
| Female | −120.0 * (58.2) | −141.2 * (58.2) | −272.9 *** (57.8) | −62.8 (59.8) | 44.9 (60.7) | 30.1 (58.3) | |
| Age | 35.2 *** (7.57) | 34.9 *** (7.56) | 37.2 *** (7.48) | 36.2 *** (7.62) | 36.1 *** (7.60) | 32.4 *** (7.33) | |
| (Square term) | −0.316 *** (0.070) | −0.313 *** (0.070) | −0.334 *** (0.070) | −0.315 *** (0.071) | −0.313 *** (0.071) | −0.292 *** (0.068) | |
| (Base case: Non-Metropolitan) | |||||||
| Metropolitan | −318.1 *** (35.7) | −42.49 (36.5) | 228.1 *** (38.5) | 193 *** (38.5) | −48.08 (38.4) | ||
| House Size 3 | 12.86 *** (0.51) | 10.36 *** (0.53) | 10.77 *** (0.53) | 7.792 *** (0.52) | |||
| (Base case: Other House) | |||||||
| High-rise | 288.4 *** (77.5) | 472.2 *** (80.0) | 471.1 *** (79.9) | 408.6 *** (76.3) | |||
| Mid-rise | −117 # (68.9) | −45.41 (70.5) | −41.08 (70.3) | −19.08 (67.5) | |||
| Detached | 163.5 * (66.1) | 150.2 * (67.5) | 186.3 ** (67.9) | 89.21 (65.7) | |||
| Car | 706.3 *** (25.5) | 725.5 *** (25.8) | 646.3 *** (24.9) | ||||
| Motorbike | 142.7 *** (39.9) | 152 *** (39.9) | 16.82 (38.5) | ||||
| (Base case: Not in Labor Force Only) | |||||||
| One Full Time Only | 369.1 *** (63.1) | 385.5 *** (60.5) | |||||
| Multiple Full-time | −443.7 *** (80.7) | −408.9 *** (77.3) | |||||
| One Full- and Part-time | 193.3 * (86.3) | 210.2 * (83.0) | |||||
| Part-time Only | −113.8 (99.5) | −102.9 (95.8) | |||||
| Seeking Job Only | −231.3 (151.8) | −369.5 ** (143.0) | |||||
| Refrigerator | 358.3 *** (35.9) | ||||||
| Air Conditioner | 219.6 *** (13.1) | ||||||
| TV | 48.88 ** (18.3) | ||||||
| PC | 359.7 *** (21.1) | ||||||
| Adjusted R2 | 0.302 | 0.325 | 0.327 | 0.342 | 0.358 | 0.362 | 0.369 |
| Domain | Component | F1 | F2 | F3 | F4 | F5 | F6 | F7 | F8 |
|---|---|---|---|---|---|---|---|---|---|
| Food | Cereals and Others | 0.09 | 0.41 | −0.11 | −0.07 | −0.01 | 0.02 | 0.15 | 0.04 |
| Vegetables and Fruits | 0.42 | 0.54 | −0.01 | 0.03 | 0.03 | −0.09 | −0.02 | 0.14 | |
| Dairy and Eggs | −0.07 | 0.58 | −0.08 | 0.03 | 0.03 | 0.04 | −0.07 | −0.04 | |
| Fish | 0.89 | −0.06 | 0.04 | 0.02 | −0.01 | 0.07 | −0.01 | 0.05 | |
| Meat | 0.32 | 0.11 | −0.02 | 0.04 | 0.07 | −0.01 | −0.01 | −0.29 | |
| Cooked Food | −0.05 | 0.13 | 0.14 | 0.13 | 0.03 | 0.30 | 0.12 | −0.04 | |
| Beverages | 0.05 | −0.02 | 0.03 | −0.03 | −0.02 | 0.66 | 0.08 | 0.02 | |
| Housing | Space | −0.02 | 0.00 | 0.04 | 0.14 | 0.02 | 0.05 | −0.02 | 0.12 |
| Electricity | 0.00 | −0.02 | 0.02 | 0.06 | 0.47 | −0.02 | 0.21 | −0.01 | |
| Fuel | 0.09 | 0.04 | −0.01 | −0.03 | 0.32 | 0.03 | 0.07 | 0.32 | |
| Water | −0.04 | 0.00 | 0.03 | −0.02 | 0.65 | −0.02 | −0.09 | 0.09 | |
| Mobility | Public Transport | 0.04 | 0.15 | 0.41 | −0.01 | −0.05 | −0.04 | 0.02 | 0.02 |
| Automobile | −0.03 | −0.11 | 0.12 | −0.02 | −0.05 | 0.02 | 0.33 | 0.00 | |
| Flights | 0.02 | 0.05 | 0.23 | −0.06 | 0.00 | −0.07 | 0.07 | 0.03 | |
| Goods | Clothes | 0.02 | −0.05 | 0.19 | 0.41 | 0.03 | −0.09 | 0.08 | −0.09 |
| Daily Necessities | −0.02 | 0.11 | −0.04 | 0.40 | 0.04 | 0.04 | −0.07 | 0.01 | |
| Furniture and Others | 0.02 | −0.05 | −0.12 | 0.54 | −0.04 | −0.03 | 0.05 | −0.02 | |
| Home Appliances | 0.07 | −0.03 | −0.08 | 0.27 | −0.03 | −0.01 | 0.01 | 0.07 | |
| Electronics | −0.06 | −0.01 | 0.09 | 0.10 | −0.07 | 0.01 | 0.15 | −0.03 | |
| Hobby | −0.01 | 0.08 | 0.04 | 0.13 | −0.02 | −0.03 | 0.37 | 0.06 | |
| Leisure | - | 0.02 | −0.13 | 0.69 | −0.03 | 0.04 | 0.04 | 0.32 | 0.00 |
| Services | - | −0.05 | 0.09 | 0.15 | 0.07 | 0.00 | 0.00 | 0.20 | 0.01 |
| SS loadings | 1.11 | 0.913 | 0.850 | 0.774 | 0.766 | 0.568 | 0.529 | 0.253 | |
| Cumulative Var | 0.05 | 0.092 | 0.131 | 0.166 | 0.201 | 0.226 | 0.25 | 0.262 | |
| Description of Lifestyle Factor | Coefficient (Standard Deviation) 1 | |
|---|---|---|
| (Intercept) | - | 7810 *** (10.51) |
| Factor 1 | Meat- and Fish-rich Diets | 323 *** (9.20) |
| Factor 2 | Lacto-Vegetarian Diets and Essentials | 150 *** (7.87) |
| Factor 3 | Long-Distance Leisure and Outings | 972 *** (5.62) |
| Factor 4 | Material Consumption at Home | 803 *** (6.31) |
| Factor 5 | Home Utilities | 720 *** (7.52) |
| Factor 6 | Beverages, Cooked Food, and Snacks | 77 *** (5.95) |
| Factor 7 | Leisure with Driving and In-Home Hobby | 1306 *** (5.25) |
| Factor 8 | Others (Fuel at Home, Less Meat, etc.) | 204 *** (4.64) |
| Target Year | Food | Housing | Mobility | Goods | Leisure | Services | Total | |
|---|---|---|---|---|---|---|---|---|
| 2030 Target | (Upper) | 0.70 | 1.25 | 0.39 | 0.40 | 0.17 | 0.29 | 3.20 |
| (Lower) | 0.55 | 0.99 | 0.29 | 0.31 | 0.13 | 0.23 | 2.50 | |
| 2050 Target | (Upper) | 0.34 | 0.60 | 0.16 | 0.18 | 0.08 | 0.14 | 1.50 |
| (Lower) | 0.16 | 0.28 | 0.07 | 0.09 | 0.04 | 0.06 | 0.70 | |
© 2019 by the authors. Licensee MDPI, Basel, Switzerland. This article is an open access article distributed under the terms and conditions of the Creative Commons Attribution (CC BY) license (http://creativecommons.org/licenses/by/4.0/).
Share and Cite
Koide, R.; Lettenmeier, M.; Kojima, S.; Toivio, V.; Amellina, A.; Akenji, L. Carbon Footprints and Consumer Lifestyles: An Analysis of Lifestyle Factors and Gap Analysis by Consumer Segment in Japan. Sustainability 2019, 11, 5983. https://doi.org/10.3390/su11215983
Koide R, Lettenmeier M, Kojima S, Toivio V, Amellina A, Akenji L. Carbon Footprints and Consumer Lifestyles: An Analysis of Lifestyle Factors and Gap Analysis by Consumer Segment in Japan. Sustainability. 2019; 11(21):5983. https://doi.org/10.3390/su11215983
Chicago/Turabian StyleKoide, Ryu, Michael Lettenmeier, Satoshi Kojima, Viivi Toivio, Aryanie Amellina, and Lewis Akenji. 2019. "Carbon Footprints and Consumer Lifestyles: An Analysis of Lifestyle Factors and Gap Analysis by Consumer Segment in Japan" Sustainability 11, no. 21: 5983. https://doi.org/10.3390/su11215983
APA StyleKoide, R., Lettenmeier, M., Kojima, S., Toivio, V., Amellina, A., & Akenji, L. (2019). Carbon Footprints and Consumer Lifestyles: An Analysis of Lifestyle Factors and Gap Analysis by Consumer Segment in Japan. Sustainability, 11(21), 5983. https://doi.org/10.3390/su11215983