Are Consumers’ Egg Preferences Influenced by Animal-Welfare Conditions and Environmental Impacts?


1
The Center for Agro-food Economy and Development (CREDA-UPC-IRTA), 08860 Castelldefels, Barcelona, Spain
2
Department of Agricultural Economics and Rural Development, Agricultural University of Athens, 11855 Athens, Greece
*
Authors to whom correspondence should be addressed.
Sustainability 2019, 11(22), 6218; https://doi.org/10.3390/su11226218
Submission received: 6 August 2019
/
Revised: 4 November 2019
/
Accepted: 5 November 2019
/
Published: 6 November 2019
(This article belongs to the Special Issue Marketing of Sustainable Food and Drink)
Abstract
:We conducted a labelled discrete choice experiment (DCE) to assess consumers’ preferences and willingness to pay (WTP) for fresh hens’ eggs produced via different production systems (caged, barn, free range, or organic). We estimated purchase intentions and WTP for different possible reductions (0%, 10%, 20%, and 30%) of greenhouse gas (GHG) emissions and water use in the egg production systems. Data were collected using an online open-ended questionnaire completed by a representative sample of 1045 Spanish egg consumers. The results of a random parameter logit (RPL) model showed heterogeneous preferences for different types of eggs with higher marginal utility and WTP for a production system ensuring higher animal welfare level, such as free-range eggs. However, consumers showed a lower preference for organic eggs at the actual market prices since they were unwilling to pay for this category of eggs. Moreover, there were positive marginal WTPs for reductions in GHG emissions and water use, but only for significant reductions (20% or 30%) with respect to the current situation. Potential buyers for free-range eggs were identified to be persons under 40 years old, persons with a monthly income of more than €1500, and persons who were pro-environment. Our findings provide producers, sellers and policy makers with useful information that may guide them in the development of successful communication and pricing strategies.
1. Introduction
Consumers’ awareness about the impacts of conventional farming on human health, safety, animal welfare and the environment lead them to be increasingly diligent in researching these aspects as they pertain to their food choices [1,2]. As a result, consumers are becoming increasingly interested in organic farming systems and farming systems respectful of animal welfare [2]. According to authors Davies et al., [3] consumers of organic food can be classified in this way: environmentalists, healthy eaters, food phobics, welfare enthusiasts, humanists and hedonists.
Because of these concerns, consumer demand for healthier, eco-friendly and more animal-welfare-friendly food products is continuously increasing [4,5,6,7,8]. This increase in consumers’ awareness towards animal welfare has led the European Union (EU) to change its regulations related to animal welfare. Consequently, producers are increasingly investing in production systems that are more respectful of animal welfare and the environment. One of the first sectors in which this sensitivity was manifested was that of egg production. This has prompted the policy makers to issue the Council Directive 1999/74/EC of 19 July 1999 laying down minimum standards for the protection of laying hens, with the aim of improving the welfare of laying hens. Subsequently, the nomenclature was regulated. In 2001, the European Commission made a distinction between four types of production systems for laying hens: “organic,” “free-range,” “barn,” and “caged eggs” [9], to permit producers to differentiate their products and consumers to make easy choices. The conventional caged system has been banned since 1 January 2012 and replaced by enriched cage systems.
The egg sector in Europe is very important, and it needs to meet the continuous shifts in consumers’ needs and behaviours. The EU is the second-largest egg producer in the world (after China), producing 7.5 million tonnes of eggs in 2016 [10]. Most (84.4%) of the EU egg production is concentrated in 10 countries, with France, Germany, Spain and Italy being the largest producers. The egg sector in the EU covers local demand and contributes to the economy by exporting eggs and egg products to a value of more than €200 million per year [10,11].
In 2016, it was estimated that 55.6% of laying hens in the EU were kept in enriched cages, 25.7% in barn systems, 14.1% in free-range systems and 4.6% in organic systems [11]. By countries, Spain, Poland, France, Italy had the highest number of laying hens in enriched cages, Germany, the Netherlands, Italy and Sweden in barn systems, the United Kingdom, Germany, France and the Netherlands in free-range systems, and Germany, France, the Netherlands and Italy in organic systems [11].
These trends in consumer behaviours and priorities are new opportunities for businesses since they are new market niches, but they also present challenges and additional complexities for producers, food marketers and processors who want to meet consumers’ needs and differentiate their products in the market. Production systems meeting higher standards of farm animal welfare have increased production costs [12], which leads producers to sell the products for higher prices. Many studies have shown that consumers would be willing to pay a premium for organic eggs, but the market share of these eggs remains very low. Are the current prices a barrier? Moreover, requiring higher standards of farm animal welfare could also have environmental impacts. In this context, Leinonen and Kyriazakis [13] and Wiedemann and McGahan [14] estimated different levels of emissions and water use for each egg production system and they showed that the emissions of caged eggs were lower than those of the rest of eggs, while organic eggs had the highest level of emissions. Therefore, this makes it interesting to see how consumers’ egg choice decisions are influenced by the provision of information related to environmental impacts and animal welfare conditions. We conducted a labelled discrete choice experiment (DCE) using a representative sample of Spanish egg consumers to assess consumers’ preferences and willingness to pay (WTP) for the environmental and animal welfare attributes in different egg production systems. In particular, it assessed consumers’ purchase intentions and WTP for the different egg production systems and for the reduction of carbon emissions and water use in each of the different egg-production systems. It provides useful information for egg producers and marketers about consumers’ priorities and the range of acceptable prices for more environmentally friendly and animal-welfare-respectful eggs.
Eggs have always been sold for their reputation as a healthy food and cheap source of protein, however, increasing awareness towards animal welfare and environmental impacts have made the egg market increasingly differentiated by animal welfare conditions of raising hens and eggs’ nutrient content. In recent years, the literature has shown a special interest in assessing consumers’ attitudes and preferences towards the different types of eggs. A common finding among some studies [8,15,16] is that price remains the most influential factor in consumers’ egg-purchasing decisions.
Moreover, mixed results were found concerning consumers’ interest in eggs produced in a way more respectful of animal welfare and the environment. Goddard et al. [15] used stated preference (in Alberta) and revealed preference (in Alberta and Ontario) data to investigate Canadian egg consumers’ interest in specialty eggs, including Omega-3, organic, free range, vitamin-enhanced and vegetarian and they found modest consumer interest in organic and free-range eggs. They identified some small niches, especially for free-range and organic eggs. Zakowska-Biemans and Tekien [8] conducted a discrete choice-based conjoint method to assess consumer’ preferences for different egg-farming systems and nutritional enhancement and they concluded that the farming system (especially free range) is a key driver of consumers’ preferences.
With respect to the importance of farming system compared to other egg’ attributes, it was found that farming system was the second more important influencer of consumers’ preferences right after price [8,16]. Zakowska-Biemans and Tekien [8] found that consumers’ preferences were more influenced by the price and farming system (especially free range) than by nutrition and health claims, egg size, package size and hen breed, which were found to be less important. Mesías et al. [16] conducted a conjoint analysis to determine the most important attributes influencing Spanish consumers’ preferences for eggs and found that price is the most important driver of consumer preferences, followed by the hens’ feeding and rearing conditions. Heng et al. [17] used a national survey to assess preferences for the types of eggs and found that consumers’ egg-purchasing decisions were influenced more by animal welfare conditions than by environmental issues.
Regarding WTP, studies [18,19,20] estimated consumers’ WTP for different typologies of eggs and they found that consumers were willing to pay a premium price for eggs produced in cage-free systems. Gracia et al. [18] found that consumers were willing to pay a premium price for barn, free-range and/or organic over caged eggs. Lusk [19] found that there was a high heterogeneity in consumers’ WTP for cage-free eggs. He reported that, while the mean premium for cage-free eggs was $1.16/dozen, the majority of consumers were willing to pay a small premium (no more than $0.30/dozen), while a minority of consumers were willing to pay larger premiums. Lu et al. [20] found that while consumers are not willing to pay a premium for enriched cage eggs, they were likely to pay a premium for free-range systems and for the different attributes of housing systems (cage-free; outdoor access; access to nest boxes, perches and scratching pads; and more space). Ochs et al. [21] found that informing consumers about egg production systems led them to feel equally about cage-free and enriched cage systems, while they paid more for the cage-free system before receiving the information. Heng et al. [17] found that consumers perceived caged housing systems as reducing hens’ welfare and were willing to pay more for cage-free eggs. Moreover, consumers’ preferences and WTP for eggs were found to be heterogeneous [8,15,16,22]. Potential buyers of organic and free run/range eggs were found to be: health-conscious, concerned about animal welfare [15], regular consumers of organic foods [16,22], in the middle of the income range, over 50 years old [16] and educated to university level or above [8].
From our literature review we realized that no study tested whether the type of eggs is used by consumers as a proxy of the animal welfare conditions and the environmental impact of eggs production. We also realized that no study explored the impact of water footprint on egg purchase decisions. To respond to these research gaps, we tested different aspects of egg choice decisions, which we summarised in the following five hypotheses:
Hypothesis (H1).
Consumers prefer free-range eggs over caged and barn eggs since they are more respectful of animal welfare. In recent years, many supermarkets decided to incorporate free-range eggs on their shelves because Spaniards demand for this type of eggs is increasing.
Hypothesis (H2).
Consumers prefer free range eggs over organic eggs since they are sold at cheaper prices.
Hypothesis (H3).
The types of eggs produced with different methods are perceived by consumers as products having specific properties and consumers use the type of eggs as a proxy of the animal-welfare conditions and the environmental impact of egg production.
Hypothesis (H4).
Carbon footprint is more important to consumers than water footprint.
Hypothesis (H5).
Consumers preferences and WTP for reductions in emissions or water use are different from one type of egg to another.
The present paper contributes to the above literature methodologically and empirically. The methodological contribution consists on the fact that it is the first study to use a labelled DCE to assess preferences for eggs. It allowed us to test whether consumers use the type of eggs as a proxy of the animal-welfare conditions and the environmental impact of egg production. Moreover, this design permitted us to estimate for the price attribute different coefficients (marginal utilities) by the type of eggs. Consumers’ valuation for price could be different from one type of egg to another. This is very important because it makes possible to estimate specific and more precise WTP for each type of egg. The empirical contribution consists on the assessment of the effect of two environmental attributes (carbon and water footprint) on the choice of eggs. The existing literature explored the impact of the carbon footprint on the purchase of eggs, however, the importance of the water footprint was never considered.
The remaining part of this article is structured in four sections. The second section details the adopted methodology, describing the DCE design and data collection. The third section describes the model specification and the fourth section presents the results and the discussion. The fifth section presents the relevant conclusions of the present paper.
2. Materials and Methods
2.1. Discrete Choice Experiment (DCE)
We used a DCE to assess consumers’ preferences and WTP for different eggs and attributes because it permits us to estimate the relative importance of different attributes of eggs, the trade-offs between these attributes, individuals’ preferences for each type of egg, and the monetary values of the attributes. DCE is a stated preference approach widely used for eliciting individual preferences in transport [23,24,25], health [26,27] and food economics [28,29]. It is based on the assumptions of rationality and utility maximization of Lancaster’s consumer choice theory. In DCE, participants face a series of hypothetical purchasing situations very similar to those they often face in the real market. In each purchasing situation, individuals are presented with several alternatives described by a set of attributes and their levels and they are asked to choose their preferred alternative. The individual is assumed to choose the option which provides him/her with the maximum utility. The utility derived from choosing a given option is assumed to be equal to the sum of the marginal utilities associated with its attributes [30,31,32]. Including the price in the list of attributes used to describe the alternatives permits researchers estimating the marginal willingness to pay for each attribute. DCE has already been used in several egg-choice studies [18,19,20,21].
2.2. Attribute Selection and Experimental Design
We employed a labelled choice design, following the design used in Lusk and Schroeder [32], in which different products were described in choice sets and only the prices of the products varied among the scenarios. In our case study, we included two additional attributes in the description of the products. We opted for a labelled choice design because in Spain different egg production methods have different price levels. This allowed us to use egg-specific constants to estimate the real market share of each egg. It is a more realistic and less abstract strategy, so consumers’ choices reflect the real preference structure, which allows for exploring the effect of the labels [33]. In labelled-choice experiments, the WTP and purchase intention may diverge because the highest purchase intention does not necessary correspond to the highest WTP, since the vectors of prices used for the products are different [34].
We selected a set of attributes and levels to consider for the description of the fresh eggs. In total, we considered three attributes, including two environmental attributes (reduction of carbon emissions and water use during egg production) and price. Table 1 shows the attributes and levels used in the DCE.
The different egg production systems (enriched caged, barn, free-range and organic) were displayed as the labels or names of the alternatives. They represent the egg products available in the marketplace (caged, barn, free-range and organic). They are the four systems of egg production recognized by the current regulations of the EU. These four types of fresh chicken eggs were used as labels of the alternatives presented in each choice set. We aimed to know whether purchase decisions are influenced by the type of fresh chicken eggs, which can be a proxy of the animal welfare conditions and the environmental impact of each production system. A detailed description of each type of production was presented to the participants before they started responding the DCE questions.
The first attribute we considered was the reduction of greenhouse gas emissions during fresh chicken egg production. We considered this attribute to test whether consumers’ egg choices are influenced by carbon footprint. Feucht and Zander [35] investigated consumers’ preferences and WTP for milk with carbon footprint labels in six European countries (France, Germany, Italy, Norway, Spain, Germany, UK) and found that providing a carbon footprint label increased purchase intentions and stimulated consumers to pay a small price premium for a carbon footprint label. However, they suggested that a carbon footprint label will make a limited contribution to changing consumers’ behaviours towards a more environmentally-friendly consumption because of the lack of knowledge, reluctance to change, time preference and uncertainty regarding the relevance of climate change. Meyerding et al. [36] assessed consumers’ preferences for carbon footprint labelling on tomatoes in Germany and found that carbon-footprint labelling significantly influences consumer food choices. They suggested that the carbon footprint label designs applying the traffic light approach are more effective in influencing consumer food choices. In the egg-production process, greenhouse gases are released in various stages. A big part of these emissions is generated in feed production (for example, land cultivation, fertilizers and pesticide use) and also in feed processing. Additionally, these emissions can be produced from other sources like barn heating and illumination of the hens, egg transportation, feed and medical treatment of hens. Currently, there are technologies for the reduction of greenhouse gases related to farming activities, such as the reduction of the total fertilizer quantity by closing the loop of phosphorus, nitrogen and potassium at the farm level. Other alternatives are available that focus on the efficient use of fertilizers and the revalorisation of organic waste and improved practices of agricultural land such as zero tillage. For this environmental attribute, we considered four levels, which referred to different possible levels of GHG emissions reduction. Therefore, we distinguished eggs according to the level of possible GHG emissions reduction. The highest level of reduction (30%) we considered corresponded to the target level of emission reduction set by the European Union for 2030 through the Effort Sharing Regulation. To this target level we added two intermediate levels of reduction (10% and 20%) and a 0% reduction, which corresponded to the current levels of emissions emitted by the different type of eggs. These levels of reduction were defined with respect to the estimated levels of emissions emitted by different type of eggs reported by Leinonen and Kyriazakis [13]. According to Leinonen and Kyriazakis, the emissions emitted by the production of 500 grams of eggs (half a dozen eggs) were estimated at 1460 grams of carbon dioxide equivalent for caged eggs, 1725 grams for barn eggs, 1690 grams for free range eggs and 1710 grams for organic eggs. We provided this information to participants, however, emissions were expressed in terms of the number of kilometers required to travel by a car to reach the emission levels of each type of egg. For example, the 1460 grams emitted by the production of 500 grams of caged eggs correspond approximately to the emissions of driving an average car (which emits 120 g of CO2 per 100 kilometers) for more than 1217 kilometers. We proceeded in this way to help participants better understand the emission levels of the different type of eggs.
Also, the production of fresh chicken eggs indirectly requires the use of natural resources like water during the egg production process; water is used in various stages to cover farming needs for feed production and for the cleanliness of the barns and facilities. Mekonnen and Hoekstra [37] showed that the water footprint of animal products was significantly higher than that of crops. Currently, there are various technologies for the reduction of water use that, principally, suppose the introduction of efficient irrigation technologies. We considered the reduction of water use as an attribute to test whether consumers’ egg choices are influenced by water footprint. Owusu-Sekyere et al. [38] tested whether meat choices are influenced by water and carbon footprint attributes among middle- and upper-class South African consumers and they found that consumers are willing to pay higher premiums for a reduction in both water usage and carbon emission. They also found that consumers’ preferences for water and carbon footprint attributes were heterogeneous, with some being environmental-sustainability activists, water-sustainability advocates, and conservatives regarding environmentally sustainable products. Pomarici et al. [39] assessed young consumers’ preferences and WTP for water-saving wines in Italy and they found that young consumers were willing to pay higher premiums for water saving labeled wines. They also informed that these premiums increased with wine consumption frequency, label trust and use, and consumers’ environmental-friendly attitude. For this attribute (reduction of water use) we considered four levels, which referred to the possible levels of reduction of water use. Similar to emissions, we had reduction levels of 0%, 10%, 20% and 30% defined with respect to the levels of water use in the production of the different type of eggs estimated in Wiedemann and McGahan [14]. According to Wiedemann and McGahan, the amount of water needed to produce 500 grams of eggs is 4.55 liters for caged and barn eggs, and 4.28 liters for free-range and organic eggs. Even though Wiedemann and McGahan reported that these differences were not statistically significant, we tested whether consumers would value or not these small reductions when buying eggs. Feed production is the greatest contributor of water use in egg production. Wiedemann and McGahan [14] attributed more than 80% of consumptive water use in environmentally controlled housing to the imported soymeal (feed production) from US. Katukurunda and Atapattu [40] found that the contribution of drinking and servicing water for the total water footprint of hen-egg production were negligible (0.15 and 0.07%, respectively) compared to that of feed water (water required for feed production), which accounted over 99% of the total water footprint. They reported that the reduction of feed water is feasible and a key to reducing the water footprint of hen egg production. Katukurunda and Atapattu [40] found that soya bean meal and maize meal were the highest contributors to the feed water (37% and 21%) and they recommended applying water-efficient production systems for these crops to reduce significantly feed water. Therefore, if we feed free-range laying hens with a feed with a small water footprint we will obtain free range eggs with a water footprint better than that of caged-eggs and vis versa. Thus, all combinations are potentially possible. In short, we tested whether different levels (0%, 10%, 20% and 30%) of reductions in water use are important for consumers when they buy eggs.
Regarding the attribute price, it was selected to be able to estimate the WTP for the rest of the attributes. Four price levels were identified for the different egg types. Price levels and product size were identified following market information regarding the price and available format of all products. We used the medium–large egg size (53–73 g) and six-egg package format because it is the most purchased in Spain and because free-range eggs and organic eggs are only (in the majority of purchase points) available in this format. We considered four levels for price; however, they were specific for each egg type.
An optimal and efficient experimental design was then applied to create labelled alternatives using Ngene software [41]. Accordingly, we designed eight choice sets by ensuring a balanced design that ensures similar occurrence of all attributes amongst egg types. The option “neither of the products presented” was also included to be consistent with the demand theory and to make the choice more realistic, as this option is available when shopping. An example of a choice set is shown in Table 2.
To motivate participants to state their real preferences in the DCE and to reduce hypothetical bias, participants were asked to read a cheap talk script before answering the DCE questions as proposed by Carlsson et al. [42]. We explained to them that previous studies found a gap between what respondents indicate in surveys and what they do in real life. They were also informed that respondents often overestimate their WTP for hypothetical products because they forget their budget constraints. So, they were asked to respond as they would in real life rather than as they want to be.
2.3. Data Collection and Survey
In addition to the DCE section, the questionnaire included other sections that collected information on consumers’ perceptions, consumption behaviours and attitudes. We assessed purchasing and consumption behaviours by asking consumers about egg-consumption frequency, and the type, format and price of the eggs they usually buy. We also measured environmental attitudes and attitudes towards animal welfare in farming production systems. We used the Spanish version [43] of the New Ecological Paradigm (NEP) scale [44] to measure the environmental attitudes of respondents (see Appendix A). Respondents were asked to indicate their agreement or disagreement with 16 statements, using a nine-point Likert-type scale ranging from 1 (absolutely disagree) to 9 (absolutely agree). Animal-welfare attitudes were measured using eight items from the animal attitude scale (AAS) developed by Herzog et al. [45], to which we added three additional items (see Appendix B). Participants were asked to indicate their agreement or disagreement with 11 statements, using a seven-point Likert-type scale ranging from 1 (absolutely disagree) to 7 (absolutely agree). Our questionnaire also collected some socio-demographic information on participants.
Data were collected from a web-based questionnaire conducted in April 2019 among 1045 egg consumers over 18 years old in Spain. Web-based surveys have difficulty reaching participants who do not have internet access, however, Spain is one of the countries with the highest internet penetration rate (92.5%) in the world [46]. The surveyed individuals were the main household food buyers and had purchased and consumed eggs in the last week. Our sample was representative of the population of Spain in terms of sex, age and income. The survey process and the consumers’ panel were contracted to a specialized market company (Qualtrics). Table 3 is a summary of the main descriptors of the sample.
Half (49.76%) of the respondents were female. The average age of respondents was about 44 years, and 60% of them were under 50. The average household size was about three people and the monthly household income of about 50% of respondents was less than €2000. Approximately 61% of respondents perceived the monthly food expenditure of their household to be similar to the average, while 16.26% and 22.39% perceived it to be below or above the average, respectively.
2.4. Model Specification
DCE is a quantitative approach used for eliciting individual preferences. Theoretically, it is based on Lancaster’s theory of value [47] and on the random utility theory (RUT) of Thurstone [48]. According to Lancaster [47], the total utility derived by consumer from a given good is the sum of utilities provided by each of its component attributes. However, not all the utility is observable by the researcher. The total utility () derived by an individual from choosing an alternative among a set of available alternatives in a given choice situation has two components, including a systematic component () observable by the researcher and a random error term () not observable by the researcher [49].
Assuming linearity, the utility function for alternative can be expressed in the following way:
where are the caged, barn, free-range and organic egg products. are the environmental attributes (i.e., reduction of greenhouse gas emissions and water use) selected by the consumer , is the price of alternative , are the coefficients of the alternative specific constant (ASC), which represents the marginal utility of alternative j. are the coefficients representing the effect of the product attributes on the utility for the product and are the coefficients representing the effect of the product price on the utility for the product.
To predict the subjects’ preferences for an alternative, it is necessary to define the “probability of choice” that individual n will choose alternative i rather than alternative (for any and within choice sets, ). McFadden et al. [49] developed a multinomial logit (MNL) model, considered as the baseline model for DCEs. According to this model, the probability that consumer n will choose product is:
where is a scale parameter that is inversely related to the variance of the error term. For the MNL, the scale parameter is fixed to 1 for estimation reasons. Furthermore, in this model specification, the condition of independent and identically distributed (IID) error term must be met according to a Gumbel distribution. Such a distribution in the error term allows for the verification of a restrictive property within the MNL, which is the independence of the irrelevant alternatives (IIA) property. This restriction implies that the ratio of the probabilities of choosing any pair of alternatives i and j is not dependent on the systematic utility of any other alternative within the set of alternatives, which is seldom guaranteed. As a consequence, the MNL imposes a very strict structure on cross-price elasticities, making it impossible to analyse substitutability between the products [50].
We estimated a random parameter logit (RPL) model that relaxes the IIA assumption. The RPL model extends the MNL model by allowing for unobserved heterogeneity through random coefficients on attributes [49]. This ability to accommodate heterogeneity in individuals’ preferences improves model fit [51] and our understanding of choice behaviour [52]. In this study, the random parameters were assigned to the alternative specific constant (ASC) since this estimate encompasses all attributes of the product not accounted for in a holistic way. According to this model, the coefficient vectors for person is , where and are the estimated mean and is the standard deviation of the marginal distribution of and . is a random term assumed to be normally distributed with mean zero and unit standard deviation. Thus, the term is the vector of person n’s specific deviations from the mean value of and . The is described by an underlying continuous distribution for the attributes and the ASC. In most applications, the multivariate normal distribution is the most used, MVN (0, Σ). In this study, alternative specific constants (ASC—Caged, ASC—Barn, ASC—Free Range, ASC—Organic) were coded as dummies and considered independently normally distributed in the population because consumers may like or dislike each type of egg. Regarding the two environmental attributes, we considered a 0% reduction in GHG emissions or water use as the reference level and we estimated coefficients for a reduction in GHG emissions of 10% (GHG reduction 10%), 20% (GHG reduction 20%) or 30% (GHG reduction 30%) and in water use of 10% (Water reduction 10%), 20% (Water reduction 20%) or 30% (Water reduction 30%). All the environmental variables were effect coded and their associated coefficients were assumed to be log-normally distributed (GHG reduction 20%, GHG reduction 30%, Water reduction 10%, Water reduction 20%, Water reduction 30%) because we expected that all consumers have positive preferences for these attributes, which is reasonable since they represent improvements in environmental conditions [53]. Moreover, we estimated four coefficients for the egg-specific prices (Price—Caged, Price—Barn, Price—Free range, Price—Organic), which were considered fixed (i.e., non-random) to ensure finite distribution moments for the WTP.
We also checked the existence of heterogeneity in preferences for eggs, estimating an extended RPL model where we controlled for some individual-specific characteristics or attitudes [29]. This segmentation is important for producers to make the egg market more differentiated. We estimated the extended RPL model, controlling for sex (Female), age below 40 years (Age40), total monthly household income of less than €1500 (Lhinc), pro-environmental attitudes (Environmentalist), and pro-animal welfare attitudes (Animalist). Table 4 shows the definition and descriptive statistics of these variables.
The total WTP of a product versus the baseline alternative (none of the presented products) is calculated as the negative ratio of the ASC coefficient and the coefficient of the base level of the environmental attributes (i.e., 0% reduction in greenhouse gas emissions and 0% reduction in water use) to the price coefficient of the same product j [32]:
This calculation relies on the estimation of the marginal rate of substitution (MRS) of any two coefficients. Since one of the coefficients is a monetary one (i.e., the price), it is possible to determine the WTP.
The WTP for the reduction of greenhouse gas emissions and water use can also be estimated for each type of eggs, j:
The marginal WTP of any product, versus any other product i is the difference between WTP for product and WTP for product i [32]. Finally, the Krinsky and Robb parametric bootstrapping method was applied to calculate the confidence intervals of the WTPs with 1000 random repetitions [54]. We used the NLOGIT 5.0 software and 1000 random draws to estimate the coefficients, the WTP and their confidence intervals.
3. Results
More than 95% of participants reported eating eggs at least once a week, among whom 66.79% indicated that they eat eggs two to three times a week and 11.39% do so every day. Eggs produced under a free-range system were the most (36.27%) purchased by respondents, followed by barn (26.22%), caged (14.07%) and organic (10.33%) eggs, respectively. The demand for omega-3 eggs (0.19%) was insignificant compared to other types of eggs. The percentage of respondents who indicated that they usually buy free-range eggs may be exaggerated due to their lack of knowledge about the type of eggs they really buy. About 12% of respondents did not know what type of eggs they habitually buy. In the European Union, eggs are labelled according to production system. There are 4 codes and each of them corresponds to a production system: 0 “organic”, 1 “free-range”, 2 “barn”, and 3 “caged”. Respondents were asked whether they know which code corresponds to each egg production system and the results showed that a fifth (21.05%) of respondents knew which egg production system corresponds to each code, while about a fifth (19.52%) of the sample answered incorrectly to this question. Moreover, 31.48% of respondents reported that they did not know how to answer this question and 27.94% did not remember which egg-production system corresponds to each code. Therefore, there was clear ignorance of how to interpret information regarding the types of eggs by consumers. For this reason, before completing the DCE, consumers were informed about the conditions of animal husbandry for the different types of eggs. More than half (54.26%) of respondents reported that they usually purchase cardboard egg packaging, while only 1.34% opt for plastic egg packaging. However, 44.40% of respondents indicated that they buy eggs packaged in a mixed (plastic and cardboard) box. The most purchased format by respondents was the six-egg container (41.82%) at an average price of €1.95, followed by the 12-egg container (24.98%) at an average price of €2.47 and the 30-egg container (19.17%) at an average price of €5.71.
We used data from the NEP scale to measure consumers’ environmental concern. For this end, we performed an exploratory factor analysis to identify the items that best characterize consumers’ environmental attitudes and to group them into dimensions or factors [55]. Results are shown in Appendix C. The results from a Kaiser–Meyer–Olkin (KMO) test (0.88) and Bartlett’s test of sphericity (p < 0.001) confirmed that the variables were adequate to perform an exploratory factor analysis. The results of the factor analysis identified two factors which explained 53% of the variance. The first factor comprised of 7 pro-environmental variables (items: 9, 10, 12, 6, 13, 5, 16) which described an ecocentric attitude towards the environment. The second factor comprised of 6 anti-environmental variables (items: 7, 15, 14, 11, 8, 1) which defined an anthropocentric attitude towards the environment. Items 2, 3 and 4 were removed because they were not clearly associated with any factor. Therefore, the factor analysis permitted us to reduce the number of items from 16 to 13. After changing the directionality of the anti- environmental items, we estimated the mean score and the standard deviation for each of the 13 items, the average score and the total score of the 13 items. The sum of the 13 scores can range between 9 and 117 with higher scores indicating more concern for the environment. The overall score for the 13 items was 76.21 which is a relatively high score. Half of the sample had a total score higher than the overall score estimated for the full sample, which indicates a clear pro-environmental orientation.
We also conducted an exploratory factor analysis to reduce the dimensionality of the animal attitude scale. Results are shown in Appendix D. The results of the Kaiser–Meyer–Olkin test (0.84) and Bartlett’s test of sphericity (p < 0.001) were clearly acceptable. The factor analysis identified one factor which explained 35% of the variability. This factor comprised of 10 items (1, 2, 3, 4, 5, 6, 7, 8, 9, 10) which measure consumers’ attitudes toward animal use. Item 11 was removed because it did not load strongly on the factor. We first changed the direction of the items which indicate a negative attitudes toward animal welfare. Then, we calculated the mean and standard deviation of each of the 10 items, the average score and the overall score of the 10 items. The total of the 10 scores can range between 7 and 70 with higher scores indicating more concern for animal welfare. We obtained a total score for the 10 items of 57.91, which is a higher score. We calculated that 46.22% of the sample had higher total score than the overall score estimated for the full sample, showing a great concern towards animal welfare.
3.1. Descriptive Analysis of the Discrete Choice Experiment Results
Figure 1 shows the frequency of a particular alternative being chosen in the DCE. Free-range eggs were the most (33.75%) chosen option, followed by barn eggs (27.55%), caged eggs (20.89%) and organic eggs (14.40%). This order of preference is the same as that reported by participants regarding the most purchased egg type. This result confirmed our Hypothesis 1 and 2 and means that there was a strong public interest in cage-free eggs. So, animal welfare conditions influenced consumers’ egg purchasing decisions. Organic eggs were less often selected than caged eggs, which is an expected result because it is exactly what happens in the real market. The low market share of organic eggs is probably due to their high market prices. Results show that only one-fifth of the choices made by participants were caged eggs, which means that the market share of this type of eggs is decreasing.
3.2. Importance of Egg Attributes and Types: A Random Parameter Logit (RPL) Model
We first estimated a baseline RPL model without controlling for specific characteristics; the results are shown in Table 5. The results showed that all egg-specific constants were statistically significant except for organic eggs. This means that consumers preferred caged, barn and free-range eggs over the opt-out option; however, they did not have a specific preference for organic eggs. Free-range eggs had the highest marginal utility, followed by barn eggs, caged and organic eggs, respectively. This means that free-range eggs were the preferred eggs, followed by barn, caged and organic eggs, in that order. This means that the types of eggs (labels) were used by participants as a proxy of the animal welfare conditions and the environmental impact of eggs production, which confirmed our Hypothesis 3.
The effect of price on organic egg choices was negative but not statistically significant, indicating that shifts in the price of organic eggs did not affect consumers’ preferences. This unexpected result may be due to the fact that the prices used for organic eggs (which were market prices) were perceived as too high by participants and this led them to reject the organic eggs regardless of their price. It may also be that the organic label was not important for participants in terms of choosing eggs. The effect of price on the choice of the other types of eggs was statistically significant and negative, indicating that increases in price decreased the demand for caged, barn and free-range eggs.
Regarding the attributes of GHG emissions and water use reduction, we observed that all coefficients were statistically significant, with the exception of the parameters associated with the smallest (10%) reduction in GHG emissions and water use. These results suggested that a reduction of 10% in GHG emissions or water use was not enough to attract participants. However, reductions of 20% or 30% in GHG emissions and water use were highly valued by participants. We also observed that GHG emissions were more important to consumers than water use, which confirmed our Hypothesis 4.
The standard deviations of the egg-specific constants and the reductions of 20% or 30% in GHG emissions or water use were highly significant, revealing the presence of non-observed heterogeneity in preferences for these egg characteristics. Even for organic eggs, preferences were statistically significantly different among the surveyed individuals. Therefore, although the whole sample did not show a special interest in organic eggs, there may be small segments interested in this type of eggs. Moreover, preferences for the 10% reductions in GHG emissions or water use were homogenous among participants.
The WTP for egg type and characteristics were estimated using the parameters of the baseline RPL model following Equations (4) and (5). The means of these WTP estimates are presented in Table 6. The WTP for organic eggs without any improvement of the environmental attributes (i.e., with the baseline level “0%” GHG and water-use reduction) showed an insignificant value. Although the participants showed a special interest in barn eggs, they were not willing to pay more for these eggs. Participants’ WTP for caged eggs without any improvement in the environmental attributes was €0.46/6 eggs, which corresponds to the minimum price for this type of eggs in the market. Moreover, participants were willing to pay €2.59 for six free-range eggs, which corresponds to the market price of this type of eggs.
The labelled DCE design we adopted in this study allowed us to estimate the WTP for reductions in GHG emissions and water use for each type of eggs. The results showed that for all types of eggs the WTP for a 10% reduction in GHG emissions or water use was not statistically significant at 5%. Consumers consider that a small (10%) reduction in GHG emissions or water use with respect to the current level should be supported by farmers and they were not willing to support increases in prices. Participants were willing to pay a premium price for reductions of 20% in GHG emissions or water used in the production of caged and free-range eggs, while they were not likely to pay for this level of reduction in the case of barn or organic eggs. Moreover, participants exhibited a significantly higher WTP for reductions of 30% in GHG emissions in the production of caged and free-range eggs. They were also willing to pay more for reductions of 30% in the water used in the production of caged, barn and free-range eggs. Our findings showed that consumers’ WTP for reductions in GHG emissions or water use depended on the type of eggs and the level of reduction, which confirmed our Hypothesis 5.
We also estimated an RPL model, controlling for the individual-specific characteristics, previously presented in Table 4, in order to explore the detected heterogeneity in preferences for different types of eggs. The results, in Table 7, showed that there was no statistically significant difference in preferences for the different type of eggs by sex (Female). Participants under 40 years old (Age 40) were more likely to select any of the four types of eggs than people over 40. This difference was more pronounced in the case of organic and free-range eggs. Moreover, participants who belonged to households with a monthly total income of less than €1500 (Lhinc) were less likely to select barn, free-range or organic eggs than participants with higher incomes. Participants with pro-environmental attitudes (Environmentalist) were more likely to choose barn, free-range or organic eggs. However, we did not find a statistically significant difference in the preferences according to animal-welfare attitudes.
4. Discussion
The previous literature suggested that there is a growth in consumer interest in and demand for organic and free-range eggs; however, the market shares of these types of eggs remain insignificant in comparison to the traditional caged eggs. This gap between the literature and the market led us to question whether consumers are really interested in these production aspects when they buy eggs. The purpose of this research was to assess consumers’ perceptions, preferences and WTP for eggs and to understand whether consumers’ egg purchasing decisions are influenced by animal-welfare conditions and the environmental impacts of the production systems. We investigated whether consumers were willing to pay for reductions in GHG emissions or water use in different egg-production systems.
The results identified a clear lack of understanding of the information regarding the types of eggs by consumers, which is in line with the findings reported by McCulloch [56]. Gracia et al. [15] suggested that consumers have a misunderstanding about the costs and benefits of the cage-free system. Goddard et al. [15] suggested that there may be misunderstanding of the relative nutritional and health benefits of the different types of eggs.
The results showed that free-range eggs were the most chosen option in the choice sets, followed by barn and caged eggs, while organic eggs were the least chosen option. This order of preference coincided with that of the most purchased type of eggs reported by participants in the questionnaire. We concluded that consumers are strongly interested in free-range eggs at the actual market prices, while only a small segment of consumers is interested in organic eggs at the actual prices. So, we suggest that organic eggs are perceived by consumers as expensive. In this context, Goddard et al. [15] found modest consumer interest in organic and free-range eggs and identified small niches for these types of eggs.
The results from an RPL model showed that free-range eggs are the egg type preferred (highest marginal utility) by consumers, followed by barn and caged eggs. However, consumers did not have a specific preference for organic eggs. This result confirmed the low demand for organic eggs in the real market and the potential that free-range eggs have to be the alternative to the traditional caged system. Zakowska-Biemans and Tekien [8] found that consumers preferred free-range eggs despite the fact that organic eggs meet animal welfare standards. We concluded that consumers have high purchase intentions for free-range eggs, while they are not willing to buy organic eggs at actual market prices.
The fact that consumers expressed specific interest in the labels (types of eggs) means that the type of eggs (labels) was used as a proxy of the animal welfare conditions and the environmental impacts of eggs production. This showed the importance of providing this type of information to consumers.
We also found that consumers were willing to pay a premium for free-range eggs (equal to or slightly more than the actual market price) and caged eggs (equal to the minimum actual market price), but they were unwilling to pay for organic and barn eggs. We suggest that free-range eggs will be successful at increasing their market share, while caged, barn and organic eggs will not gain market share since consumers are unwilling to pay a premium (or are only willing to pay a minimum) for them. Gerini et al. [22] found that most consumers were unwilling to pay more for organic eggs than for enhanced animal welfare eggs; a third consumer segment was not interested in organic eggs even when the prices were the same. They suggested that organic eggs will be unsuccessful at increasing their market share since most consumers are unwilling to pay a premium for organic eggs. However, our results are not entirely equal to those of Gracia et al. [18] who found that consumers were willing to pay a premium price for barn, free-range and/or organic over caged eggs. Moreover, we found that participants’ WTP for caged eggs corresponded to the minimum price of this type of eggs in the market. This means that Spanish consumers are not really interested in caged eggs, which supports the decision supermarkets have already made to stop selling caged eggs in Spain in the short or medium term. This result is in accordance with Lu et al. [20], who found that Canadian consumers were not willing to pay a premium for eggs from enriched cage systems.
There are also positive marginal WTPs for reductions in GHG emissions and water use, but only for high reductions (20% or 30%) with respect to the current situation. We suggest that modest improvements in the environmental impacts of the production systems should not be accompanied by price increases since consumers are unwilling to pay these. Our results are in line with those of Heng et al. [17] who found that consumers’ preferences for eggs were influenced by the provision of information about environmental impacts of layer-management practices.
We also observed that consumers attributed more importance to the GHG than water use. This may be due to the fact that consumers are more familiarised with carbon footprint than water footprint because the former is more present in the packaging of foods than the latter.
The valuation and the WTP for the reductions in GHG emissions and water use differed from one type of egg to another, being more important in the case of caged eggs. This result suggested that consumers perceived caged eggs as the type of eggs with the highest GHG emissions and water use, which is not true. In this context, Leinonen and Kyriazakis [13] showed that the emissions of caged eggs were lower than those of the rest of eggs, while organic eggs had the highest level of emissions. These high emissions of the production of organic eggs are mainly generated by feed production and transport.
Finally, the findings showed that preferences and willingness to pay for eggs are heterogeneous among consumers, with those under 40 years old, having a monthly income of more than €1500 and having a pro-environmental attitude more likely to choose free-range or organic eggs. Goddard et al. [15] suggested that older consumers and consumers with families may be more sensitive to prices compared to younger people or people without families and, hence, may be less likely to purchase specialty eggs. These potential buyers may be reached by informing them about animal welfare and the environmental aspects of the production systems. Regarding the impact of income, Mesías et al. [16] identified potential buyers of organic and free-run/-range eggs to be in the middle of the income range.
Author Contributions
D.R. and Z.K. designed the discrete choice experiment and the questionnaire, launched the questionnaire, collected the data, analysed the data and wrote the paper. J.M.G. supervised the study; M.P. contributed to conceptualization, format analysis and methodology of this paper.
Funding
This research was funded by the European Commission grant number 633531 and the APC was funded by the European Commission grant number 633531.
Acknowledgments
This research is part of the project Feed-a-Gene (aims to better adapt different components of monogastric livestock production systems to improve the overall efficiency and reduce the environmental impact), funded by the European Commission (Grant agreement no. 633531) under the EU Framework Programme for Research and Innovation Horizon 2020.
Conflicts of Interest
The authors declare no conflict of interest.
Appendix A

| 1 | Human ingenuity will ensure that we do not make the Earth unlivable. a |
| 2 | We are approaching the limit of the number of people the Earth can support. (item removed) |
| 3 | The Earth has plenty of natural resources if we just learn how to develop them. a (item removed) |
| 4 | The Earth is like a spaceship with very limited room and resources. (item removed) |
| 5 | Despite our special abilities, humans are still subject to the laws of nature. |
| 6 | Plants and animals have as much right as humans to exist. |
| 7 | Humans have the right to modify the natural environment to suit their needs. a |
| 8 | Humans will eventually learn enough about how nature works to be able to control it. a |
| 9 | Humans are seriously abusing the environment. |
| 10 | When humans interfere with nature it often produces disastrous consequences. |
| 11 | Humans were meant to rule over the rest of nature. a |
| 12 | If things continue on their present course, we will soon experience a major ecological catastrophe. |
| 13 | The balance of nature is very delicate and easily upset. |
| 14 | The so-called “ecological crisis” facing humankind has been greatly exaggerated. a |
| 15 | The balance of nature is strong enough to cope with the impacts of modern industrial nations. a |
| 16 | In order to achieve sustainable development, a more balanced economy is required, accompanied by more controlled industrial growth. |
a Reverse scored.
Appendix B
Table A2.
Animal attitude scale [45].
Table A2.
Animal attitude scale [45].
| 1 | It is morally wrong to hunt wild animals just for sport. |
| 2 | I do not think that there is anything wrong with using animals in medical research. a |
| 3 | I think it is perfectly acceptable for cattle and hogs to be raised for human consumption. a |
| 4 | Basically, humans have the right to use animals as we see fit. a |
| 5 | I sometimes get upset when I see wild animals in cages at zoos. |
| 6 | Breeding animals for their skins is a legitimate use of animals. a |
| 7 | Some aspects of biology can only be learned through dissecting preserved animals such as cats. a |
| 8 | It does not seem right that animals are used in cultural festivals. |
| 9 | The use of animals such as rabbits for testing the safety of cosmetics and household products is unnecessary and should be stopped. |
| 10 | I agree with the use of animals for work. a |
| 11 | I do not agree with improving animals’ health or resistance to disease through genetic modification. (item removed) |
a Reverse scored.
Appendix C
Table A3.
Results of the exploratory factor analysis applied to the New Ecological Paradigm (NEP) scale.
Table A3.
Results of the exploratory factor analysis applied to the New Ecological Paradigm (NEP) scale.
| Items | Mean Score | SD | Factor Loading | Variance Explained |
|---|---|---|---|---|
| Factor 1: Ecocentric attitude towards the environment | 31.87% | |||
| 9. Humans are seriously abusing the environment. | 5.91 | 1.41 | 0.82 | |
| 10. When humans interfere with nature it often produces disastrous consequences. | 5.78 | 1.40 | 0.79 | |
| 6. Plants and animals have as much right as humans to exist. | 5.78 | 1.45 | 0.73 | |
| 12. If things continue on their present course, we will soon experience a major ecological catastrophe. | 5.51 | 1.46 | 0.73 | |
| 13. The balance of nature is very delicate and easily upset. | 5.53 | 1.35 | 0.71 | |
| 5. Despite our special abilities, humans are still subject to the laws of nature. | 5.61 | 1.38 | 0.70 | |
| 16. In order to achieve sustainable development, a more balanced economy is required, accompanied by more controlled industrial growth. | 5.38 | 1.36 | 0.66 | |
| Factor 2: Anthropocentric attitude towards the environment | 21.57% | |||
| 7. Humans have the right to modify the natural environment to suit their needs. a | 6.55 | 1.81 | 0.74 | |
| 15. The balance of nature is strong enough to cope with the impacts of modern industrial nations. a | 6.52 | 1.81 | 0.73 | |
| 11. Humans were meant to rule over the rest of nature. a | 6.85 | 1.89 | 0.72 | |
| 14. The so-called “ecological crisis” facing humankind has been greatly exaggerated. a | 6.47 | 1.86 | 0.71 | |
| 8. Humans will eventually learn enough about how nature works to be able to control it. a | 4.56 | 1.68 | 0.59 | |
| 1. Human ingenuity will ensure that we do not make the Earth unlivable. a | 5.68 | 1.76 | 0.47 | |
| Average mean | 5.86 | 0.84 | ||
| Overall 13 item scores b | 76.21 | 10.93 | ||
Items 2, 3 and 4 were removed; a Reverse scored; b Scores are summed after removing the three items and adjusting for the score direction of the anthropocentric attitude items. A person was considered as environmentalist or with more concern for environment if his or her overall 13 item score was higher than the overall 13 item score for the full sample; SD are the standard deviations.
Appendix D
Table A4.
Results of the exploratory factor analysis applied to the animal attitude scale.
| Items | Mean Score | SD | Factor Loading | Variance Explained |
|---|---|---|---|---|
| Factor 1: Consumers’ attitudes toward animal use | 35.55% | |||
| 1. It is morally wrong to hunt wild animals just for sport. | 5.47 | 1.81 | 0.71 | |
| 2. I do not think that there is anything wrong with using animals in medical research. a | 6.08 | 1.88 | 0.70 | |
| 3. I think it is perfectly acceptable for cattle and hogs to be raised for human consumption. a | 5.10 | 1.59 | 0.64 | |
| 4. Basically, humans have the right to use animals as we see fit. a | 6.74 | 1.80 | 0.61 | |
| 5. I sometimes get upset when I see wild animals in cages at zoos. | 5.31 | 1.58 | 0.61 | |
| 6. Breeding animals for their skins is a legitimate use of animals. a | 6.84 | 2.02 | 0.56 | |
| 7. Some aspects of biology can only be learned through dissecting preserved animals such as cats. a | 6.02 | 1.70 | 0.53 | |
| 8. It does not seem right that animals are used in cultural festivals. | 5.22 | 1.86 | 0.52 | |
| 9. The use of animals such as rabbits for testing the safety of cosmetics and household products is unnecessary and should be stopped. | 5.12 | 1.73 | 0.51 | |
| 10. I agree with the use of animals for work. a | 5.97 | 1.77 | 0.50 | |
| Average mean | 5.79 | 1.05 | ||
| Overall 10 item scores b | 57.91 | 10.56 | ||
Item 11 was removed; a Reverse scored; b Scores are summed after removing item 11 and adjusting for the score direction of the negative items toward animal welfare. A person was considered as Animalist or with more concern for animal welfare if his or her overall 10 item score was higher than the overall 10 item score for the full sample; SD are the standard deviations.
References
- Bonti Ankomah, S.; Yiridoe, E.K. Organic and Conventional Food: A Literature Review of the Economics of Consumer Perceptions and Preferences; Final Report Submitted to Organic Agriculture Centre of Canada; Organic Agriculture Centre of Canada: Nova Scotia, NS, Canada, 2006; pp. 1–40. [Google Scholar]
- Grunert, K.G. Food Quality and Safety: Consumer Perception and Demand. Eur. Rev. Agric. Econ. 2005, 32, 369–391. [Google Scholar] [CrossRef]
- Davies, A.; Titterington, A.; Cochrane, C. Who Buys Organic food? A Profile of the Purchasers of Organic Food in Northern Ireland. Br. Food J. 1995, 97, 17–23. [Google Scholar] [CrossRef]
- Buller, H.; Roe, E. Modifying and Commodifying Farm Animal Welfare: The Economisation of Layer Chickens. J. Rural. Stud. 2014, 33, 141–149. [Google Scholar] [CrossRef]
- Zander, K.; Hamm, U. Information Search Behaviour and its Determinants: The Case of Ethical Attributes of Organic Food. Int. J. Consum. Stud. 2012, 36, 307–316. [Google Scholar] [CrossRef]
- Pettersson, I.C.; Weeks, C.A.; Wilson, L.R.M.; Nicol, C.J. Consumer Perceptions of Free-Range Laying Hen Welfare. Br. Food J. 2016, 118, 1999–2013. [Google Scholar] [CrossRef]
- Aschemann Witzel, J.; Maroscheck, N.; Hamm, U. Are Organic Consumers Preferring or Avoiding Foods with Nutrition and Health Claims? Food Qual. Prefer. 2013, 30, 68–76. [Google Scholar] [CrossRef]
- Zakowska Biemans, S.; Tekien, A. Free Range, Organic? Polish Consumers Preferences Regarding Information on Farming System and Nutritional Enhancement of Eggs: A Discrete Choice Based Experiment. Sustainability 2017, 9, 1999. [Google Scholar] [CrossRef]
- Council Regulation (EC). No 5/2001 of 19 December 2000 Amending Regulation (EEC) No 1907/90 on Certain Marketing Standards for Eggs. Official Journal L 002, 05/01/2001 P.0001-P.0003. Available online: http://eur-lex.europa.eu/eli/reg/2001/5(1)/oj (accessed on 20 July 2019).
- European Commission (DG ESTAT, DG AGRI), MSs notifications (CIR) (EU) 2017/1185 and Regulation (EC) 617/2008), GTA. Available online: https://ec.europa.eu/agriculture/eggs_en (accessed on 20 July 2019).
- Windhorst, H. Patterns of EU egg production and trade: A 2016 status report. In Dynamics and Patterns in EU and USA Egg and Poultry Meat Production and Trade, 1st ed.; Windhorst, H., Ed.; Wissenschafts- und Informationszentrum Nachhaltige Gefluegelwirtschaft: Dinklage, Germany, 2017; Volume 17, pp. 44–49. [Google Scholar]
- Bornett, H.L.I.; Guy, J.H.; Cain, P. Impact of Animal Welfare on Costs and Viability of Pig Production in the UK. J. Agric. Environ. Ethic 2003, 16, 163–186. [Google Scholar] [CrossRef]
- Leinonen, I.; Kyriazakis, I. Quantifying the Environmental Impacts of UK Broiler and Egg Production Systems. Lohmann Inf. 2013, 48, 45. [Google Scholar]
- Wiedemann, S.G.; McGahan, E.J. Environmental Assessment of an Egg Production Supply Chain using Life Cycle Assessment; A report for the Australian Egg Corporation Limited AECL Publication No 1FS091A, Australia; Australian Egg Corporation Limited: North Sydney, Australian, 2011. [Google Scholar]
- Goddard, E.; Boxall, P.; Emunu, J.P.; Boyd, C.; Asselin, A.; Neall, A. Consumer Attitudes, Willingness to Pay and Revealed Preferences for Different Egg Production Attributes: Analysis of Canadian Egg Consumers; Project Report no. 07-03; Department of Rural Economy, University of Alberta, Edmonton: Alberta, AB, Canada, 2007; Available online: http://ageconsearch.umn.edu/bitstream/52087/2/PR%2007-03.pdf (accessed on 5 July 2019).
- Mesias, F.J.; Martinez Carrasco, F.; Martinez, J.M.; Gaspar, P. Functional and Organic Eggs as an Alternative to Conventional Production: A Conjoint Analysis of Consumers’ Preferences. J. Sci. Food Agric. 2011, 91, 532–538. [Google Scholar] [CrossRef]
- Heng, Y.; Peterson, H.; Li, X. Consumer Attitudes toward Farm-Animal Welfare: The Case of Laying Hens. J. Agric. Resour. Econ. 2013, 38, 418–434. [Google Scholar]
- Gracia, A.; Barreiro Hurle, J.; Lopez Galan, B. Are Local and Organic Claims Complements or Substitutes? A Consumer Preferences Study for Eggs. J. Agric. Econ. 2014, 65, 49–67. [Google Scholar] [CrossRef]
- Lusk, J.L. Consumer Preferences for Cage Free Eggs and Impacts of Retailer Cage Free Pledges. Agribus. Int. J. Agribus. 2019, 35, 129–148. [Google Scholar] [CrossRef]
- Lu, Y. Consumer Preference for Eggs from Enhanced Animal Welfare Production System: A Stated Choice Analysis. In Proceedings of the Annual Meeting of the Agricultural and Applied Economics Association, Washington, WA, USA, 4–6 August 2013. [Google Scholar]
- Ochs, D.; Wolf, C.A.; Widmar, N.O.; Bir, C.; Lai, J. Hen Housing System Information Effects on U.S. Egg Demand. Food Policy 2019, 87, 101743. [Google Scholar] [CrossRef]
- Gerini, F.; Alfnes, F.; Schjoll, A. Organic-and Animal Welfare-labelled Eggs: Competing for the Same Consumers? J. Agric. Econ. 2016, 67, 471–490. [Google Scholar] [CrossRef]
- Rahmani, D.; Loureiro, M.L. Assessing Drivers’ Preferences for Hybrid Electric Vehicles (HEV) in Spain. Res. Transp. Econ. 2019, 73, 89–97. [Google Scholar] [CrossRef]
- Achtnicht, M. German Car Buyers’ Willingness to Pay to Reduce CO2 Emissions. Clim. Chang. 2012, 113, 679–697. [Google Scholar] [CrossRef]
- Ziegler, A. Individual Characteristics and Stated Preferences for Alternative Energy Sources and Propulsion Technologies in Vehicles: A Discrete Choice Analysis for Germany. Transp. Res. Part A Policy Pr. 2012, 46, 1372–1385. [Google Scholar] [CrossRef]
- Clark, M.D.; Determann, D.; Petrou, S.; Moro, D.; De Bekker Grob, E.W. Discrete Choice Experiments in Health Economics: A Review of the Literature. Pharmacoeconomics 2014, 32, 883–902. [Google Scholar] [CrossRef]
- De Bekker Grob, E.W.; Swait, J.D.; Kassahun, H.T.; Bliemer, M.C.; Jonker, M.F.; Veldwijk, J.; Cong, K.; Rose, J.M.; Donkers, B. Are Healthcare Choices Predictable? The Impact of Discrete Choice Experiment Designs and Models. Value Heal. 2019, 22, 1050–1062. [Google Scholar] [CrossRef] [Green Version]
- Rahmani, D.; Gil, J.M. Valorisation of Food Surpluses and Side-Flows and Citizens’ Understanding; Project Report; Center for Agro-Food Economics and Development: Barcelona, Spain, 2018; Available online: Ttps://eurefresh.org/valorisation-food-surpluses-and-side-flows-and-citizens%E2%80%99-understanding (accessed on 22 September 2019).
- Kallas, Z.; Escobar, C.; Gil, J.M. Assessing the Impact of a Christmas Advertisement Campaign on Catalan Wine Preference Using Choice Experiments. Appetite 2012, 58, 285–298. [Google Scholar] [CrossRef] [PubMed]
- Adamowicz, W.; Boxall, P.; Williams, M.; Louviere, J. Stated Preference Approaches for Measuring Passive Use Values: Choice Experiments and Contingent Valuation. Am. J. Agric. Econ. 1998, 80, 64–75. [Google Scholar] [CrossRef]
- Lusk, J.L.; Roosen, J.; Fox, J.A. Demand for Beef from Cattle Administered Growth Hormones or Fed Genetically Modified Corn: A Comparison of Consumers in France, Germany, the United Kingdom, and the United States. Am. J. Agric. Econ. 2003, 85, 16–29. [Google Scholar] [CrossRef] [Green Version]
- Lusk, J.L.; Schroeder, T.C. Are Choice Experiments Incentive Compatible? A Test with Quality Differentiated Beef Steaks. Am. J. Agric. Econ. 2004, 86, 467–482. [Google Scholar] [CrossRef] [Green Version]
- De Bekker Grob, E.W.; Hol, L.; Donkers, B.; Van Dam, L.; Habbema, J.D.F.; Van Leerdam, M.E.; Kuipers, E.J.; Essink Bot, M.L.; Steyerberg, E.W. Labeled Versus Unlabeled Discrete Choice Experiments in Health Economics: An Application to Colorectal Cancer Screening. Value Heal. 2010, 13, 315–323. [Google Scholar] [CrossRef]
- Kallas, Z.; Vitale, M.; Gil, J.M. Health Innovation in Patty Products. The Role of Food Neophobia in Consumers’ Non-Hypothetical Willingness to Pay, Purchase Intention and Hedonic Evaluation. Nutrients 2019, 11, 444. [Google Scholar] [CrossRef]
- Feucht, Y.; Zander, K. Consumers’ Attitudes on Carbon Footprint Labelling: Results of the SUSDIET Project, Thunen; Working Paper, No. 78; Johann Heinrich Von Thunen-Institut: Braunschweig, Germany, 2017. [Google Scholar] [CrossRef]
- Meyerding, S.G.; Schaffmann, A.L.; Lehberger, M. Consumer Preferences for Different Designs of Carbon Footprint Labelling on Tomatoes in Germany—Does Design Matter? Sustainability 2019, 11, 1587. [Google Scholar] [CrossRef]
- Mekonnen, M.M.; Hoekstra, A.Y. A Global Assessment of the Water Footprint of Farm Animal Products. Ecosystems 2012, 15, 401–415. [Google Scholar] [CrossRef] [Green Version]
- Owusu Sekyere, E.; Mahlathi, Y.; Jordaan, H. Understanding South African consumers’ Preferences and Market Potential for Products with Low Water and Carbon Footprints. Agrekon 2019, 58, 354–368. [Google Scholar] [CrossRef]
- Pomarici, E.; Asioli, D.; Vecchio, R.; Nas, T. Young Consumers’ Preferences for Water-Saving Wines: An Experimental Study. Wine Econ. Policy 2018, 7, 65–76. [Google Scholar] [CrossRef]
- Katukurunda, S.; Atapattu, M. Water Footprint of Chicken Egg Production under Medium Scale Farming Conditions of Sri Lanka: An Analysis; Conference Paper Presented at the Third International Symposium, South Eastern University of Sri Lanka; South Eastern University of Sri Lanka: Oluvil, Sri Lanka, 2013. [Google Scholar]
- ChoiceMetrics, C. Ngene 1.1.2. User Manual & Reference Guide; ChoiceMetrics: Sydney, Australia, 2016. [Google Scholar]
- Carlsson, F.; Frykblom, P.; Lagerkvist, C.J. Using Cheap Talk as a Test of Validity in Choice Experiments. Econ. Lett. 2005, 89, 147–152. [Google Scholar] [CrossRef]
- Vozmediano, L.; San Juan, C. Escala Nuevo Paradigma Ecologico: Propiedades Psicometricas Con Una Muestra Espanola Obtenida a Traves De Internet [New Ecological Paradigm scale: Psychometric properties with a Spanish simple obtained from the Internet]. Medio Ambiente Y Comport. Hum. 2005, 6, 37–49. [Google Scholar]
- Dunlap, R.E.; Van Liere, K.D.; Mertig, A.G.; Jones, R.E. Measuring Endorsement of the New Ecological Paradigm: A Revised NEP Scale. J. Soc. Issues 2000, 56, 425–442. [Google Scholar] [CrossRef]
- Herzog, H.; Grayson, S.; McCord, D. Brief Measures of the Animal Attitude Scale. Anthrozoos 2015, 28, 145–152. [Google Scholar] [CrossRef] [Green Version]
- Internet World Stats. Available online: https://www.internetworldstats.com/stats4.htm (accessed on 19 September 2019).
- Lancaster, K. A New Approach to Consumer Theory. J. Political Econ. 1966, 74, 132–157. [Google Scholar] [CrossRef]
- Thurstone, L. A Law of Comparative Judgement. Psychol. Rev. 1927, 34, 273–286. [Google Scholar] [CrossRef]
- McFadden, D.; Tye, W.; Train, K. An Application of Diagnostic Tests for the Irrelevant Alternatives Property of the Multinomial Logit Model. Transp. Res. Rec. 1977, 637, 39–46. [Google Scholar]
- Ben Akiva, M.; McFadden, D.; Abe, M.; Bockenholt, U.; Bolduc, D.; Gopinath, D.; Morikawa, T.; Ramaswamy, V.; Rao, V.; Revelt, D.; et al. Modeling Methods for Discrete Choice Analysis. Mark. Lett. 1997, 8, 273–286. [Google Scholar] [CrossRef] [Green Version]
- Hensher, D.A.; Greene, W.H. The Mixed Logit Model: The State of Practice. Transportation 2003, 30, 133–176. [Google Scholar] [CrossRef]
- McFadden, D.L.; Train, K.E. Mixed MNL Models for Discrete Response. J. Appl. Econom. 2000, 15, 447–470. [Google Scholar] [CrossRef]
- Revelt, D.; Train, K. Mixed Logit with Repeated Choices: Households’ Choices of Appliance Efficiency Level. Rev. Econ. Stat. 1998, 80, 647–657. [Google Scholar] [CrossRef]
- Krinsky, I.; Robb, A.L. On Approximating the Statistical Properties of Elasticities. Rev. Econ. Stat. 1986, 68, 715. [Google Scholar] [CrossRef] [Green Version]
- Orduno Torres, M.A.; Zein, K.; Ornelas Herrera, S.I.; Guesmi, B. Is Technical Efficiency Affected by Farmers’ Preference for Mitigation and Adaptation Actions Against Climate Change? A Case Study in Northwest Mexico. Sustainability 2019, 11, 3291. [Google Scholar] [CrossRef]
- McCulloch, V. Public Perception and Poultry Production: Comparing Public Awareness and Opinion of the UK Poultry Industry with Published Data. Animal Welfare Foundation 2017. Available online: https://www.animalwelfarefoundation.org.uk/wp-content/uploads/2017/12/Public-Perception-and-Poultry-Production-Comparing-public-awareness-and-opinion-of-the-UK-poultry-industry-with-published-data.pdf (accessed on 20 September 2019).
Figure 1.
Total percentage of choice of each type of egg in all choice sets.
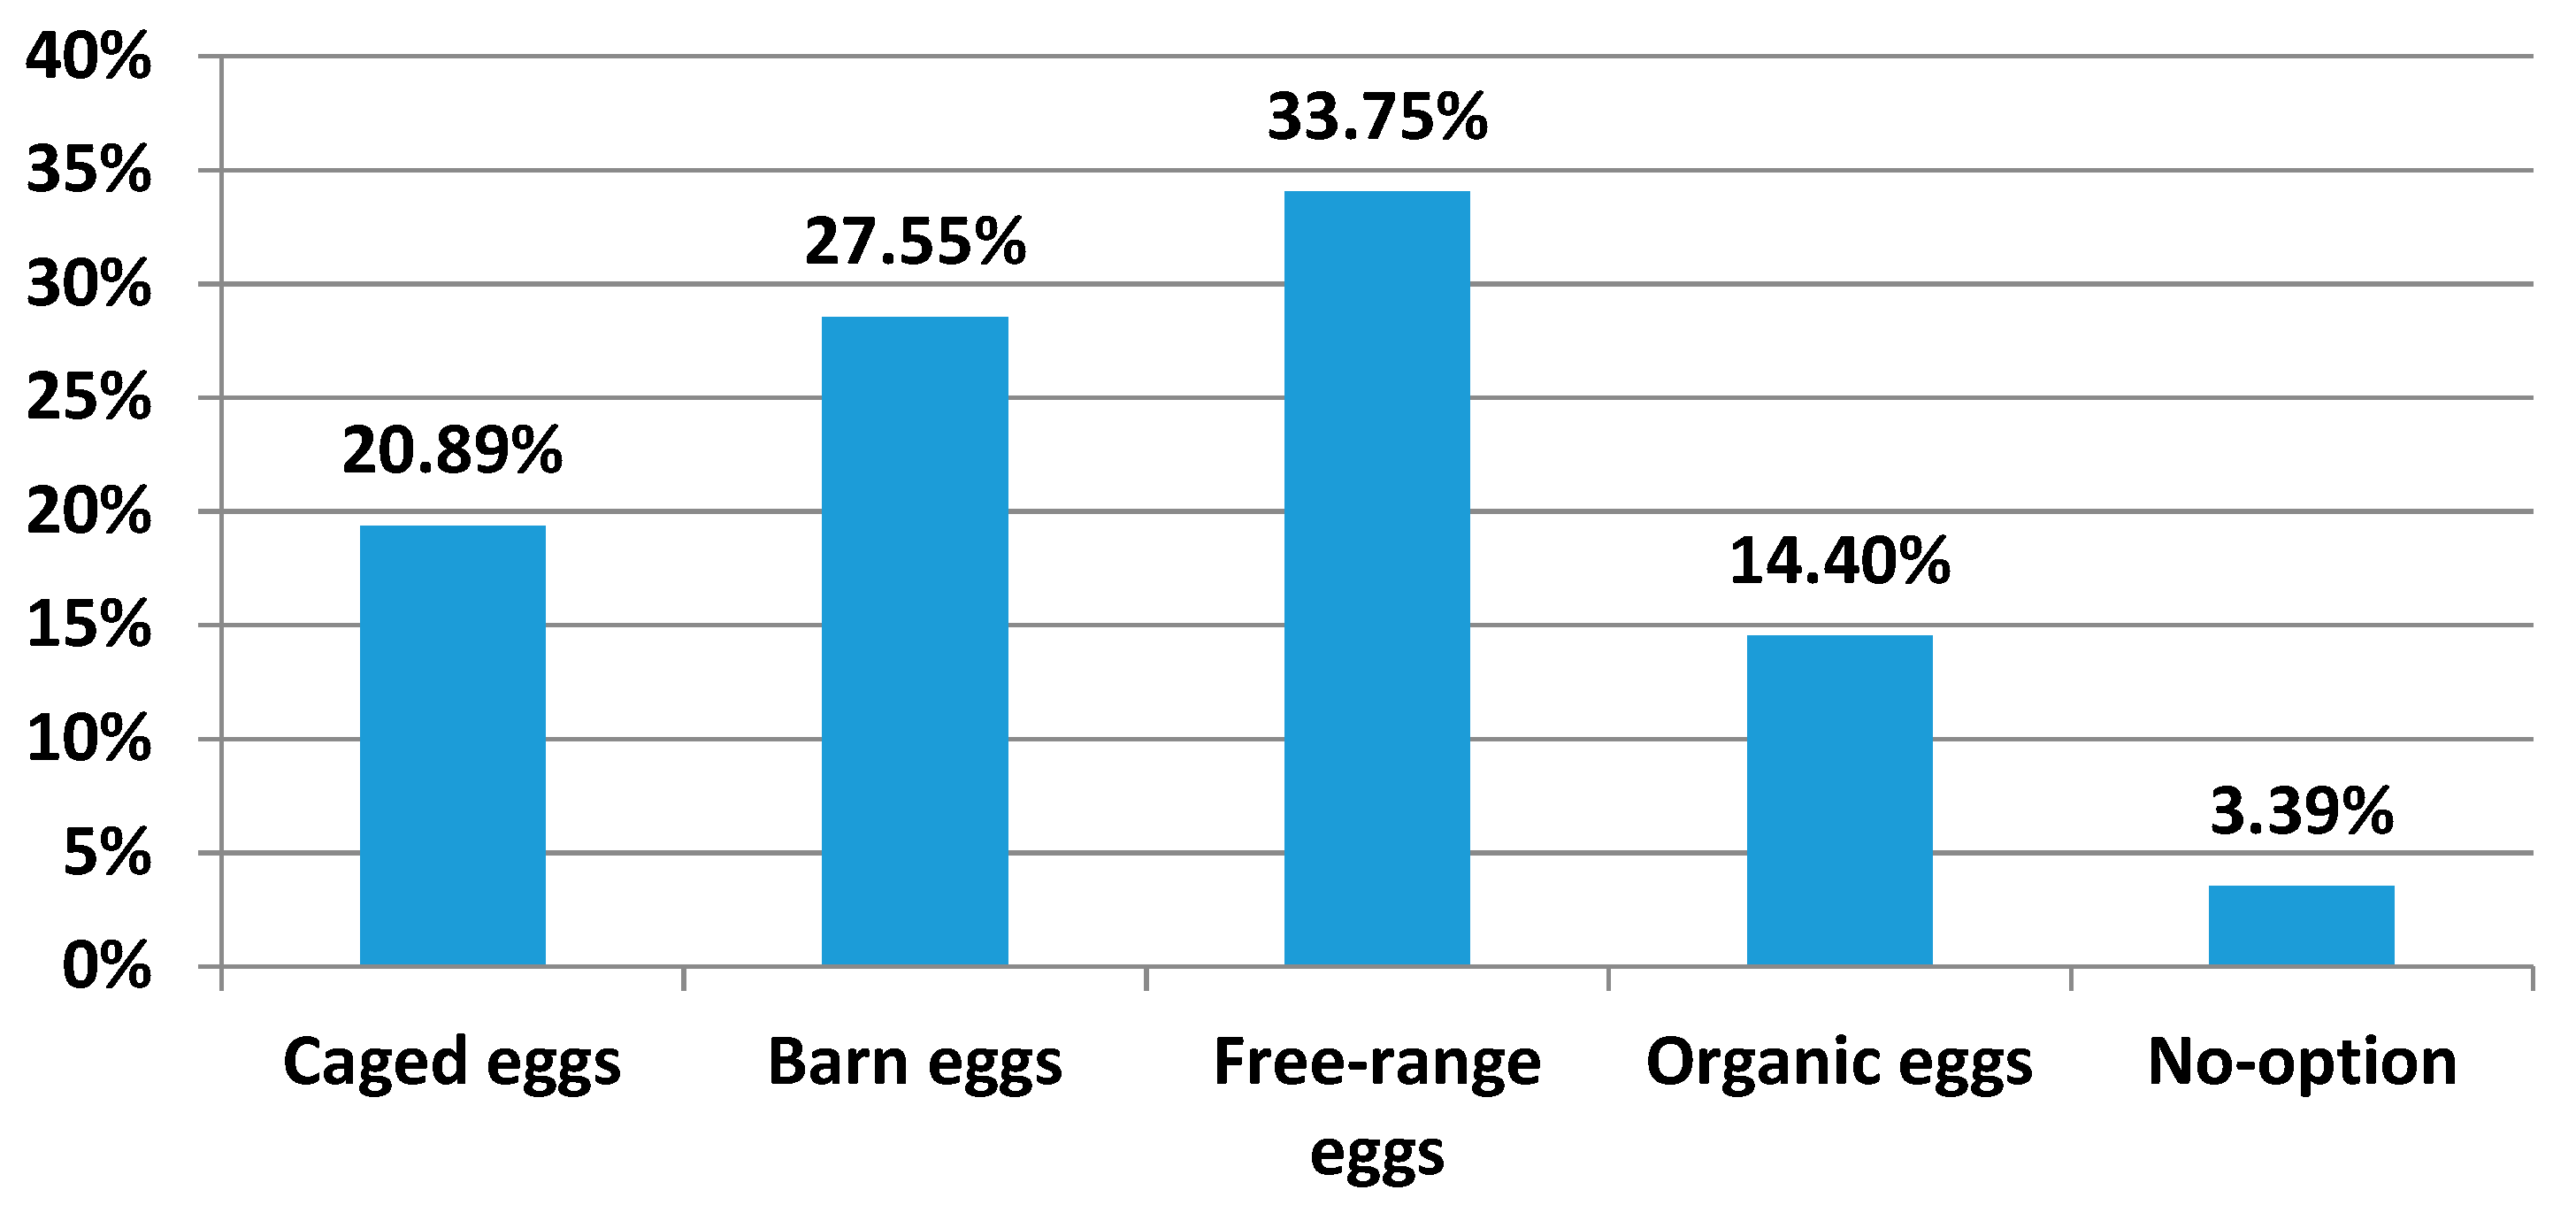
Table 1.
Attributes and levels.
| Attributes | Levels |
|---|---|
| Reduction of greenhouse gas emissions (%) | 0% 10% 20% 30% |
| Reduction of water use (%) | 0% 10% 20% 30% |
| Price (€/6 eggs) | Caged * (€0.70; €0.85; €1.00; €1.15) Barn (€1.20; €1.35; €1.50; €1.65) Free range (€1.70; €1.85; €2.00; €2.15) Organic (€2.45; €2.60; €2.75; €2.90) |
* By “caged” we referred to enriched cages.
Table 2.
An example of a choice set.
| Eggs from Hens Raised in Cages | Eggs from Hens Reared in Barn | Free-Range Eggs | Organic Eggs | None of the Options | |
|---|---|---|---|---|---|
| Price for half a dozen (€/6 eggs) | €0.85 | €1.65 | €2.00 | €2.90 | I would not buy any of the four options. |
| Reduction of greenhouse gas emissions (%) | 10% | 30% | 0% | 20% | |
| Reduction of water use (%) | 10% | 30% | 20% | 0% |
Table 3.
Summary of the socioeconomic and demographic variables by case study.
| Variables | Categories | % of Respondents |
|---|---|---|
| Gender | Female | 49.76% |
| Male | 50.24% | |
| Age | 18–24 years | 10.53% |
| 25–34 years | 17.22% | |
| 35–49 years | 32.54% | |
| 50–64 years | 25.84% | |
| 65 years or over | 13.88% | |
| Average age | 44.31 | |
| Household income | €500–999 | 10.72% |
| €1000–1499 | 20.00% | |
| €1500–1999 | 18.95% | |
| €2000–2499 | 14.93% | |
| €2500–2999 | 13.01% | |
| €3000–4999 | 14.35% | |
| €5000 or more | 3.73% | |
| I do not know | 4.31% | |
| Household size | Average | 3 |
| Educational level | Unfinished primary studies | 1.24% |
| Primary studies | 6.41% | |
| Secondary studies (Professional training, etc.) | 40.38% | |
| Higher education (University/professional training) | 51.96% | |
| Margin of Error | Margin of error for a sample of 1045 respondent, assuming a 95% level of confidence | 3.03% |
Table 4.
Descriptive statistics of individual variables included in the random parameter logit (RPL) model.
Table 4.
Descriptive statistics of individual variables included in the random parameter logit (RPL) model.
| Variable | Description | %Respondents |
|---|---|---|
| Female | It is a dummy variable. It takes the value 1 if participant is a female and 0 otherwise. | 49.76% |
| Age 40 | It is a dummy variable. It takes the value 1 if participant is under 40 years old and 0 otherwise. | 43.15% |
| Lhinc | It is a dummy variable. It takes the value 1 if household monthly income is less than €1500 and 0 otherwise. | 30.72% |
| Environmentalist | It is a dummy variable. It takes the value 1 if the average score of the NEP scale is higher than the sample average score and 0 otherwise. | 50.43 * |
| Animalist | It is a dummy variable. It takes the value 1 if the average score of the animal attitude scale is higher than the sample average score and 0 otherwise. | 46.22% * |
* Items were summed after removing those that were not clearly associated with any factor.
Table 5.
Attribute importance estimates: A random parameter logit (RPL) model.
| Random Parameters in Utility Functions | |||
|---|---|---|---|
| Coeff. | Std. Err. | Pr > [z] | |
| Greenhouse gas (GHG) reduction 10% | 0.19 | 0.13 | 0.14 |
| GHG reduction 20% | 0.29 | 0.03 | 0.00 |
| GHG reduction 30% | 0.38 | 0.03 | 0.00 |
| Water reduction 10% | 0.10 | 0.12 | 0.37 |
| Water reduction 20% | 0.23 | 0.03 | 0.00 |
| Water reduction 30% | 0.35 | 0.03 | 0.00 |
| ASC—Caged | 1.95 | 0.30 | 0.00 |
| ASC—Barn | 3.66 | 0.34 | 0.00 |
| ASC—Free Range | 7.46 | 0.40 | 0.00 |
| ASC—Organic | 0.13 | 0.92 | 0.88 |
| Nonrandom parameters in utility functions | |||
| Coeff. | Std. Err. | Pr > [z] | |
| Price—Caged | −1.47 | 0.27 | 0.00 |
| Price—Barn | −0.74 | 0.23 | 0.00 |
| Price—Free Range | −2.38 | 0.20 | 0.00 |
| Price—Organic | −0.23 | 0.34 | 0.48 |
| Standard deviations of random parameters | |||
| S.D. GHG reduction 10% | 0.53 | 0.54 | 0.32 |
| S.D. GHG reduction 20% | 0.36 | 0.08 | 0.00 |
| S.D. GHG reduction 30% | 0.48 | 0.08 | 0.00 |
| S.D. Water reduction 10% | 0.21 | 0.37 | 0.88 |
| S.D. Water reduction 20% | 1.45 | 0.81 | 0.07 |
| S.D. Water reduction 30% | 0.20 | 0.07 | 0.00 |
| S.D. Caged | 3.72 | 0.17 | 0.00 |
| S.D. Barn | 2.16 | 0.12 | 0.00 |
| S.D. Free Range | 3.73 | 0.14 | 0.00 |
| S.D. Organic | 4.23 | 0.19 | 0.00 |
| Observations | 8360 | ||
| Respondents | 1045 | ||
| Wald Chi2 (24) | 11,442.33 | 0.00 | |
| Log Likelihood | −7733.73 | ||
| Restricted log likelihood | −13,454.90 | ||
| McFadden Pseudo R-squared | 0.4252 | ||
| Akaike information criterion (AIC) | 15,515.50 | ||
ASC: alternative specific constant; S.D.: standard deviation
Table 6.
Means of the willingness to pay estimates.
| Willingness to Pay (WTP) Estimates (€/6 Eggs) | |||
|---|---|---|---|
| Coeff. | Std. Err. | Pr > [z] | |
| Caged without any reduction | 0.46 | 0,17 | 0.00 |
| Barn without any reduction | 3.23 | 2.01 | 0.10 |
| Free range without any reduction | 2.59 | 0.07 | 0.00 |
| Organic without any reduction | −4.83 | 330.93 | 0.98 |
| 10% reduction of GHG emissions in Caged | 0.26 | 0.29 | 0.36 |
| 10% reduction of GHG emissions in Barn | 0.52 | 0.68 | 0.44 |
| 10% reduction of GHG emissions in Free range | 0.16 | 0.16 | 0.30 |
| 10% reduction of GHG emissions in Organic | 1.65 | 234.74 | 0.99 |
| 20% reduction of GHG emissions in Caged | 0.39 | 0.10 | 0.00 |
| 20% reduction of GHG emissions in Barn | 0.78 | 0.67 | 0.24 |
| 20% reduction of GHG emissions in Free range | 0.24 | 0.03 | 0.00 |
| 20% reduction of GHG emissions in Organic | 2.47 | 86.34 | 0.97 |
| 30% reduction of GHG emissions in Caged | 0.51 | 0.12 | 0.00 |
| 30% reduction of GHG emissions in Barn | 1.03 | 0.91 | 0.25 |
| 30% reduction of GHG emissions in Free range | 0.32 | 0.04 | 0.00 |
| 30% reduction of GHG emissions in Organic | 3.25 | 23.91 | 0.89 |
| 10% reduction of water use in Caged | 0.14 | 0.88 | 0.86 |
| 10% reduction of water use in Barn | 0.29 | 3.11 | 0.92 |
| 10% reduction of water use in Free range | 0.09 | 1.84 | 0.96 |
| 10% reduction of water use in Organic | 0.92 | 140.58 | 0.99 |
| 20% reduction of water use in Caged | 0.32 | 0.08 | 0.00 |
| 20% reduction of water use in Barn | 0.64 | 0.96 | 0.50 |
| 20% reduction of water use in Free range | 0.19 | 0.03 | 0.00 |
| 20% reduction of water use in Organic | 2.02 | 38.53 | 0.95 |
| 30% reduction of water use in Caged | 0.48 | 0.12 | 0.00 |
| 30% reduction of water use in Barn | 0.97 | 0.55 | 0.08 |
| 30% reduction of water use in Free range | 0.30 | 0.03 | 0.00 |
| 30% reduction of water use in Organic | 3.05 | 71.05 | 0.96 |
Table 7.
Results of a random parameter logit (RPL) model controlling for some individual specific characteristics.
Table 7.
Results of a random parameter logit (RPL) model controlling for some individual specific characteristics.
| Random Parameters in Utility Functions | |||
|---|---|---|---|
| Coeff. | Std. Err. | Pr > [z] | |
| GHG reduction 10% | 0.22 | 0.03 | 0.00 |
| GHG reduction 20% | 0.33 | 0.15 | 0.03 |
| GHG reduction 30% | 0.44 | 0.03 | 0.00 |
| Water reduction 10% | 0.11 | 0.03 | 0.00 |
| Water reduction 20% | 0.22 | 0.21 | 0.29 |
| Water reduction 30% | 0.35 | 0.08 | 0.00 |
| ASC—Caged | 2.10 | 0.38 | 0.00 |
| ASC—Barn | 3.06 | 0.38 | 0.00 |
| ASC—Free Range | 6.83 | 0.46 | 0.00 |
| ASC—Organic | −2.30 | 0.99 | 0.02 |
| Non-random parameters in utility functions | |||
| Price—Caged | −1.71 | 0.29 | 0.00 |
| Price—Barn | −0.77 | 0.23 | 0.00 |
| Price—Free range | −2.54 | 0.20 | 0.00 |
| Price—Organic | −0.23 | 0.34 | 0.50 |
| ASC—Caged * Female | −0.18 | 0.29 | 0.51 |
| ASC—Barn * Female | 0.10 | 0.20 | 0.60 |
| ASC—Free range * Female | −0.38 | 0.25 | 0.12 |
| ASC—Organic * Female | 0.18 | 0.34 | 0.58 |
| ASC—Caged * Age40 | 0.91 | 0.29 | 0.00 |
| ASC—Barn * Age40 | 1.47 | 0.23 | 0.00 |
| ASC—Free range * Age40 | 2.02 | 0.27 | 0.00 |
| ASC—Organic * Age40 | 2.93 | 0.35 | 0.00 |
| ASC—Caged * Lhinc | 0.42 | 0.29 | 0.14 |
| ASC—Barn * Lhinc | −0.55 | 0.20 | 0.00 |
| ASC—Free range * Lhinc | −1.57 | 0.25 | 0.00 |
| ASC—Organic * Lhinc | −1.12 | 0.35 | 0.00 |
| ASC—Caged * Environmentalist | 0.12 | 0.33 | 0.71 |
| ASC—Barn * Environmentalist | 0.52 | 0.23 | 0.02 |
| ASC—Free range * Environmentalist | 1.02 | 0.28 | 0.00 |
| ASC—Organic * Environmentalist | 1.53 | 0.39 | 0.00 |
| ASC—Caged * Animalist | −0.23 | 0.32 | 0.47 |
| ASC—Barn * Animalist | −0.18 | 0.22 | 0.41 |
| ASC—Free range * Animalist | −0.14 | 0.26 | 0.58 |
| ASC—Organic * Animalist | −0.02 | 0.38 | 0.94 |
| Standard deviations of random parameters | |||
| S.D. GHG reduction 10% | 0.48 | 0.12 | 0.00 |
| S.D. GHG reduction 20% | 0.66 | 0.48 | 0.17 |
| S.D. GHG reduction 30% | 0.62 | 0.09 | 0.00 |
| S.D. Water reduction 10% | 0.06 | 0.11 | 0.00 |
| S.D. Water reduction 20% | 1.01 | 1.46 | 0.48 |
| S.D. Water reduction 30% | 0.24 | 0.12 | 0.06 |
| S.D. Caged | 3.27 | 0.17 | 0.00 |
| S.D. Barn | 2.45 | 0.16 | 0.00 |
| S.D. Free range | 3.43 | 0.18 | 0.00 |
| S.D. Organic | 4.82 | 0.25 | 0.00 |
| Observations | 8360 | ||
| Respondents | 1045 | ||
| Wald Chi2 (44) | 11,512.99 | 0.00 | |
| Log Likelihood | −7698.40 | ||
| Restricted log likelihood | −13,454.90 | ||
| McFadden Pseudo R-squared | 0.43 | ||
| Akaike information criterion (AIC) | 15,484.8 | ||
ASC: alternative specific constant; *: means the product of the two variables.
© 2019 by the authors. Licensee MDPI, Basel, Switzerland. This article is an open access article distributed under the terms and conditions of the Creative Commons Attribution (CC BY) license (http://creativecommons.org/licenses/by/4.0/).
Share and Cite
MDPI and ACS Style
Rahmani, D.; Kallas, Z.; Pappa, M.; Gil, J.M. Are Consumers’ Egg Preferences Influenced by Animal-Welfare Conditions and Environmental Impacts? Sustainability 2019, 11, 6218. https://doi.org/10.3390/su11226218
AMA Style
Rahmani D, Kallas Z, Pappa M, Gil JM. Are Consumers’ Egg Preferences Influenced by Animal-Welfare Conditions and Environmental Impacts? Sustainability. 2019; 11(22):6218. https://doi.org/10.3390/su11226218
Chicago/Turabian StyleRahmani, Djamel, Zein Kallas, Maria Pappa, and José Maria Gil. 2019. "Are Consumers’ Egg Preferences Influenced by Animal-Welfare Conditions and Environmental Impacts?" Sustainability 11, no. 22: 6218. https://doi.org/10.3390/su11226218
Note that from the first issue of 2016, this journal uses article numbers instead of page numbers. See further details here.