1. Introduction
Climate Change is the most important threat to humans and all species on Earth [
1]. A vast collection of scientific evidence shows fast and fundamental changes of the climatic conditions compared to preindustrial times where conditions remained relatively stable during the last 10,000 years, allowing the development of our current civilization. The global combined land and sea temperatures show a warming of 0.85 °C over the period 1880–2012 [
2], sea levels are rising, the polar ice caps are melting and glaciers are retreating almost everywhere in the world. A higher frequency of extreme weather events, such as heat waves, droughts, floods, cyclones or wildfires [
3], is observed and has been related to Climate Change. In the oceans, an increase of carbon dioxide (CO
) concentrations in the upper water column is changing the chemistry of the oceans [
2]. These, and other evidence [
4], have led to a unanimous consensus among the scientific community on the importance of Climate Change and the need to have a better understanding of what is happening so that a rapid global response can be created.
The causes of these changes are anthropogenic: human activities are changing the Earth’s energy budget, mainly through the emission of carbon dioxide (
), methane (
) and other gases which enhance the greenhouse effect and increase the temperature of the Earth. This is the most important, but not the only, aspect of anthropogenic Climate Change which is causing major alterations in the global climate [
2].
Climate Change is transforming ecosystem all over the globe, from polar terrestrial to tropical marine environments [
5]. These changes are altering the biological diversity through extinction, over-exploitation and translocation of species [
6,
7,
8,
9,
10]. The survival of the human species depends on natural systems and the changes produced in the climate are putting those at risk. Further changes will create enormous challenges and costs for societies worldwide, particularly those in developing countries [
11].
The impacts of Climate Change affect almost every aspect of our life: food production, rights to resources, health, economic growth and social issues. The vulnerability and exposure to the negative impacts of Climate Change depend on geographic location, socioeconomic status or ethnic and age structures. Therefore, the impacts will not be shared equally, and it has been suggested that the impacts will be larger for the more vulnerable regions [
12].
There is also a link between Climate Change and social instability [
13] since it can potentially affect food security [
14], water availability (e.g., the Syrian conflict is at least partially caused by a long drought [
15]) and housing [
13]. More frequent extreme weather events such as hurricanes, superstorms or typhoons will damage infrastructures in human settlements [
16]. Climate Change is a factor which aggravates many social problems and will produce large migration flows in the following years [
17,
18,
19,
20].
1.1. Mitigation and Adaptation
Mitigation and adaptation are the main strategies to deal with Climate Change. Their purpose is to limit the consequences of Climate Change by dealing with the causes of the problem (mitigation) and reducing the impact of the consequences which already exist or are expected to occur (adaptation). These strategies can be implemented in all levels of society: from personal habits to family consumption patterns and all the way to local and national governments and international agencies.
The guidelines for a global response to Climate Change were determined at the Paris agreement of 2015 [
21], where 175 Parties (174 states and the European Union) decided to act according to the science of the Intergovernmental Panel on Climate Change (IPCC). The main objective of the Paris agreement is to decarbonize the economy by 2050, a strategy that has been designed to limit the increase of the global temperature below 1.5 °C and limit the impact of Climate Change.
This enormous task requires large transformations in society at all levels (personal, familiar and local, national and international governments) and therefore affects citizens worldwide. Strategies have already been developed at all levels and are being implemented in many countries, but they may not be effective without the necessary social engagement needed to achieve those transformations [
22].
Mitigation and adaptation to Climate Change remain challenging for all societies around the world, and results depend on changes in social behavior [
23]. Citizens need to participate in a sustainable way of life and take responsibility in formulating solutions that link social, economic, environmental and cultural issues [
23,
24].
Progress in Climate Change mitigation and adaptation is slow and is not prioritized by people or governments, which leads to the following paradox: while the science presents solid evidence on the magnitude of the problem, precisely outlines the devastating impacts that Climate Change will have and proposes comprehensive routes to minimize the impacts, societies around the world do not seem to perceive the urgency of the problem and do not consider this issue as a priority for their survival.
1.2. Social Representation and Education
One possible reason behind this paradox may be the misconceptions in the Social Representation (SR) of Climate Change in society. To understand the discrepancy between the scientific “alarm” and the disinterest of the general public, we need to look into the SRs: how they are formed and how they condition the response of the society to this issue.
The SR of Climate Change is our subjective perception of reality and, to great extent, conditions our response [
25]. The SR helps individuals and groups to anchor their position in situations and events relevant to their immediate concerns [
26]. A misalignment between the SR and the reality (based on scientific evidence) will result in a response incoherent with the urgency of the problem.
It is important to understand how the SR is formed. The SR of Climate Change, similar to common culture, is formed through complex and poorly understood processes that integrate, absorb and incorporate new concepts—in this case related to Climate Change—into everyday concepts [
27]. Once the scientific information has propagated into the field of the common culture, the new concept is not a perfect copy of the scientific representation as it becomes a new profane and autonomous theory [
28].
Although this “new” representation contains scientific elements such as concepts, images, data, abstractions, etc., it has now become a SR which no longer responds to scientific logical thinking but is subject to a series of cultural processes that are involved in formalizing common sense. The newly acquired SRs are an interpretative and pragmatic framework which is always present, even to those who only have privileged access to science.
As described above, the scientific representation of Climate Change is in stark contrast to the weakness and inconsistencies of the SR of Climate Change that society might have. The inconsistency of this representation with the scientific reality may explain why skeptic and negationist beliefs still exist. It may also explain why most of the population does not perceive the urgency of the problem and why Climate Change occupies a peripheral place on public and personal agendas.
The results of a recent national survey [
29] show that in the Spanish society almost everybody (8 out of 10 persons) accepts that Climate Change is happening and recognizes its anthropogenic origin. Despite these high values, some doubts on the unanimity of the scientific community with respect to the anthropogenic origin of Climate Change still persists within the SR and, as discussed above, Climate Change is not perceived as a relevant or important problem.
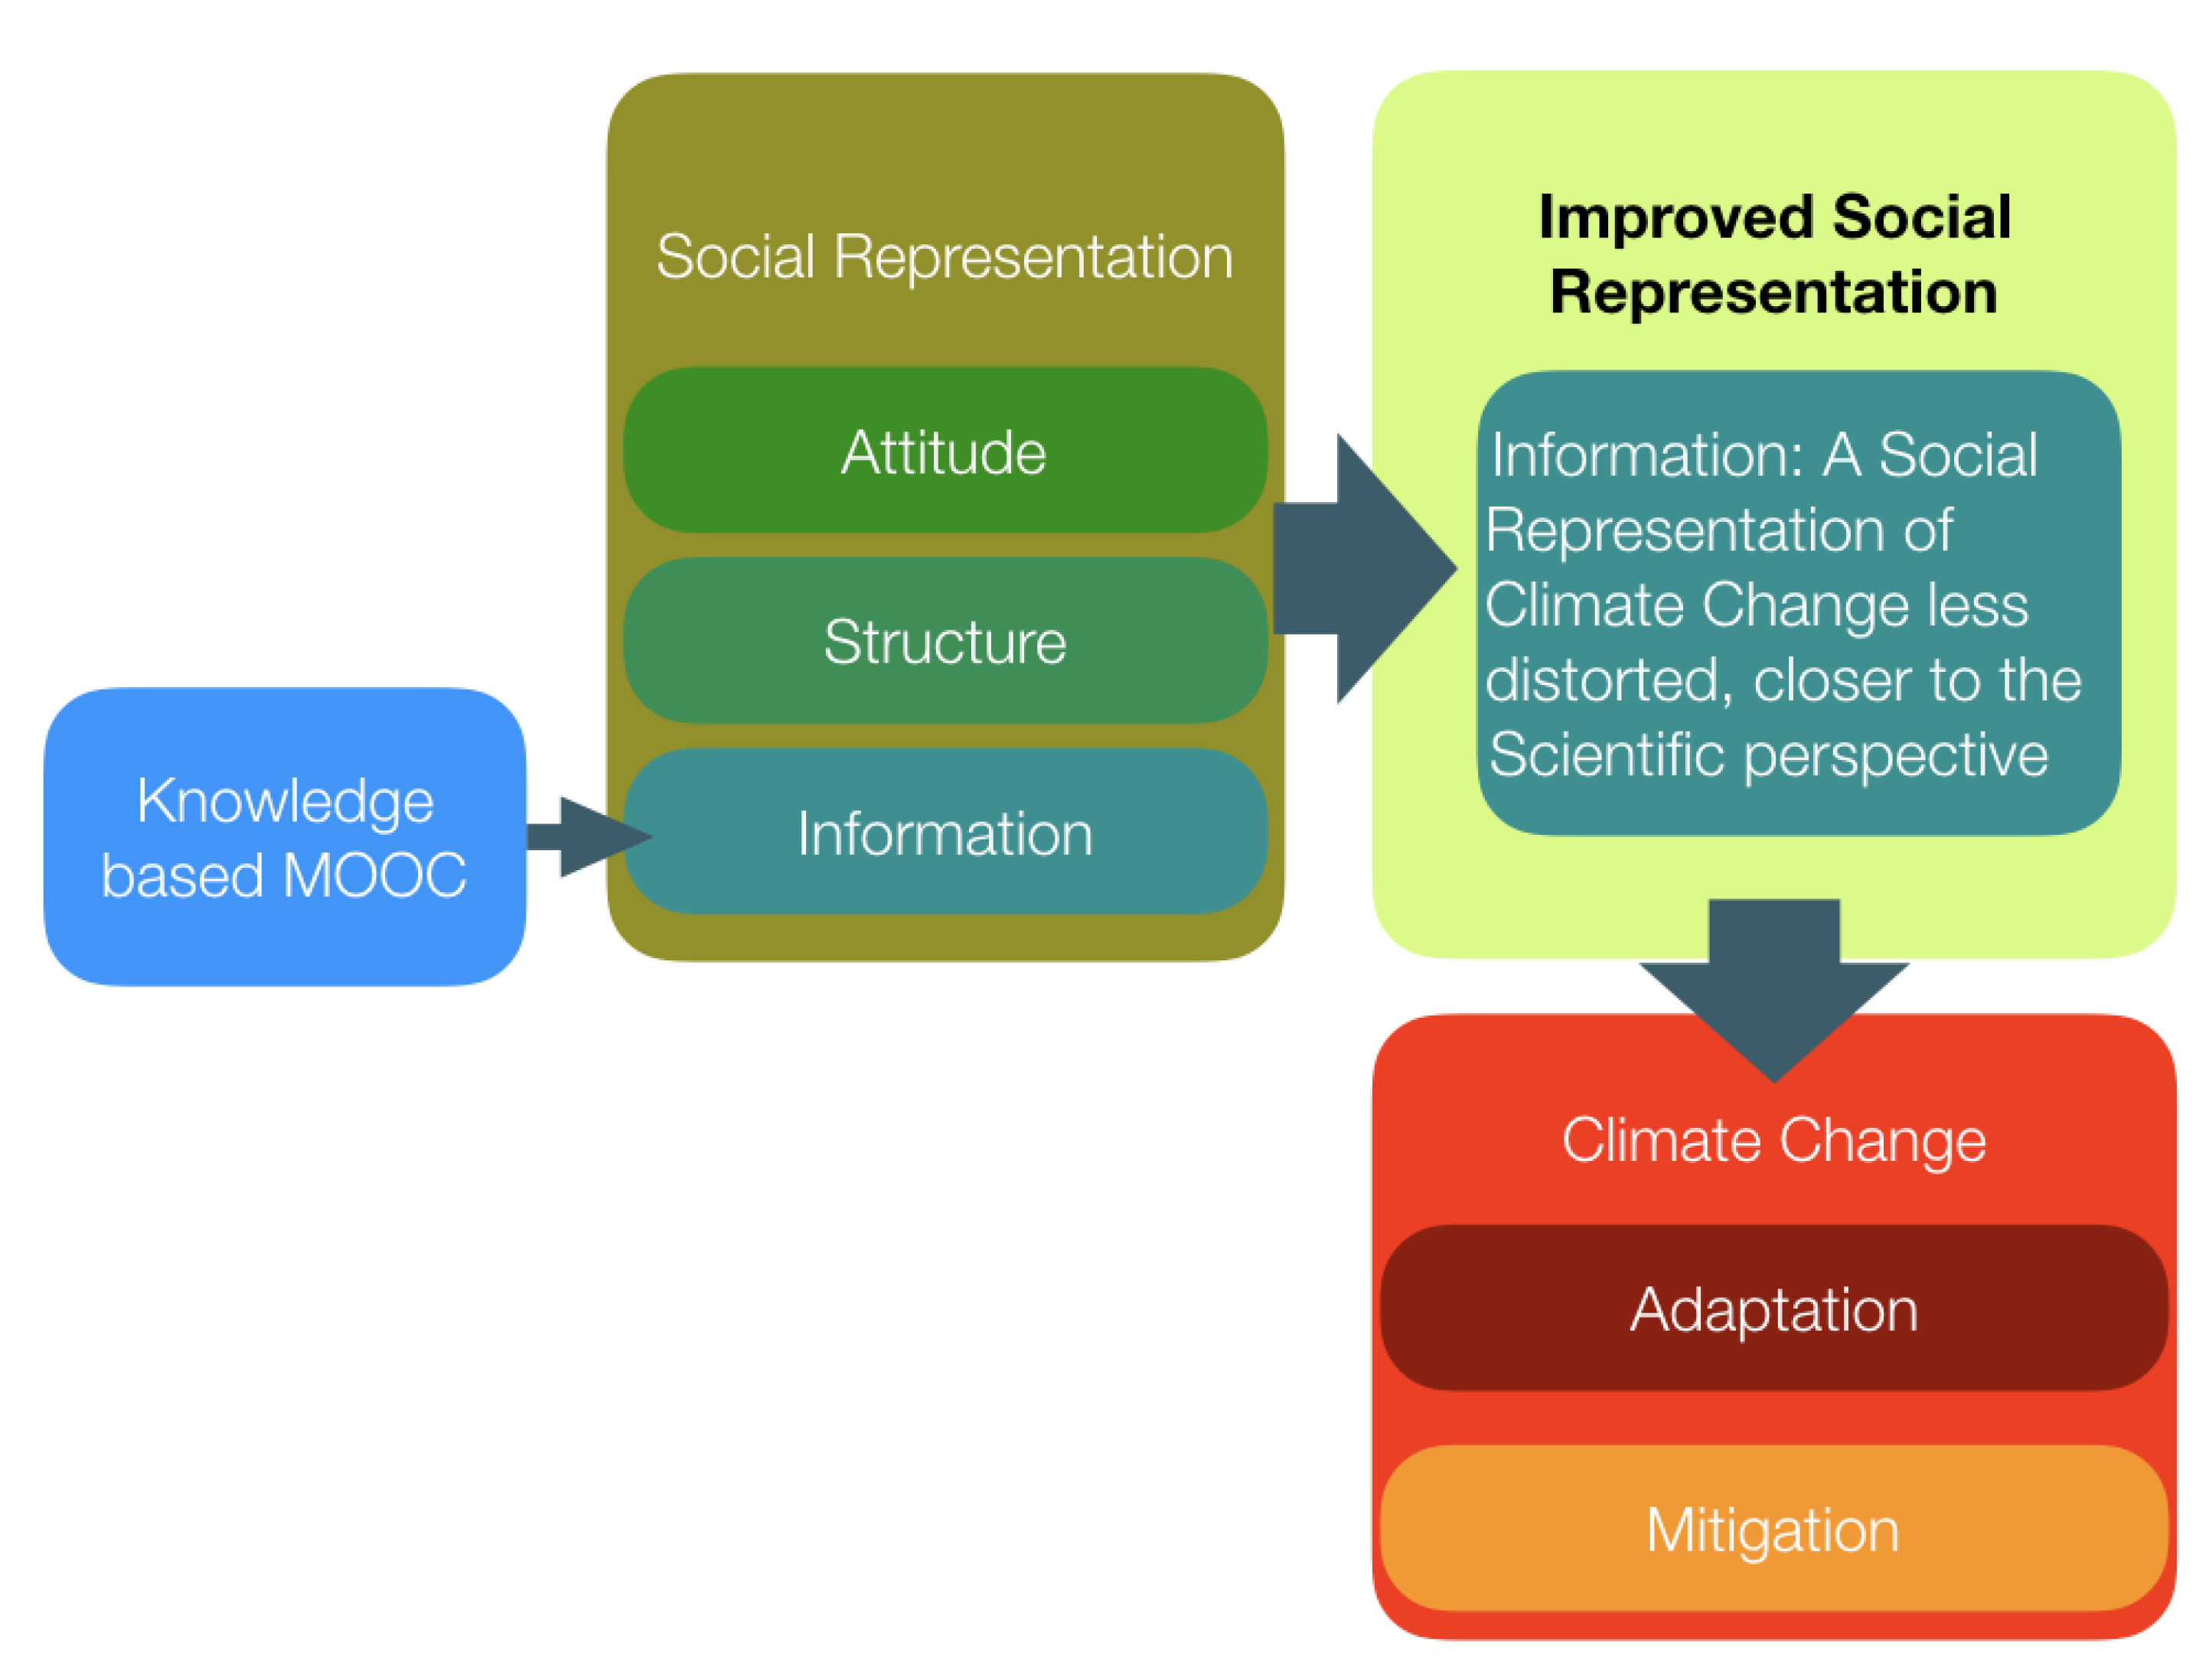
The SRs are a set of structures which have three main components: The information, the structure and the attitude (See
Scheme 1 bellow). The information that feeds the SRs has different origins, some of the elements come from scientific sources, while others come from common culture. The structure of the SR refers to the order and hierarchy of the information where beliefs, values and ideology conditions how this information articulates and gives meaning to the subject of representation. The final element is the attitude, which provides the positive or negative predisposition to the corresponding action [
30].
1.3. The Formation of Social Representation
The formation of the SR of Climate Change has been explored extensively during the last decade by the SEPA-interea research group from the Universidade de Santiago de Compostela (USC) through the Resclima project [
31,
32,
33,
34,
35].
This project has studied and analyzed thoroughly how the SR of Climate Change is formed and how it evolves over time [
36,
37,
38]. Studies about how the SR conditions the societal response to Climate Change are helpful to suggest guidelines for educational [
39,
40] and communication [
35,
41,
42] strategies for mitigation and adaptation.
The Spanish society represents Climate Change in a diffuse way; the representation is often linked to other environmental problems that are not necessarily scientifically related. Within this representation, Climate Change is considered a threat and is associated with negative emotions, but is not perceived with the same urgency and relevance as suggested by scientific evidence [
43]. Again, within the representation, people have the perception that the likelihood of negative impacts in their lives and surroundings is very low, which inhibits a sense of responsibility and personal compromise with the corresponding policies [
44].
In the second part of the Resclima project, a study was launched to test the SR of Climate Change among university students from different degrees. For this, a 32-item questionnaire was designed to evaluate the knowledge of the Information and Structure of the SR. The items were statements on different aspects, actions and knowledge about Climate Change with a Likert scale; the content from the statements were designed according to the principles of the essentials in climate literacy described in a publication by the United States Global Warming Research Program (USGCRP) [
45].
In the questionnaire, some statements were included to detect the prevalence of some of the most extended profane theories on Climate Change: the false causal link between the hole in the ozone layer and Climate Change; the relationship between Climate Change and other phenomena such as acid rain, natural tectonic processes (earthquakes or tsunamis); or the confusion between Climate Change and the greenhouse effect. A good score indicated a correct identification of scientifically correct statements and false associations.
Several findings of the previously mentioned study are relevant for this paper [
37,
46,
47]. The results from the questionnaires applied to students of the Universidad de Granada (Spain) and the Universidade de Santiago de Compostela (Spain) reveal that, even though students from Natural Sciences degrees scored higher in the items related to the knowledge of physical and chemical processes and causes and consequences of Climate Change than students of Social Sciences, they still failed to identify false statements, which means that their SR contains misconceptions. This study, hereafter referred to as the “Resclima study” [
48], describes the technical details of the 32-item questionnaire that we used in this study.
When comparing the results of students in their first and their last years of the same degree (1st and 4th), no significant differences were found, suggesting that the information incorporated into the SR of Climate Change comes from external sources such as informal interactions, media or information from basic education. This same study also shows that certain common misconceptions, such as identifying the ozone layer as a cause of Climate Change, were found among these students even though they were supposed to be scientific literates.
In this paper we try to link two important issues: education and SRs of Climate Change. As SRs condition and determine the response of individuals, and ultimately society, we suggest that they can be improved through evidence based Education.
Education is widely recognized as the main tool to improve the SR and adjust it to the scientific reality [
21]. In their last report, the IPCC identifies and recognizes the role of education in facing this challenge: the task of an educational program, in order to mitigate Climate Change and promote the adaptation to its inevitable consequences, is to represent a global collective problem at individual and social level [
1].
To investigate this, the SR of a group of students was tested before and after a course a MOOC on Climate Change to see if some aspects of the SR improved. If successful, this could prove that education, for this group, is an effective tool for Climate Change mitigation and adaptation, as suggested in previous studies [
49].
It is expected that a more accurate and scientific representation of Climate Change may trigger a better response, coherent with the urgency of the problem. At the same time, this exploration could teach us something about this particular MOOC format as a tool to learn the basic Science of Climate Change. The results of the analysis can also be used later as a guide to further develop other courses and contents.
1.4. Massive Online Open Courses
We are interested in how Education can be used to improve the SRs among different groups. It could be expected that a better alignment between the scientific reality and the SR mediated by Education could mobilize society into climate actions and educational tools that have a wide impact with small resources, such as the Massive Online Open Courses (MOOCs), are of special interest.
MOOCs are a relatively recent online phenomena that have attracted millions of learners around the world. These courses generate considerable media attention and interest from governments, higher education institutions and commercial organizations [
50] and reflect the vastly changing societal needs for knowledge and lifelong learning.
There are several important features that make the MOOC format attractive to educate people in- and outside the traditional educational system. In particular, it may be very good to learn about Climate Change as this topic is not contemplated in the traditional curriculum of compulsory education and is only included in the form of specialized topics or postgraduate programs in universities.
The MOOC format allows a wide reach and customized contents relevant to Climate Change, and therefore has the possibility to have a positive impact on the SR of Climate Change. This is crucial given the urgency of the climate crisis. In the following paragraph, we discuss how this format can have advantages over other formats.
Global reach. The MOOC format has a global reach and can fill the need and scarcity of educational resources on this topic in Spanish, compared to the number of resources in English.
Updated information. The materials can be easily updated. The pace of scientific consensus around the diagnostics and descriptions of Climate Change is much faster than the pace of changes in national curricula. Therefore, it is important to have a course that can provide the most up to date version of the scientific consensus to Spanish speaking teachers worldwide.
An effective transmission of the message. The MOOC uses visual imagery to capture the audience and to communicate the concepts. Long descriptions are avoided and videos are used in all modules of the MOOC. In addition, text materials are available for consultation during and after the course and are valuable resources to enrich teacher’s daily classes. The evaluation of the course is carried out through a multiple response test and a peer-to-peer activity that consisted in searching and analyzing a media story related to Climate Change, paying special attention to identifying the causes and consequences of Climate Change.
There are, of course, some critics to the MOOC format. A major concern that is often raised is that, although a massive number of students enrol in MOOCs, especially since enrolment is free and is as easy as clicking a mouse button, a very small proportion (∼10–20%) completes their courses. Given their large impact, MOOCs have been the subject of a large debate (e.g., [
51]), but are widely considered powerful pedagogical instruments to democratize access to high-quality education in developing and underdeveloped countries [
52] as learning content is available to anyone with an Internet connection.
2. Methods
In this paper, we explore the role of Education in improving the SR of Climate Change. In particular, we look into the first aspect of SRs, knowledge, as a tool to refute common misconceptions and bring the SR closer to the scientific reality. Knowledge of the concepts, causes, consequences and impacts is essential to adjust the SR, which eventually may trigger individual action and mobilize society.
2.1. Design of the Study
To test if there are changes in the SRs after taking the MOOC, we applied a pre-experimental design, without control group and with pre- and posttest measurements [
53] to the participants of the second edition of the MOOC “Awareness and training on climate change for Primary and Secondary teachers” [
54] (hereafter referred to as “the MOOC”), hosted in the MiriadaX portal (
https://miriadax.net/). The pre-experimental design of minimum control (without control group) [
53,
55,
56] was selected as we investigate into the evolution of this group after taking the MOOC. A comparison of our MOOC sample against a sample of student made in a previous study is presented in the first part of the study.
Our main research questions are the following:
Does a knowledge-based MOOC affect the Information of the SR as measured with our questionnaire?
Is the effect of the MOOC equal for all four main areas (definitions, causes, consequences and responses) used in the design of the MOOC?
Are there significant differences in the group of students taking the MOOC?
2.2. Characteristics of the Sample
Five hundred thirty (530) people who took the MOOC participated voluntarily in our study, which took place during the second edition of our MOOC starting in March 2019. The pretest was carried out before starting Module 1 of the second edition of the MOOC, and the posttest took place six weeks later at the end of the modules of the MOOC. These students came from 24 countries, mainly from Latin America and Spain, and to a less extent from Italy, Portugal and Africa (
Table 1). Students were 52% female and 48% male. Occupations of participants varied, with 46.5% being teachers, 26.4% students and the remaining 27.1% were non-teaching professionals. All participants from Africa were teachers. The age of the participants ranged from 14 to 77 (Mean = 36.1, Standard Deviation = 13.6). It is worth noting that the percentage of participants with university education is relatively high, being 72%. Two hundred fifty-five (255) participants completed the posttest after finishing the course (April 2019). The final questionnaire was exactly the same as the initial one. The difference in the number of students who completed the pretest and posttest is indicative of the MOOC completion rate.
We compared results from our sample with those obtained by the research group from the USC in the “Resclima study” [
48]. They applied a non-probabilistic and intentional sampling to four hundred eighty-eight college students, with a mean age of 20.5; 42.8% of the participants were men and 57.2% were women.
2.3. Evaluation Instrument
The questionnaire employed in the present study was developed during the Resclima project at USC [
46,
47,
48] and was used to test the first dimension of the SR among students of a MOOC on the Science of Climate Change. The technical details of the questionnaire can be found in the “Resclima study” [
48]. The 32 items of the questionnaire can be found in
Appendix A.
Our questionnaire has two different sections. The first section is a demographic analysis of the participants including questions related to age, sex, level of studies, country of origin, etc. The second section, which has been introduced previously in the “Resclima study” [
48], consists of 32 items designed to explore the participant’s interactions between scientific and common culture. The questionnaire measures student’s competence through the identification of the scientific veracity of a series of statements, which are classified into four areas of knowledge related to the design of MOOC materials.
Area 1. Physical processes related to CC (8 statements)
Area 2. Consequences of CC (10 statements)
Area 3. Causes of CC (10 statements)
Area 4. Responses to CC (4 statements)
To assess the degree of knowledge of participants, the close-ended statements were based on a Likert scale of four categories: “Totally true” (TT), “Probably true” (PT), “Probably false” (PF) and “Totally false” (TF). This scale allows measurement of the scientific accuracy of the answers on a scale from 1 to 4, with 4 being the maximum value of agreement “accuracy” between scientific culture and common culture. The correct answers are based on the reports of the Intergovernmental Panel on Climate Change [
1]. We purposely excluded the option “Don’t know/don’t answer” to avoid non-reflective or evasive responses. The final score is an indication of the participant’s ability to read, interpret and assess scientific texts properly. High scores indicate a more accurate scientific view, while low scores indicate a prevalence of false information. The index of reliability of the instrument was determined by calculating the alpha coefficient of Cronbach, which had a value of 0.88. Scores of 0.7 or higher are considered reliable [
57]. The results of the questionnaire were exported to CSV format to be analyzed in SPSS, version 25.
2.4. Training Program: A MOOC on the Science of Climate Change
The MOOC titled “The Science of Climate Change for primary and secondary teachers” has a duration of six weeks and its first edition was launched in 2018 under the banner of the Universidad de Salamanca and through the MiriadaX platform. This MOOC was designed and developed by some of the authors of this paper at the Universidad de Salamanca [
58].
Prior to the elaboration of our MOOC, we observed an overall scarcity of learning materials related to Climate Change available in Spanish, a language with 480 million speakers with native competence and 577 million people speaking Spanish as a first or second language [
59]. Therefore, this course was designed to target a broad audience: Spanish speaking teachers worldwide. The MOOC uses a traditional top-down structured design approach (xMOOC type), which is based on the interaction with content and essentially adopts a behaviorist learning approach [
60].
The main objective of the MOOC “The Science of Climate Change for primary and secondary teachers” is to provide fundamental scientific knowledge and create awareness on Climate Change. The four main questions that the course tries to answer are:
The first three questions are answered through scientific knowledge. The last one is related to the concepts of adaptation and mitigation, and how education can (and must) help to create citizen awareness, promote a better understanding of the issue and help build capacities and strategies to successfully face this global problem.
Our analysis of the knowledge of the SR of Climate Change is made using the four categories that were used to design the MOOC. The way we refer to these categories are: definitions, causes, consequences and responses.
The contents of the course were structured in seven sequential modules that also had a discussion forum where participants were able to interact with each other (
Table 2). During the course, participants must follow a predetermined schedule and have to be positively evaluated in a test at the end of each module and in a peer-to-peer activity.
To stimulate engagement and ensure instructional quality, several strategies were followed: (a) each module has short and high quality videos presented by teachers, but avoiding excessive use of the “talking head” format; (b) the contents of the course are contextualized, describing and analyzing real and concrete problems that students can relate to; (c) the course has been constructed based on updated empirical evidence following the scientific consensus of the IPCC reports; (d) the language used is simple but rigorous, and a positive narrative is used to transmit scientific rigor and urgency, but also hope and positivism; and (e) the course avoids complex representations and does not include complex or irrelevant graphics, always using meaningful and high quality imagery that can be used by teachers in their classrooms [
52,
61,
62,
63,
64].
To this day, the MOOC has been offered in two editions (June–August 2018 and March–April 2019) and this study was carried out during the 2019 edition.
2.5. Data Analysis
We first compared our results with previous results of other groups of university students [
46,
47,
48]. Afterwards, the evolution between the pre- and posttest was analyzed for our sample data only. This provides insight into how some misconceptions can be corrected and updated through a MOOC course. The data also show different improvements for different subgroups of the sampled group, indicating a variable level of adaptation to the format of the course.
Since answers to the questionnaires are not paired with students id, because they are anonymous, the Kolmogorov–Smirnoff test was used to determine the normality of the variables and all the test results had p-values , suggesting that our data do not present a normal distribution. For the hypotheses contrast, we applied the nonparametric Mann–Whitney U t-test, this t-test compares the distributions of two unmatched groups when data are not normally distributed. The Mann–Whitney U t-test resulted in a p-value , which indicates that the distribution of the criterion variable is significantly different when comparing pretest and posttest. The level of significance used in all contrasts is analyzed under 5%.
In all cases, the calculation of the significance of the differences was accompanied with the calculation of the effect size based on the Cohen d-statistic [
65,
66]. Therefore, differences between the pre- and posttest were not only based on the statistical criteria provided by the hypothesis contrast, but also on the amount of effect existing in the particular contrast. These differences were considered as small
, moderate
or big
. All hypothesis contrasts were accompanied by statistical power, which is the ability of a test to detect differences, conventionally 80%
indicates that there is a 20% probability of accepting the null hypothesis when it is false [
67].
3. Results
We start the analysis by comparing the results from our sample to the sample from the “Resclima study” [
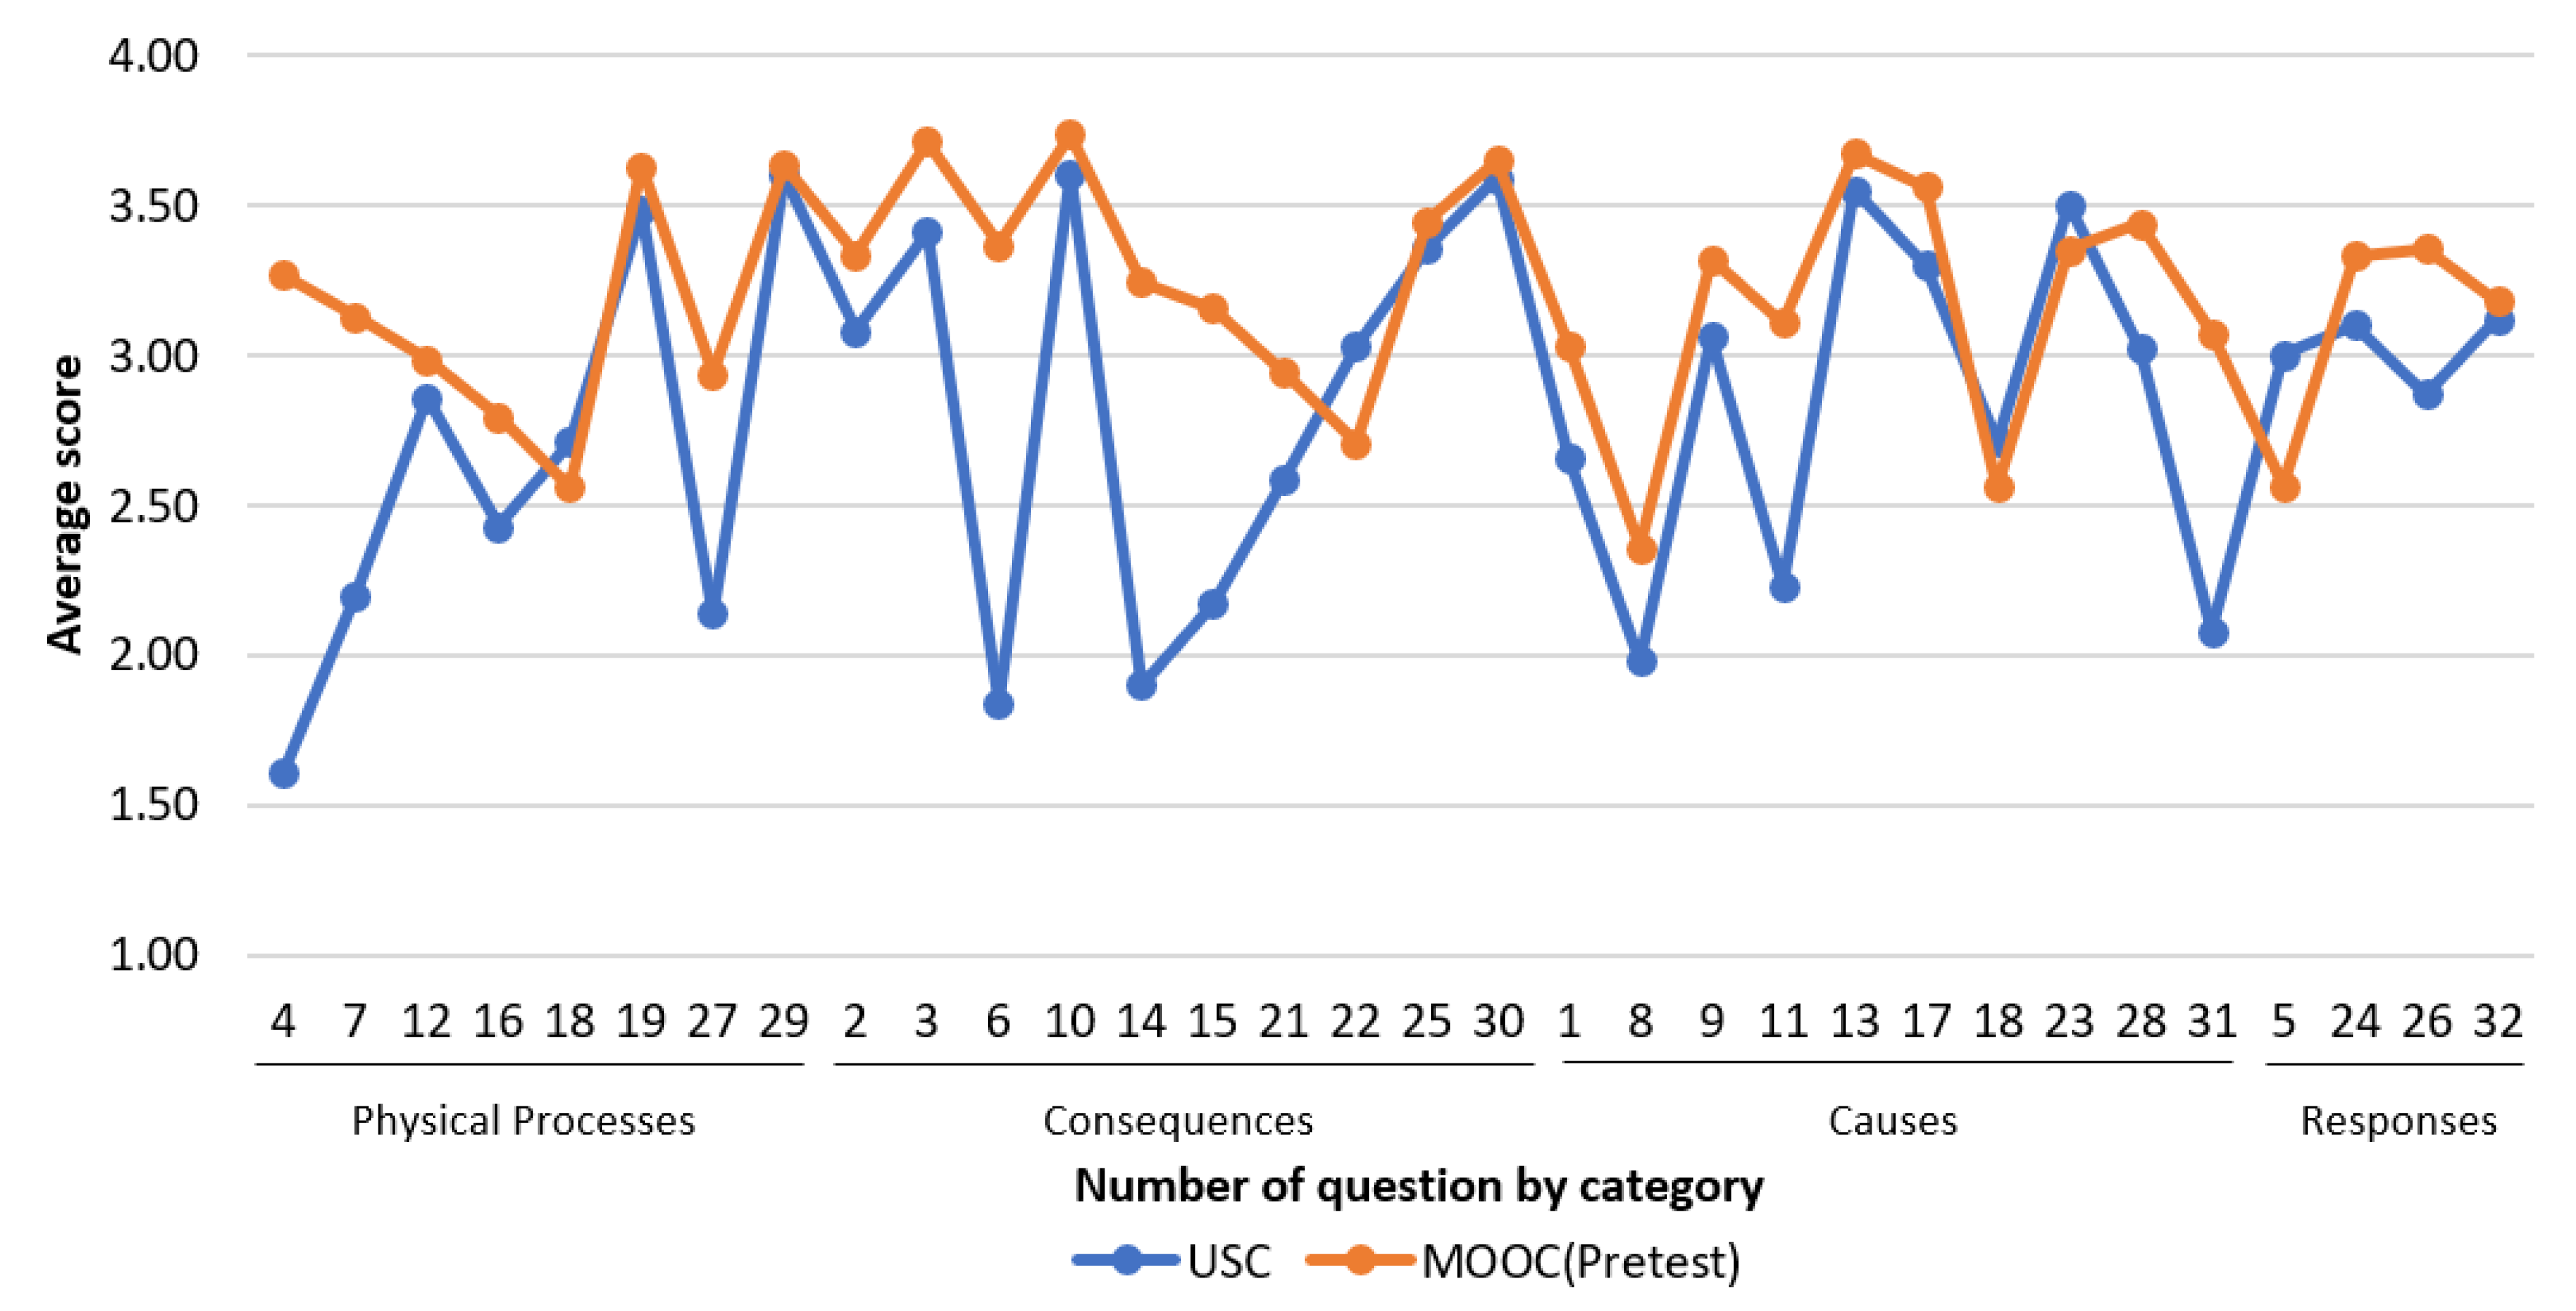
48]. We use the answers from the pretest of our MOOC sample and compare the score for all 32 statements in the questionnaire. The purpose of this comparison is to establish a relation between the SR in our MOOC sample, as measured with the questionnaire, and the reference study.
Figure 1 shows the score for each question where 4 corresponds to a correctly classified statement and 1 to an incorrectly identified statement. The results are grouped according to four areas which correspond to the four basic questions used to design the MOOC: “What is Climate Change? (Physical processes)”, “What are its causes? (Causes)”, “What are its consequences? (Consequences)” and “What can we do? (Responses)”. Comparison of results of the MOOC with the previous study reveals a similar overall trend in the average score of participants, although participants of the MOOC generally have a higher average score.
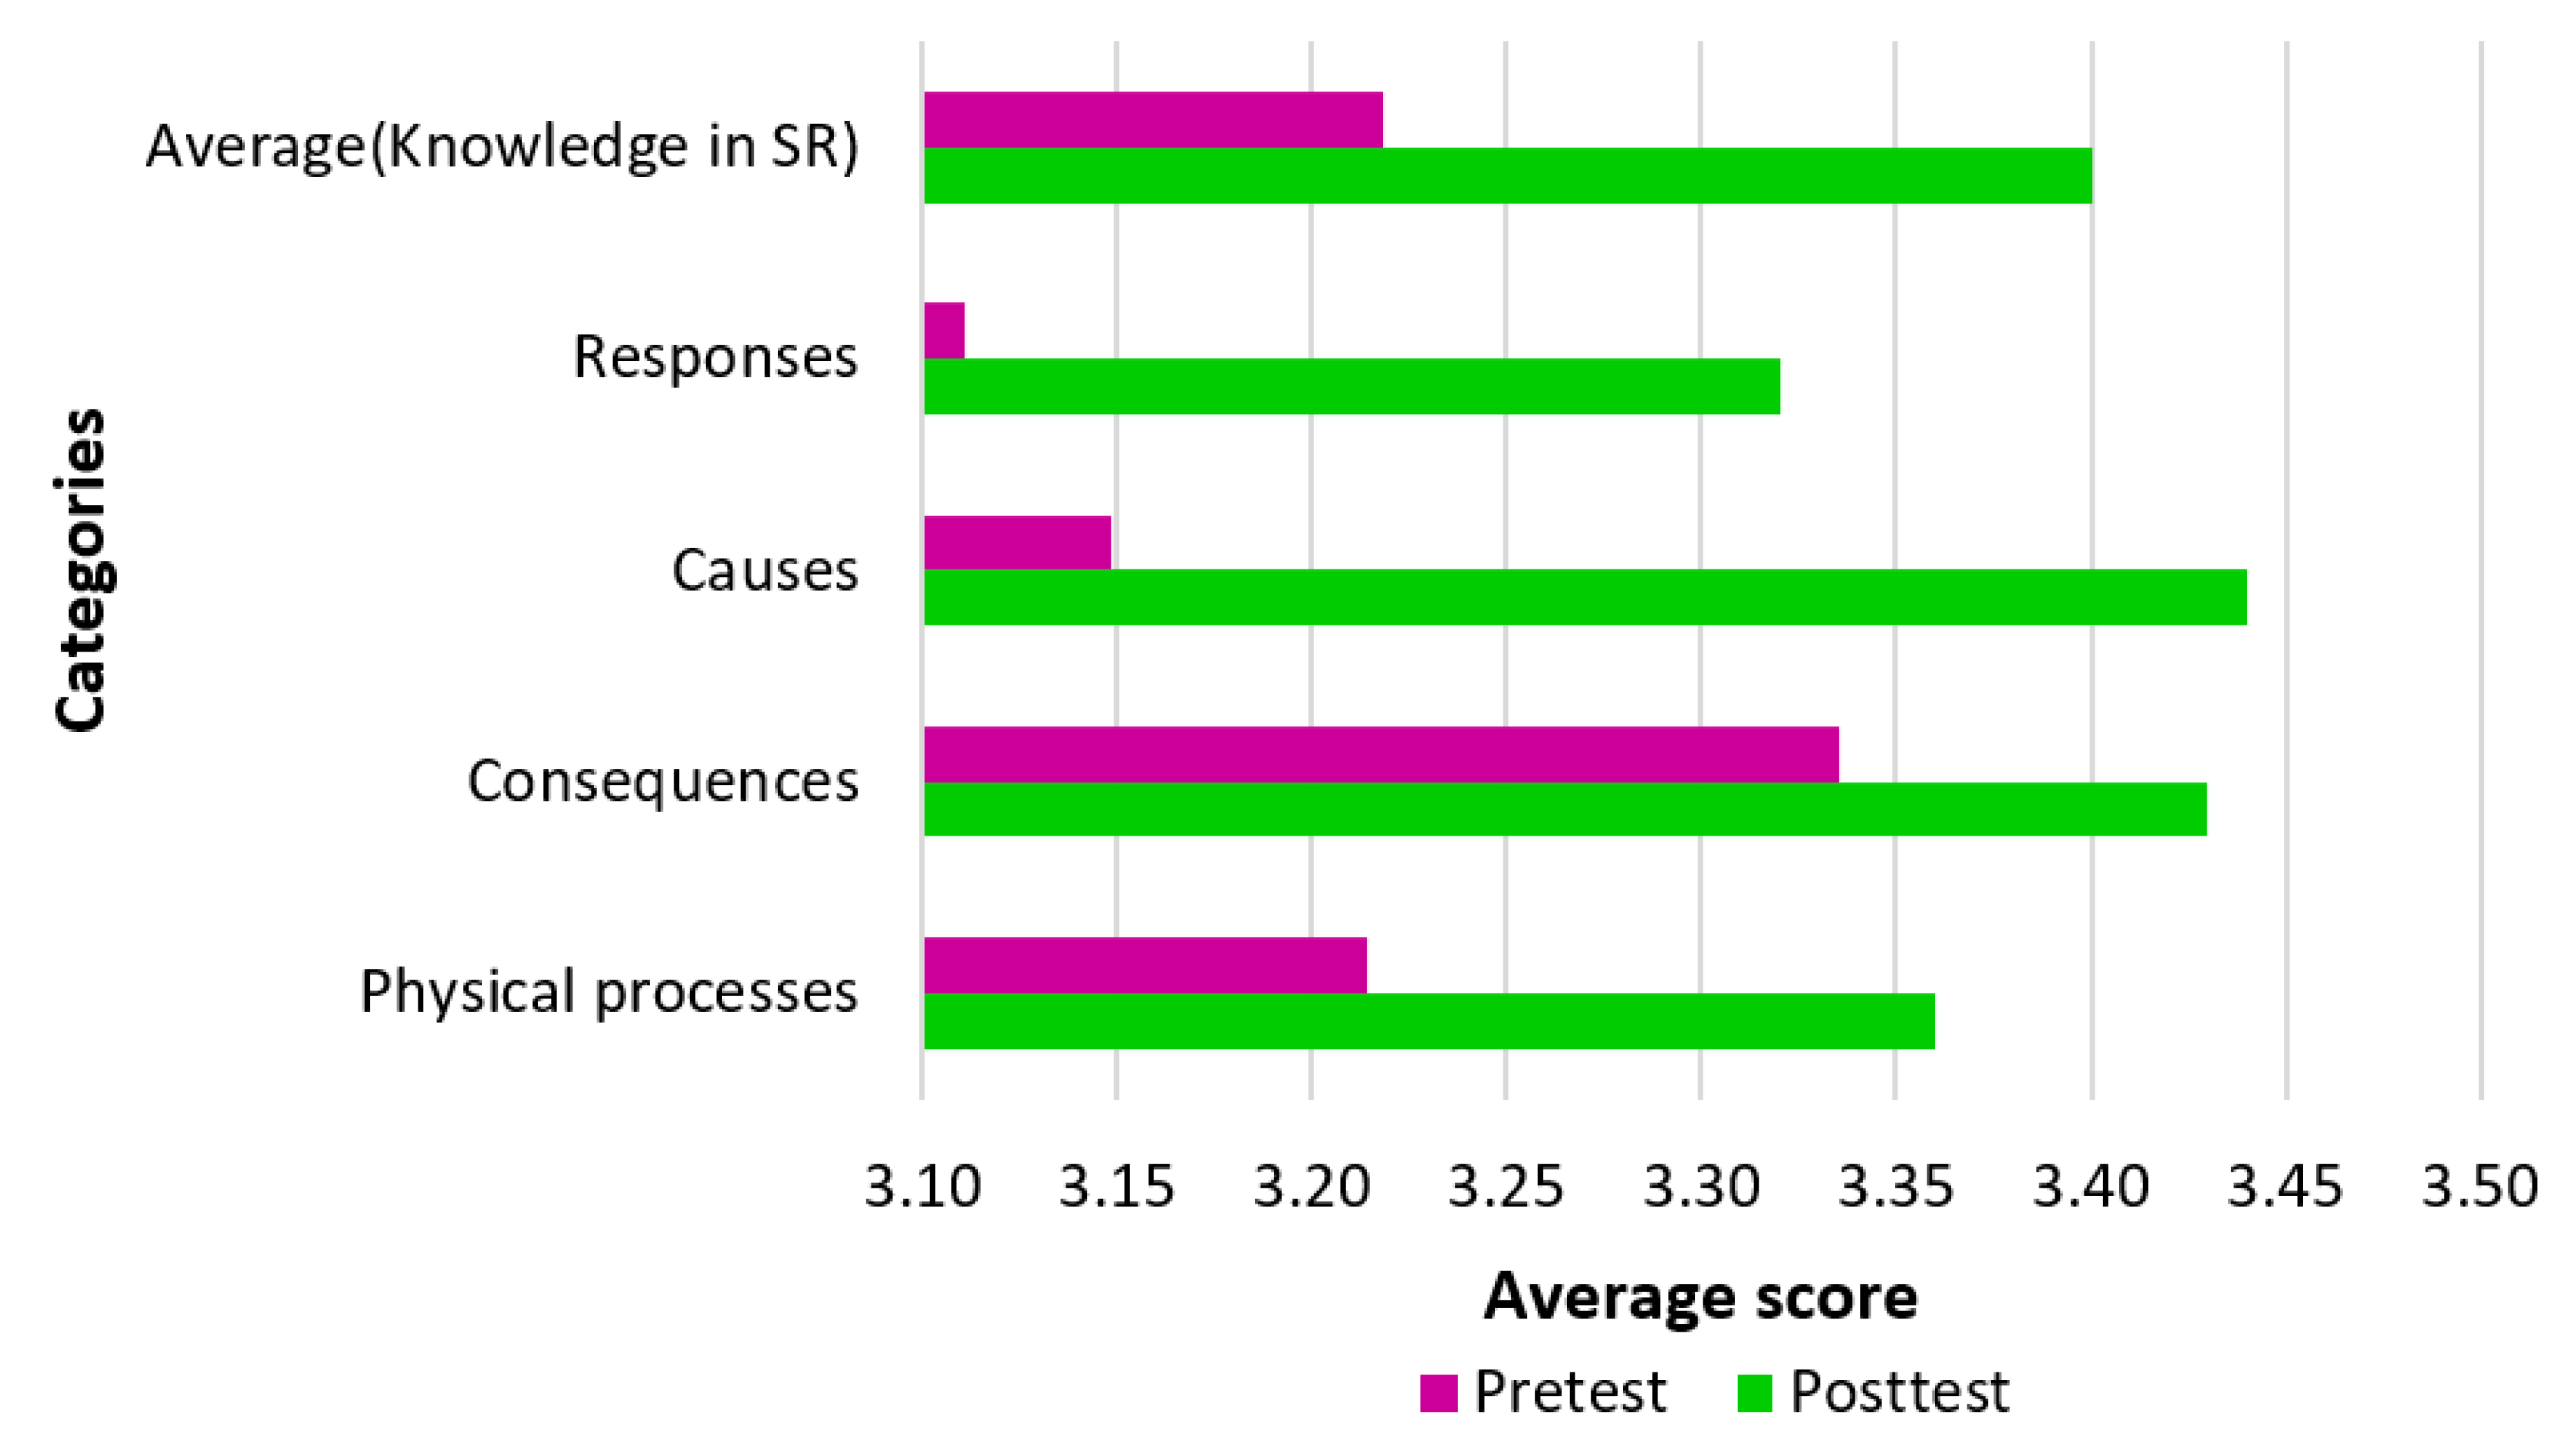
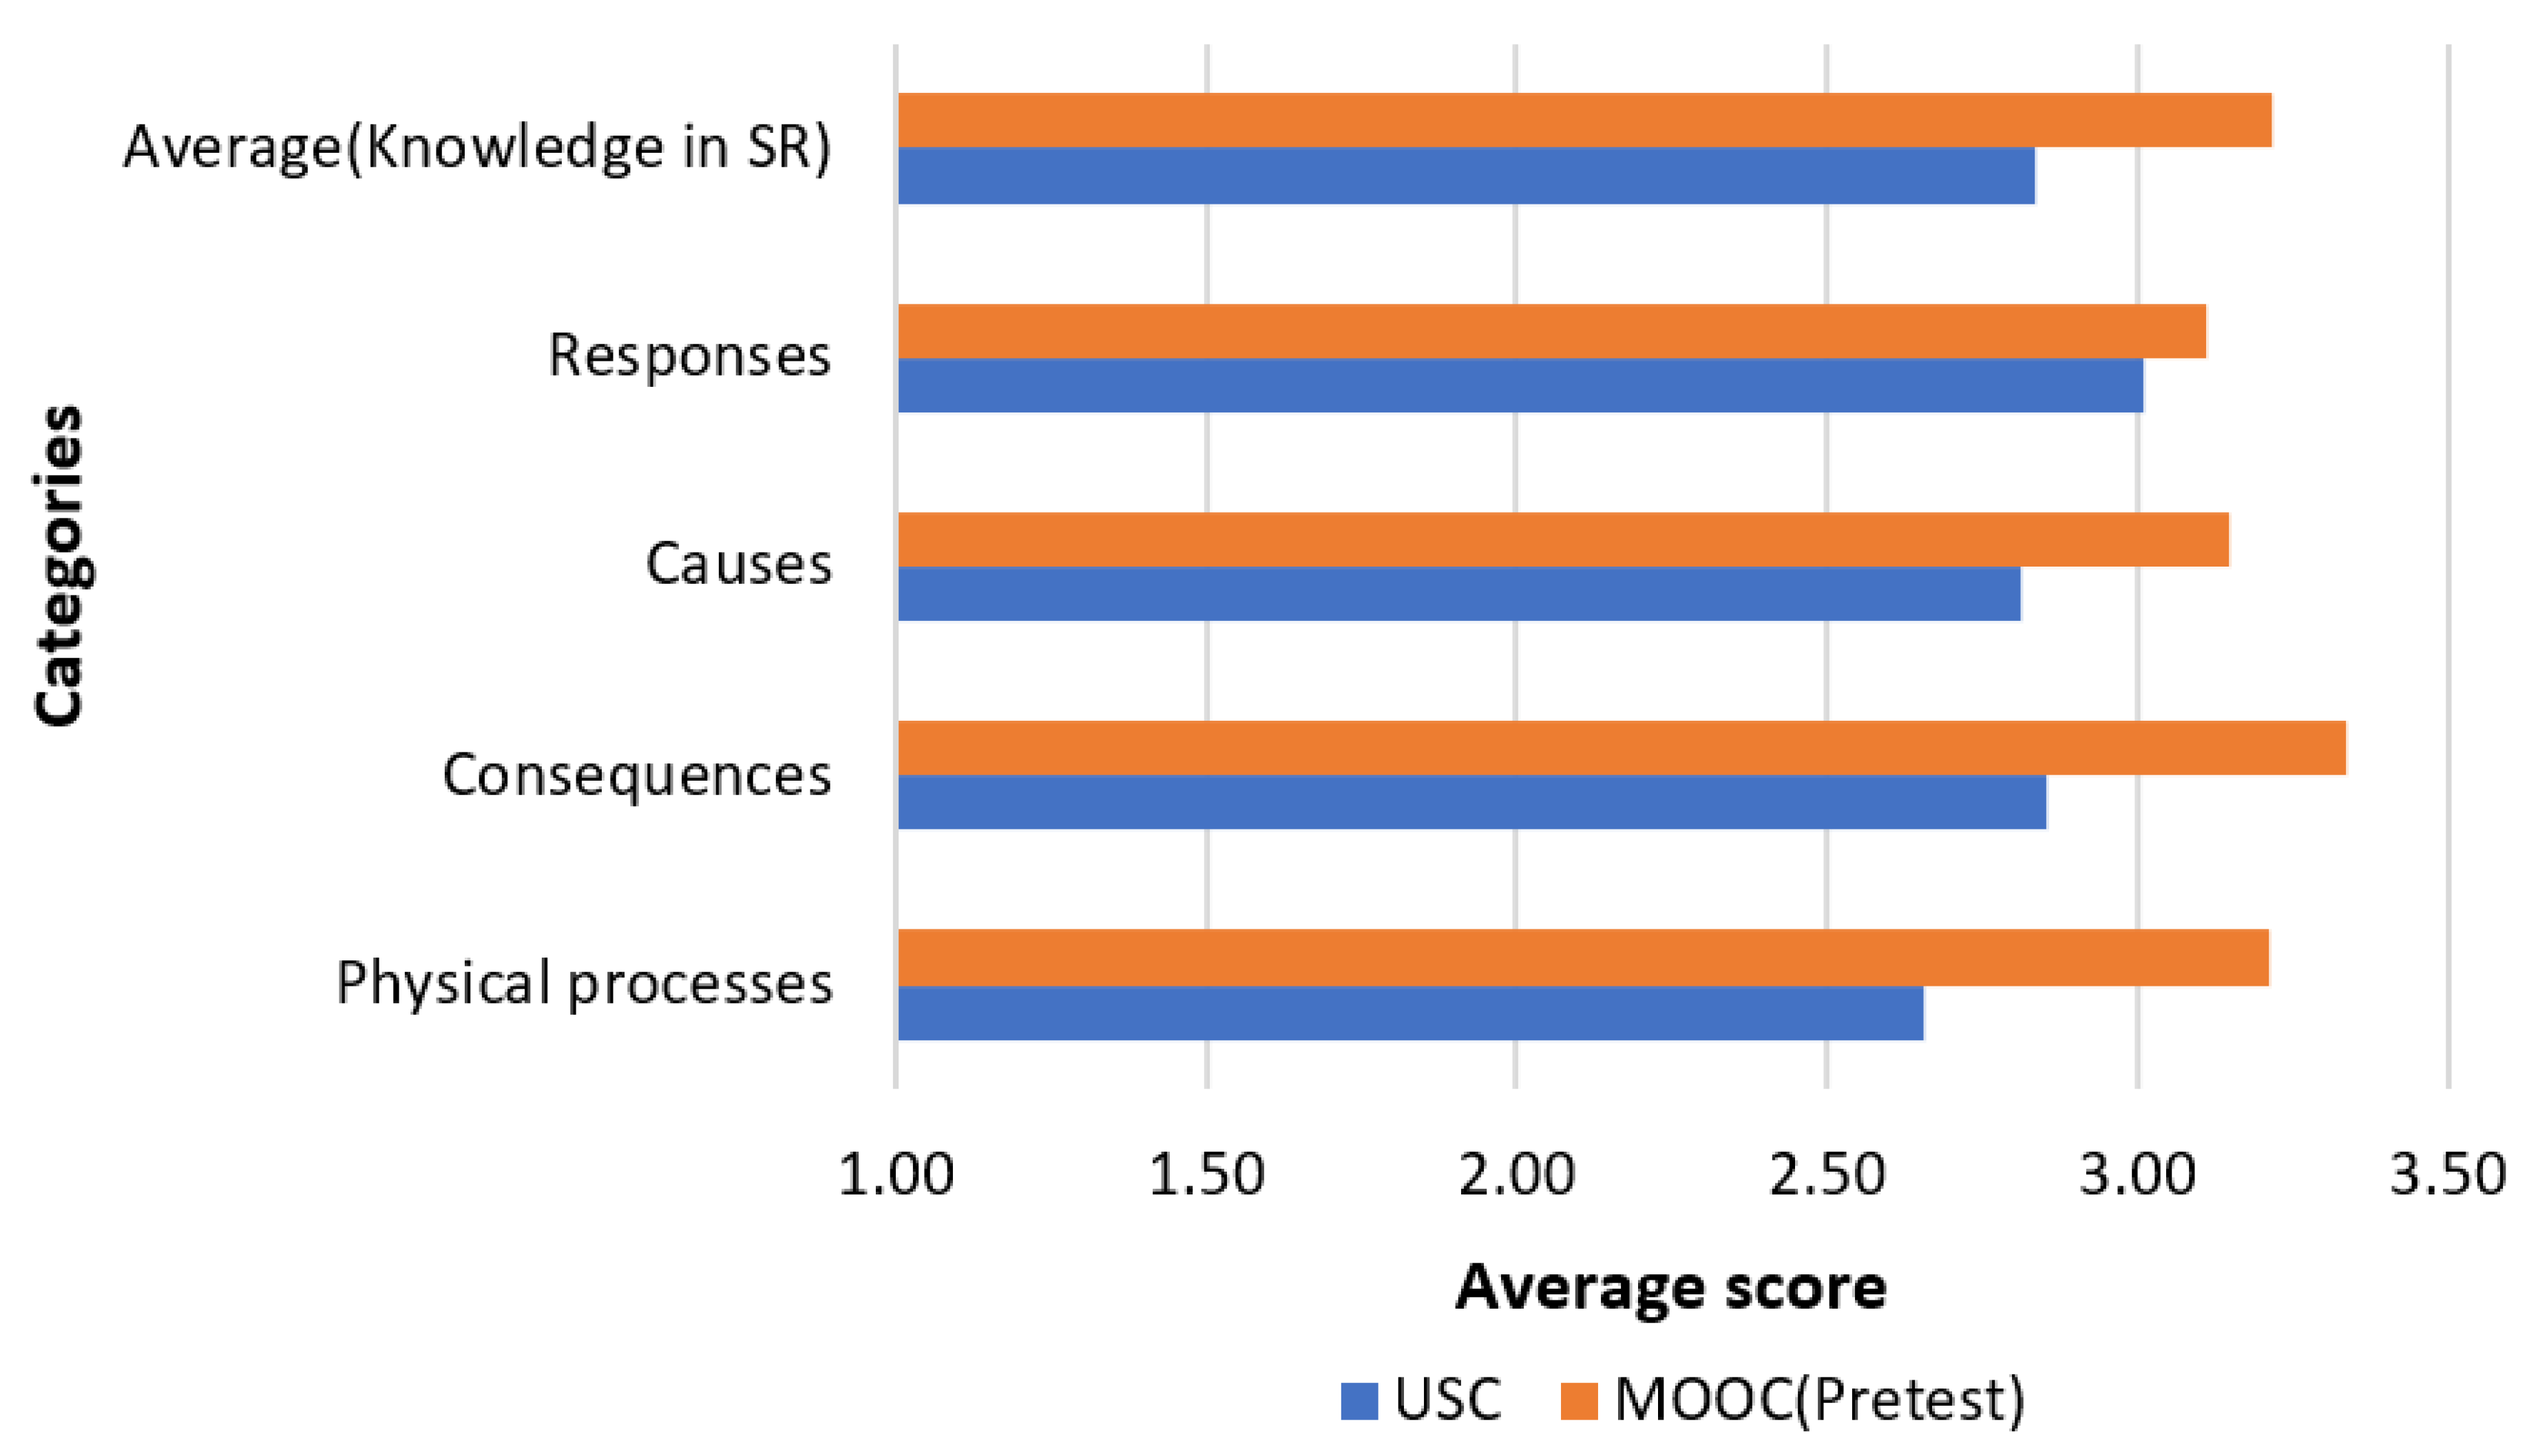
Figure 2 shows the same comparison, but now we show the overall average and the grouped average of the four previously mentioned areas, where the average in the four areas represent the variable dependent “knowledge in SR”. When comparing the average score of each of the four areas between the MOOC and the “Resclima study” it became clear that participants of the MOOC scored higher in the areas of physical processes (3.21 vs. 2.66) and causes (3.15 vs. 2.81) while scores for the areas of consequences and responses are very similar.
The results of the pretest are an indication of the initial SR of Climate Change, where low scores suggest the prevalence of misconceptions such as the erroneous idea that the hole in the ozone layer is a consequence of Climate Change. The initial comparison with the previous study excludes any major peculiarity of our sample.
After this initial comparison, we focus on the MOOC group and the evolution of the SR. Once the students completed the pretest, they started the MOOC course. The pace of the course was one module per week and after the sixth week (the last) the posttest was submitted. This test was mandatory to finish the course and all the people who performed the posttest finished the course.
As a first result we show the comparisons between the pre- and posttest. One of the main objectives of this study was to find out if participants of the MOOC improved their knowledge on concepts related to Climate Change given the characteristics of the sample.
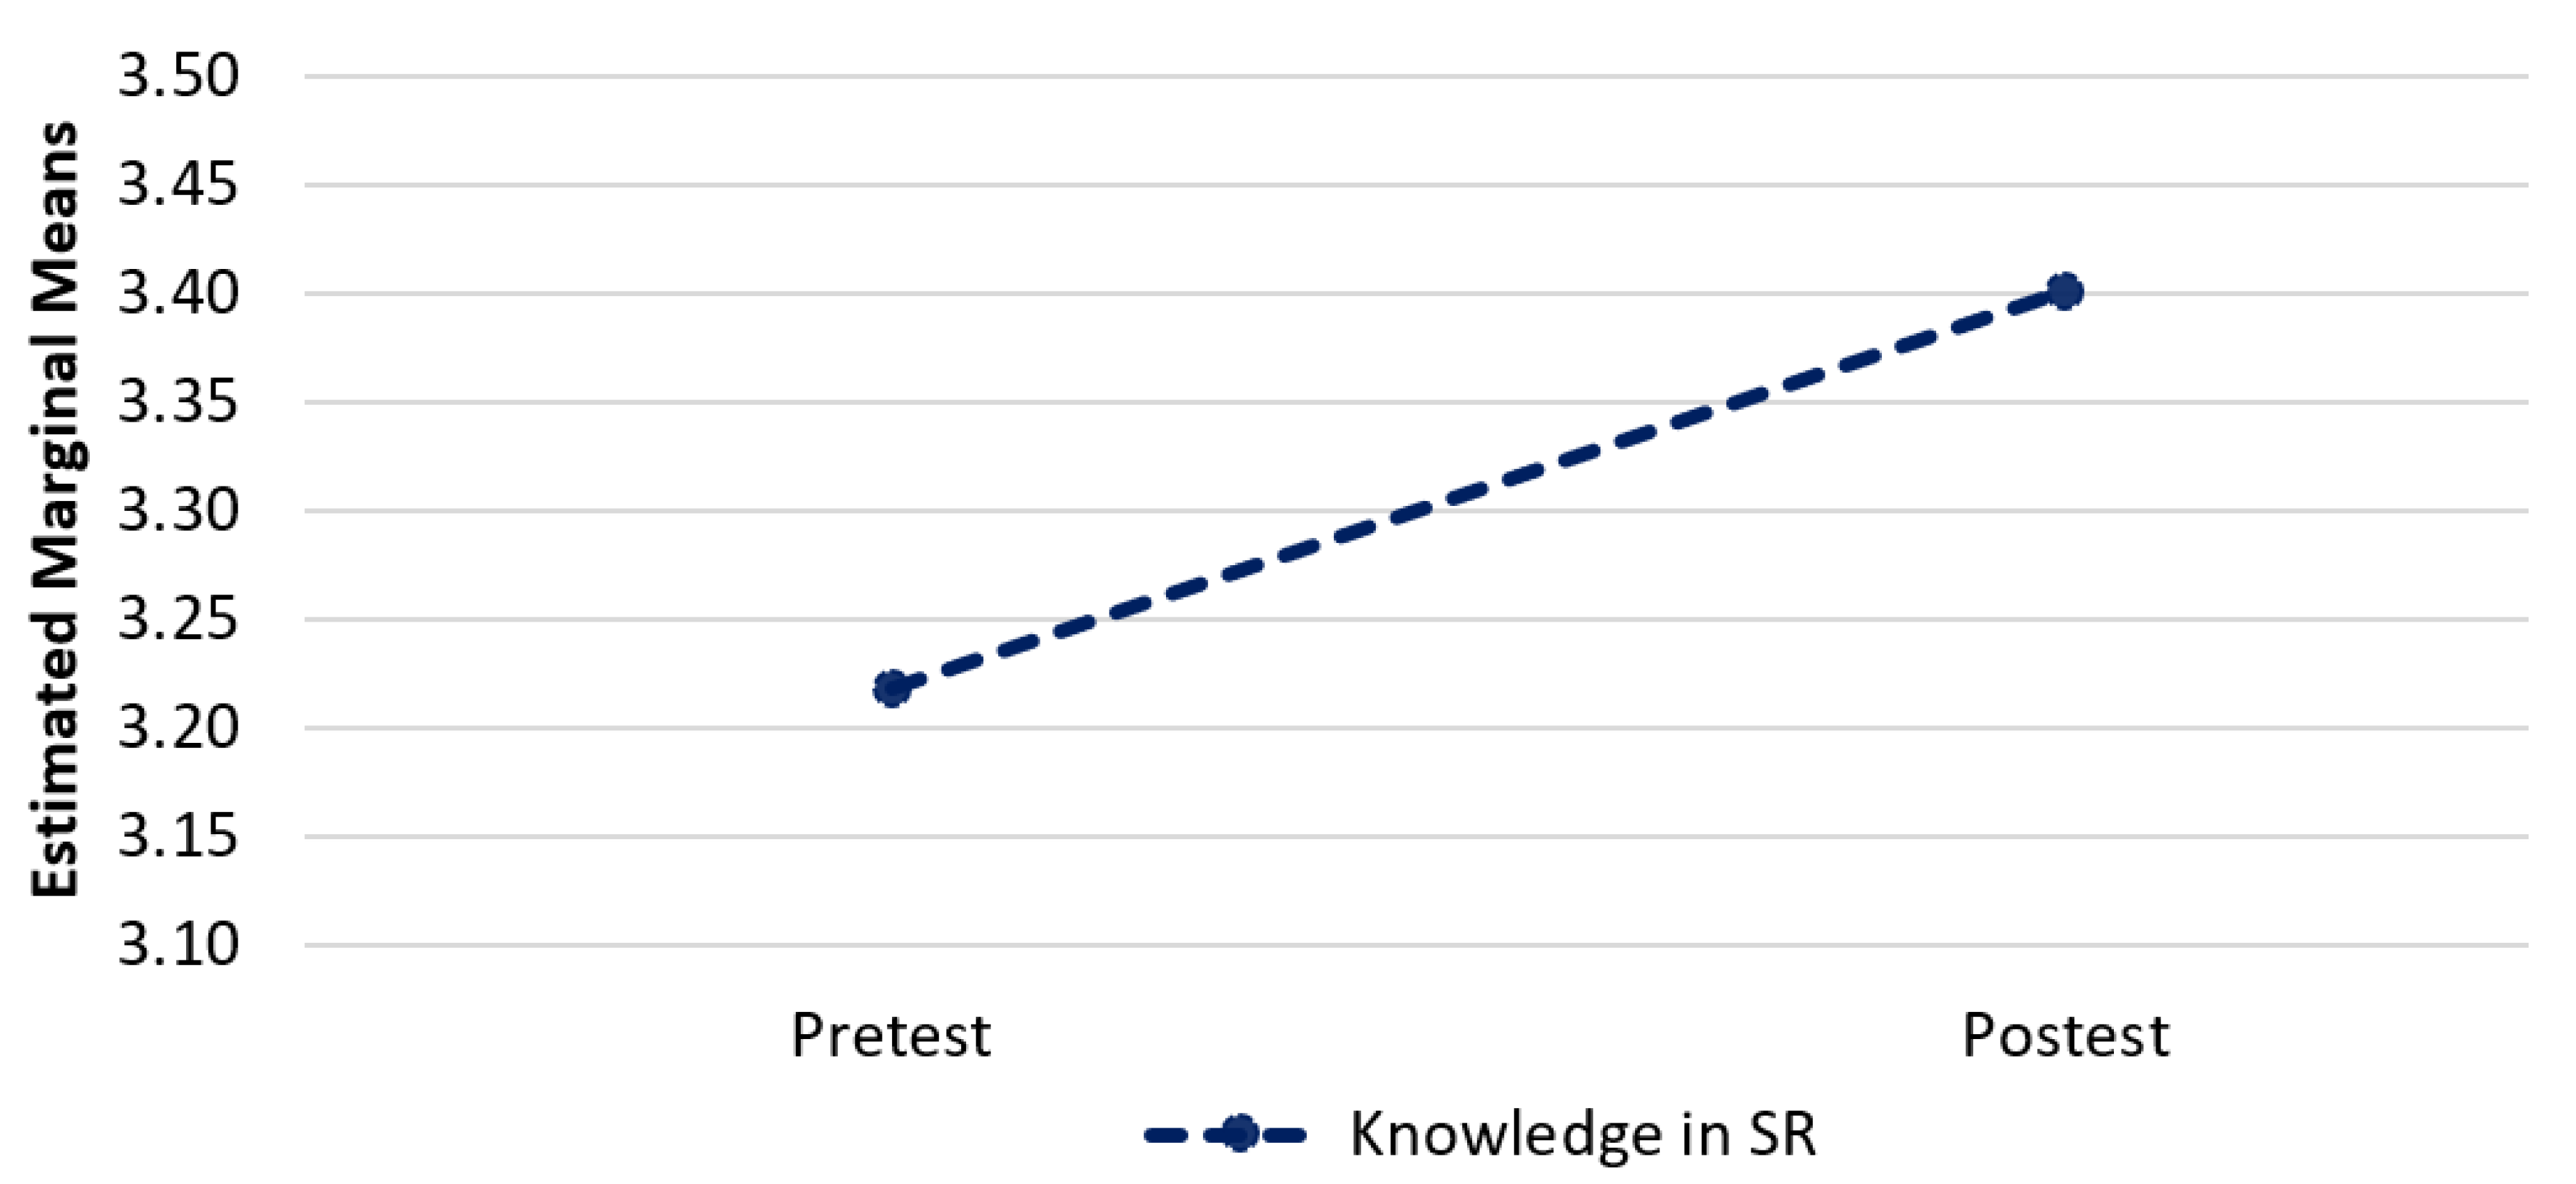
Figure 3 shows the comparison between the average score of the pre- and posttest of the MOOC sample. The average score of the pretest was 3.22 and after the MOOC course participants reached an average score of 3.40. This is a clear and significant improvement in the average score. The average score includes all 32 items and all participants who finished the MOOC. As we show below, this level of improvement is similar across many different subsets of age, gender, educational level and country of origin.
After the hypothesis contrast, significant advances (p minor value) of the dependent variable knowledge in SR were observed. The values of this variable were calculated using the average scores of the four areas of knowledge and the difference between the average scores of the pre- and posttest has an effect size of 0.46 (
Table 3).
A more detailed view of the improvement of the average score of the posttest in the separated areas is shown in
Figure 4. A significant advance in all areas of knowledge was observed but some differences exist (
Table 4). Comparing all four different areas, we observed that the Areas 3 (Causes) and 4 (Responses) show a relatively higher improvement compared to Areas 1 (Definitions) and 2 (Consequences). The effect size value (
) for Area 3 (Causes) explains a moderate difference [
65] (
Figure 4). The reasons behind this asymmetric improvement are discussed in the next section.
We also analyzed the results for different subsamples of the group of participants based on the demographic data collected during the first questionnaire. This analysis allows us to find a relation between demographics and the MOOC format.
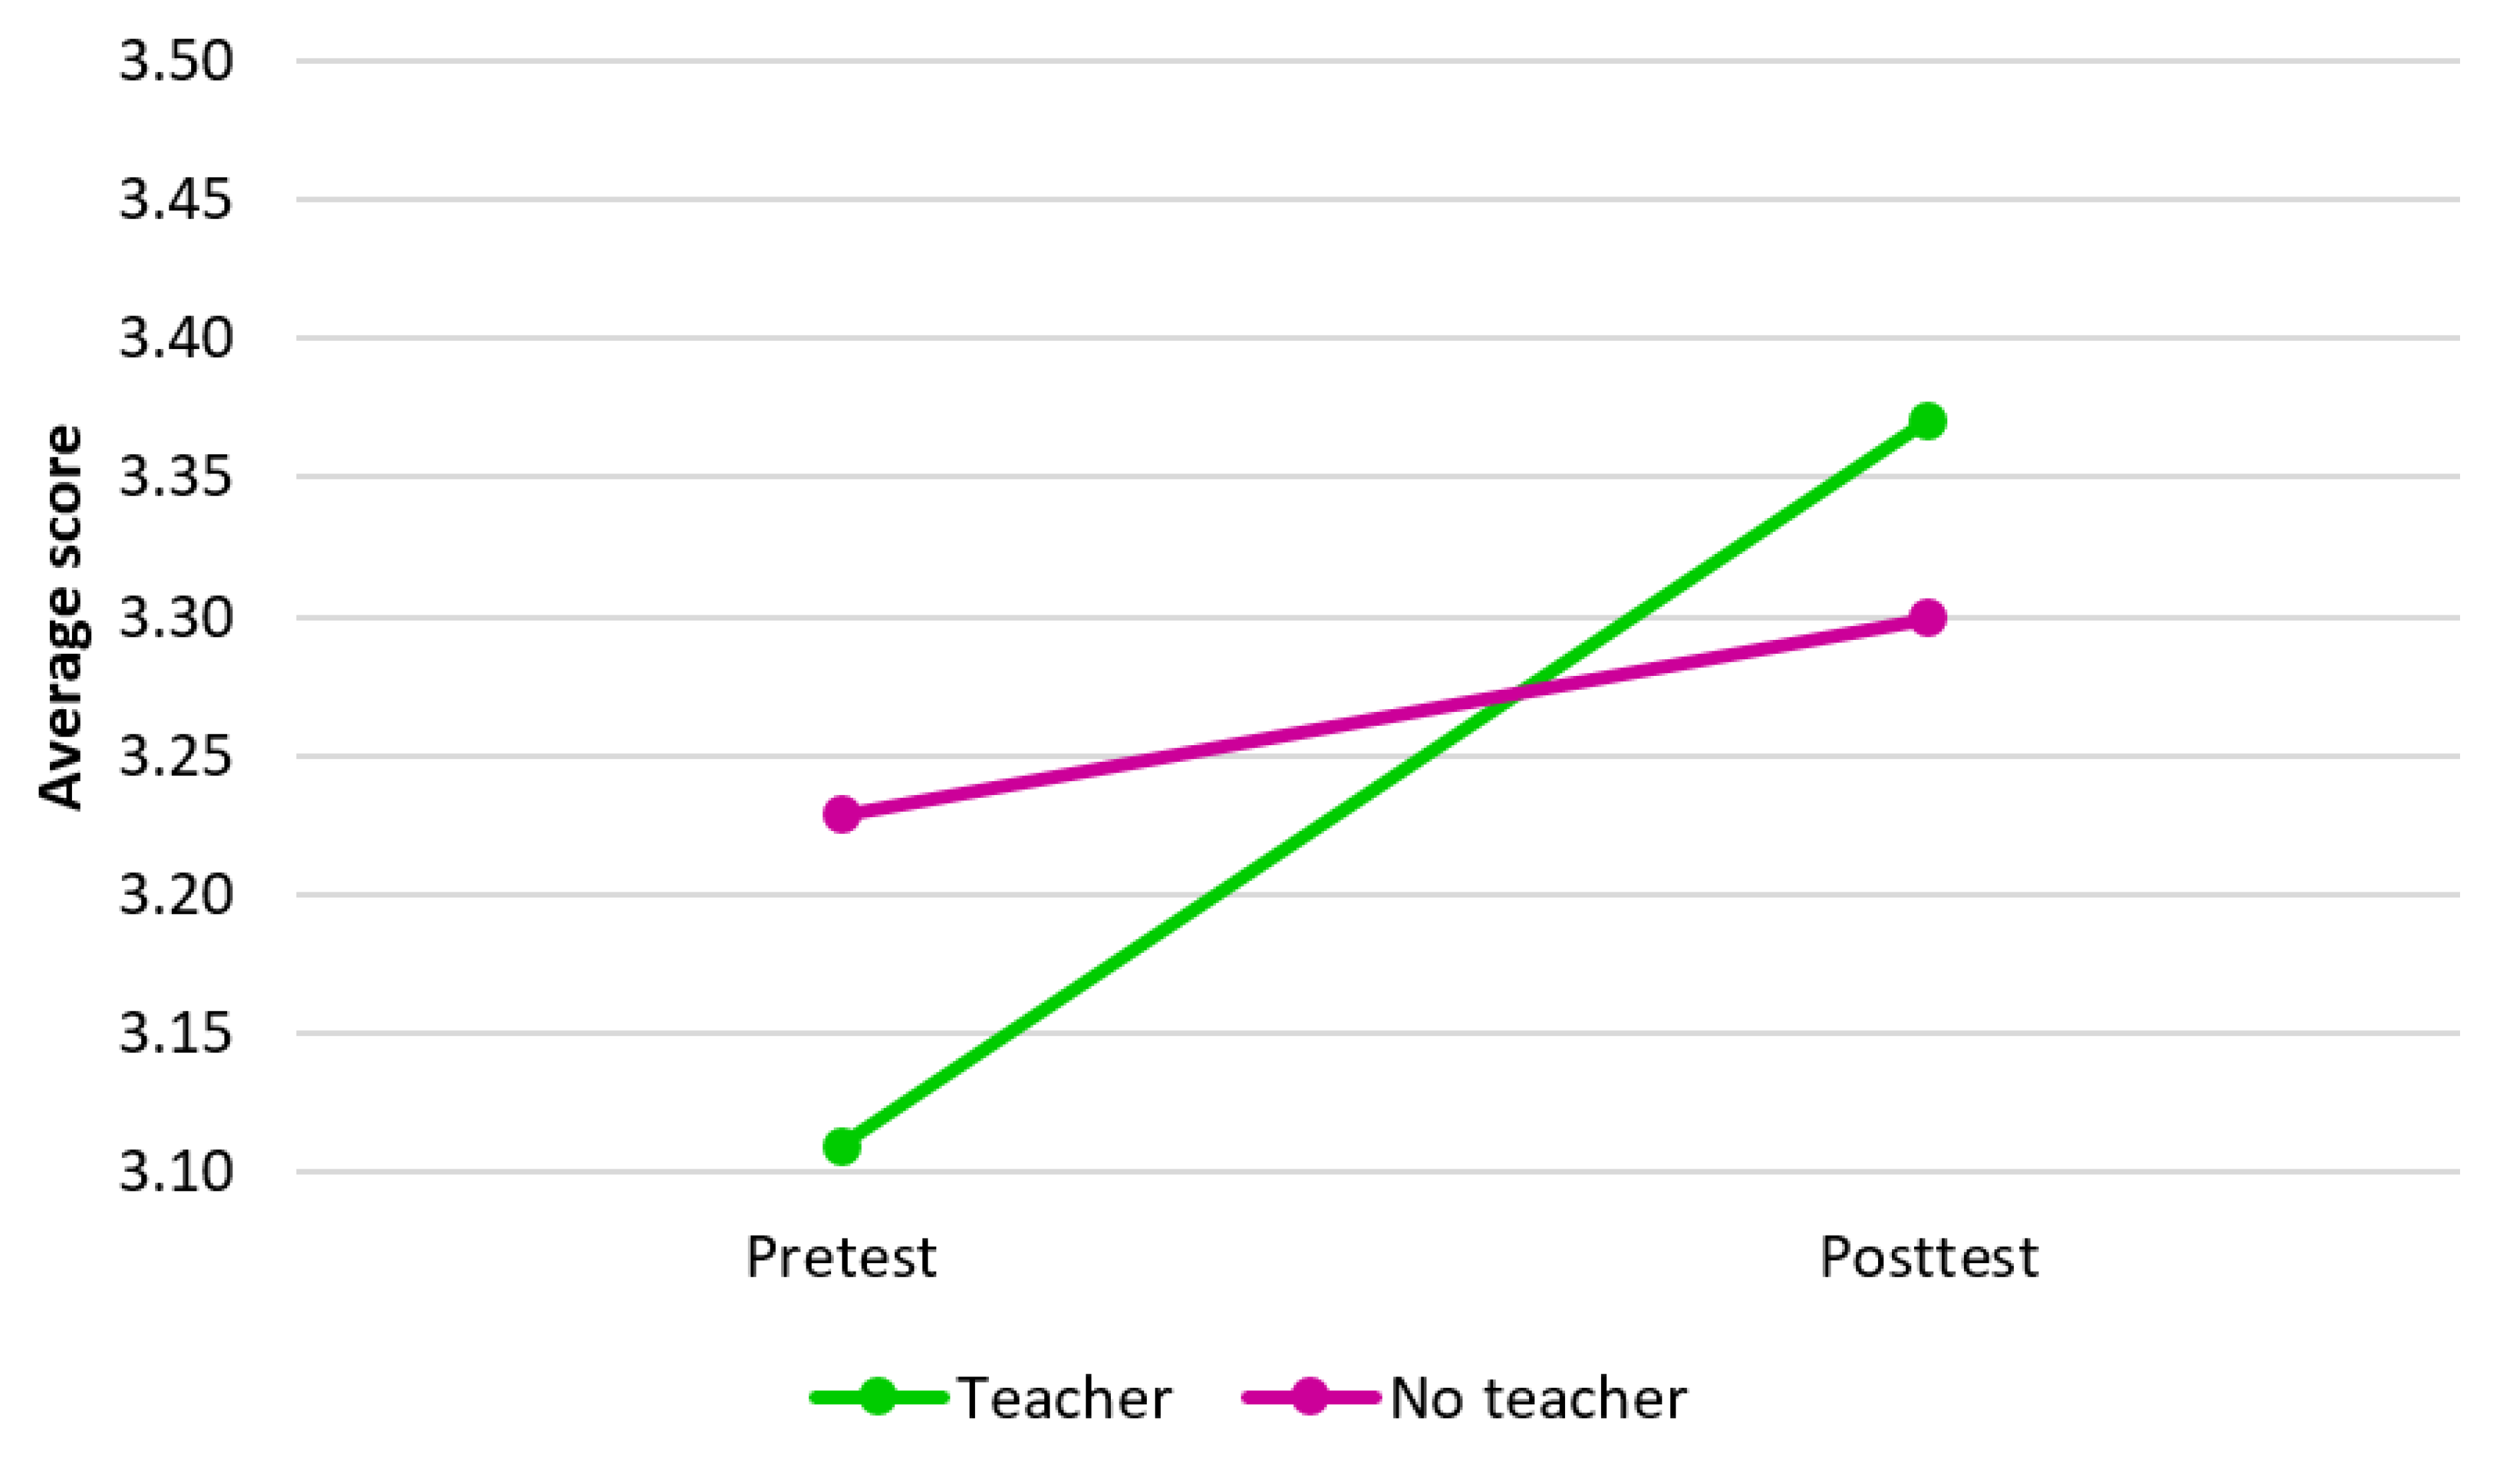
The first analysis compares teachers versus non-teachers. Within these groups, we selected the ages where they might be active (26–65) and compared their scores against the rest of the population.
Figure 5 shows the results of this comparison and a larger improvement for the teachers was observed even though their initial score is lower compared to the rest. In the discussion below, we present some arguments that could explain these observations.
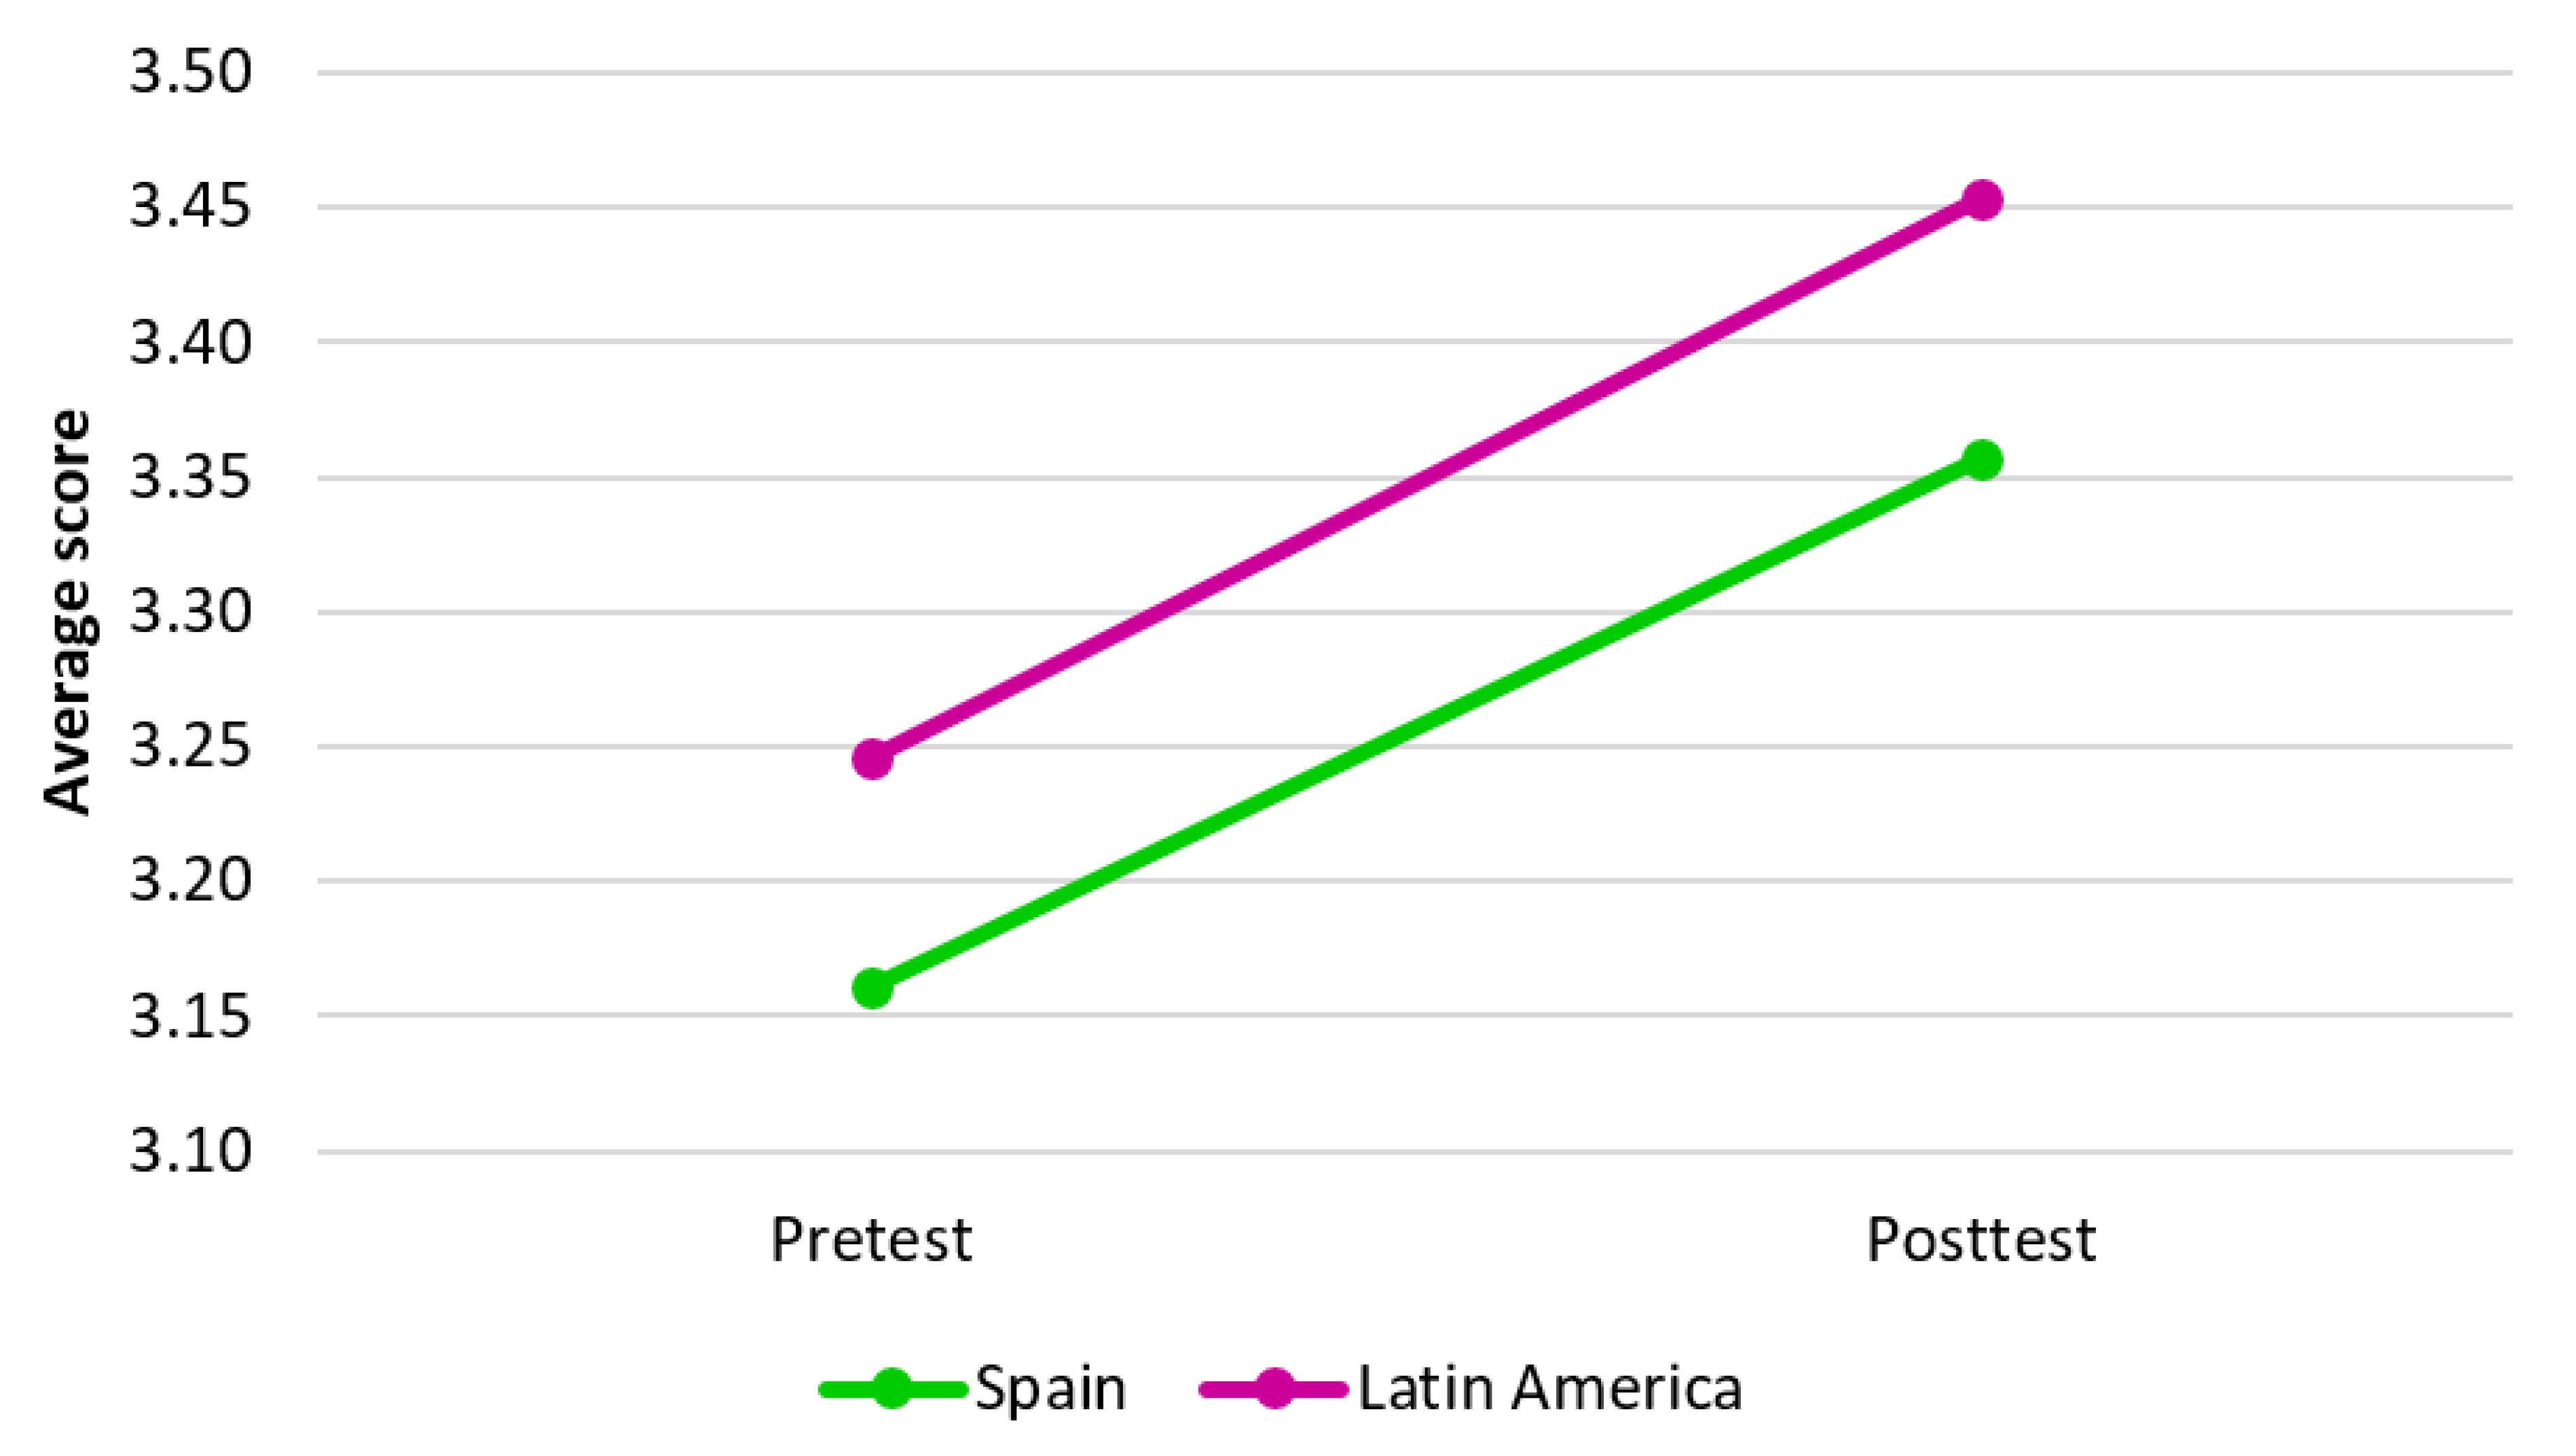
Finally, we analyzed the sample by looking into the country of origin of the participants. Based on the data of the country of origin of the participants, we divided the group into two subgroups: (1) participants from Spain; and (2) participants from Latin America.
Figure 6 shows the pre- and posttest results. A very similar improvement of the overall average score was observed in both groups, although their initial score is different. The results indicate that there are significant differences between both groups (Spain/Latin America), being Latin America the one that reaches a higher level of performance in knowledge in SR (posttest:
;
), in the variable score in the posttest (
and
).
4. Discussion
The main objective of this paper is to see if the SR on Climate Change can be improved by means of MOOCs on the basic concepts of Climate Change. This question is extremely relevant since SRs are considered a main driver for climate action [
68,
69] and misconceptions in this SR may be the reason behind the slow response of society despite the urgency indicated by scientific evidence [
68,
70]. Moreover, our study could provide more support to the hypothesis that education is one of the main tools for Climate Change mitigation and adaptation, as suggested by the UNFCC [
69,
71].
Comparison of the results of the questionnaire from our MOOC sample and the sample used in the “Resclima study” [
48] reveals a similar general trend, ruling out the fact that our MOOC sample could have some important peculiarities that make it very different from the USC sample. This means that the SR in our sample is, despite small differences, similar to the SR of the USC sample. A possible explanation for a higher initial score in the MOOC group could be the fact that participants enrolled in the MOOC start with a higher interest in these topics as their enrollment is voluntarily. The two categories where we observed bigger differences between samples are causes and responses, confirming a slightly better initial knowledge on the topic by MOOC students.
The SR consist of all relevant ideas and practices associated with an object [
68]. Some authors have suggested that nature could be this object [
72]. In this situation, SR could be the ideas and practices that society has in connection with a natural phenomenon. Other authors [
73] have suggested that SRs of Climate Change contain scientific information but most of it reaches society through media or other mediators which could simplify, reduce or interpret them based on multiple variables or interests. Our hypothesis is that Education is an effective way to transfer scientific knowledge which is useful to improve a distorted SR. Courses on scientific knowledge have been suggested as a good method to increase SR of environmental issues [
74,
75] but also in other disciplines such as psychology [
76] or mathematics [
77]. We propose to evaluate the improvement of SR on Climate Change measuring student’s competence through the identification of the scientific veracity of a series of statements, which are classified into four areas of knowledge related to the design of MOOC materials: physical processes, consequences, causes and responses to Climate Change [
58]. To this aim, we investigated the MOOC sample with the pre- and post questionnaires.
The most interesting finding of our study is the improvement of the SR after taking the MOOC course (
Figure 3).This improvement can be seen in the overall average score and is consistent along all four areas of knowledge (
Figure 4). When looking more into detail to the improvement in the different areas, a higher improvement was observed in the areas of causes and responses. A higher improvement in the area of causes was expected since a significant part of the course was dedicated to a detailed description of the scientific evidence that explains the mechanisms behind Climate Change. In the case of Responses, the improvement is remarkable given the relatively small importance of this section compared to the science sections. These findings support the idea that a course that is largely based on scientific knowledge has the power to indirectly improve the understanding of non-scientific aspects of the issue, for example mitigation and adaptation, which have been included in the area of responses during the questionnaire.
Moreover, a high score in the areas of responses and causes could mean that, although students understood the consequences of Climate Change, they did not make a connection with the causes and therefore did not see the links to their own behavior. A higher improvement in the area response (mitigation and adaptation) could imply that participants have established a connection between the observed changes in the Climate and the impact of our behavior as a society. Although they may know the consequences, they might not know strategies for mitigation and adaptation; again, the MOOC improves this situation. This is interesting as the MOOC seems to even the scores along the four categories, which means a more equilibrated representation.
The rest of the observations on the relative improvement between different groups might be explained in terms of the fitness of the MOOC format for different groups. In the first place, the advantages of using a MOOC compared to other more traditional teaching methods, such as face-to-face classes, should be pointed out. The improvement of results shows that the MOOC format has produced a positive and quantifiable change in the students SR on Climate Change. The advantages of a MOOC [
78] are obvious: it is a didactic tool that can be accessed from anywhere in the world and can be adapted to different learning rhythms and schedule needs, because the students can access the material when they want and as many times as they want. Although the MOOC format offers the possibility of raising doubts and questions to the teachers, this possibility was not used very often by students in our MOOC. This suggest that the improvement of knowledge was achieved through the materials provided in the MOOC, although other sources may be consulted during the course.
The MOOC generated improvement in the average score of the posttest in all age groups and, when we compared teachers and non-teachers (
Figure 5), we observed a higher improvement among the teachers even though they started with a lower initial score. This may be explained by the fact that the teachers might have an initial interest in the topic and can make better use of the tools that the MOOC provides. Additionally, teachers are used to taking short courses as part of their professional development and therefore might be better prepared to take advantage of the contents of the MOOC.
The average score of the results of the pretest (
Figure 6) of Latin American participants (M = 3.25 of a total of 275) is higher than that of the Spanish participants in the MOOC (M = 3.16 of a total of 175), which means a greater awareness of this issue among Latin Americans. This might be due to some differences in the mandatory school curriculum. This is interesting, and at the same time alarming, as Spain is one of the countries which will be most affected by the consequences of Climate Change [
79]. Nevertheless, the fact that all students, regardless of their nationality, improved their average score (
Figure 6) proves that small language barriers between the different countries did not affect the learning process and demonstrates the usefulness of a course prepared in Spanish, a language spoken by more than five hundred million people. This is why we can highlight the importance of creating educational materials in Spanish on this topic.
5. Conclusions
The Social Representation of Climate Change in society is an important driver for Climate action. A distorted or incomplete SR may be the main cause for the observed apathy even though we are facing the most important threat of our times. The challenge to contain the impacts of Climate Change will require large transformations of society which need to be addressed now. In this paper, we go beyond previous studies that focus on how the SR of Climate Change is formed. The main objective of this paper is to see if the SR of Climate Change can be improved by means of knowledge-based learning about the basic science of Climate Change. Moreover, our study provides a clear demonstration of how education can become a fundamental tool for Climate Change mitigation and adaptation, as suggested by the UNFCC.
For this, we used a well tested questionnaire to measure misconceptions in the SRs of Climate Change in a group of students of a knowledge-based MOOC. The MOOC on the science of Climate Change, developed at the Universidad de Salamanca, explains in simple terms the definition of Climate Change, its causes and consequences and what we can do. We applied this questionnaire before and after the course to see how these misconceptions evolve. To analyze the results, we grouped them into four areas developed in the MOOC: definitions, causes, consequences and response.
We observed an improvement in all categories for the people who finished the course. In particular, the categories of causes and responses show the best improvement. This is an important result as it shows how, for this particular group, a MOOC based on knowledge can improve the SR in particular in the response category which describes how much people know about the mitigation and adaptation, which is needed to mobilize society to contain this important problem.
The results also allowed us to test the efficiency of the MOOC platform among different groups. We observed small but significant differences in some groups within the sample. Teachers performed better after the course than non-teachers and people from Latin America showed a better improvement than Spanish students, although the margin is small. These results allowed us to think that the MOOC might be an efficient way to put education at the center of mitigation and adaptation strategies. Its characteristics allow a fast and broad access to important information which can improve the SR and perhaps lead to action for climate.

 ,
, 

