Assessing Protection Strategies for Urban Rail Transit Systems: A Case-Study on the Central London Underground


1
UCD Quinn School of Business, University College Dublin, Dublin, Ireland
2
Sasin School of Management, Chulalongkorn University, Bangkok 10330, Thailand
3
Centre for Logistics and Heuristic Optimisation (CLHO), Kent Business School, University of Kent, Canterbury CT2 7FS, UK
*
Author to whom correspondence should be addressed.
Sustainability 2019, 11(22), 6322; https://doi.org/10.3390/su11226322
Submission received: 30 September 2019
/
Revised: 4 November 2019
/
Accepted: 6 November 2019
/
Published: 11 November 2019
(This article belongs to the Special Issue Toward Sustainability: Reliable Transportation Network Design and Analysis)
Abstract
:Urban rail transit systems are highly prone to disruptions of various nature (e.g., accidental, environmental, man-made). Railway networks are deemed as critical infrastructures given that a service interruption can prompt adverse consequences on entire communities and lead to potential far-reaching effects. Hence, the identification of optimal strategies to mitigate the negative impact of disruptive events is paramount to increase railway systems’ resilience. In this paper, we investigate several protection strategies deriving from the application of either single asset vulnerability metrics or systemic optimization models. The contribution of this paper is threefold. Firstly, a single asset metric combining connectivity, path length and flow is defined, namely the Weighted Node Importance Evaluation Index (WI). Secondly, a novel bi-level multi-criteria optimisation model, called the Railway Fortification Problem (RFP), is introduced. RFP identifies protection strategies based on stations connectivity, path length, or travel demand, considered as either individual or combined objectives. Finally, two different protection strategy approaches are applied to a Central London Underground case study: a sequential approach based on single-asset metrics and an integrated approach based on RFP. Results indicate that the integrated approach outperforms the sequential approach and identifies more robust protection plans with respect to different vulnerability criteria.
1. Introduction
Urban rail transit systems, and railway infrastructures more broadly, are extremely prone to a variety of disruptions (e.g., accidental, natural, man-made). For example, the 7 July 2005 London bombings consisted of suicidal bomb attacks that caused three explosions in the London Tube, thus bringing the underground services to a halt, claiming more than fifty casualties and injuring hundreds [1]. More recently, in December 2014, over-running engineering works, together with a signalling issue at Finsbury Park, caused major disruptions at London King’s Cross station, one of the busiest stations in the UK [2]. Finally, heavy rain in England in June 2019 resulted in widespread disturbance due to flooded roads, railway infrastructures and hospitals. Network Rail, the railway infrastructure owner in the UK, reported that the lines connecting Kent to London were flooded due to one month’s worth of rain occurring in just 24 h. This led to disruptions to the trains’ power supply and signalling equipment, thus bringing the system to a standstill [3]. These events highlight the vulnerability of railway infrastructures to disasters and the need to identify cost-effective protection strategies that can mitigate the negative impact of disruptive occurrences.
Railway systems are typically modelled through a network structure where nodes are train stations and links are tracks. Potential protection strategies depend on the type of threat. For example, man made disruptions can be thwarted by installing Closed-Circuit TeleVision (CCTV), whereas barriers can be built to prevent flooding. Assessing the vulnerability of railway assets is paramount to allocate protection resources in a cost-efficient way ([4,5,6,7,8]). To this end, Starita, Esposito Amideo, and Scaparra [9] provide two possible approaches aimed at identifying the most critical stations in a railway network (i.e., those whose disruption may affect the system functioning the most): one based on vulnerability metrics [10] and another one based on interdiction models [11]. Starita, Esposito Amideo, and Scaparra [9] group vulnerability metrics into three main categories: connectivity (node degree, network accessibility), path length (node vulnerability, node betweenness), and flow (passenger flow influence). These metrics are used to obtain a ranking of the most critical stations of the Central London Tube network and are compared with the solutions of two interdiction models, namely the Path Interdiction Problem (PIP) and the Flow Interdiction Problem (FIP). The comparison of the two approaches confirms that optimization programs, such as the proposed interdiction models, are generally more reliable than metrics. In fact, a vulnerability assessment based on single asset measures is static and, as such, fails to capture the interaction among system components after a disruption, ultimately underestimating its effect. Conversely, interdiction models account for system components interdependency, thus providing a more reliable framework.
Once network vulnerabilities have been assessed, protection strategies can be identified through either a sequential or an integrated approach. A sequential approach is composed of two consecutive steps: the former identifies the most critical network components, through either vulnerability measures or interdiction models, while the latter consists of allocating fortification resources subject to a budget limitation: resources are distributed by either following a ranking of the network criticalities (as obtained from the application of vulnerability measures) or considering the optimal set of interdicted network components (as obtained from the application of interdiction models). Differently, an integrated approach combines vulnerability assessment and resource allocation together. This is achieved through fortification models that are structured as bi-level programs [12,13,14]. Bi-level programs [15] allow for mimicking a game between two players: the defender (e.g., the network operator or the infrastructure owner) and the attacker (e.g., a natural disaster or a terrorist). The upper level models the defender whose aim is to distribute protection resources over the network in an optimal way so as to hedge against worst-case interdictions resulting from the attacker, who is modelled at the lower level. Hence, a bi-level program captures the interaction between the defender and the attacker thus addressing vulnerability assessment and protection strategies in a combined way.
In this paper, we argue that an integrated approach based on fortification models is a more effective and accurate tool to allocate protection resources than a sequential approach based on vulnerability metrics, thus extending the work of [9]. To prove our claim, we consider the most recent measures recently proposed in the literature to assess rail transport systems’ vulnerability, in addition to those identified in [9]. These include metrics belonging to the three aforementioned categories (i.e., connectivity, path length and flow) and also metrics for each combination of two out of three of these criteria. Additionally, we propose a new unified metric combining the three aspects together, namely the Weighted Node Importance Evaluation Index (WI). We also contribute to the literature through the introduction of a novel bi-level multi-criteria optimisation model, namely the Railway Fortification Problem (RFP), which devises protection strategies based on stations’ connectivity, path length, or travel demand, considered as either individual or combined objectives. Finally, we test both sequential and integrated approaches on a case study based on the Central London Tube that has been built using real data.
The outline of this paper is as follows. Section 2 reviews the literature on single asset measures and fortification models, based on multi-level programming, with specific focus on railway systems. Section 3 describes the newly proposed sequential and integrated approaches: the WI metric and the RFP model. Section 4 presents the case study of the Central London Tube network. Section 5 offers a discussion on the results obtained from the application of the sequential approach, the integrated approach, and their comparison. Finally, Section 6 wraps up the discussion and offers some conclusive remarks.
2. Literature Review
This section offers two different review outlooks: one focused on single asset vulnerability measures, the other on fortification models. The first sub-section is structured according to four different threads: connectivity, path length, flow, and the combination of the above. The second sub-section offers an overview of optimisation models that have been devised to assess critical infrastructure vulnerabilities due to worst-case dirsuptions. It also reviews multi-level programs developed for critical infrastructure protection with a specific focus on railway systems.
2.1. Single-Asset Metrics for Fortification
Connectivity-driven metrics
Node Degree (ND). Given an undirected network, the node degree is the number of edges incident to that node [16]. Hence, being A the incidence matrix of the network, ND(i) can be defined as the sum on the columns (rows) of the incidence matrix in correspondence of row (column) i, calculated as follows:
In the case of a directed network there are two different metrics: the indegree (i.e., number of arcs entering the node) and the outdegree (i.e., number of arcs leaving the node). These two metrics are equal in case of undirected networks and, as such, only the node degree is used. This metric measures the influence that an individual node has on its neighbours. Within the railway infrastructure protection field, the node degree is used to evaluate the importance of a single station in comparison to the others. In fact, nodes with a high degree represent hubs or interchange stations which are critical to the overall transportation system.
Path length-driven metrics
Harmonic Centrality (HC). Similarly to the node degree, the harmonic centrality provides a measure of node importance. However, HC highlights the station that can be more easily reached by all the remaining stations. HC is a variation of the closeness centrality (CC) index. The closeness centrality of a node i is defined as the ratio between the number of network nodes minus 1, and the sum of all the shortest paths connecting node i to node j, [17]:
However, the CC index works for connected networks but may yield problems when dealing with unconnected networks. The harmonic centrality (HC) can be seen as an evolution of CC which accounts for unconnected networks. The harmonic centrality of a node i is defined as the sum of the reciprocals of all the shortest paths connecting node i to node j, [17]:
Node Vulnerability (NV). Due to the inoperability of a node following an interdiction, the network efficiency (i.e., the network ability to exchange information [18]) decreases. The node vulnerability measures this variation in network efficiency thus providing an insight on how the network is susceptible to incidents. Specifically, the network efficiency is defined as the average of the reciprocals of the length of each shortest path connecting node i to node j, , and is calculated as follows [19]:
Hence, the node vulnerability can be computed as [19]:
where is the value of network efficiency at the initial stage (i.e., when no disruption occurs), and is the value of network efficiency after station i is interdicted and removed from the network.
Node Betweenness (NB). As both node degree and harmonic centrality, the node betweenness is another measure of node importance. However, rather than being a local measure, this is a global measure. In fact, the node betweenness of a node i is defined as the ratio between all the shortest paths connecting node j to node k passing through node i, , and all the possible shortest paths connecting node j to node k, [20]:
Hence, NB(i) measures how node i is critical in keeping effective communication across the network. Within the railway infrastructure protection field, NB(i) provides an insight on the stations passengers are more likely to use.
Flow-driven metrics
Passenger Flow Influence (PF). Given an interdiction affecting node i, the total amount of flow (hence of railway passengers) that is affected as a result of the breakdown of station i is defined as the sum of three different types of passengers: (a) those whose journey starts at station i (); (b) those whose journey ends at station i () and (c) those who traverse station i as part of their journey (). The passenger flow influence of a node i is calculated as follows [19]:
Combined metrics
Strength (ST). The strength of a node i is the weighted version of the node degree of node i. Specifically, the weight that is used is the passenger flow influence of node i. Hence, this metric allows for combining connectivity and flow aspects together and accounts for the role fulfilled by different stations (e.g., the flow-based weight allows for capture the difference between an interchange point and a small station). The strength of a node i is computed as follows [16]:
Station Vulnerability (SV). The station vulnerability of a station i accounts for the variation in network serviceability (i.e., the ability of the network to provide its service), R(i), and the likelihood of station i to be interdicted, p(i). Specifically, the station vulnerability of a station i is equal to [19]:
SV(i) accounts for node vulnerability and passenger flow influence together thus allowing for combining path length and flow perspectives.
OD-Flow Weighted Nodal Accessibility (WA). The OD-Flow Weighted Nodal Accessibility of a station i captures the ability that passengers have in completing their journey departing from a station i to a station j [21]:
Hence, WA(i) integrates path length and passenger flow influence together, thus providing an additional combination of path length and flow perspectives.
Node Importance Evaluation Index (IM). This index integrates two different aspects of node importance: node degree, which is a local measure, and node betweenness, which is a global measure. Yang et al. [20] assume that a combination of these two metrics, one based on connectivity and the other on path length, is able to evaluate the role of a node from both global and local perspectives. Hence, the node importance evaluation index (IM) is a weighted sum of the two aforementioned indicators:
where and are real coefficients assuming values between 0 and 1 and whose sum is equal to 1.
2.2. Systemic Approach to Fortification
The literature on optimisation models assessing critical infrastructure vulnerabilities due to worst-case disruptions has grown rapidly in the past decades. These are the so-called interdiction models, also known as Attacker-Defender (AD) models, as they are used to identify the assets that would be disrupted by an intelligent attacker to maximise the negative impact on a system. Solving these problems allows for assessing the extent to which a system is vulnerable to worst-case disruptions and identify its most critical components. Building on a few seminal papers [22,23], interdiction models have been applied to distance-based [24,25,26,27], flow-based [11,28,29,30], and connectivity-based networks [31].
However, when the objective is to find the optimal distribution of protection resources so as to fortify the system, it can be demonstrated that the solution of interdiction models leads to sub-optimal protection plans [12]. Hence, further decision level modeling protection decisions need to be added to interdiction problems. Brown, Carlyle, Salmeron and Wood [32] discuss the general structure of fortification problems, modeling them as tri-level Defender–Attacker–Defender (DAD) programs and provide an application to electric power grids. Currently, the vast majority of published works focuses on the fortification of supply-chain systems. Scaparra and Church [12] define the R-Interdiction Median problem with Fortification (RIMF). The aim is to identify the optimal distribution of limited resources among existing facilities of a vulnerable supply chain system so as to minimize the effect of worst-case disruptions arising from the loss of a certain amount of unprotected facilities. Several papers extend RIMF by incorporating other features such as capacity expansion [33], uncertainty [34], and recovery [35]. Focusing on transportation networks, the literature on fortification is growing at a somewhat slower pace. Cappanera and Scaparra [13] introduce the Shortest-Path interdiction Problem with Fortification (SPIF). SPIF aims at optimally distributing fortification resources across network arcs so as to minimize the length of the shortest path connecting a supply and a demand node after worst-case disruptions affecting some unprotected network connections. Sadeghi et al. [36] extend SPIF by considering partial fortifications while Lozano, Smith and Kurz [37] apply fortification to the Traveling Salesmen Problem.
Posing specific attention to railway systems, disruption management is a popular topic and many studies investigate operational planning techniques such as timetabling and rescheduling to reduce the impact of disruptions ([38,39,40,41,42]). Conversely, when it comes to railway system strategic planning against worst-case disruptions, the literature is still scarce. In fact, not many studies developing fortification models for railway infrastructure protection can be found. Jin et al. [43] propose a tri-level model whose ultimate goal is to harden train stations so as to minimize the travel delay resulting from multiple targeted attacks while modelling passenger flow as a multiple origin–destination commuter flow. Sarhadi, Tulett and Verma ([44,45]) investigate the fortification problem applied to rail-truck intermodal transportation networks. Scaparra, Starita and Sterle [46] introduce the Railway Protection Investment problem (RPI), a bi-level model whose aim is to identify the allocation of protective resources that minimizes the disruption of passenger flow due to worst-case interdictions. Starita and Scaparra [47] extend the RPI by assuming that protective resources are available over time, thus adding the time perspective to the RPI and defining the Dynamic Network Protection (DNP) model. More recently, Starita and Scaparra [48] further expand the two aforementioned works by introducing the Network Protection Problem with Variable Demand Loss (NPVDL), which accounts for post-disruption passenger behaviour by modelling the post-disruption passenger demand as a function of the travelling times of the alternative available paths.
As emerges in the literature review, fortification models developed so far have been focusing only on one specific aspect, be it connectivity, path length or flow. This paper aims to overcome this issue by contributing to the literature with a flexible formulation that allows for accounting for the three aforementioned aspects simultaneously, as detailed in the next section.
3. Methodology
This section briefly describes the two protection strategy approaches deployed in this paper: a sequential approach based on vulnerability metrics and an integrated approach based on fortification models. A novel single asset measure, the Weighted Node Importance Evaluation Index (WI), and a novel fortification model, the Railway Fortification Problem (RFP), are introduced within the sequential and the integrated approach sub-sections, respectively.
3.1. Sequential Approach
The sequential approach deployed in this paper is composed of two consecutive steps: the former identifies the most critical network components through single asset measures. Specifically, network assets are ranked in decreasing order according to each of the metrics described in Section 2.1. Then, protection resources are distributed based on that ranking by sequentially adding the top stations as long as the budget is available. Annual passenger flow is used to break ties among stations having the same metric values. Several fortification strategies are to be provided, as many as the available vulnerability metrics, allowing for comparing different perspectives (i.e., connectivity, path length, and flow) as well as their combination. Based on the reviewed metrics, we propose a novel single asset measure that combines together connectivity, path length, and flow. Specifically, we define a weighted version of the Node Importance Evaluation Index (IM), namely the Weighted Node Importance Evaluation Index (WI), where the strength replaces the node degree. Hence, WI is calculated as follows:
where and are real coefficients assuming values between 0 and 1 and whose sum is equal to 1.
3.2. Integrated Approach
The integrated approach deployed in this paper relies on a novel bi-level multi-criteria optimisation model, namely the Railway Fortification Problem (RFP). As reported in Section 2.2, previous models have typically focused only on one specific network feature (i.e., connectivity, path length, and flow) [9]. RFP combines these features, thus generating robust solutions with respect to multiple criteria.
In the following, the railway network is represented as a directed graph where N is the set of stations and A is the set of connections among them. The notation used in the formulation is given below:
Sets, Indices and Parameters
- N is the set of network nodes, indexed by i, s or d,
- A is the set of network arcs,
- is the set of paths connecting nodes s and d, indexed by p,
- , is the set of nodes in path p,
- is the length of path p,
- is the length of the longest path connecting nodes s and d,
- is the amount of passenger flow travelling from node s to node d,
- D is the maximum number of nodes that can be disrupted simultaneously,
- B is the amount of budget available for protection,
- is a penalty cost incurred when nodes s and d are disconnected,
- are constants used to normalise path and flow objectives, respectively,
- are real coefficients used to weight connectivity, path and flow objectives, respectively, whose sum is equal to 1.
Variables
- is equal to 1 if node i is protected, 0 otherwise,
- is equal to 1 if node i is disrupted, 0 otherwise,
- is the length of the shortest non-disrupted path from node s to node d,
- is equal to 1 if there is no connection between nodes s and d, 0 otherwise.
The Railway Fortification Problem (RFP)
The objective of the fortification level (13)–(15) is to minimise by allocating protection resources. Constraints (14) represent the budget limitation on the protection expenditure. Constraints (15) define the binary requirements for variables . The interdiction level (16)–(23) has the opposite aim of maximising function , defined as a linear combination of: (1) the number of disconnected s–d node pairs, (2) the overall length of the shortest non-disrupted paths connecting s–d node pairs, and (3) the total amount of disrupted flow across all the s–d node pairs. Parameters and are used to normalize the objective functions, since they would normally take values of different orders of magnitude. Parameter is set equal to the largest penalty cost available in the network (i.e., ), and is set equal to the maximum flow between any two pair of nodes (i.e., ). Consequently, for any s–d pair, the three objectives take values between 0 and 1. Constraints (17) limit the number of disrupted nodes to D. Inequalities (18) enforce that protected nodes cannot be disrupted. Constraints (19) enforce upper bounds on variables . Specifically, if a given path p connecting s to d is not disrupted, then cannot exceed the length of such path (i.e., ). However, if the path is disrupted, these constraints account for this through a penalty factor, . Constraints (20) state that an s–d pair is disconnected only if all paths connecting it are disrupted. Constraints (21) are the binary restriction for the interdiction variables. Constraints (22) limit variables to take only values between 0 and . This guarantees that, when a pair s–d is disconnected, is set to the penalty cost. Finally, constraints (23) force variables to take values between 0 and 1.
4. Central London Underground: A Case Study
This section offers some details on the Central London Underground case study. The origin–destination flow matrix and the travelling time data are publicly available on the Transport for London (TfL) website. All the possible paths for each origin–destination pair are pre-computed as in [48] by considering an average 10-min interchange delay to account for a possible line change. Figure 1 shows the Central London Underground network as reported on the TfL website [49]. Overground lines and other forms of transportation are disregarded since no demand data are currently available. The network carries a total of 1.3 billion passengers per year with an average of 5 million per day [49]. Because of its importance and its recent history of disruptions, it is an interesting case study to analyse.
The network is composed of 62 stations, 202 directed arcs, and 11 different lines. Some stations allow for interchanging among lines (identified with at least one white circle such as Oxford Circus), to railway services (marked with a red double arrow such as Liverpool Street), and to nearby river bus piers on the River Thames (identified with a small boat symbol such as London Bridge). Lines are identified through color coding. Specifically, the lines are as follows: Bakerloo (brown), Central (red), Circle (yellow), District (green), Hammersmith and City (light pink), Jubilee (light grey), Metropolitan (purple), Northern (black), Piccadilly (dark blue), Victoria (turquoise), and Waterloo and City (light blue). Stations are grouped into three size categories (small, medium, and large) according to their annual passengers. These sizes are used to estimate the cost of protection. Namely, we assume that the larger stations (more than 40 millions annual passengers) require three times the resources needed to protect the smallest ones (less than 10 millions annual passengers). A more thorough protection cost estimation would incorporate the specific structural features of each station (e.g., square meters, number of entry points, etc.). However, these data are currently unavailable and could not be featured in this analysis.
The proposed approaches to devise protection strategies are implemented using the following parameters’ setting. On the sequential approach side, weights for IM and WI metrics are set as follows: ; moreover, the value of ST in (12) is scaled down by a 100 factor to obtain the same order of magnitude of NB. As for the integrated approach, penalty cost for each s–d pair is set equal to twice the length of the longest path. RFP is solved using a popular decomposition approach based on so-called Super-Valid Inequalities (SVIs) [24,50]. For the sake of brevity, we omit the details of the algorithm. Examples of SVI decomposition applied to similar problems can be found in [35,47,48]. The algorithms have been implemented in Visual Studio 2019 (Microsoft, Redmond, WA, USA), using CPLEX 12.7 callable libraries (IBM, Armonk, NY, USA). The experiments are carried out on a PC with an AMD Ryzen 7 1700 processor (Santa Clara, CA, USA) and 8 GB of RAM.
5. Discussion
This section provides an analysis of fortification strategies for the Central London Underground case study, identified by using the sequential approach based on vulnerability metrics (Section 5.1) and the integrated approach based on RFP (Section 5.2). Finally, a comparison between the plans selected by the two approaches is provided in Section 5.3.
5.1. Sequential Approach Analysis
Several insights can be inferred from the direct application of single-asset metrics to design protection strategies. Specifically, Figure 2 displays the number of times stations appear among the top ten across all metrics, giving an indication on what are the most vulnerable assets which should be considered in fortification plans. Similarly, Figure 3 shows the number of times stations have appeared in the bottom ten.
As expected, the metrics display a plurality of perspectives. However, some common aspects and trends can be identified. King’s Cross is the only station that is always ranked among the most critical across all the metrics. This clearly highlights the importance of such station from a connectivity, path and flow point of views. On the other side, no station appears to be the least critical according to all the metrics. Moreover, only Leicester Square station appears in both the top and bottom rankings.
Focusing on the most critical stations, let us consider those that appear more than 50% of the time (i.e., the upper-half of Figure 2): Baker Street, Oxford Circus, and Green Park are present nearly in all cases (i.e., 9 out of 10 times); Bank and Waterloo are considered 80% of the time; and Moorgate, Embankment, Liverpool Street and Victoria are selected 6 out of 10 times. Specifically, Baker Street is not selected from a path perspective based on NB while both Oxford Circus and Green Park are not considered based on the flow perspective (i.e., PF). Similarly, both Bank and Waterloo stations are not vulnerable according to NB. In fact, they do not appear either in NB or IM rankings despite being top ranked from both connectivity and flow perspectives. Finally, Moorgate, Liverpool Street and Victoria stations are not identified among the most critical from a path perspective given that they do not appear in HC, NV, NB and IM rankings. Differently, Embankment does not seem critical from a flow perspective as it is not ranked in the top of any of the flow-oriented metrics. However, all of the above stations have been taken into account through the overarching metric WI, thus suggesting that a combined metric covering all features may be used effectively to address several aspects that would be otherwise discarded.
Let us now consider those stations that appear more than 50% of the time among the ten least critical (i.e., those in the upper-half of Figure 3): Borough, Lambeth North, and Edgware Road from the Bakerloo line (i.e., Edgware Road (Bak)) are present nearly in all cases (i.e., 9 out of 10 times); Aldgate East has been considered 80% of the time; and Vauxhall and Bayswater have been selected 6 out of 10 times. Specifically, Borough and Lambeth North are considered as low-risk from the connectivity perspective (they are not relevant based on ND) while Aldgate East, Vauxhall and Bayswater are not deemed critical based on the flow perspective (the former is in the bottom rankings of PF and WA while the latter two are in the bottom rankings of SV and ST). This is most likely due to the fact that these stations lie on the borders of the network and, as such, they intercept fewer passengers. Probably their significance would increase if the network is extended to include London Zone 2 (i.e., Vauxhall is on the boundary of the two zones). A more detailed description of top/bottom stations can be found in Table 1 and Table 2, respectively.
5.2. Integrated Approach Analysis
This section summarises the results obtained by solving the RFP model under four scenarios:
- connectivity-based model ( = 1, = 0, and = 0), referred to as ;
- path-based model ( = 0, = 1, and = 0), referred to as ;
- flow-based model ( = 0, = 0, and = 1), referred to as ; and
- multi-criteria model with equal weights model ( = 0.33, = 0.33, and = 0.33), referred to as .
Each of the aforementioned scenarios is tested letting the number of stations to be interdicted (i.e., D) range from 1 to 3. Let us denote with the budget to protect the full network. We consider that the available budget B is a percentage q of (i.e., ). In the analysis, q ranges from 0% to 30% with step increments of 5%.
Figure 4, Figure 5 and Figure 6 display, for every disruption scenarios, the impact of increasing the protection budget on connectivity loss, path length, and flow loss, respectively. Each bar represents the value of the optimal objective function for a given combination of q and D. The figures also display for each bar a label reporting the relative gap between the post-disruption and no-disruption scenarios.
aims at minimizing the connectivity loss due to station interdictions. Figure 4 shows the serious impact that disruptions can have if the network is unprotected. For example, almost half (49%) of the station pairs are disconnected when and . The graph also shows that, for a fixed value of D, there is a significant reduction in the connectivity loss when moving from total absence of protection (i.e., q = 0) to the maximum budget considered (i.e., q = 0.30). For example, when D is equal to 1, the number of disconnected pairs drops by 46% (from 529 to 284) as the budget increases. Even larger improvements can be noticed when D is equal to 2 and 3, i.e., 57% and 56%, respectively.
Similarly, focuses on minimizing the path length after interdiction. Figure 5 shows that large disruptions (i.e., ) result in the total path length more than doubling, with an increment of 119%. The figure also displays the benefit achieved through increasingly expensive fortification measures. Specifically, path length reductions of about 11%, 24%, and 28% when D is equal to 1, 2, and 3, respectively.
On a similar note, targets passenger flow disruption. Figure 6 highlights that, for a fixed value of D, there is a remarkable improvement in the post-disruption flow as q increase to 0.30. In fact, flow loss decreases of about 73%, 71%, and 67% when D is equal to 1, 2, and 3, respectively. These large improvements are also a consequence of the network being highly vulnerable to flow loss. In fact, the three disruptive scenarios considered result in the loss of 23%, 50% and 65% of the demand, if no protection strategy is carried out.
Figure 7, Figure 8 and Figure 9 report the objective function of the multi-criteria model as decomposed into connectivity loss, path disruption, and flow interdiction plotted against all the possible combinations of D and q, respectively.
Accounting for multiple criteria by solving results in far less predictable trends. Specifically, the expected trend previously observed where objectives consistently decrease as q increases is replaced by variable results. This is a consequence of the model achieving the minimal objective by trading-off among the three objectives. For example, when D = 1, connectivity loss worsens by about 3% when q ranges from 0% to 5% (Figure 7). However, there is a reduction in connectivity loss of around 3% when q is further increased to 15%. Similar patterns can be appreciated with other values of D and focusing on path and flow as well. For example, when , increasing the budget from 15% to 20% results in a 11% increment in the path length (Figure 8).
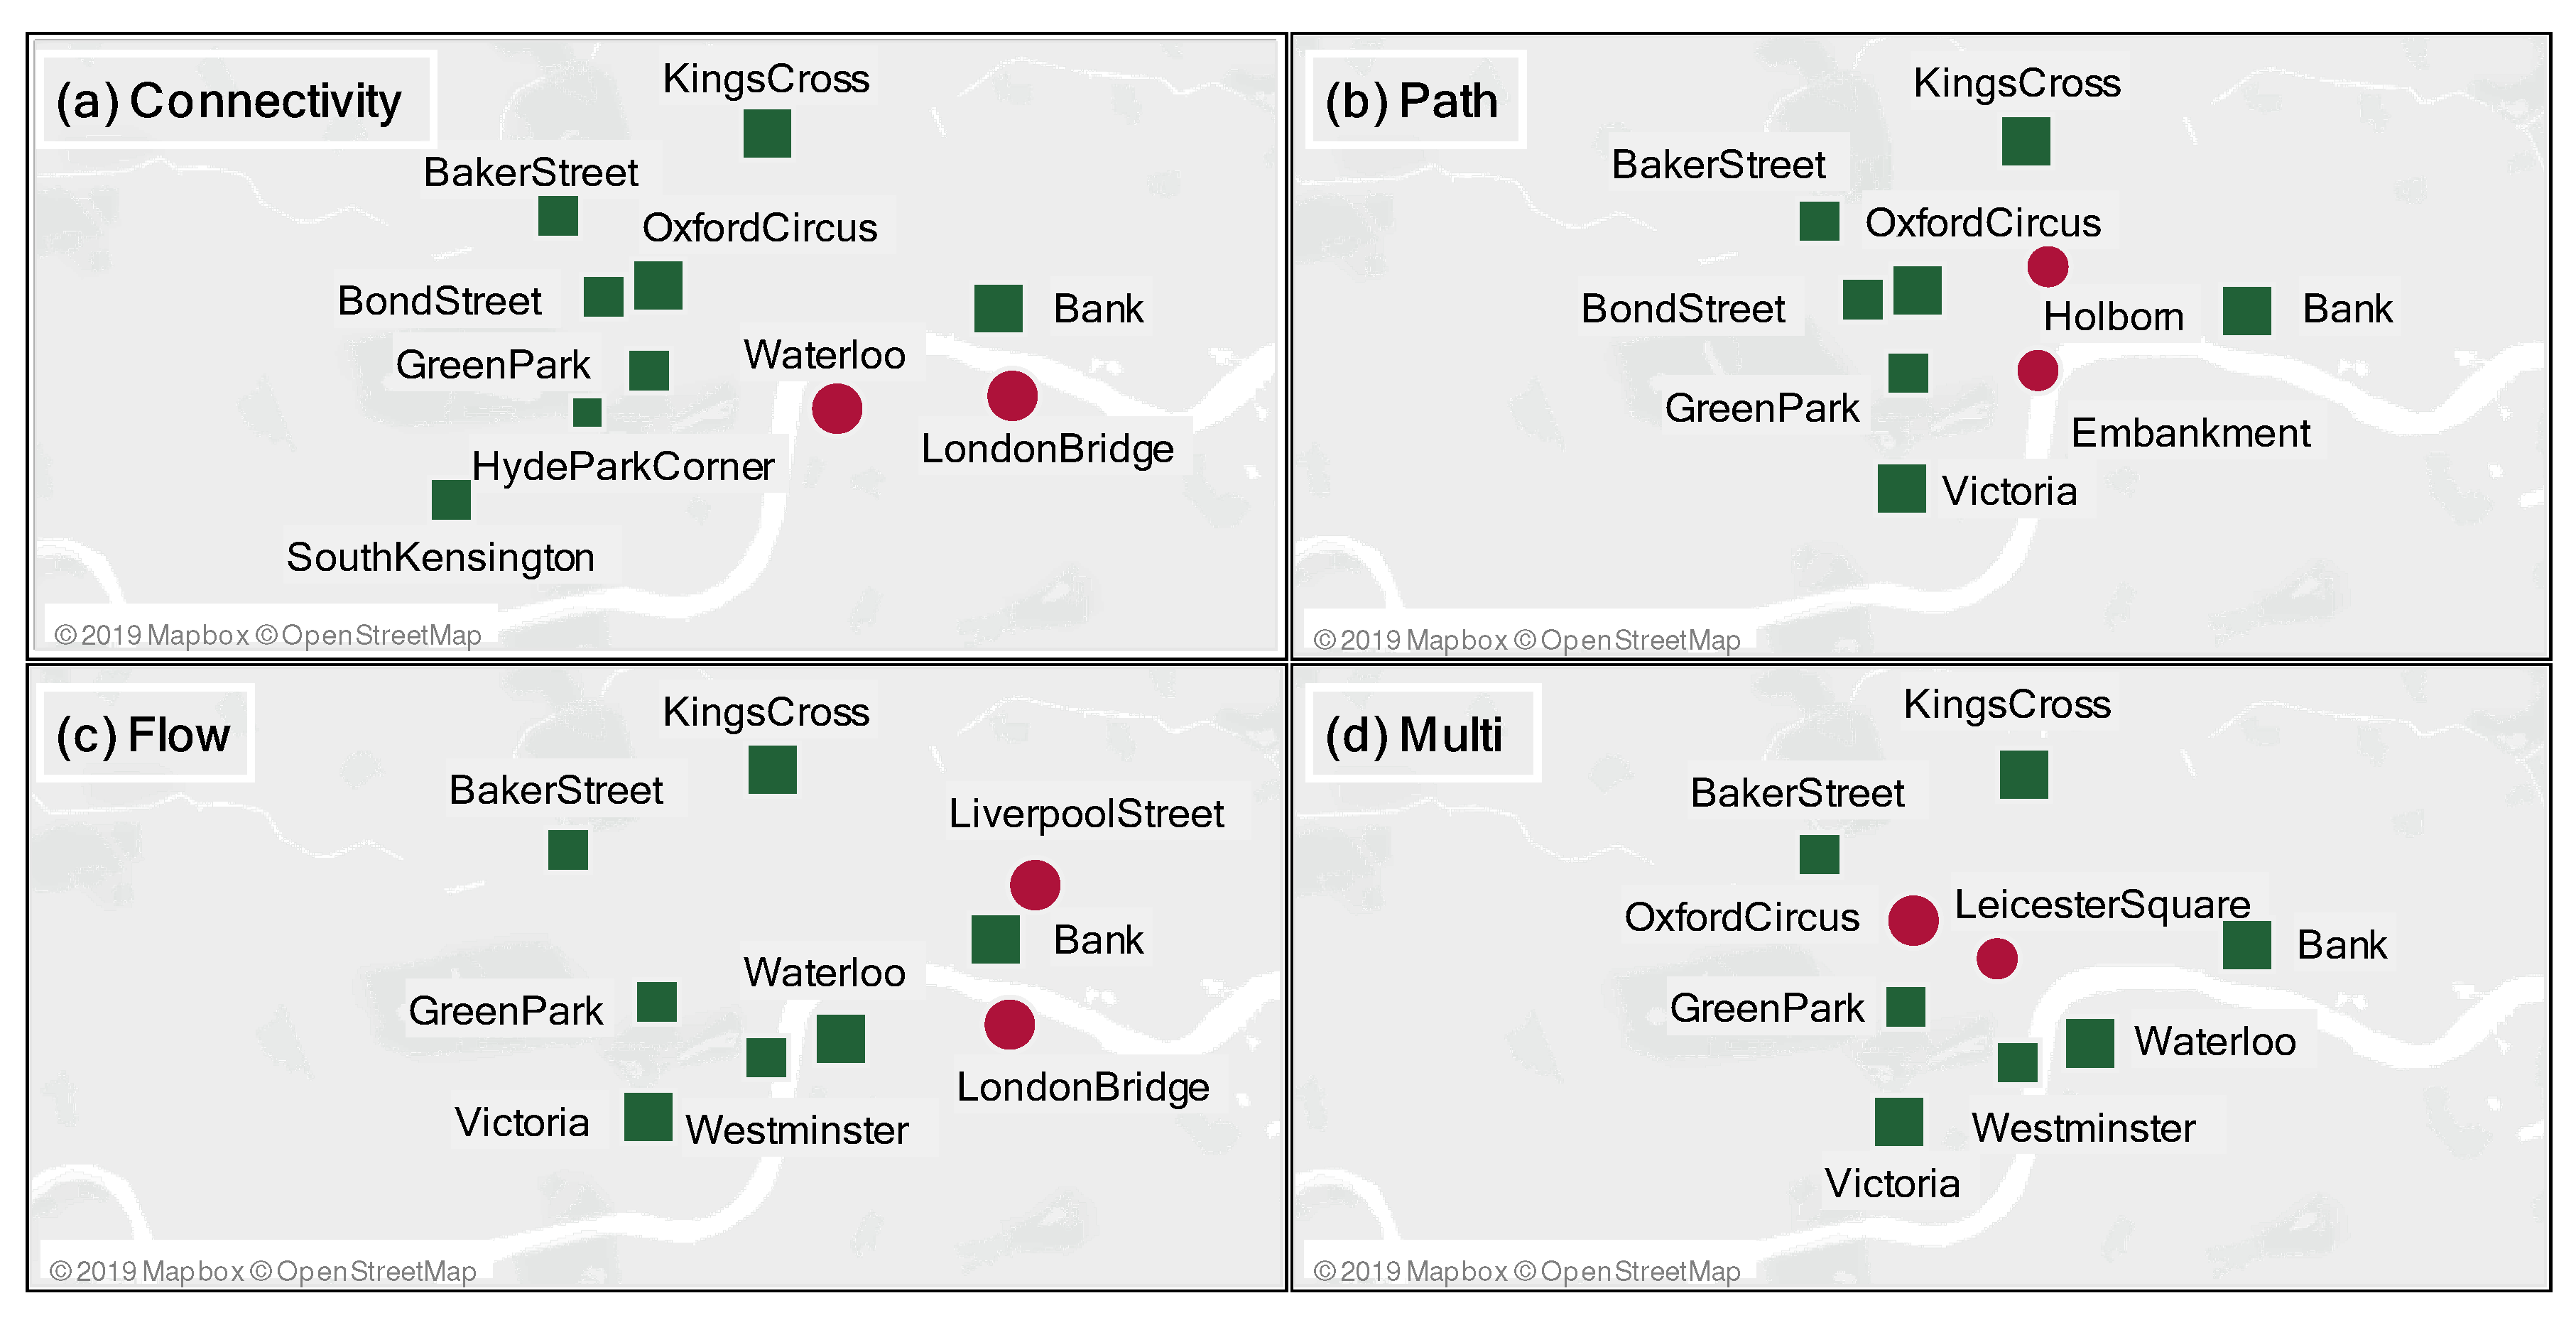
Another aspect worth mentioning is the difference in the optimal protection plans selected by the models. Figure 10 and Figure 11 display both disrupted (red dots) and protected stations (green squares) for (a), (b), (c) and (d) for the combinations , and , , respectively. The dimension of both dots and squares identifies the size category of each station.
Figure 10a,c show that and , despite having different fortification plans, result in the same station (Moorgate) being disrupted. South Kensington and Liverpool Street are disrupted by and , respectively. Hence, it seems that the path perspective (b) differs from the connectivity, flow and multi-criteria ones. As for the protection decisions, there are a number of stations that appear in all plans, such as King’s Cross, Baker Street, Victoria and Bank. Green Park station is present in Figure 10a,b,d but discarded by . Similarly, Waterloo station can be found in Figure 10a,c,d but is not considered by . Finally, Oxford Circus and Liverpool Street are the only stations appearing in only one fortification plan ( and , respectively).
The differences in the disrupted stations increase when a more disruptive scenario is considered (i.e., ), while maintaining the same budget (). In fact, the worst case disruption sets are all different. The only overlap is the London Bridge station, selected by both and . Focusing on fortification, returns the same plan as for . Furthermore, and protect the same stations while identifying different worst-case disruptions. South Kensington is only selected by , while Oxford Circus is now protected by all models but . King’s Cross, Baker Street and Bank are again featured in all plans, whereas Victoria is dropped by . Overall, these examples consistently show that some stations are more critical than others while also highlighting some differences when different perspectives are taken into account.
To assess the benefit of a multi-criteria approach, we provide a robustness analysis where fortification plans returned by a given model are evaluated with respect to the objectives of the other models. Specifically, for every optimal plan , we compute the value of for all the other models. Results are measured in terms of gaps between the obtained value of objective function and the optimal solution. Average results across all values of D and q are listed in Table 3. For example, the table indicates that protecting the stations selected by leads to an average 41% increase in the worst-case flow loss. Results suggest that the strategies identified by and perform poorly when flow loss is considered. Overall, returns the smallest average and maximum gaps. However, the balance between these gaps is still biased against the flow loss which is significantly larger than the other gaps. This issue can be addressed by empirically changing the weights of the objectives.
5.3. Comparing Sequential and Integrated Approaches
In this section, we compare the quality of the protection plans built with the sequential and integrated approaches. To provide a fair comparison, we test metrics only against their counterpart model. For example, connectivity metrics, such as ND, are compared against only and similarly for path, flow and multi-criteria models. Comparisons are made by identifying the protection strategy suggested by a given metric-based ranking and solving the relevant RFP model while setting the variables according to the chosen strategy. Results are shown as percentage gap between the objectives. For instance, focusing on the connectivity problem when and , the fortification strategy identified by IM results in 18% more disconnected pairs compared to .
Table 4 summarises the comparative analysis by listing the percentage objective gap between sequential and integrated approaches. A positive non-zero gap indicates the extent to which a given metric is performing worse than RFP. It is evident that all connectivity metrics (IM, ND, ST and WI) result in worse performing protection plans compared to . Among them, ND is the metric that differs the least from the model and, as such, seems more trustworthy with a gap of 20%, 21%, and 15%, when D is set equal to 1, 2, and 3, respectively. On the other hand, the worst-performing metric is IM whose gaps are equal to 48%, 52%, and 37%. The other two metrics, ST and WI, provide average performances close to ND. Focusing on path-driven metrics (HC, IM, NB, NV, SV, WA and WI), the fortification strategies are always sub-optimal when compared to plans. Specifically, the NV is the metric that differs the least from the model and, as such, seems more trustworthy. In fact, the path interdiction gap is equal to 3%, 4%, and 5% when D is set equal to 1, 2, and 3, respectively. Conversely, the worst-performing metrics are IM and NV whose objectives’ gaps are equal to 7%, 14%, and 13% when D is set equal to 1, 2, and 3, respectively. Thirdly, let us compare flow-driven metrics (PF, ST, SV, WA and WI) with . As for the previous cases, it can be noted that the metrics overall do not match the plans selected by . However, some differences arise. Specifically, when D = 1, PF provides a perfect match with . ST, SV and WA also sporadically identify optimal plans and, on average, provide the best overall performance with a flow disruption gap of about 11%.
Finally, let us consider the combined scenario. For this purpose, the metric to be considered is the weighted node importance (WI) and the model is . Table 5 reports the value of RFP objective function against the number of stations to be disrupted (D), computed on average across all the possible values of fortification resources. As for the previous cases, it can be noted that WI identify worse performing protection strategies, leading to connectivity, path and flow deterioration. In fact, the average gap is equal to 10%, 9%, and 10% when D is set equal to 1, 2, and 3, respectively.
In summary, this analysis highlights that the sequential approach underestimates the potential losses due to worst-case disruptions and selects sub-optimal protection plans. Optimisation approaches are therefore a more effective and reliable tool to estimate the impact of disruptions and allocate scarce protection resources.
6. Conclusions
This paper addresses the strategic problem of fortification resource allocation so as to minimize worst-case disruptions affecting railway systems. We provide two protection strategy approaches: a sequential approach based on several single-asset metrics and an integrated approach based on fortification models. Both approaches focus on railway systems features such as connectivity, path length and flow, in either a separate or combined way. Novel vulnerability metric WI and fortification model (RFP) are introduced and tested on a case study based on the Central London Tube that has been built using real network traffic data.
Several findings have emerged. Single asset metrics are suitable to define protection plans only if very limited fortification resources are available. In fact, results consistently show that, when the budget is low, several metrics identify optimal or near-optimal plans. Among them, the WI is the only metric that can be used to obtain suitable plans accounting for any of the three evaluated perspectives (i.e., connectivity, path length, and flow). As the budget availability (hence the number of possible protection strategies) increases, station interdependencies play a more significant role. Metrics-based protection strategies completely overlook this aspect and result in highly sub-optimal plans as a consequence. This indicates the necessity of shifting towards a systemic approach provided by fortification models. RFP is firstly tested against individual criteria (single-scenario versions), showing consistent and significant improvements in post-disruptions objectives as more resources are depleted. A detailed analysis of the protection plans returned by the different versions of RFP shows that the criterion chosen as target of the optimisation leads to diverse strategies. In fact, despite sharing some stations (King’s Cross, for instance), protection plans focusing either on connectivity, path length, and flow are different. This finding is reflected into sub-optimal results when fortification strategies obtained from one perspective are applied to the remaining ones. Hence, this aspect further supports the need for a multi-criteria approach where connectivity, path length, and flow are tackled together, as in the combined-scenario version of RFP. In fact, in that case and specifically when connectivity, path, and flow are weighted equally, more balanced and robust protection plans can be identified. Overall, using RFP could benefit stakeholders so as to evaluate the trade off between different KPIs: it could be that flow is more relevant than connectivity and path length and, as such, RFP could provide a pool of protection strategies for different weigthing scenarios.
As for future research directions, the case study could be enlarged so as to account also for other zones of the London Underground, which will probably require to pair the current exact algorithm with a heuristic method so as to tackle the increasing computational complexity. Furthermore, an in-depth sensitivity analysis could be carried out so as to evaluate the performance of RFP for different combinations of the objective weights. Multi-objective optimisation modelling and solution techniques (-constraints, for instance) could also be incorporated to better account for the different magnitudes of the objectives. Finally, RFP might be also applied to other critical infrastructures such as communication networks: connectivity could be the most relevant aspect in this case; however, both path length and flow could be included to capture vulnerability issues related to hops count and amount of data transmitted over the network, respectively.
Author Contributions
Conceptualization, A.E.A., S.S. and M.P.S.; methodology, A.E.A., S.S. and M.P.S.; software, S.S.; validation, A.E.A., S.S. and M.P.S.; formal analysis, A.E.A.; data curation, S.S.; writing—original draft preparation, A.E.A; writing—review and editing, A.E.A., S.S. and M.P.S.; visualization, A.E.A. and S.S.; supervision, M.P.S.
Funding
This research received no external funding.
Conflicts of Interest
The authors declare no conflict of interest.
References
- Rodgers, L.; Qurashi, S.; Connor, S. 7 July London bombings: What happened that day? BBC, 3 July 2015. [Google Scholar]
- Eardley, N. Rail passengers face some delays at King’s Cross station. BBC, 29 December 2014. [Google Scholar]
- Weaver, M. Hospital, rail lines and roads flooded after heavy rain in England. Guardian, 11 June 2019. [Google Scholar]
- Derrible, S.; Kennedy, C. The complexity and robustness of metro networks. Phys. A Stat. Mech. Its Appl. 2010, 389, 3678–3691. [Google Scholar] [CrossRef]
- Zhang, J.; Zhao, M.; Liu, H.; Xu, X. Networked characteristics of the urban rail transit networks. Phys. A Stat. Mech. Its Appl. 2013, 392, 1538–1546. [Google Scholar] [CrossRef]
- Francis, R.; Bekera, B. A metric and frameworks for resilience analysis of engineered and infrastructure systems. Reliab. Eng. Syst. Saf. 2014, 121, 90–103. [Google Scholar] [CrossRef]
- Wang, X.; Koç, Y.; Derrible, S.; Ahmad, S.N.; Pino, W.J.; Kooij, R.E. Multi-criteria robustness analysis of metro networks. Phys. A Stat. Mech. Its Appl. 2017, 474, 19–31. [Google Scholar] [CrossRef]
- Zhang, J.; Wang, S.; Wang, X. Comparison analysis on vulnerability of metro networks based on complex network. Phys. A Stat. Mech. Its Appl. 2018, 496, 72–78. [Google Scholar] [CrossRef]
- Starita, S.; Esposito Amideo, A.; Scaparra, M.P. Assessing Urban Rail Transit Systems Vulnerability: Metrics vs. interdiction Models. In International Conference on Critical Information Infrastructures Security; D’Agostino, G., Scala, A., Eds.; Springer: Cham, Switerland, 2018; pp. 144–155. [Google Scholar]
- Rueda, D.F.; Calle, E.; Marzo, J.L. Robustness comparison of 15 real telecommunication networks: Structural and centrality measurements. J. Netw. Syst. Manag. 2017, 25, 269–289. [Google Scholar] [CrossRef]
- Wood, R.K. Deterministic Network Interdiction. Math. Comput. Model. 1993, 17, 1–18. [Google Scholar] [CrossRef]
- Scaparra, M.P.; Church, R.L. A bilevel mixed-integer program for critical infrastructure protection planning. Comput. Oper. Res. 2008, 35, 1905–1923. [Google Scholar] [CrossRef]
- Cappanera, P.; Scaparra, M.P. Optimal allocation of protective resources in shortest-path networks. Transp. Sci. 2011, 45, 64–80. [Google Scholar] [CrossRef]
- Scaparra, M.P.; Church, R.L. Protecting supply systems to mitigate potential disaster: A model to fortify capacitated facilities. Int. Reg. Sci. Rev. 2012, 35, 188–210. [Google Scholar] [CrossRef]
- Dempe, S. Foundations of Bilevel Programming; Kluwer Academie Publishers: Dordrecht, The Netherlands, 2002. [Google Scholar]
- Xing, Y.; Lu, J.; Chen, S.; Dissanayake, S. Vulnerability analysis of urban rail transit based on complex network theory: A Case study of Shanghai Metro. Public Transp. 2017, 9, 501–525. [Google Scholar] [CrossRef]
- Rochat, Y. Closeness centrality extended to unconnected graphs: The harmonic centrality index. In Proceedings of the 6th Applications of Social Network Analysis Conference (ASNA 2009), Zurich, Switzerland, 26–28 August 2009. [Google Scholar]
- Latora, V.; Marchiori, M. Efficient behavior of small-world networks. Phys. Rev. Lett. 2001, 87, 198701. [Google Scholar] [CrossRef] [PubMed]
- Sun, D.; Zhao, Y.; Lu, Q.C. Vulnerability analysis of urban rail transit networks: A case study of Shanghai, China. Sustainability 2015, 7, 6919–6936. [Google Scholar] [CrossRef]
- Yang, Y.; Liu, Y.; Zhou, M.; Li, F.; Sun, C. Robustness assessment of urban rail transit based on complex network theory: A case study of the Beijing Subway. Saf. Sci. 2015, 79, 149–162. [Google Scholar] [CrossRef]
- Kim, H.; Song, Y. An integrated measure of accessibility and reliability of mass transit systems. Transportation 2018, 45, 1075–1100. [Google Scholar] [CrossRef]
- Wollmer, R. Removing arcs from a network. Oper. Res. 1964, 12, 934–940. [Google Scholar] [CrossRef]
- Fulkerson, D.R.; Harding, G.C. Maximizing the minimum source-sink path subject to a budget constraint. Math. Program. 1977, 13, 116–118. [Google Scholar] [CrossRef]
- Israeli, E.; Wood, R.K. Shortest-path network interdiction. Netw. Int. J. 2002, 40, 97–111. [Google Scholar] [CrossRef]
- Bayrak, H.; Bailey, M.D. Shortest path network interdiction with asymmetric information. Netw. Int. J. 2008, 52, 133–140. [Google Scholar] [CrossRef]
- Borrero, J.S.; Prokopyev, O.A.; Saure, D. Sequential shortest path interdiction with incomplete information. Decis. Anal. 2015, 13, 68–98. [Google Scholar] [CrossRef]
- Sefair, J.A.; Smith, J.C. Dynamic shortest-path interdiction. Networks 2016, 68, 315–330. [Google Scholar] [CrossRef]
- Cormican, K.J.; Morton, D.P.; Wood, R.K. Stochastic network interdiction. Oper. Res. 1998, 46, 184–197. [Google Scholar] [CrossRef]
- Myung, Y.S.; Kim, H.J. A cutting plane algorithm for computing k-edge survivability of a network. Eur. J. Oper. Res. 2004, 156, 579–589. [Google Scholar] [CrossRef]
- Murray, A.T.; Matisziw, T.C.; Grubesic, T.H. Critical network infrastructure analysis: Interdiction and system flow. J. Geogr. Syst. 2007, 9, 103–117. [Google Scholar] [CrossRef]
- Grubesic, T.H.; Matisziw, T.C.; Murray, A.T.; Snediker, D. Comparative approaches for assessing network vulnerability. Int. Reg. Sci. Rev. 2008, 31, 88–112. [Google Scholar] [CrossRef]
- Brown, G.; Carlyle, M.; Salmeron, J.; Wood, K. Defending critical infrastructure. Interfaces 2006, 36, 530–544. [Google Scholar] [CrossRef]
- Aksen, D.; Piyade, N.; Aras, N. The budget constrained r-interdiction median problem ith capacity expansion. Cent. Eur. J. Oper. Res. 2010, 18, 269–291. [Google Scholar] [CrossRef]
- Liberatore, F.; Scaparra, M.P.; Daskin, M.S. Analysis of facility protection strategies against an uncertain number of attacks: The stochastic R-interdiction median problem with fortification. Comput. Oper. Res. 2011, 38, 357–366. [Google Scholar] [CrossRef]
- Losada, C.; Scaparra, M.P.; O’Hanley, J. Optimizing system resilience: A facility protection model with recovery time. Eur. J. Oper. Res. 2012, 217, 519–530. [Google Scholar] [CrossRef]
- Sadeghi, S.; Seifi, A.; Azizi, E. Trilevel shortest path network interdiction with partial fortification. Comput. Ind. Eng. 2017, 106, 400–411. [Google Scholar] [CrossRef]
- Lozano, L.; Smith, J.C.; Kurz, M.E. Solving the traveling salesman problem with interdiction and fortification. Oper. Res. Lett. 2017, 45, 210–216. [Google Scholar] [CrossRef] [Green Version]
- Binder, S.; Maknoon, Y.; Bierlaire, M. The multi-objective railway timetable rescheduling problem. Transp. Res. Part C 2017, 78, 78–94. [Google Scholar] [CrossRef] [Green Version]
- Shakibayifar, M.; Sheikholeslami, A.; Corman, F.; Hassannayebi, E. An integrated rescheduling model for minimizing train delays in the case of line blockage. Oper. Res. 2017, 1–29. [Google Scholar] [CrossRef]
- Xu, P.; Corman, F.; Peng, Q.; Luan, X. A Timetable rescheduling approach and transition phases for high speed railway traffic during disruptions. Transp. Res. Rec. 2017, 2607, 82–92. [Google Scholar] [CrossRef] [Green Version]
- Xu, P.; Corman, F.; Peng, Q.; Luan, X. A train rescheduling model integrating speed management during disruptions of high-speed traffic under a quasi-moving block system. Transp. Res. Part B 2017, 104, 638–666. [Google Scholar] [CrossRef]
- Botte, M.; D’Acierno, L. Dispatching and rescheduling tasks and their interactions with travel demand and the energy domain: Models and algorithms. Urban Rail Transit 2018, 4, 163–197. [Google Scholar] [CrossRef]
- Jin, J.G.; Lu, L.; Sun, L.; Yin, J. Optimal allocation of protective resources in urban rail transit networks against intentional attacks. Transp. Res. Part E Logist. Transp. Rev. 2015, 84, 73–87. [Google Scholar] [CrossRef]
- Sarhadi, H.; Tulett, D.M.; Verma, M. A defender-attacker-defender approach to the optimal fortification of a rail intermodal terminal network. J. Transp. Secur. 2015, 8, 17–32. [Google Scholar] [CrossRef]
- Sarhadi, H.; Tulett, D.M.; Verma, M. An analytical approach to the protection planning of a rail intermodal terminal network. Eur. J. Oper. Res. 2017, 257, 511–525. [Google Scholar] [CrossRef]
- Scaparra, M.P.; Starita, S.; Sterle, C. Optimizing investment decisions for railway systems protection. In Railway Infrastructure Security; Springer: Cham, Switerland, 2015; pp. 215–233. [Google Scholar]
- Starita, S.; Scaparra, M.P. Optimizing dynamic investment decisions for railway systems protection. Eur. J. Oper. Res. 2016, 248, 543–557. [Google Scholar] [CrossRef] [Green Version]
- Starita, S.; Scaparra, M.P. Passenger railway network protection: A model with variable post-disruption demand service. J. Oper. Res. Soc. 2018, 69, 603–618. [Google Scholar] [CrossRef] [Green Version]
- Transport For London. TfL Annual Reports and Statement of Accounts 2017–18. Available online: http://content.tfl.gov.uk/tfl-annual-report-and-statement-of-accounts-2017-18.pdf (accessed on 18 September 2019).
- O’Hanley, J.R.; Church, R.L. Designing robust coverage networks to hedge against worst-case facility losses. Eur. J. Oper. Res. 2011, 209, 23–36. [Google Scholar] [CrossRef]
Figure 1.
Central London Underground network.

Figure 2.
Number of times a station is in a metric top ten.

Figure 3.
Number of times a station is in a metric bottom ten.

Figure 4.
Post-disruption connectivity loss for different values of D and q.
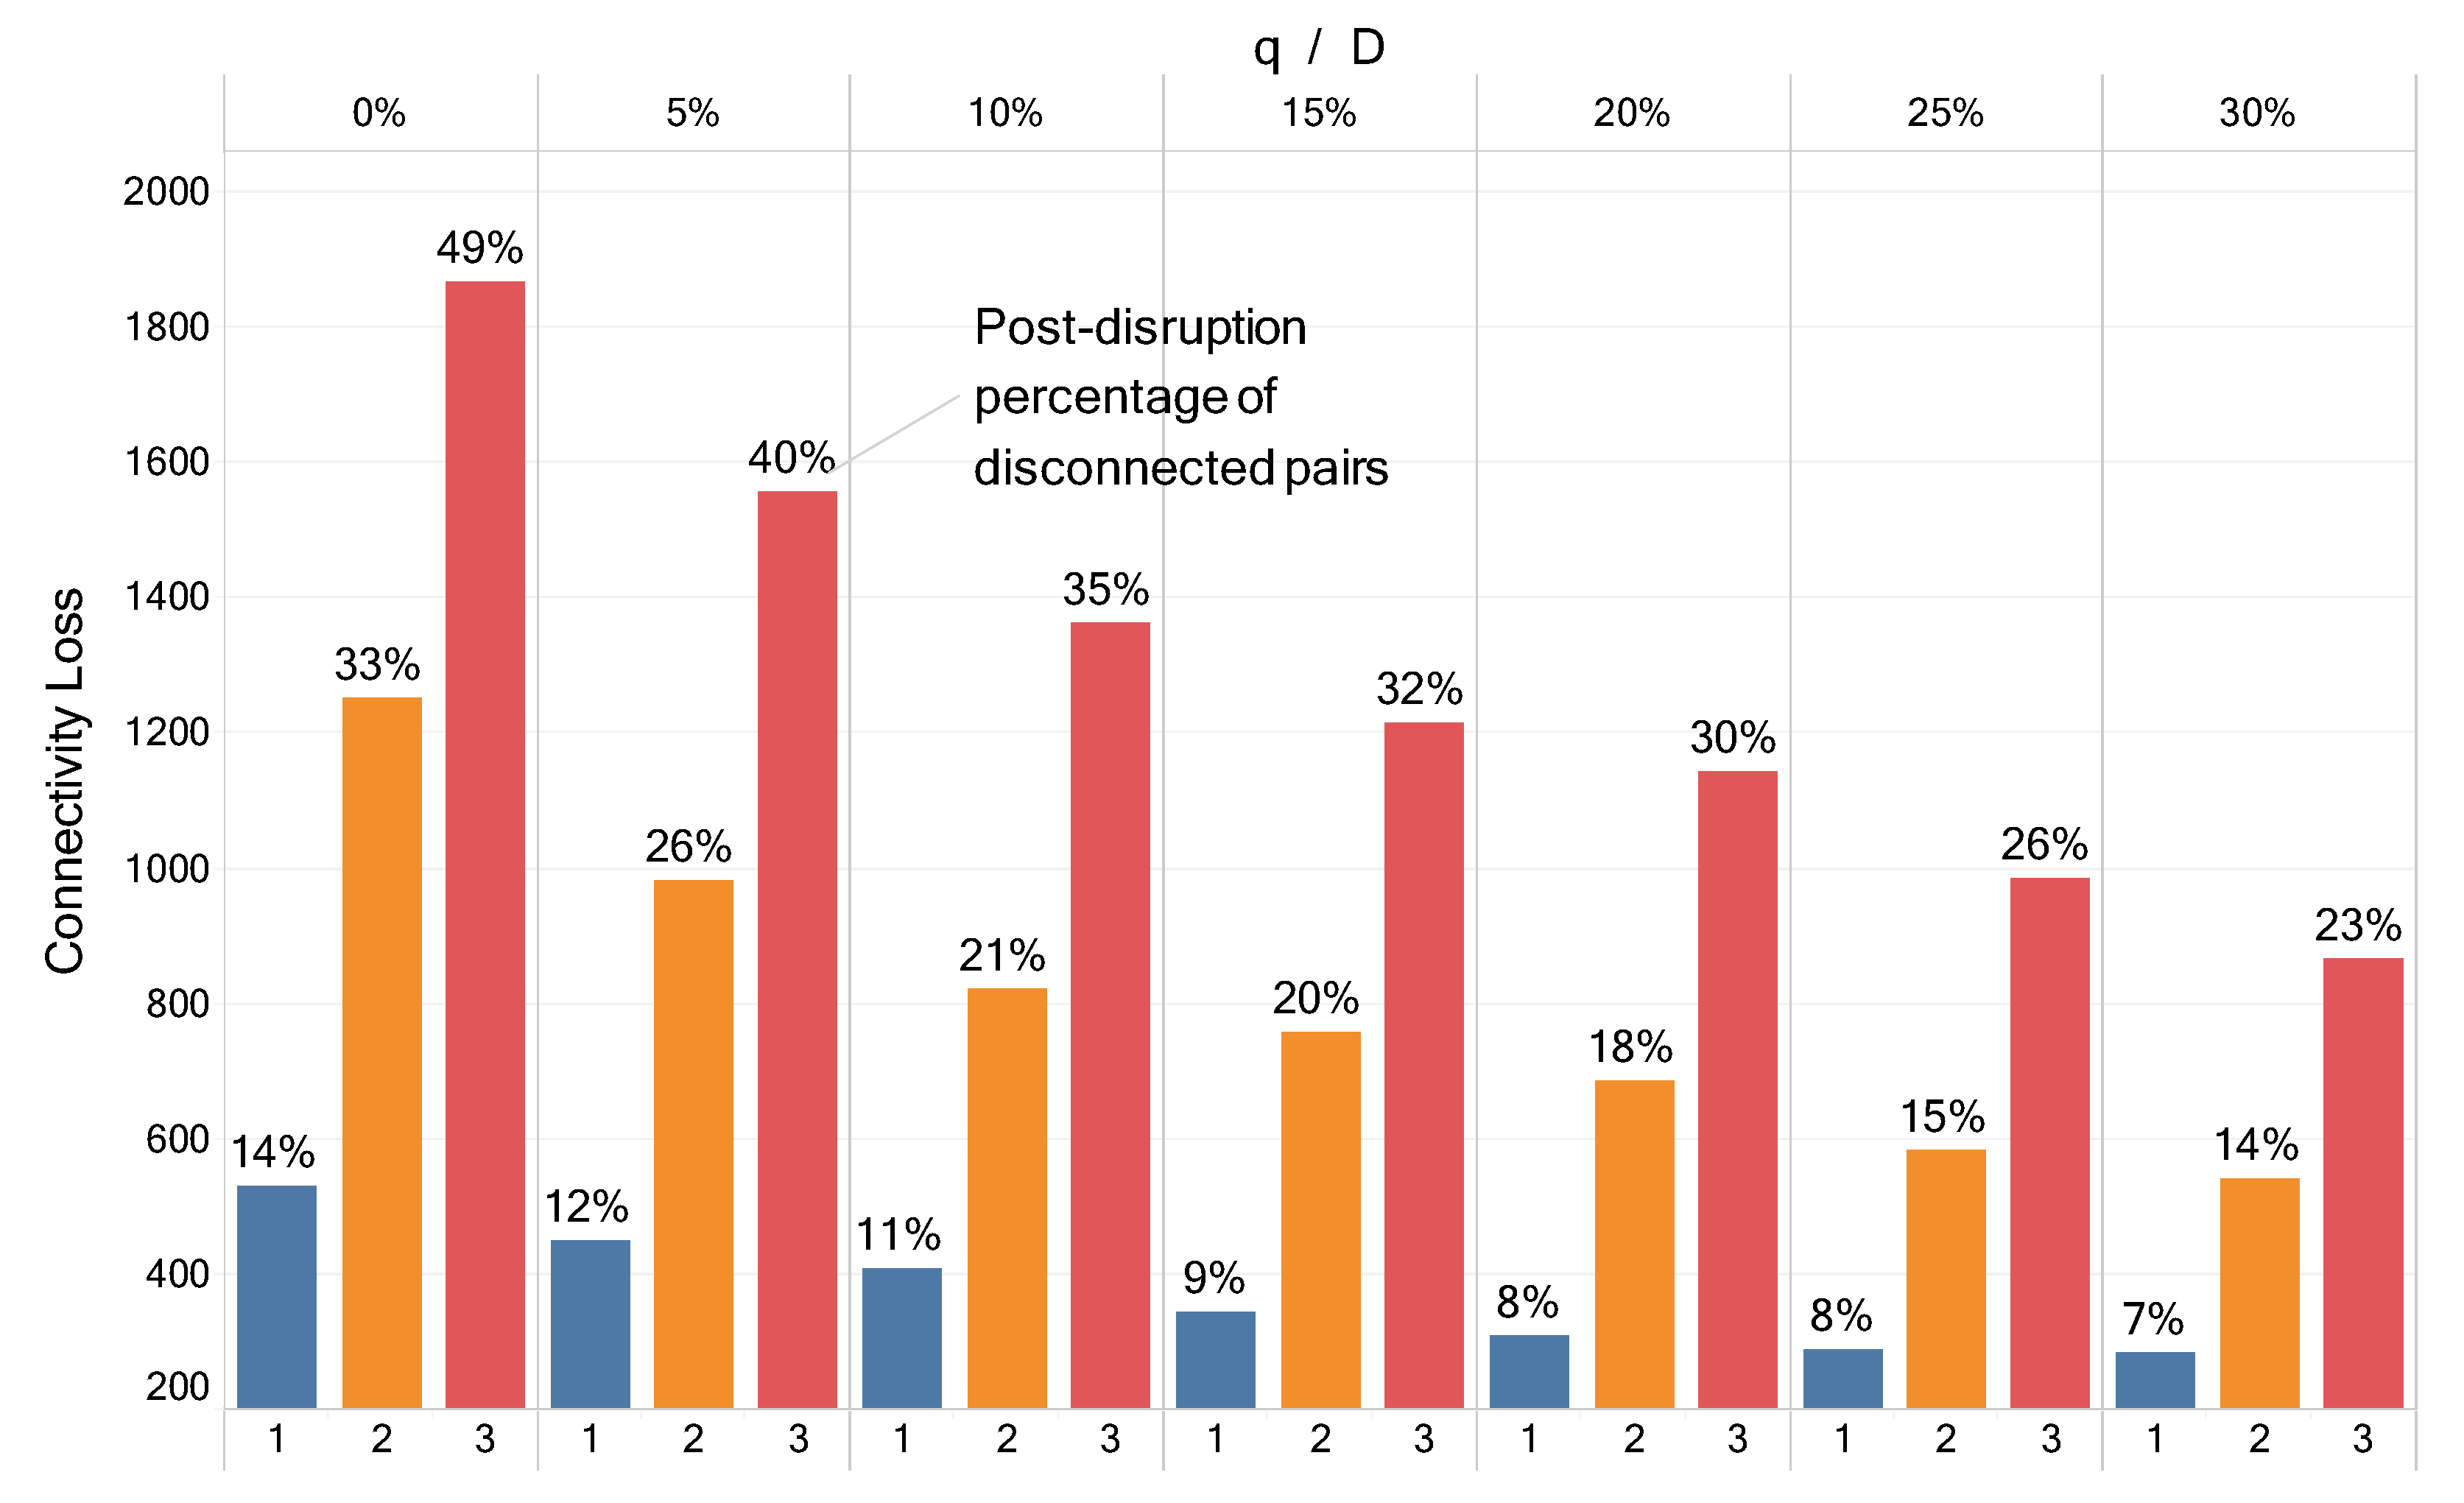
Figure 5.
Post-disruption path increment for different values of D and q.
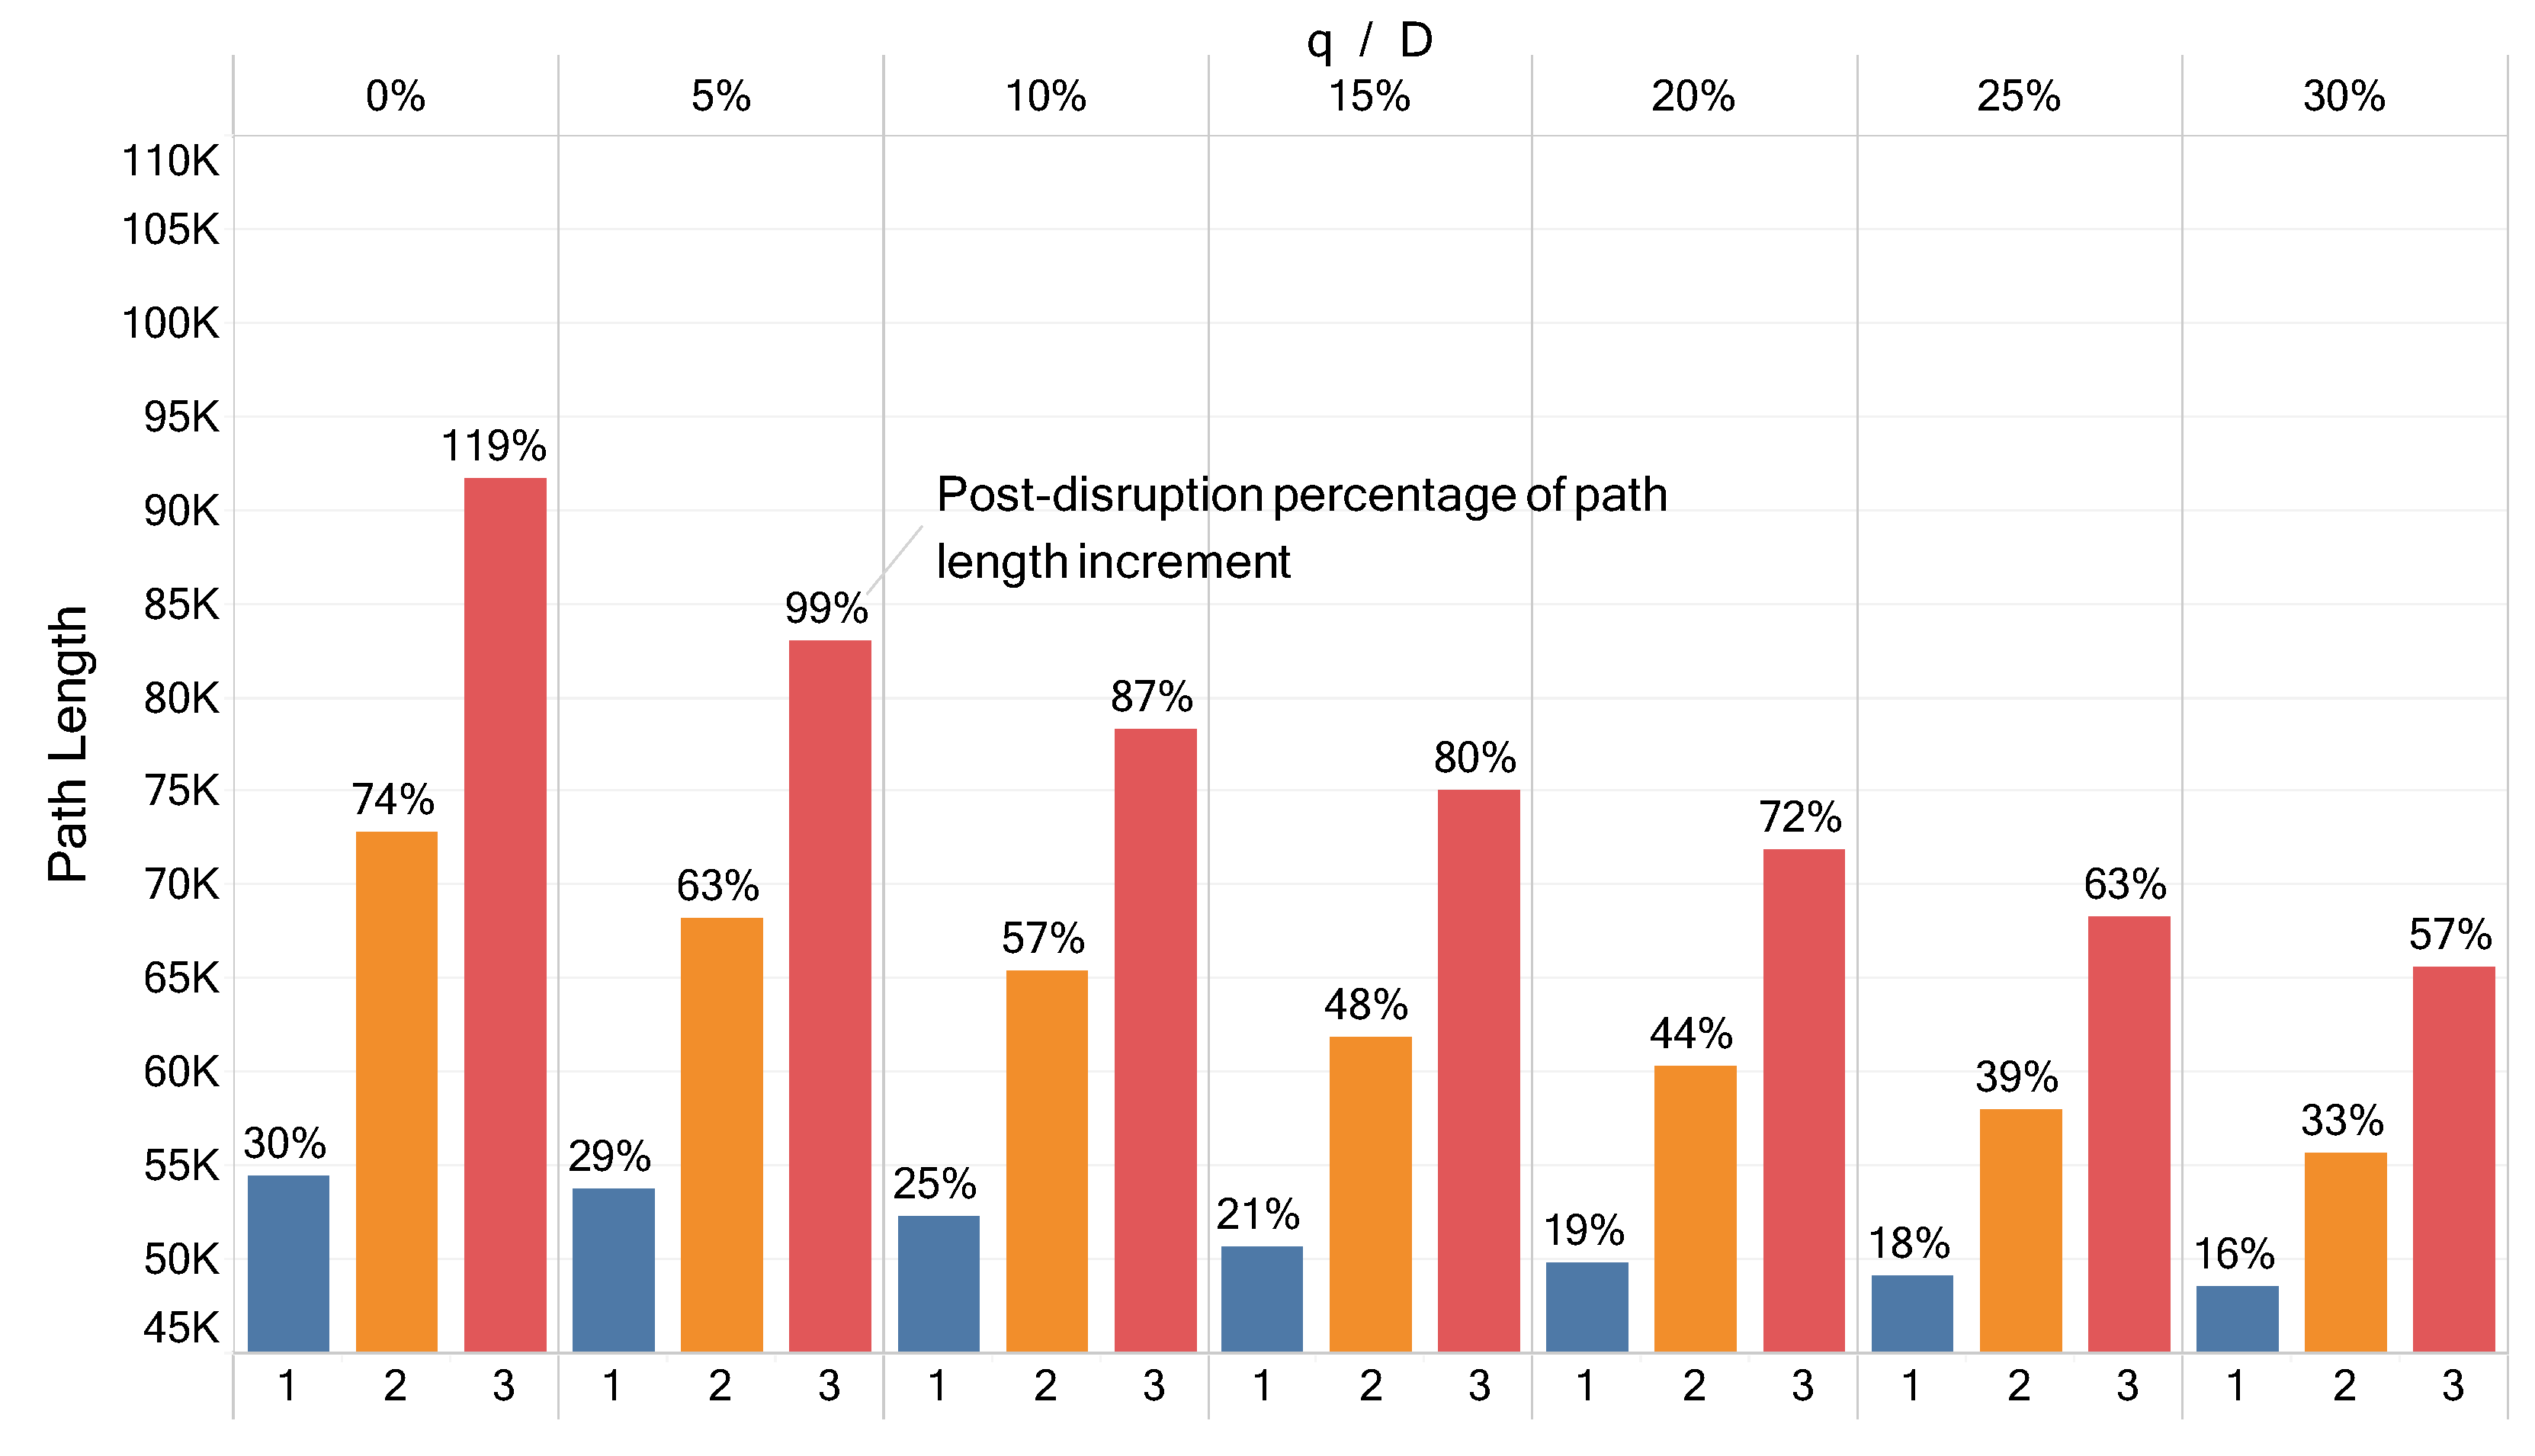
Figure 6.
Post-disruption flow loss for different values of D and q.

Figure 7.
Post-disruption connectivity loss for different values of D and q—multi-criteria model.
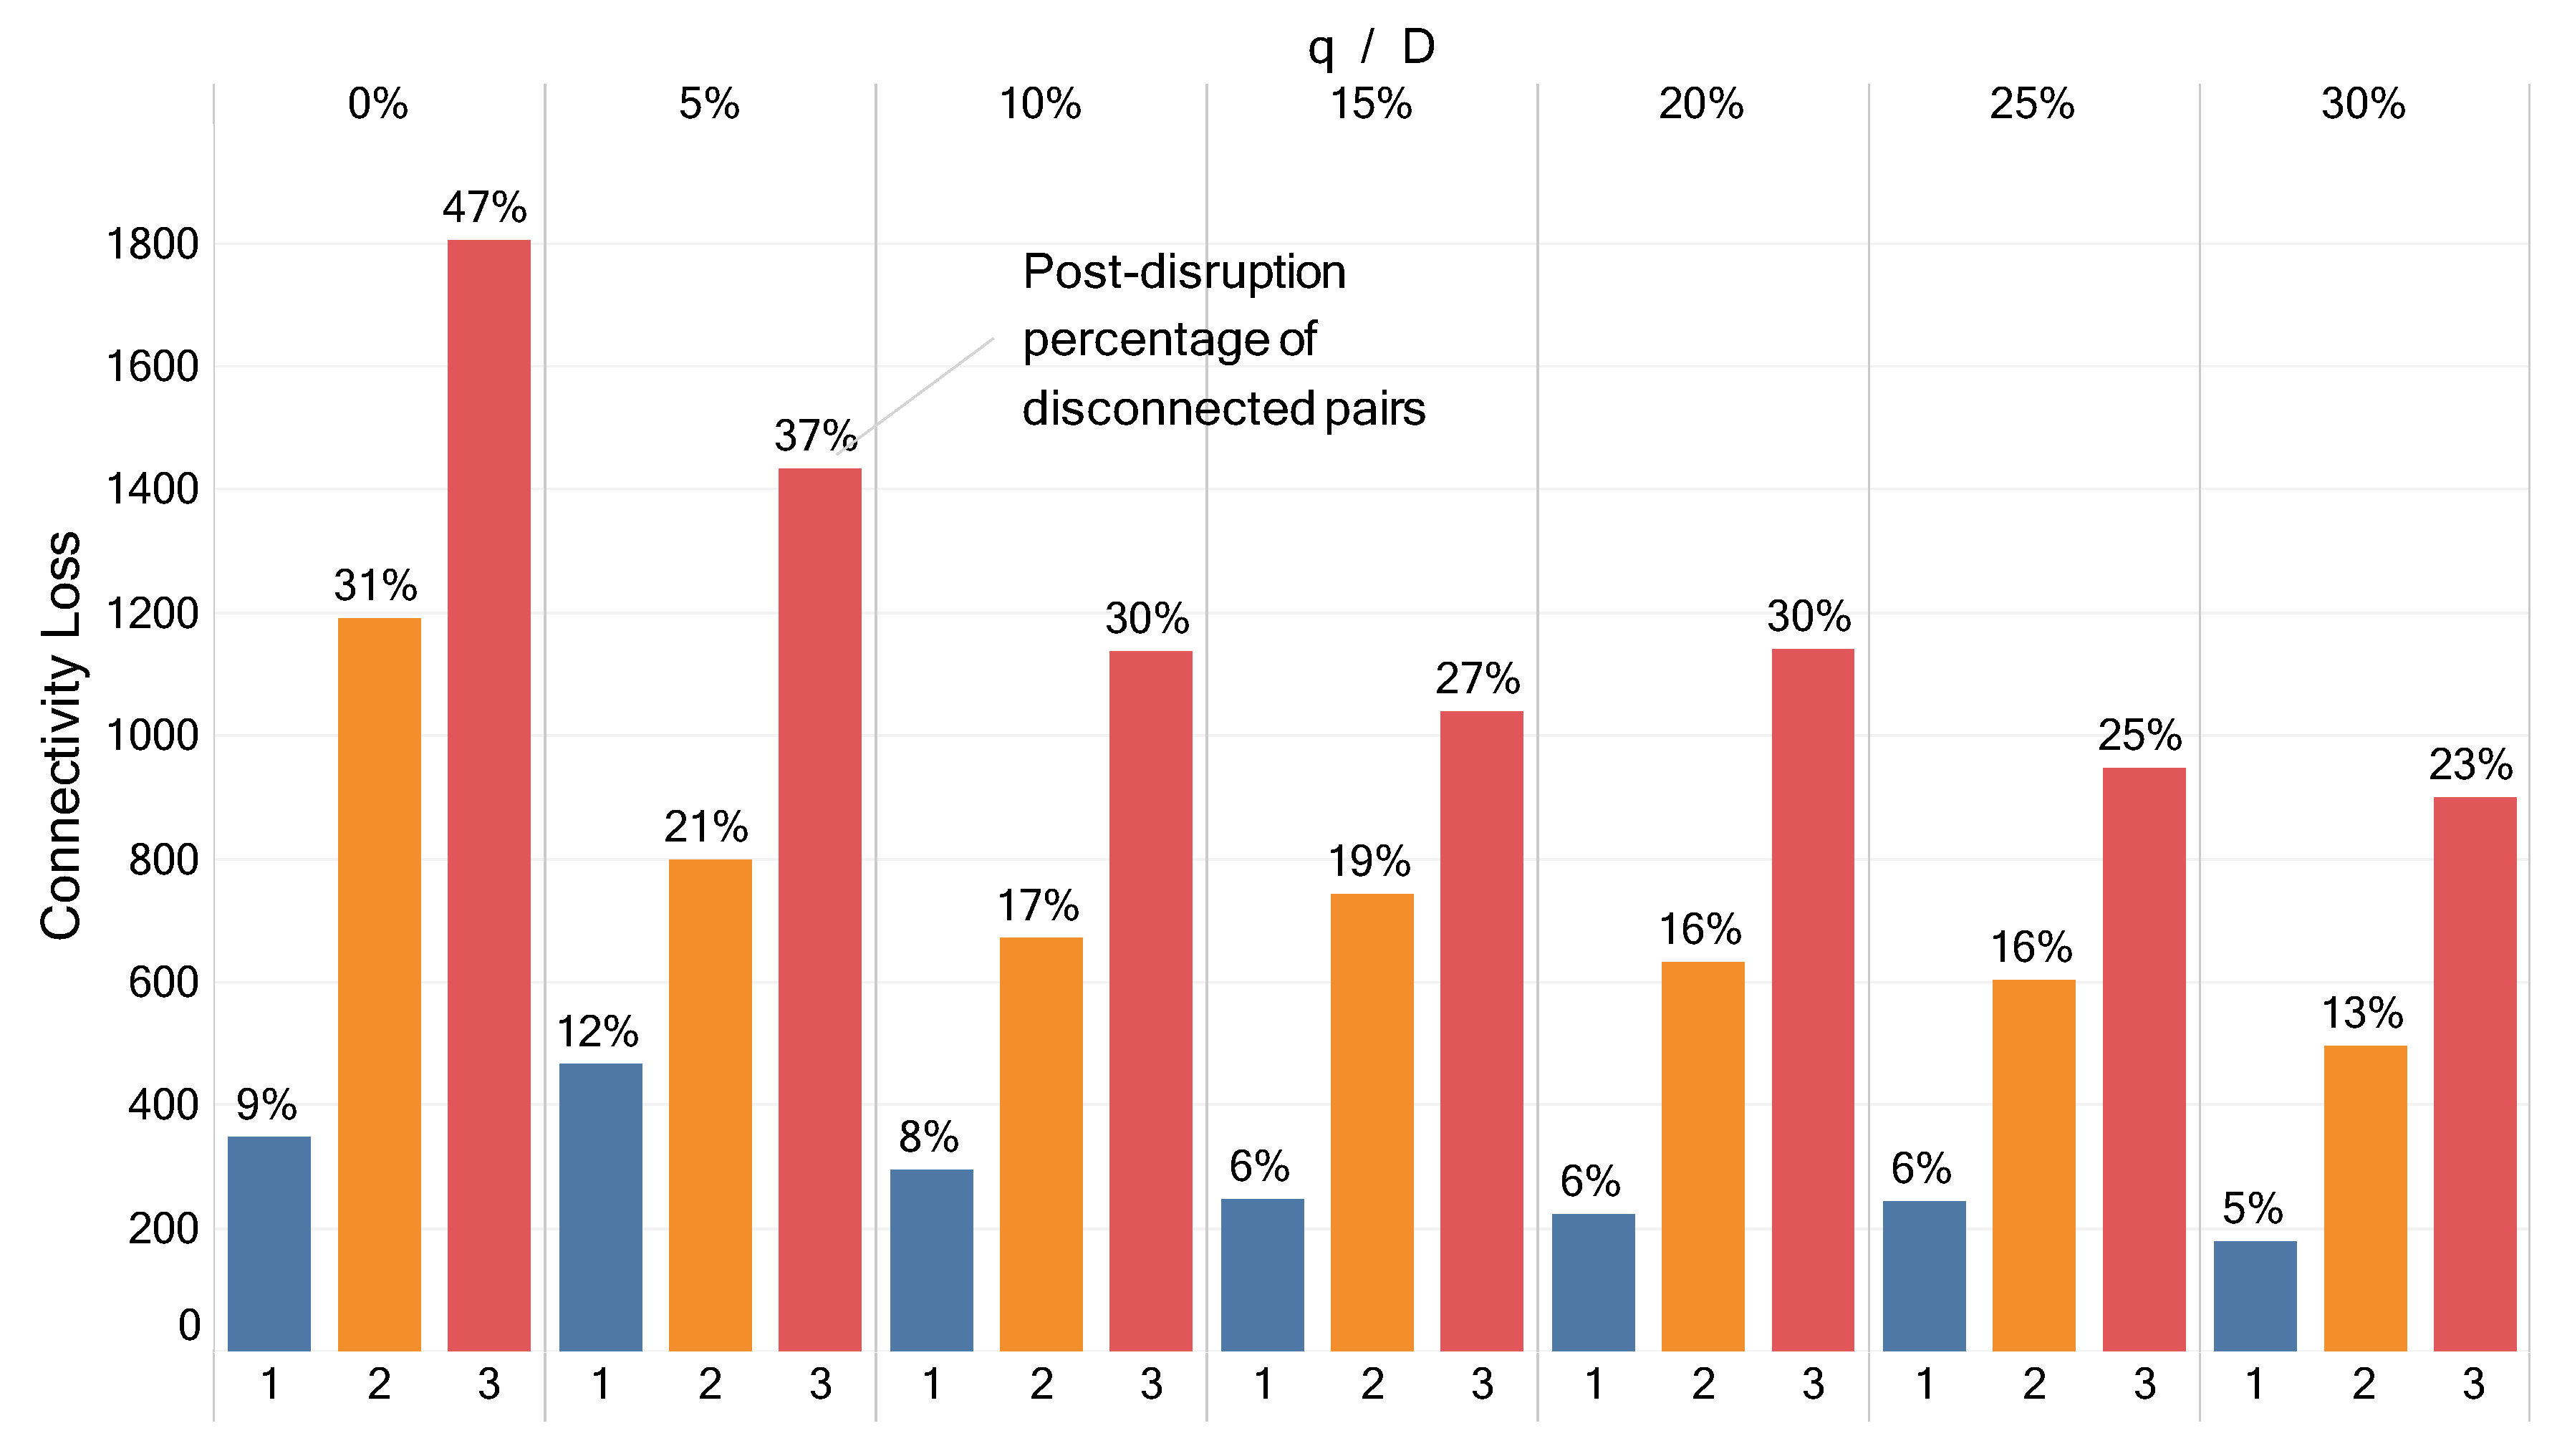
Figure 8.
Post-disruption path increment for different values of D and q—multi-criteria model.
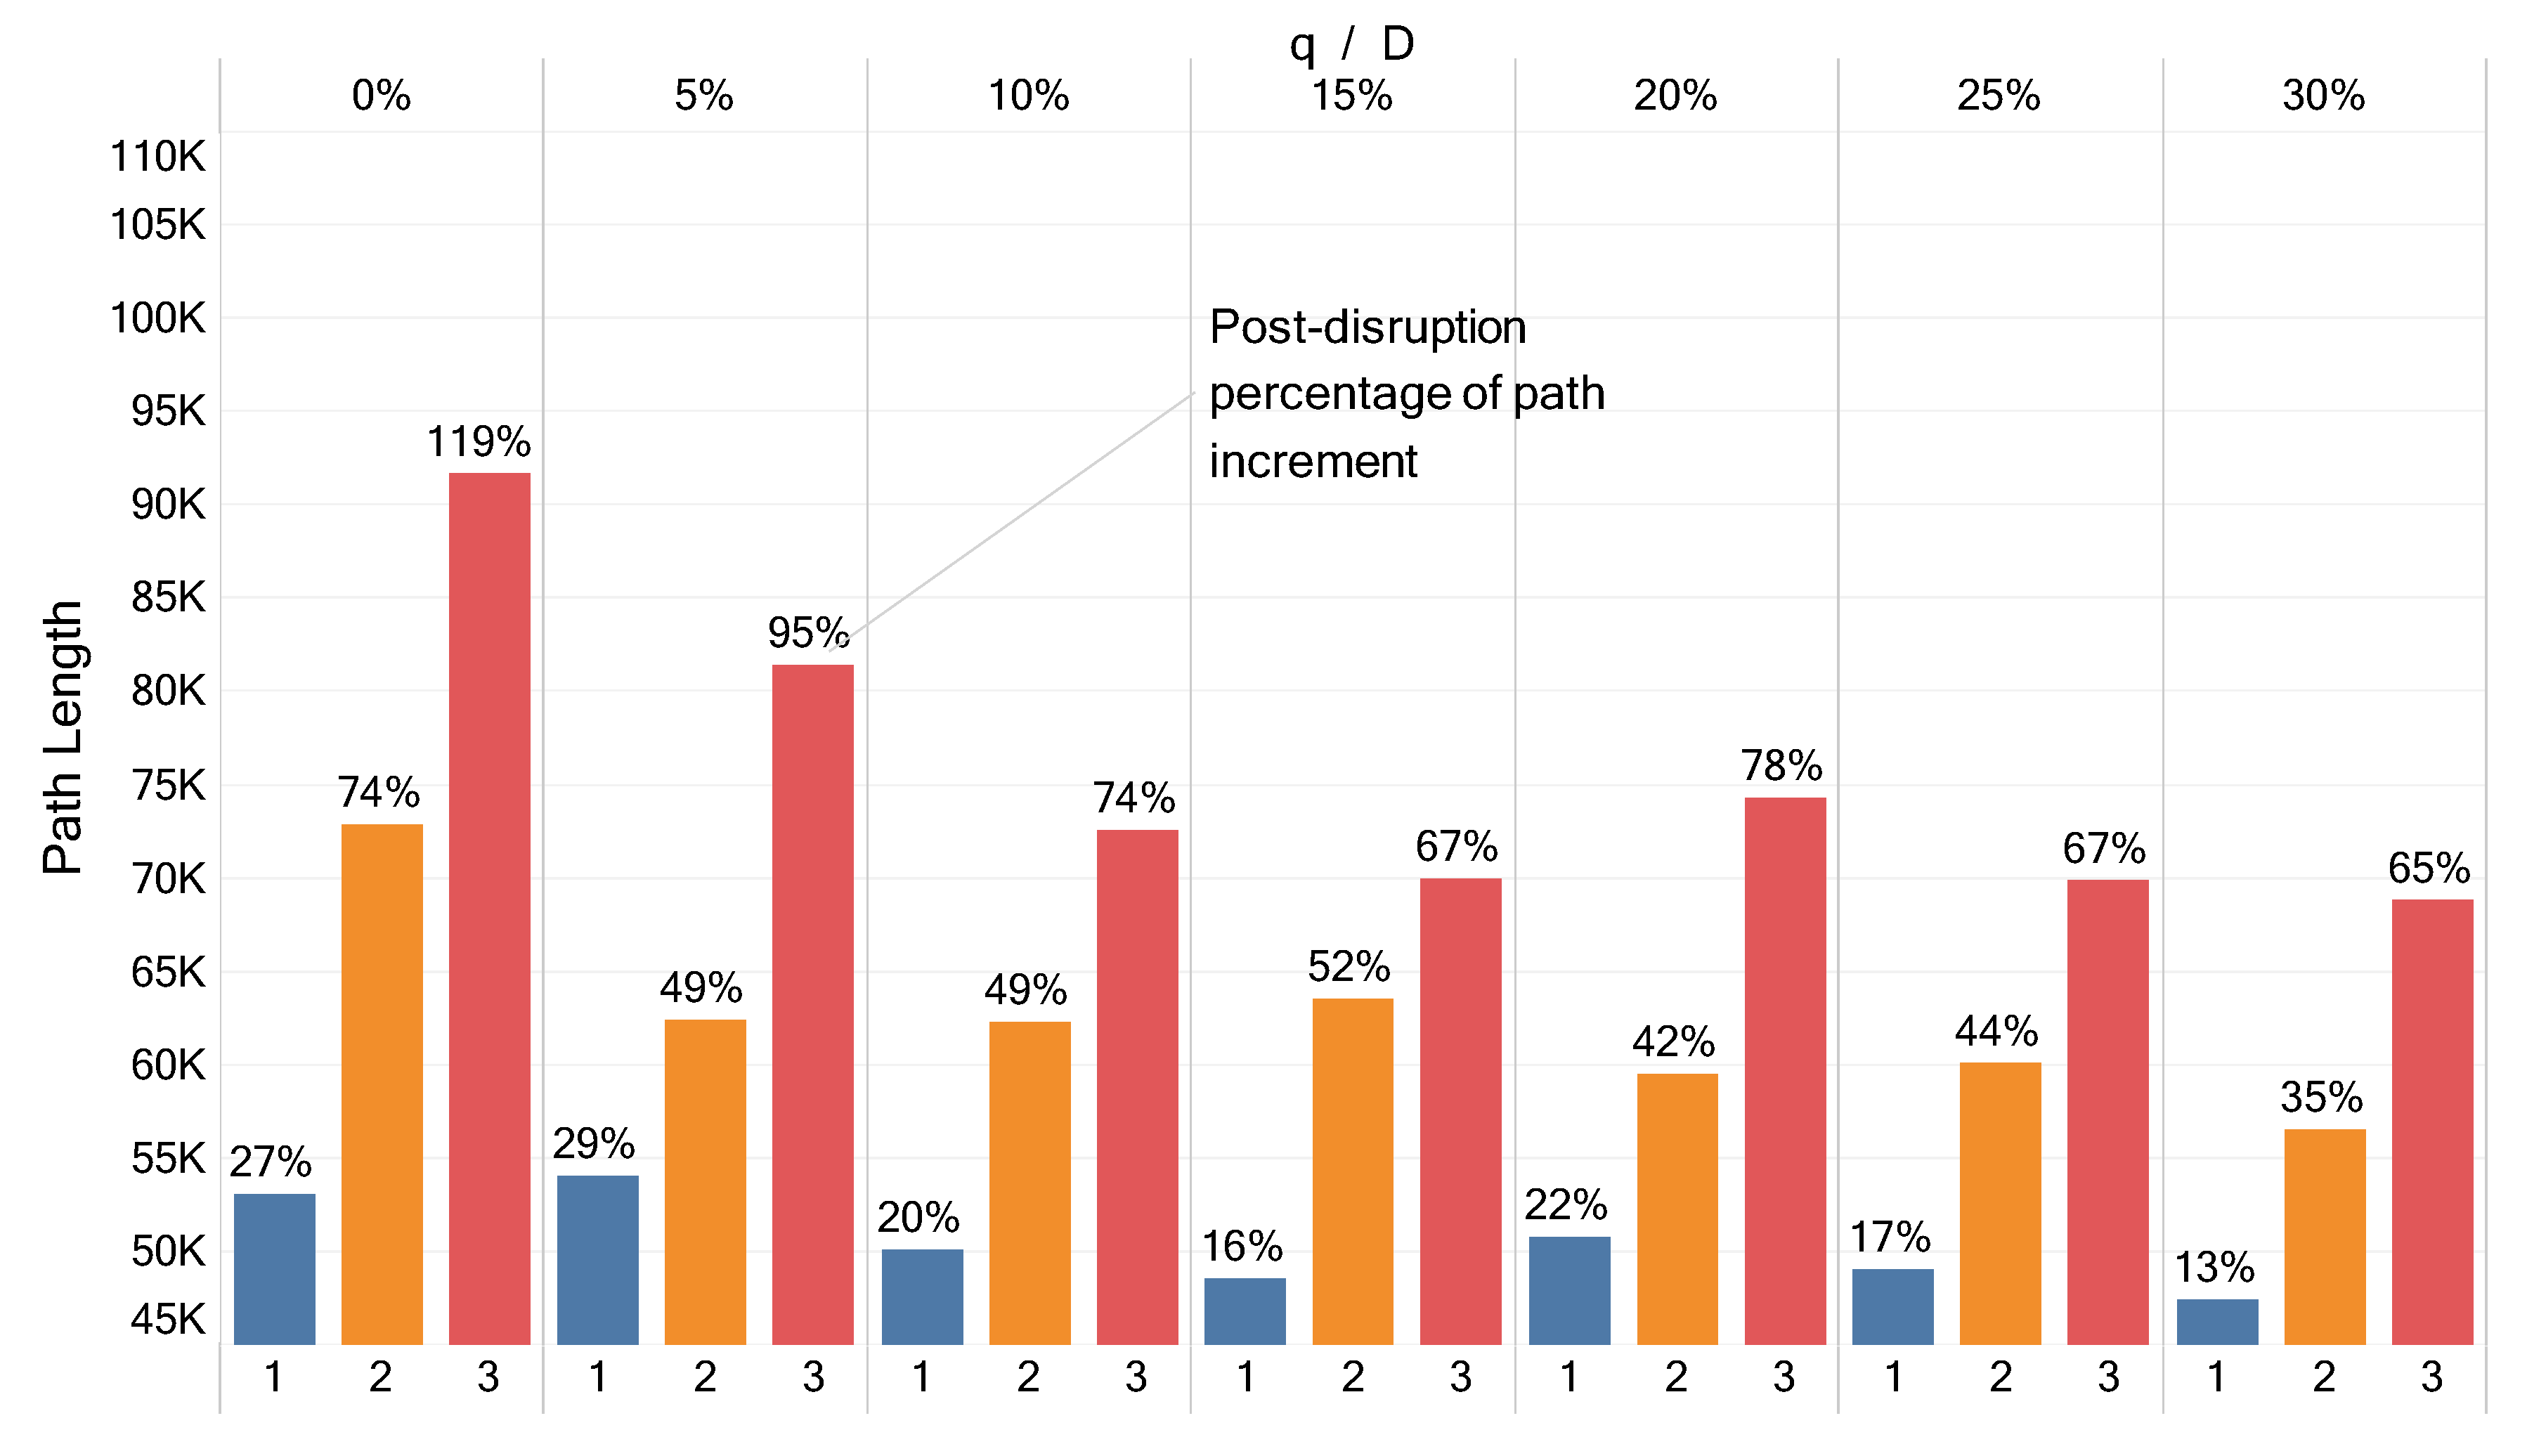
Figure 9.
Post-disruption flow loss for different values of D and q—multi-criteria model.
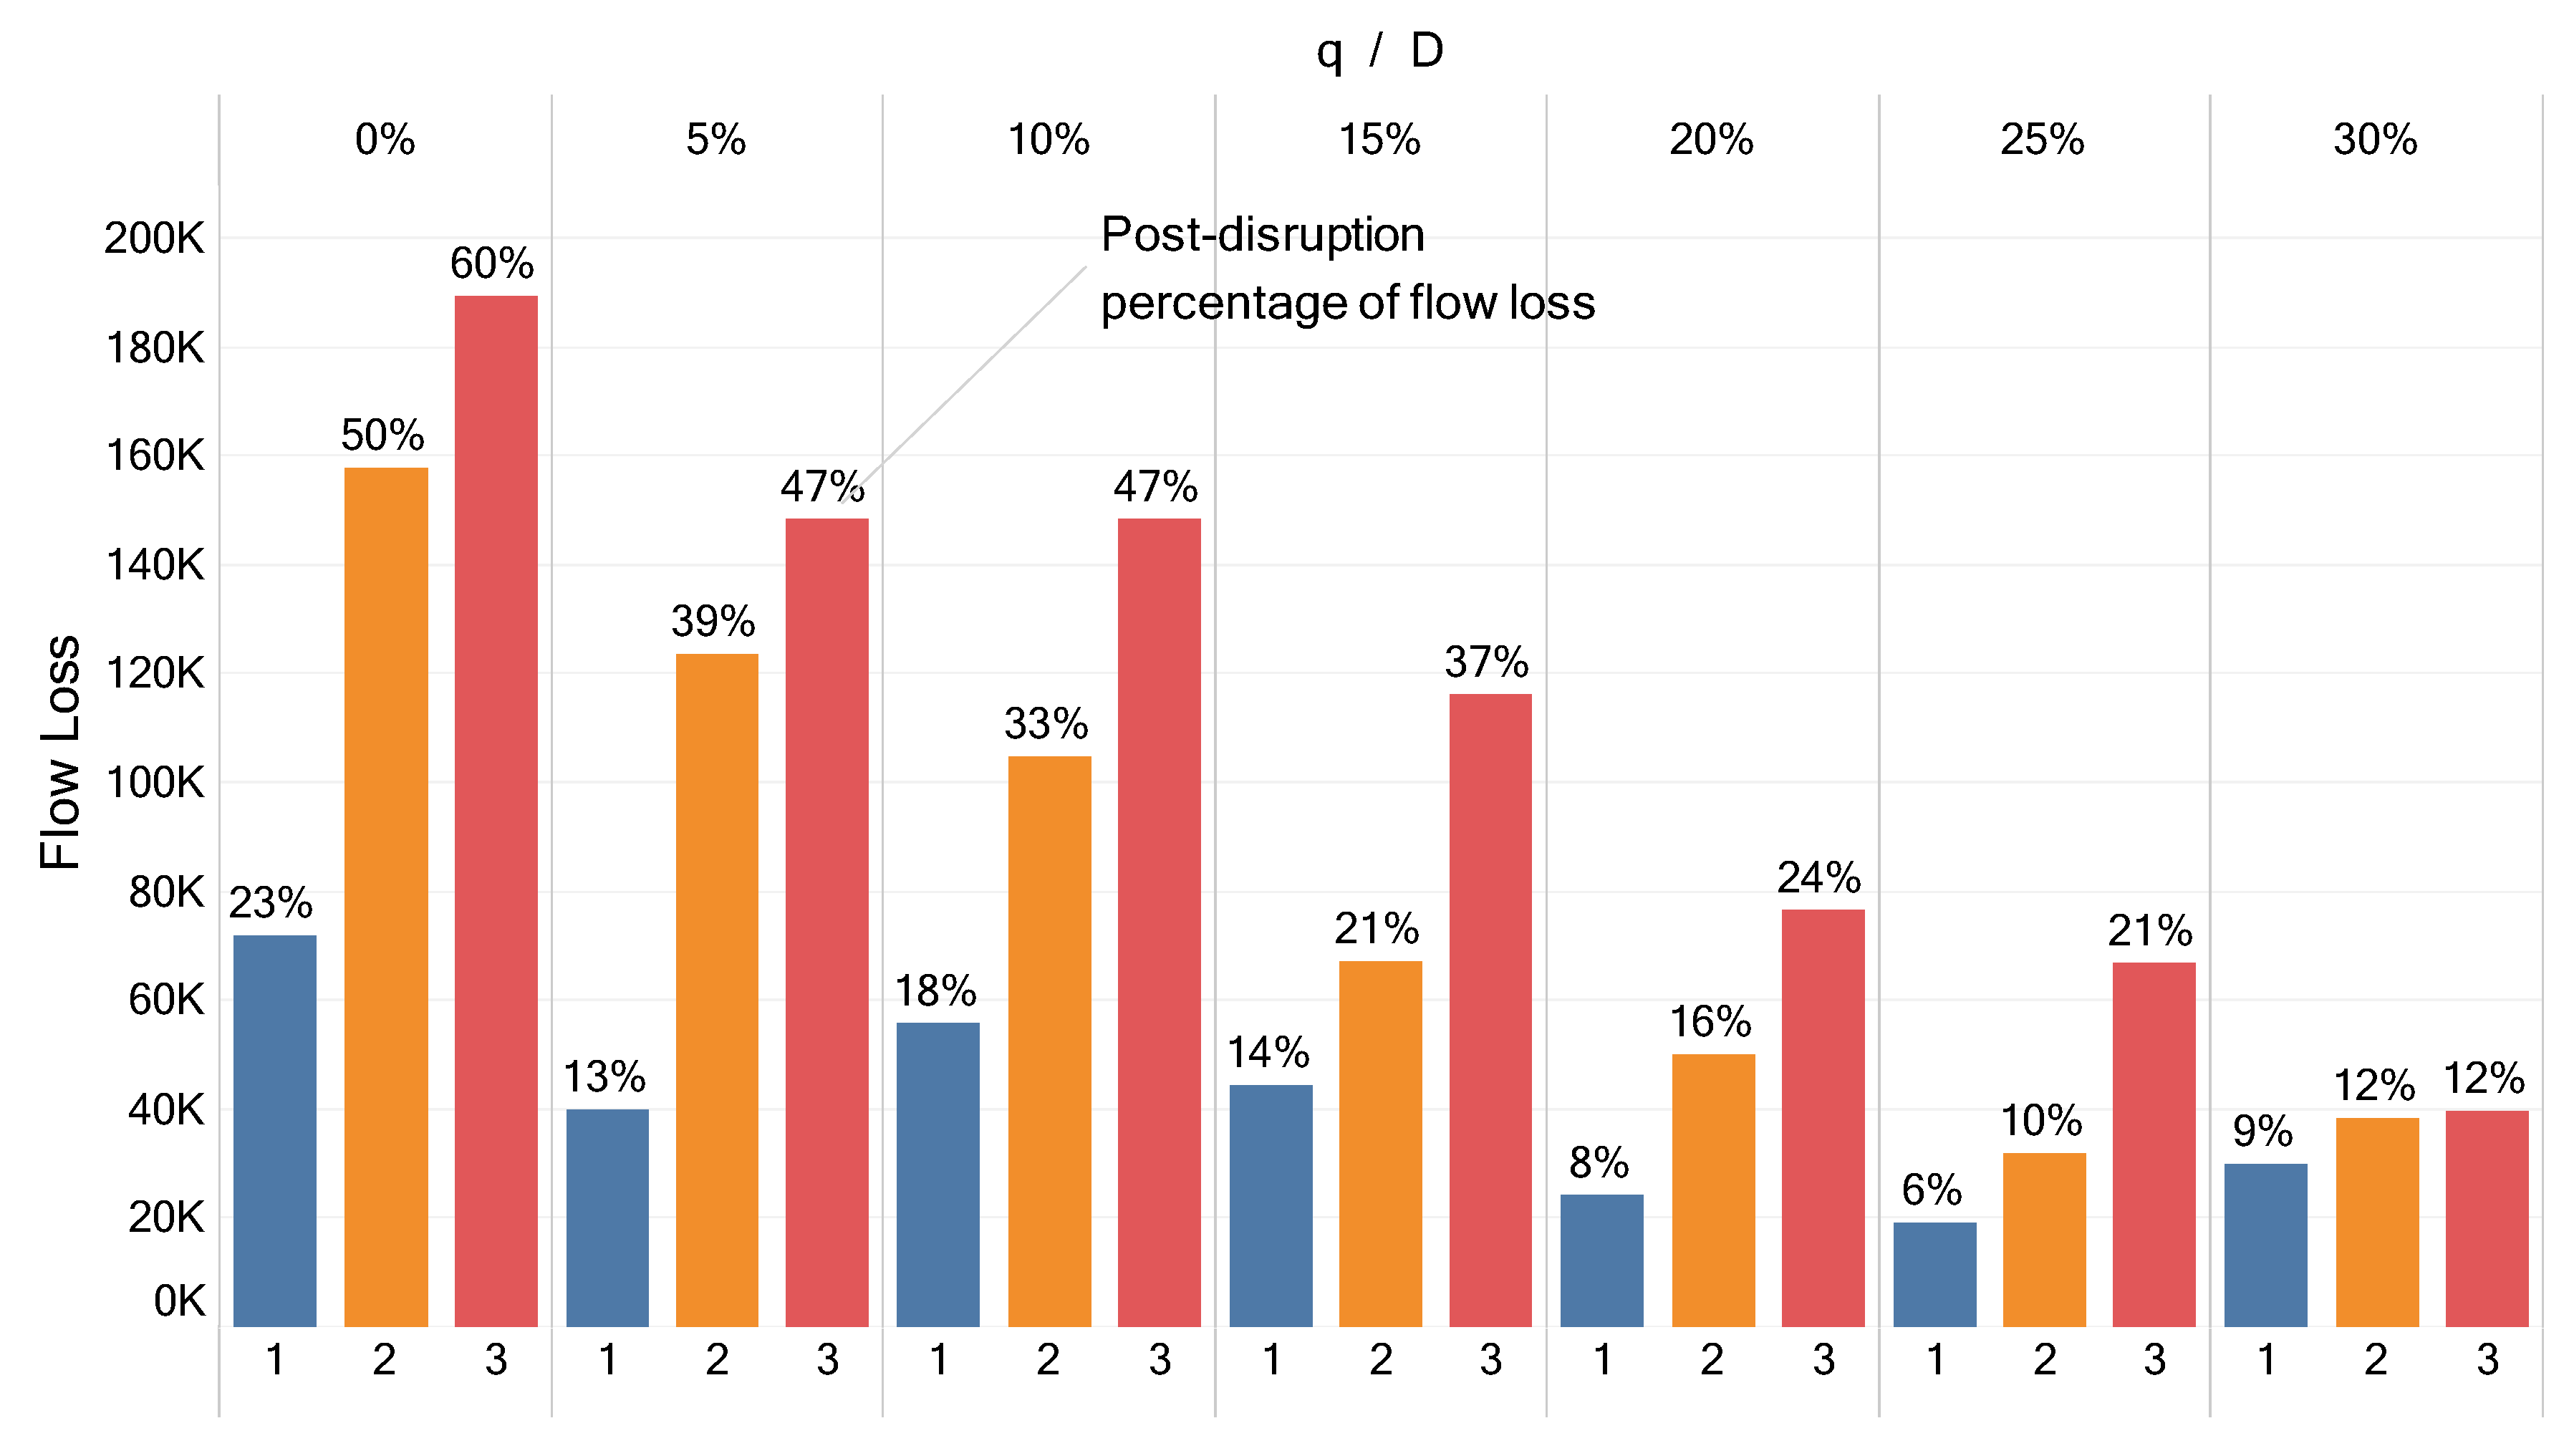
Figure 10.
Optimal interdiction and fortifications when and .
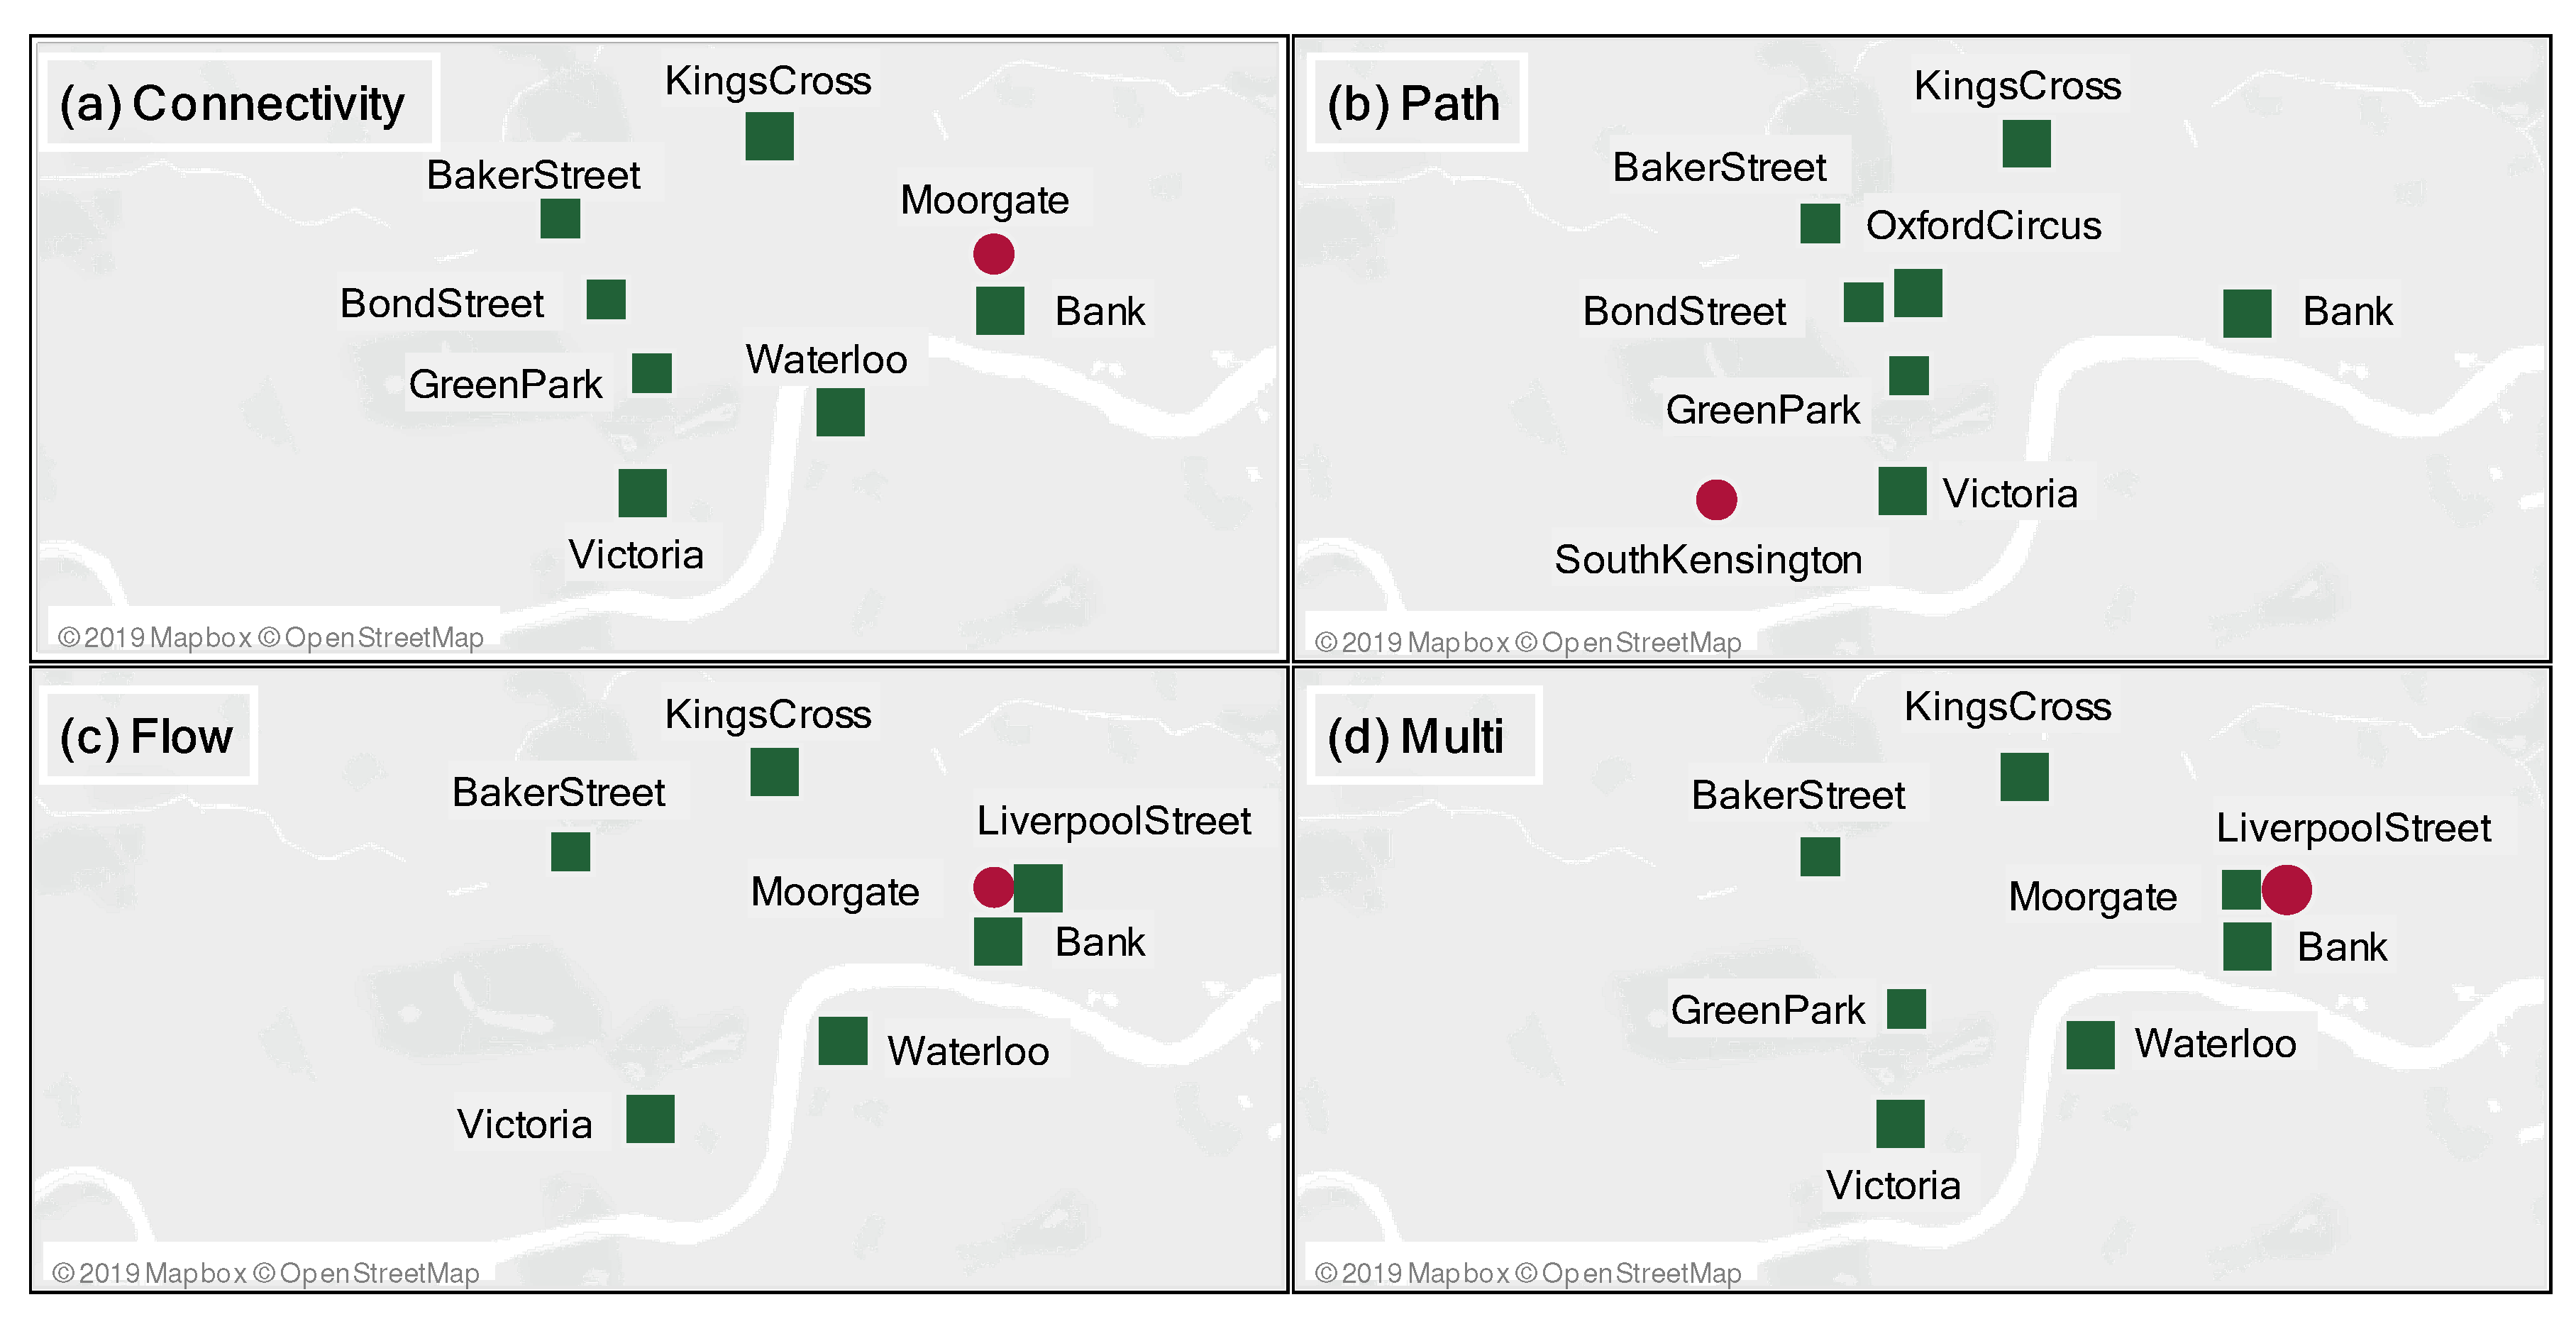
Figure 11.
Optimal interdiction and fortifications when and .

Table 1.
Station metrics-based ranking: Top ten critical stations.
| ND | HC | NV | NB | PF |
| King’s Cross | OxfordCircus | GreenPark | GreenPark | Bank |
| Bank | GreenPark | OxfordCircus | OxfordCircus | King’s Cross |
| BakerStreet | Bank | Bank | LeicesterSquare | Waterloo |
| Waterloo | BakerStreet | BakerStreet | PiccadillyCircus | Victoria |
| OxfordCircus | Embankment | King’s Cross | Embankment | LiverpoolStreet |
| Moorgate | King’s Cross | Embankment | TottenhamCourtRoad | BakerStreet |
| GreenPark | LeicesterSquare | Victoria | CharingCross | Moorgate |
| Embankment | Holborn | BondStreet | King’s Cross | LondonBridge |
| LiverpoolStreet | TottenhamCourtRoad | Waterloo | Westminster | Paddington |
| Aldgate | Waterloo | Holborn | WarrenStreet | Farringdon |
| ST | IM | SV | WA | WI |
| Bank | GreenPark | Bank | Bank | King’s Cross St Pancras |
| King’s Cross | OxfordCircus | King’s Cross | King’s Cross | Bank |
| Waterloo | LeicesterSquare | Waterloo | Waterloo | Waterloo |
| BakerStreet | PiccadillyCircus | Victoria | Victoria | BakerStreet |
| Moorgate | Embankment | BakerStreet | BakerStreet | GreenPark |
| LiverpoolStreet | TottenhamCourtRoad | Moorgate | LiverpoolStreet | OxfordCircus |
| Victoria | CharingCross | GreenPark | Moorgate | Moorgate |
| GreenPark | King’s Cross | OxfordCircus | OxfordCircus | Victoria |
| OxfordCircus | Westminster | LiverpoolStreet | GreenPark | Embankment |
| Paddington | WarrenStreet | LondonBridge | LondonBridge | LiverpoolStreet |
Table 2.
Station metrics-based ranking: Bottom ten critical stations.
| ND | HC | NV | NB | PF |
| GoodgeStreet | Barbican | Southwark | EdgwareRoad(Bak) | LeicesterSquare |
| EdgwareRoad(Bak) | LambethNorth | Angel | Aldgate | Queensway |
| CoventGarden | EdgwareRoad(Cir) | LambethNorth | TowerHill | RussellSquare |
| ChanceryLane | SloaneSquare | Borough | LambethNorth | LambethNorth |
| CannonStreet | Bayswater | TowerHill | Borough | Borough |
| Blackfriars | Borough | EdgwareRoad(Bak) | Elephant-Castle | GoodgeStreet |
| Bayswater | Pimlico | Elephant-Castle | Pimlico | RegentsPark |
| Angel | EarlsCourt | Vauxhall | EarlsCourt | CoventGarden |
| Vauxhall | Vauxhall | EarlsCourt | Vauxhall | Bayswater |
| AldgateEast | AldgateEast | AldgateEast | AldgateEast | EdgwareRoad(Bak) |
| ST | IM | SV | WA | WI |
| Queensway | EdgwareRoad(Bak) | GoodgeStreet | HydeParkCorner | Southwark |
| AldgateEast | Aldgate | Queensway | RussellSquare | TowerHill |
| RussellSquare | TowerHill | AldgateEast | GoodgeStreet | EdgwareRoad(Bak) |
| LambethNorth | LambethNorth | RussellSquare | Queensway | Pimlico |
| Borough | Borough | CoventGarden | LambethNorth | Elephant-Castle |
| GoodgeStreet | Elephant-Castle | RegentsPark | RegentsPark | LambethNorth |
| RegentsPark | Pimlico | LambethNorth | CoventGarden | Borough |
| CoventGarden | EarlsCourt | Borough | Borough | EarlsCourt |
| Bayswater | Vauxhall | Bayswater | Bayswater | Vauxhall |
| EdgwareRoad(Bak) | AldgateEast | EdgwareRoad(Bak) | EdgwareRoad(Bak) | AldgateEast |
Table 3.
Model performance: Objective function cross-comparison.
| Model | Connectivity | Path | Flow | Multi | AVG | Max |
|---|---|---|---|---|---|---|
| 0% | 1% | 41% | 6% | 12% | 41% | |
| 6% | 0% | 52% | 10% | 17% | 52% | |
| 22% | 7% | 0% | 9% | 10% | 22% | |
| 6% | 2% | 20% | 0% | 7% | 20% |
Table 4.
Metrics vs. , and : Relative objective increment.
| Connectivity | Path | Flow | |||||||||||||||
|---|---|---|---|---|---|---|---|---|---|---|---|---|---|---|---|---|---|
| Metric | Metric | Metric | |||||||||||||||
| D | q | IM | ND | ST | WI | HC | IM | NB | NV | SV | WA | WI | PF | ST | SV | WA | WI |
| 1 | 5% | 18% | 18% | 18% | 18% | 1% | 1% | 1% | 1% | 1% | 1% | 1% | 0% | 0% | 0% | 0% | 0% |
| 10% | 30% | 10% | 10% | 10% | 4% | 4% | 4% | 4% | 3% | 3% | 4% | 0% | 12% | 0% | 0% | 12% | |
| 15% | 54% | 31% | 31% | 31% | 7% | 7% | 7% | 2% | 2% | 6% | 7% | 0% | 27% | 13% | 0% | 27% | |
| 20% | 71% | 46% | 20% | 20% | 9% | 9% | 9% | 2% | 3% | 3% | 3% | 0% | 13% | 13% | 13% | 68% | |
| 25% | 55% | 7% | 28% | 28% | 11% | 11% | 11% | 3% | 3% | 5% | 5% | 0% | 23% | 13% | 9% | 23% | |
| 30% | 58% | 9% | 31% | 31% | 12% | 12% | 12% | 4% | 4% | 6% | 6% | 0% | 0% | 34% | 18% | 52% | |
| AVG | 48% | 20% | 23% | 23% | 7% | 7% | 7% | 3% | 3% | 4% | 4% | 0% | 13% | 12% | 7% | 30% | |
| 2 | 5% | 27% | 6% | 6% | 6% | 7% | 7% | 7% | 7% | 3% | 3% | 3% | 4% | 4% | 4% | 4% | 4% |
| 10% | 52% | 27% | 27% | 27% | 1% | 11% | 11% | 1% | 8% | 8% | 8% | 0% | 2% | 0% | 0% | 2% | |
| 15% | 65% | 8% | 19% | 8% | 6% | 18% | 18% | 4% | 10% | 14% | 6% | 24% | 7% | 3% | 24% | 27% | |
| 20% | 46% | 20% | 12% | 12% | 9% | 13% | 13% | 1% | 6% | 6% | 6% | 59% | 0% | 0% | 0% | 28% | |
| 25% | 72% | 26% | 32% | 32% | 12% | 17% | 17% | 4% | 5% | 11% | 11% | 52% | 15% | 15% | 15% | 14% | |
| 30% | 52% | 36% | 42% | 42% | 17% | 17% | 17% | 8% | 10% | 15% | 15% | 26% | 26% | 26% | 26% | 24% | |
| AVG | 52% | 21% | 23% | 21% | 8% | 14% | 14% | 4% | 7% | 9% | 8% | 27% | 9% | 8% | 11% | 17% | |
| 3 | 5% | 16% | 1% | 1% | 1% | 5% | 5% | 5% | 5% | 2% | 2% | 2% | 5% | 5% | 5% | 5% | 5% |
| 10% | 32% | 16% | 16% | 16% | 2% | 11% | 11% | 2% | 8% | 8% | 9% | 14% | 14% | 14% | 14% | 14% | |
| 15% | 48% | 4% | 26% | 4% | 3% | 16% | 16% | 1% | 11% | 13% | 3% | 30% | 5% | 5% | 30% | 5% | |
| 20% | 36% | 11% | 9% | 9% | 7% | 16% | 16% | 5% | 6% | 6% | 6% | 40% | 0% | 0% | 0% | 9% | |
| 25% | 42% | 23% | 23% | 26% | 13% | 16% | 16% | 8% | 10% | 10% | 11% | 61% | 20% | 17% | 17% | 16% | |
| 30% | 46% | 36% | 40% | 43% | 17% | 17% | 17% | 12% | 15% | 15% | 16% | 21% | 21% | 27% | 23% | 27% | |
| AVG | 37% | 15% | 19% | 17% | 8% | 13% | 13% | 5% | 9% | 9% | 8% | 29% | 11% | 11% | 15% | 13% | |
| AVG | 46% | 19% | 22% | 20% | 8% | 11% | 11% | 4% | 6% | 8% | 7% | 19% | 11% | 11% | 11% | 20% | |
Table 5.
WI vs. : Relative objective increment.
| Metric | q | ||||||
|---|---|---|---|---|---|---|---|
| D | 5% | 10% | 15% | 20% | 25% | 30% | |
| WI | 1 | 0% | 8% | 21% | 12% | 8% | 9% |
| 2 | 3% | 15% | 2% | 2% | 11% | 20% | |
| 3 | 0% | 13% | 3% | 2% | 15% | 29% | |
| AVG | 1% | 12% | 8% | 5% | 11% | 19% | |
© 2019 by the authors. Licensee MDPI, Basel, Switzerland. This article is an open access article distributed under the terms and conditions of the Creative Commons Attribution (CC BY) license (http://creativecommons.org/licenses/by/4.0/).
Share and Cite
MDPI and ACS Style
Esposito Amideo, A.; Starita, S.; Scaparra, M.P. Assessing Protection Strategies for Urban Rail Transit Systems: A Case-Study on the Central London Underground. Sustainability 2019, 11, 6322. https://doi.org/10.3390/su11226322
AMA Style
Esposito Amideo A, Starita S, Scaparra MP. Assessing Protection Strategies for Urban Rail Transit Systems: A Case-Study on the Central London Underground. Sustainability. 2019; 11(22):6322. https://doi.org/10.3390/su11226322
Chicago/Turabian StyleEsposito Amideo, Annunziata, Stefano Starita, and Maria Paola Scaparra. 2019. "Assessing Protection Strategies for Urban Rail Transit Systems: A Case-Study on the Central London Underground" Sustainability 11, no. 22: 6322. https://doi.org/10.3390/su11226322
Note that from the first issue of 2016, this journal uses article numbers instead of page numbers. See further details here.