The Economic Value of Irrigation Water in Wadi Zabid, Tihama Plain, Yemen


1
Water Resources Management Group, Wageningen Wageningen University and Research, Droevendaalsesteeg 3a, 6708 PB Wageningen, The Netherlands
2
Water and Environment Center, Sana’a University, Sana’a, Yemen
*
Author to whom correspondence should be addressed.
Sustainability 2019, 11(22), 6476; https://doi.org/10.3390/su11226476
Submission received: 1 October 2019
/
Revised: 11 November 2019
/
Accepted: 13 November 2019
/
Published: 18 November 2019
(This article belongs to the Special Issue Sustainable Agricultural Water Management Using a Socio-Technical Approach)
Abstract
:This study used crop budgets to assess the impact of declining groundwater levels on the economic value of irrigation water in the Wadi Zabid region of Yemen. The study found that returns to land and water were highly sensitive to changes in groundwater depths over time and the free availability of spate water for irrigation. Crops differed in the amounts of irrigation water applied and in their returns to land and water. Banana had the highest irrigation requirement, but also delivered the highest return to land. Banana’s return to water was greater than that of date palm and feed sorghum, but lower than that of mango and food sorghum.
1. Introduction
Agricultural irrigation is the world’s largest consumer of freshwater across all economic sectors, accounting for 90% of freshwater utilized globally [1]. However, irrigation efficiencies are low. In large open-canal irrigation systems, some 70% of irrigation water does not reach the intended crop [2,3]. Nonetheless, to achieve water and food security goals in a sustainable manner, water use has to be better optimized. Moreover, to advance sustainable agriculture, approaches are needed that integrate environmental, economic, and social justice concerns [4]; see also http://asi.ucdavis.edu. One such approach is integrated water resources management (IWRM). IWRM is a process by which water is allocated between different uses and users in a coordinated, balanced manner [5].
According to the World Bank [6], Yemen’s freshwater resources are among the lowest per capita in the world. In addition to limited freshwater supplies, the country has a growing population. Water scarcity has been further exacerbated by government policies aimed at boosting the agricultural sector, such as low-interest loans and cheap, subsidized diesel fuel. In addition, the government’s institutional capacity to implement water laws has remained weak [7]. Due to this combination of factors, Yemeni farmers have become increasingly dependent on groundwater for irrigation.
Since 1970, Yemeni lands irrigated from wells expanded 10-fold, from 40,000 ha to 400,000 ha in 2008, and the number of wells rose from just a few thousand to 50,000 over the same period [3]. In addition, the number of harvesting and diversion structures has increased in upstream areas, which has led to reduced surface flows, dried-up wells, and water being lost from dam reservoirs through evaporation [8]. As a result, groundwater levels have rapidly dropped. In some cities, such as Sana’a, wells more than 1000 m in depth are sometimes needed to access the water required [9].
Agriculture is Yemen’s third largest economic sector, after services and industry (including oil). It contributes some 20% of the country’s gross domestic product (GDP), although the sector’s importance is greater than its sheer size, as agriculture provides food and income for a large segment of Yemenis, especially rural populations [6]. Agriculture is also the country’s largest user of freshwater, accounting for 93% of freshwater consumption on an annual basis. This substantial utilization of water for agriculture raises the question of whether water is being allocated to its highest value uses and if farmers are stimulated to use water efficiently. In other words, is water being utilized in such a way as to accrue the greatest benefits to society?
Conceptually, a better understanding of the economic value of water is important to support policymaking for the development, conservation, and allocation of water across places, uses, users, and time periods [10]. Indeed, water allocation decisions are particularly key in areas where water is scarce and there is growing demand and competition for access to water [11]. More efficient allocation of water to those crops that can generate the greatest value for society, and the economy can help optimize basin management as well [12]. Estimating the value of irrigation water serves not only to guide allocations of water between different crops, it can also guide the allocation of water to different production and/or irrigation techniques within a single crop type. Calculations of the economic value of irrigation water are useful both in regions with and without abundant water resources, as such calculations enable comparisons of farming profitability between regions with scarce water resources or where only rain-fed agriculture is possible versus where irrigation water is abundant. This provides an indication of the economic effect of increased irrigation [13].
The current study sought to estimate the economic value of water for irrigation of a set of dominant crops. The aim of the study is to support water resource management and improve water allocation efficiency [14,15]. A measure of the value of water in alternative uses can substantiate policy decisions related to the development, allocation, and use of water resources [10]. In a market system, water’s value is represented by its price, with the price steering allocations to those uses that offer the greatest economic returns [10].
This paper argues that changing groundwater levels and the freely available spate water for irrigation in the Wadi Zabid region of Yemen are propelling changes in the production value of water and hence changes in cropping patterns. Specifically, the sensitivity of the value of water to the increased depth of groundwater pumping is investigated in the midstream, downstream, and coastal areas of the study region. To that end, we posed three research questions: (1) What is the cost of pumping one unit of groundwater from different depths? (2) What is the economic value of water in terms of the production of major agricultural crops? (3) What impacts have declining groundwater levels had on the value of water for particular crops and hence on cropping patterns?
This is very novel research, as it clarifies the impact of spate water availability and groundwater extraction from different (declining aquifer) depths on economic returns to land and water for different crops, both now and in the future. Part of this study’s novelty and importance lies in the location of the study area, as Wadi Zabid, Tihama Plain, Yemen, is not a data-rich environment. Combining the various elements to demonstrate that returns to land and water are highly sensitive to changes in groundwater depths over time, and the availability of spate water for irrigation is an important advancement of current work in this field.
Study Region
The current study focused on the Wadi Zabid region of Yemen. The wadi is one of the catchments of the Tihama coastal plain. The plain is considered one of Yemen’s most fertile areas. Agriculture here provides for a large part of Yemen’s food needs from cereals, vegetables, and fruits. The area is also characterized by good groundwater aquifers, which are recharged during the rainy season. The wadi originates in the western highlands of Ibb and Dhamar governorates, passes through the highlands of the Jabal Ras directorate, and continues through Al-Jarrahi, Zabid, and Al-Tuhita directorates, discharging into the Red Sea in heavy rainfall years. This study covered the plains area of the wadi, which is divided into a midstream, downstream, and coastal area (about 46 km by 20 km altogether). The center of the study region has the coordinates 317,122UTM-E and 1,564,732UTM-N (Figure 1).
In the study region, agricultural land use increased from 10,509 ha in 1972 to 27,786 ha, in 2014, according to remote sensing image analysis [16]. The population was 312,408 at the time of the latest census, which was 2004 [17]. Using a yearly population growth rate of 2% to 3%, the population can be estimated as 430,514 in 2016 (see https://www.worldometers.info).
Residents of the region depend mainly on agriculture for their livelihoods, in addition to raising livestock and fishing. Rainfall on the Tihama plain is very scarce, ranging from 100 mm per year along the coast to about 350 mm midstream in the wadi (near the foothills). Groundwater is the primary source of irrigation water, although spate flows are available in some parts of the wadi. Rules established under Sheikh Al-Jabarti more than 600 years ago gave the upper riparian area first priority for spate water use. Spate waters are divided among three groups in the midstream area of the wadi, with no water rights reserved for the downstream and coastal areas.
Wadi Zabid is known for its variety of crops, including vegetables (e.g., onions, tomatoes, okra, legumes, zucchini, hot pepper, and mulukhiyah), fruits (e.g., banana, mango, date palm, watermelon, cantaloupe, guava, papaya, and citrus), and cereals (sorghum, millet, maize, and sesame), in addition to fodder crops and crops such as cotton, Jasminum sambac, and henna.
2. Materials and Methods
2.1. Methods
The residual value method was applied to estimate the economic value of water, based on crop budgets at the farm gate. This method, a deductive approach, is the most commonly used technique for water valuation [20]. Young and Loomis [21] presented extensive information on methods for calculating the economic value of water.
Nevertheless, the current study derived the value of water based on crop budgets (as in the Appendix A), which were represented by the net profit from crop production divided by the quantity of irrigation water applied. The net profit is the total revenue earned from a crop minus the total (variable) costs incurred for its production, including the cost of irrigation [22,23].
The economic value of groundwater in irrigated agriculture was estimated separately for the midstream, downstream, and coastal areas of the study region. This enabled us to understand and compare the impact of declining groundwater levels on the profitability of crops in the various areas, due to the increased cost of pumping from greater depths.
2.2. Data Collection
A field survey was carried out in mid-2016 by two teams of four multidisciplinary researchers. The first team conducted questionnaire-guided interviews and discussions with farmers. The second team carried out an investigation of well water levels (measured by electronic gauge) and well yields (estimated by a hydrogeologist in the region). Changes in well depths and spate water availability were observed across the wadi. Seventy-nine farms in the midstream, downstream, and coastal areas were randomly selected to conduct the farmer interviews (Figure 1). We expected to find differences between farms in the quantities of agricultural inputs used and outputs produced. So, the plan for the field survey was to examine in detail changes in crop budgets on each farm—that is, the sum total of the inputs used subtracted from the earnings from the crops produced on that single farm. These results would enable us to estimate the sensitivity of returns to land and water to changes in the groundwater pumping depth.
Unfortunately, during the survey, we faced various obstacles in collecting the required data. The hard daily life circumstances experienced by the farmers at the time of the field survey in mid-2016 affected their responses during the interviews. Indeed, farmers were confronted with numerous hardships associated with the unstable political situation in the country at the time. Moreover, post-harvest losses in the study area are high; this was especially due to the high temperatures, which can reach 40 °C, and the farmers’ lack of cold storage facilities.
Illiteracy was another obstacle. Half of our farmer respondents were illiterate (Figure 2a). Therefore, many were not accustomed to precisely calculating inputs and outputs. Furthermore, the majority of the region’s farmers were smallholders. Some 56% of farms occupied 3.6 ha or less (Figure 2b). This raised another hurdle, as some of these smallholders were discreet about sharing privileged information about the specifics of their farming operation, considering this information a trade secret. Although farmers were reluctant to talk, we were able to convince them to talk by explaining that the results can later be used to improve agricultural practices in the region. However, not all farmers gave complete answers to all the questions. They elaborated more in regard to the costs of production and costs of pumping, but gave incomplete answers regarding production and revenues.
Some of these obstacles were alluded to previously by Hellegers and Perry [24] (p. 33):
It is important to note that such returns are difficult to compute precisely in the absence of a major modelling exercise. First, the precise technical coefficients (yield/ha, water use, etc.) will vary across farms and by year. Second, some inputs are difficult to capture accurately because they are not monetized (like family labor), or may be subject to distortions due to taxes or subsidies.
To overcome the limitations of the collected data, crops were chosen in the study region for which complete data were available from representative farms, omitting farms for which exaggerated values were collected (very high and very low figures). Out of the 79 farms from which data were collected, five representative farms were selected for calculation of the crop’s budgets and the return to land and water. Data from 50 farms of the 79 farms were used to calculate the cost of diesel to pump one cubic meter of groundwater from various depths. Nonetheless, many of the farmers interviewed were unable to specify crop production values in terms of quantity (kg) and price (US$ per kg), as they had sold the product in a different way, such as per tree, basket, carton, or bundle. Information related to weight (kg) could be gathered from a few farms (six farms out of 79 farms) and from two key informants. Thus, we calculated estimates based on the data that were provided. For example, banana production was estimated by multiplying the number of cartons produced per hectare according to the farmers by the average weight per carton. Other crop production figures were similarly obtained.
2.3. The Cost of Pumping One Unit of Groundwater
We calculated the cost of diesel to pump one cubic meter of groundwater from various depths based on data collected in mid-2016. From the results of the questionnaires and discussions with farmers, from 50 of the 79 farms, we first calculated the cost of groundwater pumping per hour (US$/hr) from a certain depth at each farm. This was done using the farmers’ responses in regarding (i) pumping depths (the number of pipes installed in the well and the length of each pipe), (ii) the number of operating hours obtained using 20 liters of diesel (this is one drum, which represents a unit of volume for diesel in Yemen), and (iii) the price of per drum of diesel. After that, the cost of pumping one cubic meter of groundwater (US$/m3) from a certain depth on each farm was calculated based on the cost of groundwater pumping per hour (US$/hr) at that depth and well yield (m3/hr).
2.4. To Calculate the Returns to Land and Water
As the study region spans a relatively small, 46 km by 20 km area, crop budgets were assumed to be similar; that is, farm-to-farm differences in inputs for and earnings from particular crops were taken to be minimal. A more significant difference was the depths from which groundwater had to be pumped for irrigation and the availability of spate water, according to farms’ location in the midstream, downstream, or coastal area. The average pumping depths for midstream, downstream, and coastal areas were obtained from the contour map of pumping depths. The map was drawn using the kriging interpolation method based on well information from the field visit, groundwater-level measurements, and the drilling depth of 248 wells, alongside well information obtained from farmers. Spate water availability was also known, which was determined by a field visit and descriptions of water distribution rules and spate water rights from the literature, as found in Tipton and Kalmbach [25] and IIP [26]. Spate water availability was determined as follows: (i) traditional rules dictate that only the three groups in the midstream (around the constructed weirs) had spate water rights, so the farmers downstream and in the coastal area had no spate water rights; (ii) the number of days that spate water was available annually (days/yr) was known; (iii) discussions with farmers indicated that they did not use groundwater for irrigation during the periods in which spate water was available.
2.5. The Effect of Increased Groundwater Pumping Depth on the Economic Value of Water
An Excel spreadsheet was used to build an economic model for investigating the impact of changes in groundwater pumping depths (mbss) on net returns to land (US $/ha) and the value of water (US $/m3). As noted, to calculate the value of water, we subtracted the cost of all production inputs (including the cost of irrigation) from the total income from production and divided the result by the total volume of water applied. This represents the net profit gained by farmers from each unit of water applied.
3. Results
3.1. Pumping Costs
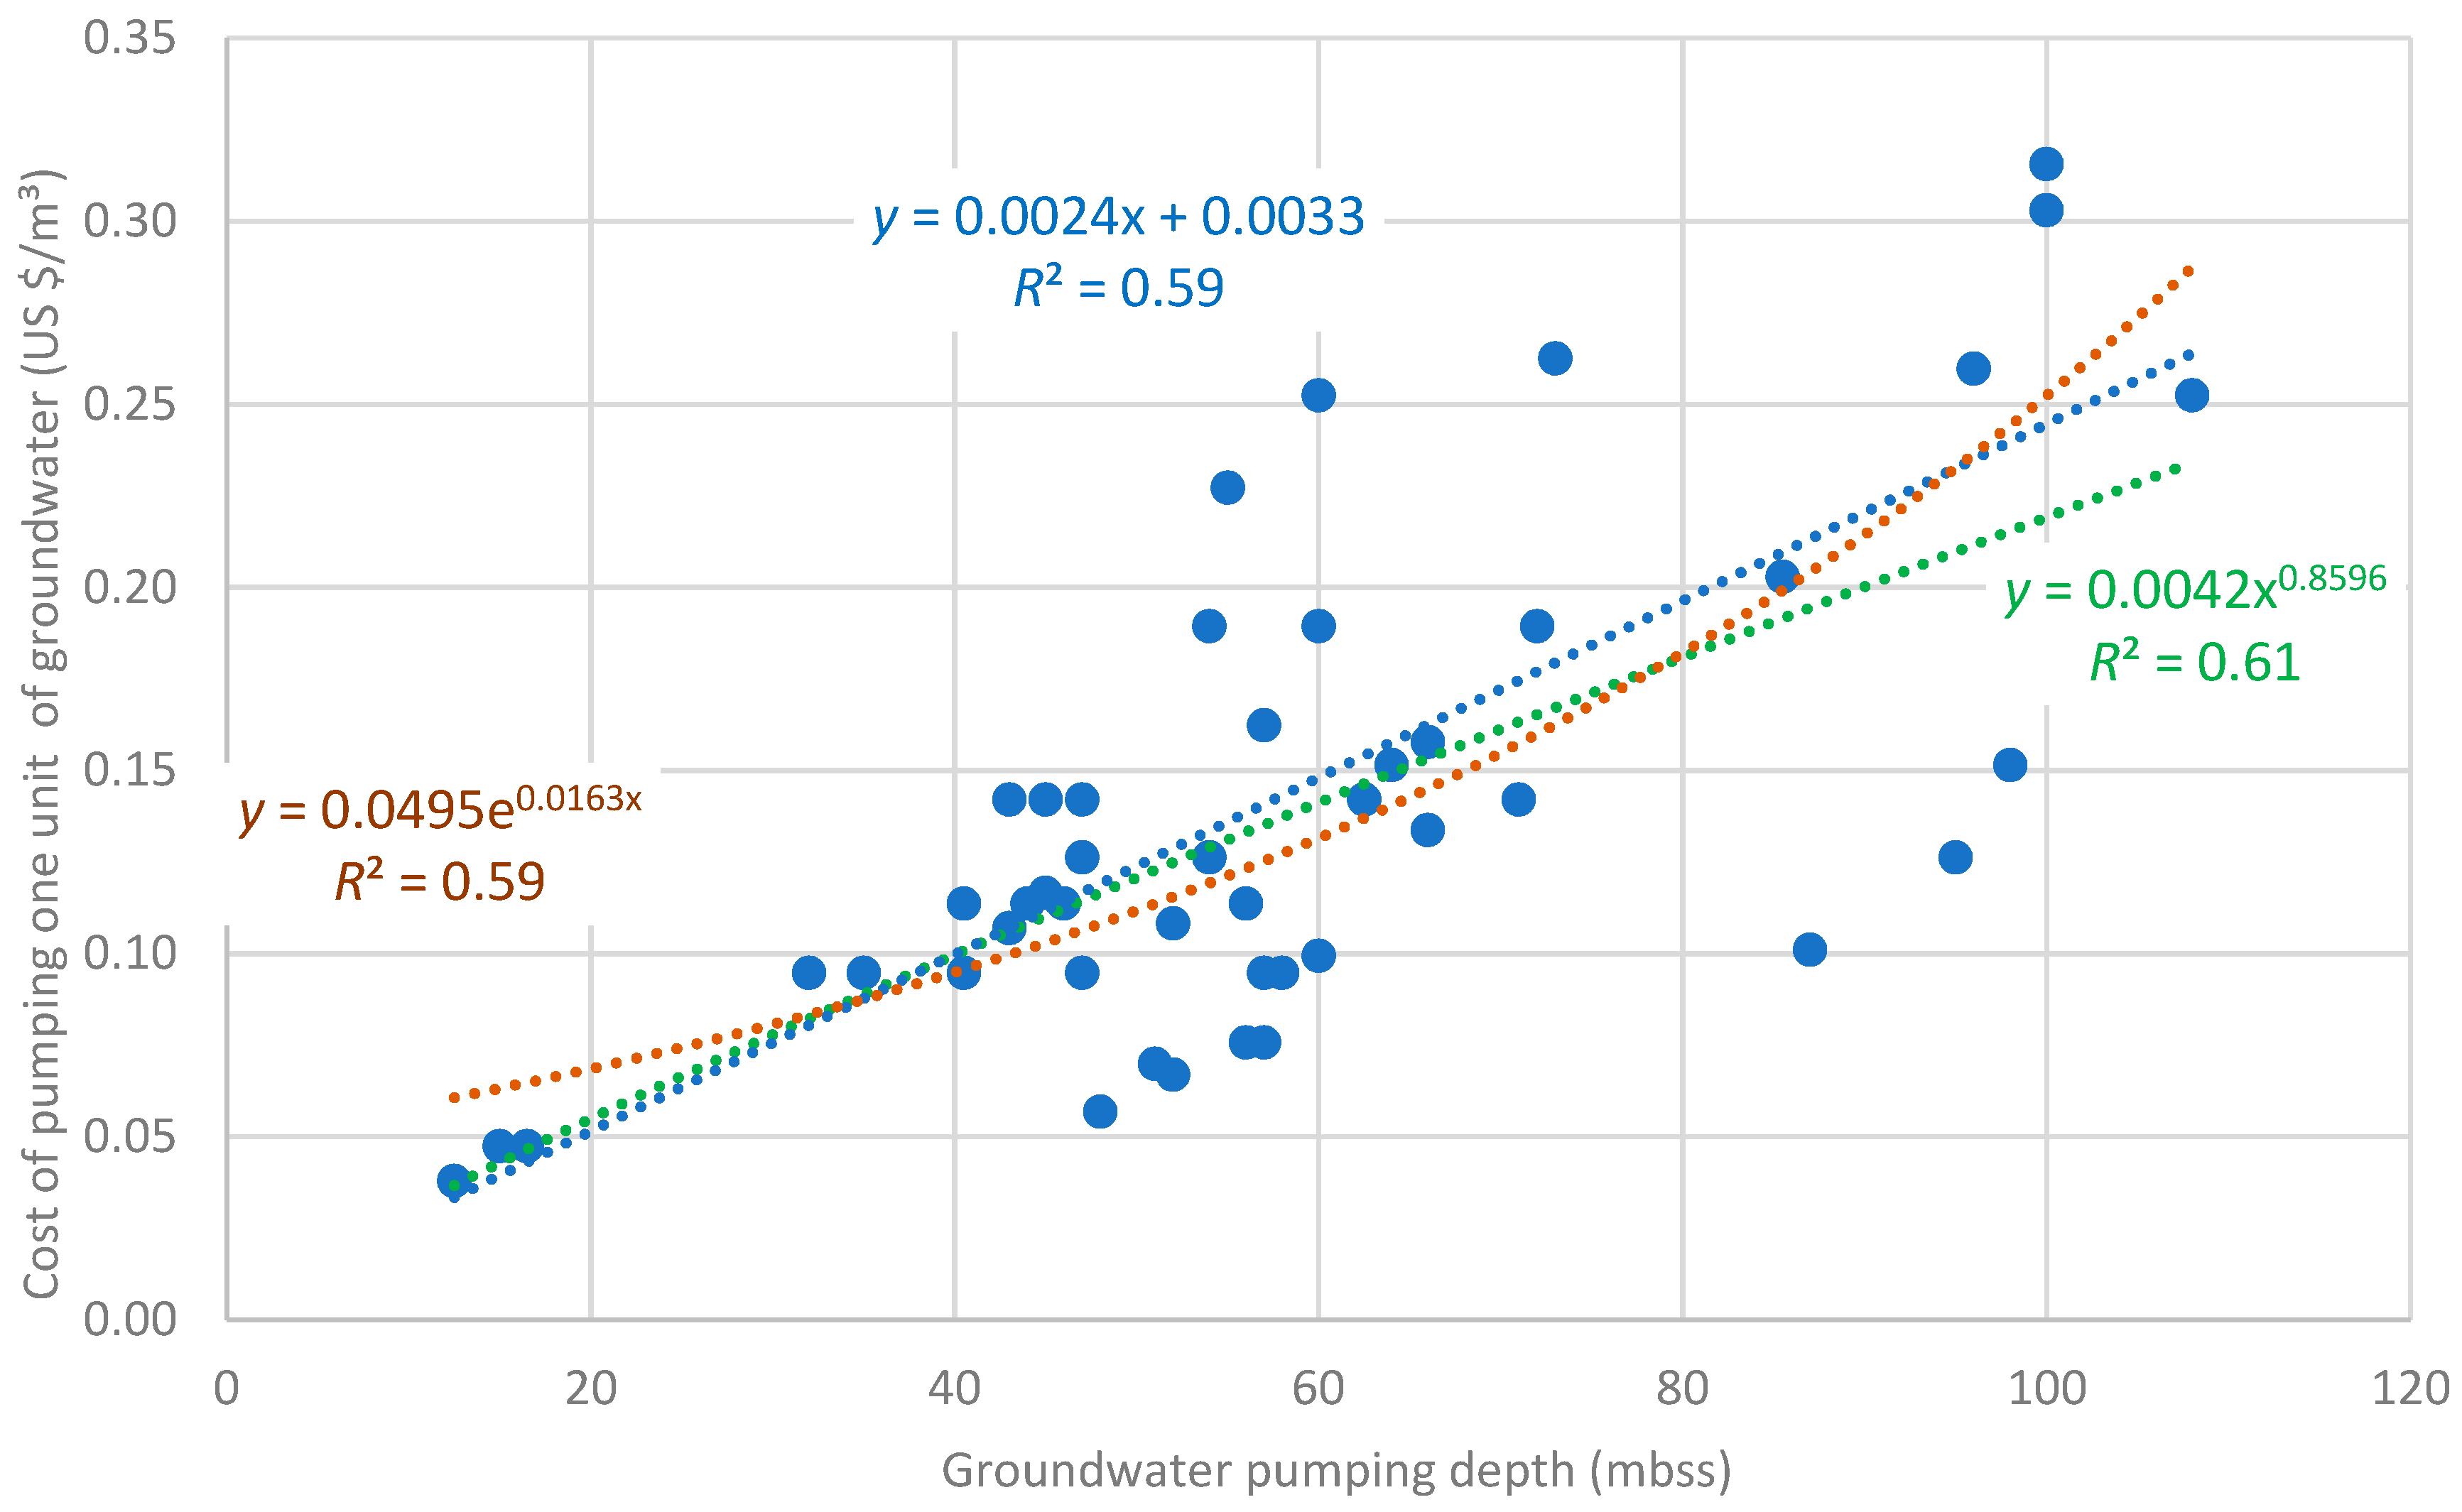
Figure 3 depicts the relation between the dependent variable (diesel consumption) and the independent variable (pumping depth) using different functions: (1) a linear function, (2) a power function, and (3) an exponential function. We see that the cost of pumping increases rapidly with increasing depth. This is best expressed using the exponential function as follows:
where Y is the cost of pumping one unit of groundwater in US $/m3 and X is the groundwater pumping depth (mbss).
Y = 0.0495e0.0163X R2 = 0.5856
e = 2.71828183
e = 2.71828183
The R squared of 0.59 is within the 0–1 range (1 being a perfect explanation). Capital costs (or fixed costs), such as well drilling and the purchase of a pump and engine, are not included. In addition, maintenance materials costs are not included. These additional costs are assumed to be low and without major fluctuations across the farms, as they are located within relatively small areas of the study region.
Table 1 presents the differences found in (i) depth of groundwater pumping levels and (ii) spate water availability across the study region. The difference in the groundwater (pumping) levels across the study region resulted in differences in the cost of pumping one unit of groundwater. These differences were especially marked in the downstream area compared to the midstream and coastal areas. Pumping costs downstream were double those in the midstream and coastal areas, namely, US $0.23/m3 versus $0.12/m3 and $0.10/m3, respectively. A future scenario in which groundwater depths increase further would lead to a proportional increase in the cost of pumping one unit of groundwater, as shown in Figure 3 (exponential function), Figure 4A–C, and Figure 5A–C.
3.2. Returns to Land and Water
Table 1 shows the pumping depths for wells in the study region. Average spate water availability is known from the field survey and literature describing local water distribution rules and spate water rights [25,26]. On average, freely available spate water makes up 40% of the total water applied for irrigation in the midstream area of the wadi, while the downstream and coastal areas had no spate water rights.
The crop budget analyses indicate that irrigation water was the most expensive crop input, which was mainly due to the high cost of the diesel fuel needed for groundwater pumping (Table 2). This was true for all crops and all areas studied, except for sorghum in the midstream area of the wadi and in the coastal area, where the cost of irrigation ranked second after the cost of land preparation and labor. Irrigation was the most costly input in the downstream area of the wadi, as the depth of groundwater pumping was greatest here, averaging 95 mbss.
In the downstream area, annual irrigation pumping costs varied from US $745/ha for date palm to US $9501/ha for banana. The lowest irrigation pumping costs were found in the midstream area, varying annually between US $233/ha for date palm to US $2970/ha for banana. The volumes of water applied annually for irrigation varied between 3200 m3/ha for sorghum and 40,800 m3/ha for banana.
Table 3 compares these quantities to the amounts of irrigation water applied in other regions and worldwide. These quantities span a considerable range, which is linked to the different agriculture practices and irrigation methods used. We see that the amounts of irrigation water applied for banana cultivation in Wadi Zabid (Yemen) and Wad Madani (Sudan) are high compared to the other regions. A reason could be that both use basin irrigation, which is supplemented by freely available spate water (in Wadi Zabid) and shallow groundwater (near the Nile River in Wad Madani).
For all crops, the highest returns to land and water were registered in the midstream area of the wadi followed by the coastal area (Table 2, Figure 4A–C and Figure 5A–C). In contrast, the lowest returns were found in the downstream area of the wadi.
Over the entire study region, the crops providing the highest returns to water were as follows: sorghum (food), mango, banana, sorghum (feed), and date palm. For these same crops, returns to water in the midstream area were, respectively, US $0.31/m3, $0.25/m3, $0.19/m3, $0.17/m3, and $0.13/m3. In the coastal area, returns to water were slightly lower ($0.02/m3) than in the midstream area, but the lowest returns to water were found in the downstream area. For the same crops as mentioned above, the returns to water in the downstream area were US $0.15/m3, $0.09/m3, $0.03/m3, $0.01/m3 and $–0.03/m3, respectively (Table 2 and Figure 4A–C). Date palm was unprofitable, representing a loss to the farmers in downstream area of the wadi.
Crop rankings according to their returns to land were different. Ordered from the highest to lowest returns, the crops ranked as follows: banana, mango, sorghum (food), date palm, and sorghum (feed) across most of the study region. The only exception was in the downstream area, where sorghum (feed) ranked higher than date palm. In the midstream area, the annual returns to land were US $7826/ha, $2524/ha, $1394/ha, $982/ha, and $559/ha, respectively, for the above-mentioned crops. In the coastal area, too, returns to land were relatively high, although a little less (by approximately 7% to 17%) than in the midstream area. Downstream, returns to land were lowest, being some 52% to 125% less than returns in the midstream area. As noted, farmers here faced losses in data palm cultivation (see Table 2 and Figure 5A–C). Our discussions with farmers indicated that the dominant crops in the midstream area were banana, mango, and sorghum, while in the downstream area they were mango, sorghum, and to a lesser extent date palm. In the coastal area, the dominant crops were date palm and sorghum. Groundwater in the coastal area was not particularly deep. However, banana and mango were rarely cultivated here due to the high salinity of some wells. Sorghum, which is a drought-resistant crop, was cultivated across the entire study region, as were vegetables. However, vegetable cultivation had decreased in recent years due to marketing difficulties resulting from the unstable political situation in the country. In addition, vegetables are particularly vulnerable to post-harvest losses (spoilage) when exposed to Tihama’s high temperatures. As noted, cold storage facilities are largely absent, which is in part due to fuel shortages and electricity blackouts.
3.3. Sensitivity of Economic Returns to Land and Water to Falling Groundwater Levels
Increasing water scarcity is clearly apparent in the study region, and is observable in the continually falling groundwater level over the previous decades. Table 4 presents the water levels found in previous well inventories and the forecast for 2066. In the midstream, downstream, and coastal areas, groundwater level depths were, respectively, 20 mbss, 8 mbss, and 0.5 mbss in 1972. Recently, in mid-2016, average water levels were found to be at depths of 50 mbss, 90 mbss, and 35 mbss, respectively. Assuming continuation of the current trend over the coming five decades (to 2066), a serious groundwater level drawdown is to be expected. In Wadi Zabid, we foresee on average 50-mbss drop of the groundwater table over the next 50 years below the current levels.
The expected drop in groundwater levels will be reflected in higher pumping costs to use groundwater for irrigation. It will also impact returns to land and water, as shown in Table 5, Figure 4A–C, and Figure 5A–C. These effects will be felt throughout the region of study.
Midstream in the wadi. Returns to land and water show the lowest sensitivity to a drop in the groundwater level in the midstream area of the wadi compared to the other two areas. For the greatest groundwater pumping depth, returns to the dominant crops will be 30% to 72% less than the 2016 levels (Table 5).
Downstream in the wadi. The highest sensitivity was found in the downstream area, where a further drop in the groundwater level (assumed at 50 mbss in 50 years) would result in a 196% to 2013% reduction in returns to land and water, compared to returns in 2016. Thus, all crops would become economically unprofitable—that is, generating losses for farmers. Initially, sorghum (food) would continue to return some profit, until a 30-m drop in groundwater pumping depth is reached. Mango would also continue to be profitable, until a 10-m drop in the groundwater pumping depth is reached.
Coastal area. reductions in the economic returns to land and water here due to a further drop in the groundwater pumping depth were calculated as between 42% and 113% for the dominant crop. The date palm is very common in the coastal area due to its tolerance to salinity from other dominant crop.
The crops most vulnerable to continually falling groundwater levels—that is, those crops showing the greatest declines in returns to water across the entire study region—were ranked as follows: date palm, sorghum (feed), banana, mango, and sorghum (food) (Figure 4 and Table 5). Crops showing the greatest declines in returns to land (due to the groundwater level dropping by more than 30 m under current depths) in the midstream area of the wadi were sorghum (feed), date palm, sorghum (food), mango, and banana. For the coastal area, the ranking was similar, but with date palm coming first. In the downstream area, the crops ranked as follows from highest to lowest declines in returns to land: banana, date palm, mango, sorghum (feed), and sorghum (food) (Figure 5A–C and Table 5).
4. Discussion
The cost of pumping one unit of groundwater differed across the study region due to differences in the groundwater level and thus in groundwater pumping depths. With increasing groundwater level depths, pumping costs will dramatically rise. Indeed, the cost of pumping represents a primary production cost for most crops in the study region. Our analysis found this cost to be of foremost significance in diminishing returns to land and water in the context of a falling groundwater table. The cost of pumping certainly plays a large role in determining cropping patterns in Wadi Zabid. Any incentive that reduces the cost of pumping—for example, an energy subsidy (e.g., for diesel fuel or solar panels)—would dramatically increase returns to land and water. Furthermore, it could be expected to initiate a change in cropping patterns toward crops with higher water requirements. Hellegers, Perry, and Al-Aulaqi [33] observed that direct incentives to farmers in the form of high diesel subsidies and support for more efficient irrigation techniques encourage groundwater abstraction rather than reducing irrigation demand. In contrast, raising the cost of inputs, such as energy, is an effective way to reduce demand for irrigation [3,34]. This is confirmed by the results of the current study, as the highest returns to land and water for the major crops were found in the midstream wadi area. The reason why is that farmers in the midstream area did not rely exclusively on groundwater for irrigation, but also had access to freely available spate water, unlike farmers in the downstream and coastal areas.
Midstream farmers would continue to make a profit from cultivating all crops, despite the expected increase in groundwater level depths. In contrast, downstream farmers were found to have the lowest economic returns to land and water, due to their total dependence on groundwater for irrigation. Moreover, in the downstream area, groundwater had to be pumped up from much greater depths: twice the depths in the midstream and coastal areas. Furthermore, no spate water reaches the downstream area.
In the downstream area, returns to land and water showed the highest sensitivity to and greatest impact of further drops in groundwater levels. In the coastal area, most crops would still continue to return some profit in the scenario of further drops in the groundwater level, except for date palm, which would become unprofitable if the current groundwater level dropped by more than 40 m. However, a further drop in groundwater levels in the coastal area would also lead to seawater intrusion. This would likely degrade water quality and risks rendering entire groundwater aquifers unfit for agriculture. Field surveys show that seawater upconing has already occurred on one date palm farm in Al-Fayza village, leading to the dying out of all the trees on the affected farm [35,36].
Although sorghum was found to deliver the highest return to water, farmers in the midstream area of the wadi preferred banana, which also delivered a high return to water, although less than sorghum, and also delivered the highest return to land. While banana had the highest return to land, it also required application of the largest amounts of irrigation water of all the crops examined. Discussing the larger issue of the value of cash crops versus food security crops for developing countries, Achterbosch et al. [37] indicated that as long as a balance is maintained, cash crops do have an important role in ensuring food security at both the micro and macro levels. That is because cash crops provide the income that households need to purchase other essentials required for their well-being and food security. However, these authors did note that the economic and environmental risks associated with cash crops should be guarded against and mitigated.
In regard to government incentives, Young and Loomis [21] noted that some developing country governments have sought to keep the prices of agriculture products low in order to ensure low food prices for consumers. However, intentionally keeping prices of agriculture products low could disrupt the working of the market, diminishing the economic value of water. In fact, the current study found the opposite. Government incentives, particularly subsides on fuel, contributed to lower production costs (represented by the cost of the irrigation applied) below their costs at the global level (in a free market context). Thus, farmers earned more profit (i.e., returns to land and water were greater), and therefore, the economic value of water was higher in such cases than it would have been without such incentives. In fact, these policies encourage the expansion of agricultural lands and irrigation demand, rather than their reduction. In developed countries, production inputs such as fuel and labor are more expensive, and the prices of outputs are higher as a result.
The pumping depths were calculated based on the field measurements and information on the wells collected during the field survey and farmer interviews. The well yield data were verified by comparing them with figures from the nearest wells for which data were available from other studies in the region, the data of the well inventories of NWRA [19] and DHV [32]. The average was found to be within the same range, between 6 l/s and 11 l/s. The availability of the spate water for the entire midstream region was assumed in this study to be equivalent to that of the group with the highest water rights, although other groups had less water rights. Moreover, even within the different water rights groups, there were differences between farms as stipulated by traditional spate water distribution rules. In fact, there is no recent, accurate map of spate water distribution in the midstream region. Thus, there is also a diminution in the returns to land and water for the farms in the midstream. The extent of that diminishment depends on the percentage of irrigation provided by spate water on the various farms. Among midstream farms with less spate water rights, the returns to land and water would be approximately equal to the returns of the farms in the coastal areas. This is because there were no substantial differences between the two areas in depths of groundwater pumping.
5. Conclusions
The current study found that due to differences in groundwater depths, the cost of pumping one unit of groundwater was different in the midstream, downstream, and coastal areas of the study region of Wadi Zabid. Groundwater levels were found to be especially deep in the downstream area of the wadi compared to the midstream and coastal areas. Pumping costs in the downstream area were double those in the midstream and coastal areas. The continuing fall of the groundwater level here will result in a rapidly increasing cost of pumping one unit of groundwater. The highest returns to land and water were found in the midstream area of the wadi, followed by the coastal area. Returns were lowest in the downstream area because of the greater groundwater pumping depths and lack of freely available spate water for supplementary irrigation.
Throughout the study region, crops ranked as follows, from highest to lowest returns to water: sorghum (food), mango, banana, sorghum (feed), and date palm. Regarding returns to land, the ranking was banana, mango, sorghum (food), date palm, and sorghum (feed), except in the downstream area, where sorghum (feed) came before date palm. The dominant crops in the midstream area were banana, mango, and sorghum. In the downstream area, they were mango, sorghum, and to a lesser extent, date palm. In the coastal area, the dominant crops were date palm and sorghum. Banana and mango were rarely cultivated in the coastal area because of the high salinity of some wells. Sorghum, which is a drought-resistant crop that requires the lowest quantities of irrigation water, was cultivated over the entire region.
A future scenario that assumes a continuing drop in groundwater levels would have significant impact on economic returns to land and water, particularly in the downstream area of the wadi. Here, all the cultivated crops would become economically unprofitable for farmers. A falling groundwater table would have the least effect on returns to land and water in the midstream area because of the more moderate pumping depths here, as well as the free availability of spate water. In the coastal area, although the immediate impact on economic returns would also be low, further falling groundwater levels would threaten aquifer quality due to the risk of seawater intrusion.
Regarding water reallocation, this study found sorghum (food) to provide the highest return to water but only a moderate return to land. Nonetheless, this crop has social benefit (food security), and requires less irrigation water application. Sorghum varieties for both food and feed are known to be drought-resistant crops [38,39,40]. To encourage the reallocation of water to crops with low water requirements, such as sorghum, government incentives would need to be oriented toward supporting the marketing of drought-resistant crops to assure profitable sale prices for farmers within the wadi. In addition, support for other less thirsty crops, such as peanuts and sesame, which can be cultivated with sorghum in mixed cropping, intercropping, and crop rotation systems, could enhance returns to land. Banana provides a moderate return to water and the highest return to land, but it also has a high annual requirement for irrigation water. Therefore, a groundwater balance study is recommended to further investigate the effect of banana farming on groundwater aquifers. Neighboring countries such as Saudi Arabia, according to Ouda [41], have adopted agricultural policies oriented toward food self-sufficiency (e.g., stimulating production of wheat, vegetables, and fruit). Their encouragement and support of farmers has enabled them to achieve wheat self-sufficiency, with surpluses for export. However, those policies have also resulted in the depletion of scarce groundwater resources. Irrigation water demand increased almost threefold, from some 8 km³ in 1980 to some 22.3 km3 in 1994. The effect of excessive extraction of groundwater for irrigation is reflected in the decline in groundwater levels. In some aquifers, groundwater has declined by more than 200 meters in the past two decades [42]. It is worth mentioning here that the reduction of post-harvest losses is a promising strategy for increasing marketable output. Post-harvest losses of fruits and vegetables reach some 50% [43], and for cereal grains reach up to 60% [44]. Agricultural extension offering farmers training and best practices for reducing these losses could be particularly important in regions such as the study area, where illiteracy is high and environmental conditions are harsh. Appropriate harvesting, handling, packaging, storage, and transportation can make important inroads in reducing produce losses. Indeed, preserving an existing crop constitutes a more economically and environmentally effective option than seeking to produce more agricultural produce in an area with such scarce water resources. Another policy that could be considered is e.g., the encouragement of fishing to reduce the stress on scarce water resources, especially in view of the study region’s coastal proximity. Moreover, water and food production-related policies could be reoriented toward support for the marketing of agricultural products at profitable prices for farmers rather than economic incentives that do not considerably reduce water demand. As suggested by the region’s farmers, any reallocation of water should consider the whole catchment of Wadi Zabid, including the upstream area, where cash crops are cultivated [35].
Author Contributions
W.A.-Q. conceived and designed the manuscript, carried out the field visit, performed data acquisition, data analysis and interpretation, and wrote the manuscript. P.H. and H.R. supervised the whole research, providing critical revision and suggestions for improvement the content of the paper.
Funding
This study was funded by the Netherlands Fellowship Programme under the NICHE/YEM/027 project (Strengthening Research Capacity in Yemen’s Water Sector for Policy Formulation, Education and Awareness Raising) and executed at the Water and Environment Center, Sana’a University, in cooperation with MetaMeta Research and Wageningen University, the Netherlands.
Conflicts of Interest
The authors declare no potential conflicts of interest.
Geolocation Information
Wadi Zabid is one of the catchments of the Tihama coastal plain. The wadi originates in the western highlands of Ibb and Dhamar governorates, passes through the highlands of the Jabal Ras directorate, and continues through Al-Jarrahi, Zabid, and Al-Tuhita directorates, discharging into the Red Sea in heavy rainfall years. This study covered the plains area of the wadi, which was divided into a midstream, downstream, and coastal zone (about 46 km by 20 km altogether). The center of the study region has the coordinates 317,122UTM-E and 1,564,732UTM-N.
Appendix A
Crop budget formula used
Gross production value (US$/ha/yr) = yield × price.
Farmers often sold their products in different units than in kilograms, such as by maad (a locally used unit) or by number of trees, bundles, baskets, or cartons. These units were converted to conventional values where appropriate.
Costs of production * (US$/ha/yr) = seed or sapling cost + fertilizer cost + pesticide cost + land preparation and labor cost + irrigation water costs (all units in US$/ha/yr)
Cost of irrigation water (US$/ha/yr) = unit cost of pumping water (US$/m3) from a particular depth (US$/m3) × water quantity applied for irrigation (m3/ha/yr)
Unit cost of pumping water (US$/m3) = diesel consumed to pump one unit of groundwater (l/m3) × cost of one liter of diesel (US$/l)
Net production value or net return to land (US$/ha/yr) = gross production value (US$/ha/yr) − costs of production (US$/ha/yr)
Value of water or net return to water# (US$/m3) = net production value or net return to land (US$/ha/yr)/water quantity applied for irrigation (m3/ha/yr)
* Not including fixed costs.
# Including the cost of irrigation. The value of water (without including irrigation cost) = the value of water (including irrigation cost) + (unit cost of pumping water × percentage of groundwater applied for irrigation).
References
- Siebert, S.; Burke, J.; Faures, J.M.; Frenken, K.; Hoogeveen, J.; Döll, P.; Portmann, F.T. Groundwater use for irrigation—A global inventory. Hydrol. Earth Syst. Sci. 2010, 14, 1863–1880. [Google Scholar] [CrossRef]
- Tesfai, M.; Stroosnijder, L. The Eritrean spate irrigation system. Agric. Water Manag. 2001, 48, 51–60. [Google Scholar] [CrossRef]
- Hellegers, P.J.G.J.; Perry, C.; Al-Aulaqi, N.; Al-Eryani, A.R.; Al-Hebshi, M. Incentives to Reduce Groundwater Extraction In Yemen; (lei report 2008-058); LEI and Wageningen UR: Wageningen, The Netherlands, 2008; Volume 131. [Google Scholar]
- Smith, C.S.; McDonald, G.T. Assessing the sustainability of agriculture at the planning stage. J. Environ. Manag. 1998, 52, 15–37. [Google Scholar] [CrossRef]
- Korsgaard, L.; Jensen, R.A.; Jønch-Clausen, T.; Rosbjerg, D.; Schou, J.S. A service and value based approach to estimating environmental flows. Int. J. River Basin Manag. 2008, 6, 257–266. [Google Scholar] [CrossRef]
- World Bank. Republic of Yemen: Unlocking the Potential for Economic Growth; World Bank: Washington, DC, USA, 2015. [Google Scholar]
- Ward, C. Yemen’s water crisis. Br.-Yemeni Soc. J. 2001. [Google Scholar]
- Al-Qubatee, W. Artificial recharge assessment of groundwater through Mekhtan Dam Bani Husheish, Sana’a basin—Yemen and ways to improve it out of the perspective of IWRM. Unpublished Master’s Thesis, Jordan University and Cologne University of Applied Sciences, Cologne, Germany, 2009. [Google Scholar]
- Alderwish, A.M.; Al-Khirbash, B.; Mushied, H. Review of yemen’s control of groundwater extraction regime: Situation and options. Int. Res. J. Earth Sci. 2014, 2, 7–16. [Google Scholar]
- Ward, F.A.; Michelsen, A. The economic value of water in agriculture: Concepts and policy applications. Water Policy 2002, 4, 423–446. [Google Scholar] [CrossRef]
- Hellegers, P.J.G.J.; Leflaive, X. Water allocation reform: What makes it so difficult? Water Int. 2015, 40, 273–285. [Google Scholar] [CrossRef]
- Al-Karablieh, E.K.; Salman, A.Z.; Al-Omari, A.S.; Wolff, H.P.; Al-Assa’d, T.A.; Hunaiti, D.A.; Subah, A.M. Estimation of the economic value of irrigation water in jordan. J. Agric. Sci. Technol. B 2012, 2, 487–497. [Google Scholar]
- Yedra, H.; Mesa-Jurado, M.A.; López-Morales, C.A.; Castillo, M.M. Economic valuation of irrigation water in south-eastern mexico. Int. J. Water Resour. Dev. 2016, 32, 931–943. [Google Scholar] [CrossRef]
- Speelman, S.; Farolfi, S.; Perret, S.; D’Haese, L.; D’Haese, M. Irrigation water value at small-scale schemes: Evidence from the north west province, south africa. Int. J. Water Resour. Dev. 2008, 24, 621–633. [Google Scholar] [CrossRef]
- Hellegers, P.J.G.J. The role of economics in irrigation water management. Irrig. Drain. 2006, 55, 157–163. [Google Scholar] [CrossRef]
- Al-Qubatee, W.; Al Hasan, F.; Ritzema, H.; Nasher, G.; Hellegers, P.J.G.J. Drivers of Groundwater Degradation in Wadi Zabid, Tihama Coastal Plain, Yemen. Unpublished work.
- Central Statistical Organization. Statistical Yearbook 2005; Central Statistical Organization, Ministry of Planning and International Cooperation: Sana’a, Yemen, 2005.
- Tipton and Kalambach. The Wadi Zabid Groundwater Potential; Tihama Development Authority (TDA): Hodeida, Yemen; Denver, CO, USA, 1980. [Google Scholar]
- NWRA (National Water Resources Authority). Tihama Water Resources Assessment, Zabid Water Resources Management, Wadi Zabid and Wadi Rema’a District: Well Inventory Results; Ministry of Water and Environment: Sana’a, Yemen, 2008.
- Davidson, B.; Hellegers, P.; Samad, M. Assessing the economic impact of redistributing water within a catchment: A case study of the musi catchment in the krishna basin in india. In IWMI Working Paper; International Water Management Institute: Colombo, Sri Lanka, 2009. [Google Scholar]
- Young, R.A.; Loomis, J.B. Determining the Economic Value Of Water: Concepts and Methods; RFF Press: Oxfordshire, UK, 2014. [Google Scholar]
- Hellegers, P.J.; Roerink, G.J. Financial viability and profitability of irrigation in crimea, ukraine. Irrig. Drain. J. Int. Comm. Irrig. Drain. 2006, 55, 13–20. [Google Scholar] [CrossRef]
- Roerink, G.J.; Zhovtonog, O.I. Towards Sustainable Irrigated Agriculture in Crimea, Ukraine: A Plan for the Future; Alterra: Wageningen, Yemen, 2005. [Google Scholar]
- Hellegers, P.J.G.J.; Perry, C.J. Water as an economic good in irrigated agriculture—Theory and practice. In Report—Agricultural Economics Research Institute (LEI); Landbouw-Economisch Instituut (LEI): Den Haag, The Netherlands, 2004. [Google Scholar]
- Tipton and Kalmbach. Proposed Plan for Water Allocation, Wadi Zabid Irrigation Project; Tihama Development Authority (TDA): Hodeida, Yemen; Denver, CO, USA, 1974. [Google Scholar]
- IIP (Irrigation Improvement Project). WUA Operation and Maintenance Manual Wadi Zabid; Ministry of Agriculture and Irrigation: Sana’a, Yemen, 2005.
- Bahamish, A.A. Final Report on Legal Survey of Existing Traditional Water Rights in the Spate Irrigation Systems in Wadi Zabid and Wadi Tuban; Credit No. 3412 YEM; Irrigation Improvement Project: Sana’a, Yemen, 2004. [Google Scholar]
- Al-Qubatee, W.; Ibrahim, A.; From Dalseng, C.; Al-Weshall, A.; Steenbergen, F.v.; Ritzema, H.P. Assessing the effectiveness of water governance in combating groundwater degradation in al-mujaylis, tihama coastal plain, yemen. In Social Water Studies in the Arab Region; Humboldt University: Berlin, Germany, 2015; Volume 4, pp. 197–216. [Google Scholar]
- Abdelouahhab, Z.; Arias-Jiménez, E.J. Date Palm Cultivation; Food and Agriculture Organization (FAO): Rome, Italy, 1999; p. 287. [Google Scholar]
- Brouwer, C.; Heibloem, M. Irrigation Water Needs; FAO: Rome, Italy, 1986. [Google Scholar]
- Johnson, P.; Parr, D. Mango Growing in Western Australia; Department of Agriculture and Food: Perth, WA, Australia, 2000.
- DHV (Dwars, Heederik en Verhey). Tihama Basin Water Resources Study Technical Reports 2, 3 and 4: Surface Water, Groundwater and Land Use; Tihama Development Authority (TDA), Ministry of Agriculture and Fisheries Resources: Sana’a, Yemen, 1988.
- Hellegers, P.J.G.J.; Perry, C.J.; Al-Aulaqi, N. Incentives to reduce groundwater consumption in yemen. Irrig. Drain. 2011, 60, 93–102. [Google Scholar] [CrossRef]
- He, L.; Tyner, W.; Siam, G. Improving Irrigation Water Allocation Efficiency Using Alternative Policy Options in Egypt; American Agricultural Economics Association: Denver, CO, USA, 2004. [Google Scholar]
- Al-Qubatee, W.; Ibrahim, A.; From Dalseng, C.; Al-Weshali, A.; Van Steenbergen, F. Groundwater Depletion, Sand Dune Formation and Local Responses: Case Study Al-Mujaylis. Unpublished Report from the CoCooN Integrated Project: Groundwater in the Political Domain; Water and Environment Center, Sana’a University: Sana’a, Yemen; MetaMeta Research: Hertogenbosch, The Netherlands, 2013. [Google Scholar]
- Al-Qubatee, W.; Ritzema, H.; Al-Weshali, A.; Van Steenbergen, F.; Hellegers, P.J. Participatory rural appraisal to assess groundwater resources in al-mujaylis, tihama coastal plain, yemen. Water Int. 2017, 42, 810–830. [Google Scholar] [CrossRef]
- Achterbosch, T.; Berkum, S.v.; Meijerink, G.; Asbreuk, H.; Oudendag, D.A. Cash Crops and Food Security: Contributions to Income, Livelihood Risk and Agricultural Innovation; LEI Wageningen UR: The Hague, The Netherlands, 2014. [Google Scholar]
- HWC (High Water Council). Water Resources Management in the Thiama; Final report; Technical Secretariat of the High Water Council: Sana’a, Yemen, 1992. [Google Scholar]
- Mahoo, H.F.; Mkoga, Z.J.; Kasele, S.S.; Igbadur, H.E.; Hatibu, N.; Rao, K.P.; Lankford, B. Productivity of Water in Agriculture: Farmers’ Perceptions and Practices; IWMI: Colombo, Sri Lank, 2007. [Google Scholar]
- Pistoia, A.; Poli, P.; Casarosa, L.; Balestri, G.; Ferruzzi, G. Sorghum used to fodder production in dry farming. Ital. J. Anim. Sci. 2010, 6, 342–344. [Google Scholar] [CrossRef]
- Ouda, O.K.M. Impacts of agricultural policy on irrigation water demand: A case study of saudi arabia. Int. J. Water Resour. Dev. 2014, 30, 282–292. [Google Scholar] [CrossRef]
- World Bank. A Water Sector Assessment Report on Countries of the Cooperation Council of the Arab State of the Gulf; Report No. 32539-MNA; World Bank: Washington, DC, USA, 2005. [Google Scholar]
- Elik, A.; Yanik, D.K.; Istanbullu, Y.; Guzelsoy, N.A.; Yavuz, A.; Gogus, F. Strategies to reduce post-harvest losses for fruits and vegetables. Strategies 2019, 5. [Google Scholar] [CrossRef]
- Kumar, D.; Kalita, P. Reducing postharvest losses during storage of grain crops to strengthen food security in developing countries. Foods 2017, 6, 8. [Google Scholar] [CrossRef] [PubMed] [Green Version]
Figure 1.
Soil map of Wadi Zabid map showing the division study area, the farms that were randomly selected for farmer interviews, and the representative farms chosen to calculate the economic value of irrigation water. Source: extracted from national soil map of Yemen sheet D38A, 1:500,000 (Agricultural Research and Extension Authority 2006).

Figure 2.
Characteristics of field survey respondents and farms in Wadi Zabid: (a) educational level, (b) farm size.
Figure 2.
Characteristics of field survey respondents and farms in Wadi Zabid: (a) educational level, (b) farm size.

Figure 3.
Cost of diesel to pump one unit of groundwater from different depths (US $/m3), 2015/2016.
Figure 3.
Cost of diesel to pump one unit of groundwater from different depths (US $/m3), 2015/2016.

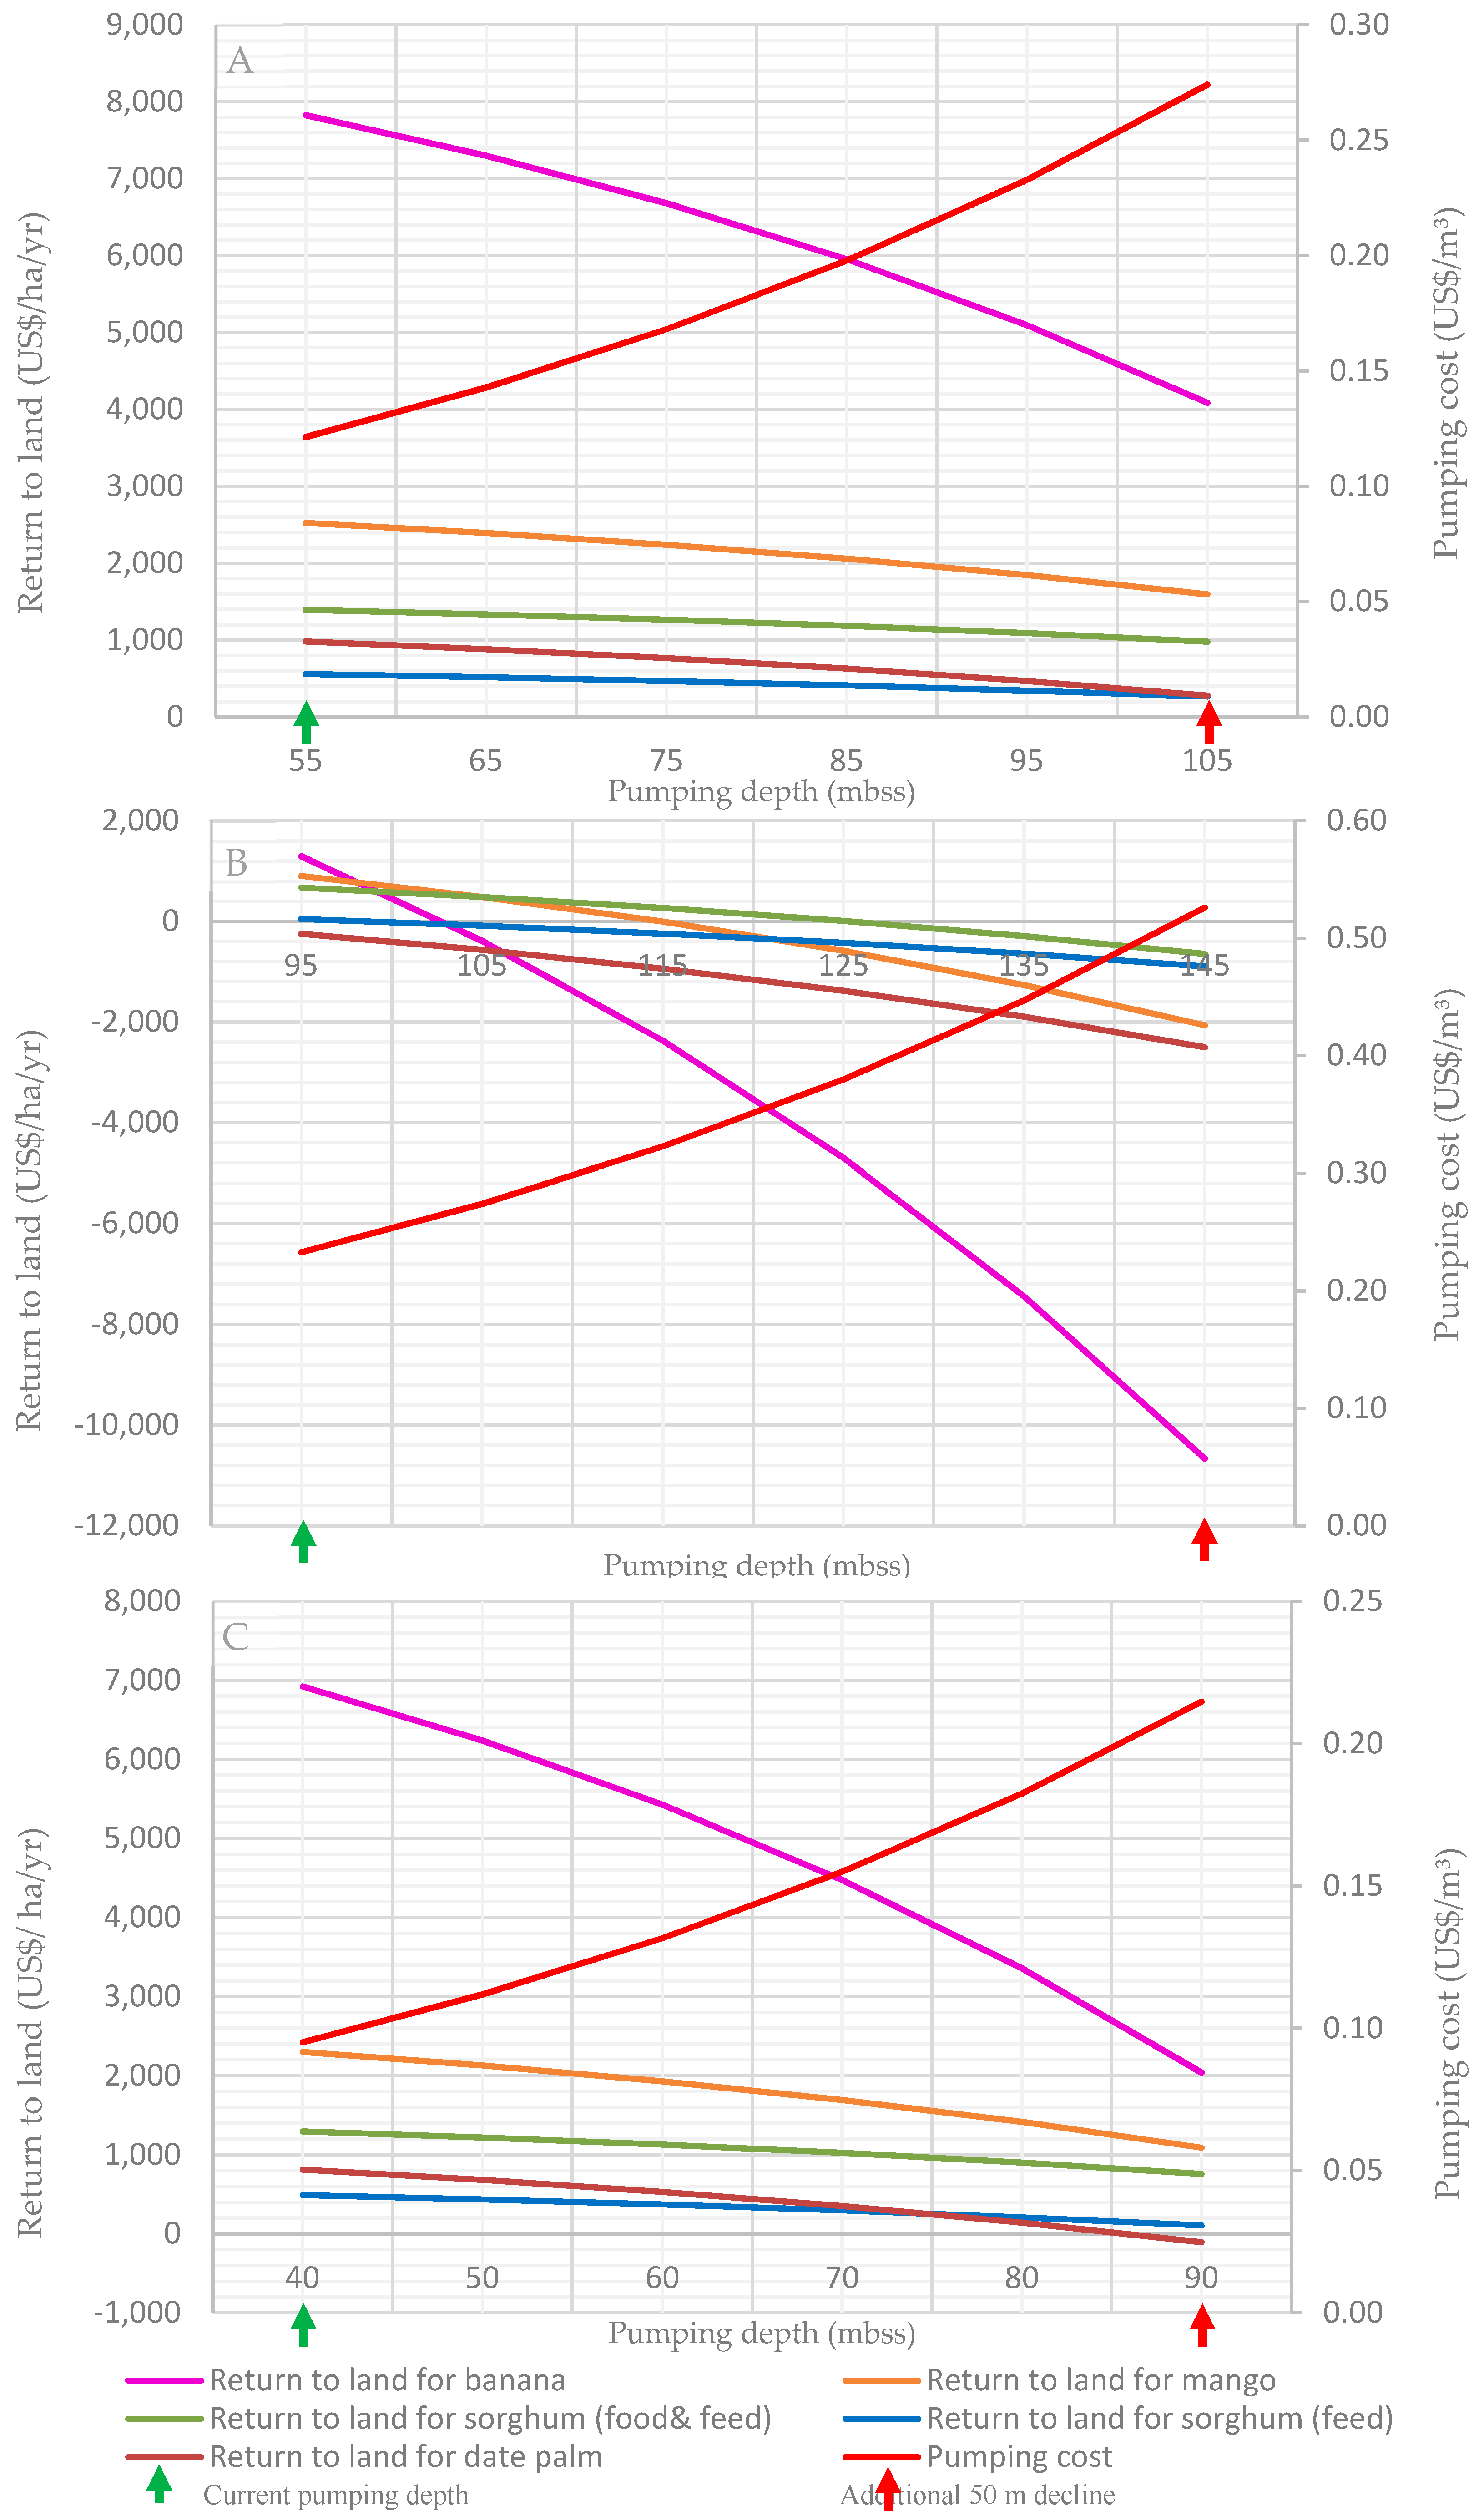
Figure 4.
Economic returns to water in the midstream (A), downstream (B), and coastal areas (C) of Wadi Zabid using groundwater pumping depths in 2016 compared to a future scenario with an up to 50-m increase in groundwater pumping depths.
Figure 4.
Economic returns to water in the midstream (A), downstream (B), and coastal areas (C) of Wadi Zabid using groundwater pumping depths in 2016 compared to a future scenario with an up to 50-m increase in groundwater pumping depths.

Figure 5.
Economic returns to land in the midstream (A), downstream (B), and coastal areas (C) of Wadi Zabid using groundwater pumping depths in 2016 compared to a future scenario with an up to 50-m increase in groundwater pumping depths.
Figure 5.
Economic returns to land in the midstream (A), downstream (B), and coastal areas (C) of Wadi Zabid using groundwater pumping depths in 2016 compared to a future scenario with an up to 50-m increase in groundwater pumping depths.


Table 1.
Average pumping depth of groundwater and spate water availability in three areas of the Wadi Zabid region, 2016.
Table 1.
Average pumping depth of groundwater and spate water availability in three areas of the Wadi Zabid region, 2016.
| Midstream | Downstream | Coast | |
|---|---|---|---|
| Depth of groundwater pumping (mbss) * | 55 | 95 | 40 |
| Spate water availability (%) # | 40 | 0 | 0 |
* Depth according to measuring well water levels from a survey done in mid-2016 for the purpose of this study. # As a percentage of the total irrigation water applied on an annual basis. Spate water was distributed according to Sheikh Al-Jabarti rules between three groups located in the midstream. Recently, many violations of these rules have been observed, with some asserting that the rule is socially unjust. For details, see [25,26,27,28].
Table 2.
Crop budgets in three areas of the Wadi Zabid region, with calculated returns to land and water and total amounts of irrigation applied, 2016.
Table 2.
Crop budgets in three areas of the Wadi Zabid region, with calculated returns to land and water and total amounts of irrigation applied, 2016.
| Banana | Mango | Date Palm | Sorghum (Food) | Sorghum (Feed) | |||
|---|---|---|---|---|---|---|---|
| Cost of production (US$/ ha/yr) | Seeds or saplings * | 69 | 78 | 39 | |||
| Land preparation and labor | 1038 | 632 | 600 | 857 | 519 | ||
| Fertilizer | 195 | 70 | 0 | 156 | 208 | ||
| Pesticides | 363 | 137 | 130 | 0 | 0 | ||
| Cost of irrigation pumping ** | Midstream (40% spate water) | 2970 | 737 | 559 | 328 | 233 | |
| Downstream (0% spate water) | 9501 | 2357 | 1788 | 1048 | 745 | ||
| Coastal area (0% spate) | 3876 | 961 | 730 | 428 | 304 | ||
| Total input costs | Midstream | 4635 | 1575 | 1289 | 1419 | 999 | |
| Downstream | 11,166 | 3195 | 2519 | 2139 | 1511 | ||
| Coastal area | 5541 | 1800 | 1460 | 1519 | 1070 | ||
| Value of production | Product (tons/ha/yr) | 33.33 | 8 | 13.33 | 3.70 | 0 | |
| Price (US$/kg) | 0.37 | 0.51 | 0.17 | 0.58 | 0 | ||
| By-product (US$/ha/yr) | 0 | 0 | 0 | 649 | 1558 | ||
| Total returns (US$/ha/yr) | 12,461 | 4099 | 2272 | 2812 | 1558 | ||
| Net returns or returns to land (US$/ha/yr) | Midstream | 7826 | 2524 | 982 | 1394 | 559 | |
| Downstream | 1295 | 904 | −247 | 673 | 47 | ||
| Coastal area | 6920 | 2299 | 812 | 1294 | 488 | ||
| Total irrigation applied (m³/ha/yr) | 40,800 | 10,119 | 7680 | 4500 | 3200 | ||
| Returns to water (US$/m³) | Midstream | 0.19 | 0.25 | 0.13 | 0.31 | 0.17 | |
| Downstream | 0.03 | 0.09 | −0.03 | 0.15 | 0.01 | ||
| Coastal area | 0.17 | 0.23 | 0.11 | 0.29 | 0.15 | ||
* Date palm and mango saplings were not included as their life span is very long, some 100 years and 40 years, respectively. ** The average groundwater pumping depths in the midstream, downstream, and coastal areas were 55, 95, and 40 mbss, respectively.
Table 3.
Amounts of irrigation water applied (m³/ha) for the dominant crops in Wadi Zabid (2016), and in other places and worldwide.
Table 3.
Amounts of irrigation water applied (m³/ha) for the dominant crops in Wadi Zabid (2016), and in other places and worldwide.
| Place | Banana | Mango | Sorghum(Feed and Food) | Date Palm |
|---|---|---|---|---|
| Wadi Zabid 1 | 29,000–70,000 * | 4000–27,000 | 500–5000 | 4000–25,000 |
| Taiz 2 | 16,800 | 18,800 | 6700 | NA |
| Hadramout 2 | 27,037 | 26,339 | NA | 1000 |
| Wad Madani/Shendi 1 | 60,000 | 7000–18,000 | 5000 | 5000–7000 |
| Worldwide | 12,000–22,000 4 | 11,200–17,000 5 | 4500–6500 4 | 15,000–35,000 3 |
Notes: NA: not available. * For 12 to 18 crops per year. Sources: 1. Field surveys conducted for this study in Yemen in mid-2016 and in Sudan in mid-2018; date palm is only in Shendi. 2. Hellegers et al. [3]. 3. In Algeria Abdelouahhab and Arias-Jiménez [29]. 4. Brouwer and Heibloem [30]. 5. Johnson and Parr [31].
Table 4.
Average groundwater depths in the study region of Wadi Zabid in previous decades and expected levels in 2066.
Table 4.
Average groundwater depths in the study region of Wadi Zabid in previous decades and expected levels in 2066.
| Year | Groundwater Levels in Wadi Zabid (mbss) | ||
|---|---|---|---|
| Midstream | Downstream | Coast | |
| 1972 1 | 20 | 8 | 0.5 |
| 1987 2 | 25 | 40 | 10 |
| 2008 3 | 30 | 75 | 18 |
| 2016 * | 50 | 90 | 35 |
| Predicted 2066 | 100 | 140 | 85 |
Table 5.
Economic returns to land and water calculated for the midstream, downstream, and coastal areas of Wadi Zabid. In the current scenario, the average groundwater pumping depths are 55 mbss, 95 mbss, and 40 mbss, respectively. For the future scenario, a 50-m drop in groundwater depths was assumed, creating groundwater depths of 105 mbss, 145 mbss, and 70 mbss, respectively.
| Crops | Returns to Land (US$/ha/yr) | Returns to Water (US$/m³) | ||||||||||
|---|---|---|---|---|---|---|---|---|---|---|---|---|
| Midstream | Downstream | Coast | Midstream | Downstream | Coast | |||||||
| Current | Future | Current | Future | Current | Future | Current | Future | Current | Future | Current | Future | |
| Banana | 7826 | 4086 | 1295 | −10,668 | 6920 | 2039 | 0.19 | 0.10 | 0.03 | −0.26 | 0.17 | 0.05 |
| Mango | 2524 | 1597 | 904 | −2063 | 2299 | 1089 | 0.25 | 0.16 | 0.09 | −0.20 | 0.23 | 0.11 |
| Sorghum (food) | 1394 | 981 | 673 | −646 | 1294 | 755 | 0.31 | 0.22 | 0.15 | −0.14 | 0.29 | 0.17 |
| Sorghum (feed) | 559 | 266 | 47 | −892 | 488 | 105 | 0.17 | 0.08 | 0.01 | −0.28 | 0.15 | 0.03 |
| Date palm | 982 | 278 | −247 | −2499 | 812 | −107 | 0.13 | 0.04 | −0.03 | −0.33 | 0.11 | −0.01 |
© 2019 by the authors. Licensee MDPI, Basel, Switzerland. This article is an open access article distributed under the terms and conditions of the Creative Commons Attribution (CC BY) license (http://creativecommons.org/licenses/by/4.0/).
Share and Cite
MDPI and ACS Style
Al-Qubatee, W.; Hellegers, P.; Ritzema, H. The Economic Value of Irrigation Water in Wadi Zabid, Tihama Plain, Yemen. Sustainability 2019, 11, 6476. https://doi.org/10.3390/su11226476
AMA Style
Al-Qubatee W, Hellegers P, Ritzema H. The Economic Value of Irrigation Water in Wadi Zabid, Tihama Plain, Yemen. Sustainability. 2019; 11(22):6476. https://doi.org/10.3390/su11226476
Chicago/Turabian StyleAl-Qubatee, Wahib, Petra Hellegers, and Henk Ritzema. 2019. "The Economic Value of Irrigation Water in Wadi Zabid, Tihama Plain, Yemen" Sustainability 11, no. 22: 6476. https://doi.org/10.3390/su11226476
Note that from the first issue of 2016, this journal uses article numbers instead of page numbers. See further details here.