Article

Impact of Nitrogen Addition on Physiological, Crop Total Nitrogen, Efficiencies and Agronomic Traits of the Wheat Crop under Rainfed Conditions

1
Department of Agronomy, Pir Mehr Ali Shah Arid Agriculture University, Rawalpindi 46300, Pakistan
2
Department of Agricultural Research for Northern Sweden, Swedish University of Agricultural Sciences, Umeå 90183, Sweden
3
Department of Biological Systems Engineering, Washington State University Pullman, Pullman, WA 99164-6120, USA
4
Institute of Soil Science, Pir Mehr Ali Shah Aridl Agriculture University, Rawalpindi 46300, Pakistan
*
Authors to whom correspondence should be addressed.
Sustainability 2019, 11(22), 6486; https://doi.org/10.3390/su11226486
Submission received: 11 October 2019 / Revised: 11 November 2019 / Accepted: 13 November 2019 / Published: 18 November 2019

Abstract

:
Optimizing nitrogen (N) application timings and rate can improve nutrient uptake and nutrient efficiencies in wheat, particularly under rainfed conditions. Climatic stress in the form of high temperature and drought resulted in the decreased crop physiological traits, hastened maturity and, ultimately, caused lower grain yield. The impact of N application rates as full and split dose at three diverse locations of rainfed Pothwar, Pakistan was studied through field experiments for two years (2013–14 and 2014–15). Treatments include T1 = control (no fertilizer applied), full dose of N applied at the time of crop sowing, i.e., T2 = 50 kg N ha−1, T3 = 100 kg N ha−1 and T4 = 150 kg N ha−1, and split application of N at different timings at different stages of the crop, called split application of N, i.e., T5: application of 50 kg N ha−1 (15 kg N ha−1 (sowing, BBCH (Biologische Bundesanstalt Bundessortenamt und Chemische Industrie) 0): 20 kg N ha−1 (tillering, BBCH20): 15 kg N ha−1 (anthesis, BBCH 60), T6: application of 100 kg N ha−1 (30 kg N ha−1 (sowing, BBCH 0): 40 kg N ha−1 (tillering, BBCH 20): 30 kg N ha−1 (anthesis, BBCH 60) and T7: application of 150 kg N ha−1 (45 kg N ha−1 (sowing, BBCH 0): 60 kg N ha−1 (tillering, BBCH 20): 45 kg N ha−1 (anthesis, BBCH 60). The three study sites were Islamabad (high rainfall with optimum temperature), University Research Farm (URF)-Chakwal Road, Koont (medium rainfall with moderate temperature), and Talagang (low rainfall with high temperature). Results revealed that the highest stomatal conductance (0.80 mole H2O m−2 s−1), net photosynthetic rate (20.07 μmole CO2 m−2 s−1), transpiration rate (9.58 mmole H2O m−2 s−1), intercellular CO2 concentration (329.25 μmole CO2 mol−1 air), SPAD values (58.86%) and proline contents (35.42 μg g−1) were obtained from split application of N (T6 = split N100) compared to control and full dose N treatments. Among the sites, these physiological traits remained highest at Islamabad and lowest at Talagang, while between the years, the maximum values of the measured parameters were obtained during 2013–14. A similar trend was observed for crop total N, N efficiencies, and agronomic traits of the crop. The results suggested that the optimum N application rate at appropriate timings can help to harvest the real benefits of N. The split dose resulted in the maximum performance of the crop from the physiological parameters to the agronomic traits of the crop.

1. Introduction

Rainfed regions occupy 45% of the earth and are home to 38% of global production [1]. Water stress and low nitrogen (N) fertility are the main constraints lowering crop productivity of this region. These limitations are expected to increase in the future as climate change could result in a decrease of rainfall and increase of evapotranspiration in the rainfed region. Climate change in the form of rising temperatures, rainfall variability, and elevated CO2 is showing significant impact on the productivity of this region. Since elevated CO2 [eCO2] is one of the documented global changes, it is thus showing its effects on plants in the form of reduction in stomatal conductance (gs) and transpiration rate (E) and increased light use efficiency [2]. However, this [eCO2] could help to increase the photosynthesis of crops by increasing the Ribulose-1,5-bisphosphate carboxylase (Rubisco) carboxylation rate and inhibition of its oxygenation [3]. It has been reported that [eCO2] resulted in a 31% increase in the light-saturated leaf photosynthetic rate and 28% daily photosynthetic carbon assimilation [4]. However, stressful conditions like low N and drought resulted in decreased gs and a reduced net photosynthetic rate [4]. A similar trend of decreased gs (20%) was observed for C3 and C4 species. The decrease in photosynthesis is more pronounced under N-limited conditions as less N supply might limit the development of new sinks and disturbs the source-sink balance in plant growth under [eCO2] [5,6].
Dry matter production in plants depends upon the process of photosynthesis. It is the process in which plants convert light energy into photoassimilates through the action of CO2 and water. However, the supply of N is also one of the determinant factors for the process of photosynthesis. During the light reaction of photosynthesis, a generated electron is passed to Nicotinamide adenine dinucleotide phosphate (NADP) and helps to create NADPH by accepting hydrogen from the photolysis of water. This NADPH is then used in the CO2 carboxylation process to generate photosynthate [7]. However, water and nutrient deficiency, mainly N, could lead to a decrease in gs (stomatal conductance) and intercellular CO2 concentration (Ci) due to a reduced transpiration rate (E), resulting in a reduced photosynthetic CO2 carboxylation rate [8,9,10]. This reduction in crop physiological traits could be improved by the application of N, as it affects plant adaptation to abiotic stress [11,12,13]. The physiological process in plants is significantly affected by N deficiency, and it is well documented that N deficiency has an impact on the photosynthetic CO2 assimilation rate. It has been reported that lower levels of N lead to the CO2 assimilation rate by the leaves leading to less photosynthetic yield [14,15,16,17,18,19]. Furthermore, it has been confirmed that this decrease in the photosynthetic CO2 assimilation capacity is related to the supply of N, which resulted in a decreased Rubisco content and activity of an enzyme (RuBPcase) in the dark reaction of photosynthesis [20].
A positive correlation between the photosynthetic capacity of leaves and N contents has been shown in earlier work [14,21,22,23]. Application of N in wheat (Triticum aestivum L.) plants resulted in improved properties of photosynthetic pigments and increased net photosynthetic rate (An) [24,25]. N deficiency could decrease the yield of PSII (Photosystem II) and CO2 assimilation of photosynthesis, resulting in the lower crop yield [26,27,28]. However, some earlier work depicted that N deficiency has no effect on the PSII but has an impact on the return of CO2 assimilation and light-saturated rate of photosynthesis [26]. Lu and Zhang, (2000) [29] studied the effect of N deficiency on photosynthetic CO2 assimilation, PSII photochemistry, and photoinhibition in maize under field conditions. Their results showed that N deficiency resulted in lesser CO2 assimilation capacity and increased susceptibility to photoinhibition. Zhang et al. [30] reported a higher net photosynthetic rate in the flag leaf of wheat due to the N. Cai et al. [31] concluded that the photosynthetic response to the N application rate is variable among wheat cultivars. Similarly, an increase in the total chlorophyll contents of leaves was positively correlated with the N supply [32]. Moran et al. [33] showed that foliar concentration of photosynthetic pigments has a relationship with N supply, and it then ultimately leads to the increased physiological traits of plants. Similar results were depicted by Shrestha et al. [34] in their studies.
Zhong et al. [35] studied the effect of N addition on the sensitivity of photosynthesis among C3 versus C4 grass species under extreme drought and re-watering conditions. Their results concluded that N addition resulted in an increase in biomass, but photosynthesis resilience was lower under drought conditions. However, faster recovery of photosynthesis was observed due to the addition of N. They further concluded that during drought, the N addition effect on photosynthesis was asymmetric, and it is more specific for the plants which have different photosynthetic nitrogen use efficiency (PNUE). Thus, N could be used to mitigate abiotic stress like drought and could help plants to build resilience to climate change. Similarly, N could help to improve carbon fixation in crops as it is one of the essential components of amino acids. Additionally, it has been well documented that N addition improves the proline, sugars, and antioxidant enzymes in the plants. Sánchez et al. [36] reported an increased proline level under adequate N supply. Similarly, the accumulation of N-containing compounds could lead to the higher survival of plant species under stress [37]. Burns [38], in his findings, showed that N manipulation could help to improve plant growth and development. It has been reported that 90% of the biomass produced by crops is derived from photosynthesis; thus, Makino et al. [39] emphasized the design of strategies that could help to improve crop photosynthesis and grain yield under given N supply. N is the main component of the plant body and part of biological molecules like protein and enzymes, which are involved in different metabolic processes in plants. Thus, deficiency of N could lead to the overall decline in the physiological traits of crops, e.g., net photosynthesis (An), stomatal conductance (gs), biomass, and finally, crop yield. Hence, this study was conducted to explore how different N application rates and methods improve the physiological traits, biomass and grain yield of wheat crop under field conditions. This will be useful for wheat crop management from the perspective of crop physiological processes.
The objectives of the study were (i) to investigate the wheat crop physiological traits (SPAD chlorophyll contents, stomatal conductance (gs), stomatal resistance (Rs), transpiration rate (E), net photosynthetic rate (An)), crop total N, N efficiencies, and agronomic traits in response to N application rates and methods under field conditions and (ii) to see the relationship of physiological characteristics with wheat crop yield only.

2. Materials and Methods

2.1. Study Sites, Treatments, Plant Material, and Experimental Design

Field experiments were carried out during the wheat growing seasons of 2013–2014 and 2014–2015 at three variable climatic locations of Pothwar, i.e., low rainfall area, Talagang (32°55′ N, 72°25′ E), medium rainfall area, URF-Koont (32°93′ N, 72°86′ E), and high rainfall area, Islamabad (33°40′ N, 73°10′ E) [40] (Figure 1, Figure 2 and Figure 3). Urea ( ( N H 2 ) 2 C O ) (46% N) fertilizer was applied as full at the time of sowing and split doses (sowing, tillering, and anthesis). Treatments include T1 = control (no fertilizer applied), full dose of N applied at the time of crop sowing, i.e., T2 = 50 kg N ha−1, T3 = 100 kg N ha−1 and T4 = 150 kg N ha−1, and split application of N at different timings during different stages of the crop. called split application of N, i.e., T5: application of 50 kg N ha−1 (15 kg N ha−1 (sowing, BBCH (Biologische Bundesanstalt Bundessortenamt und Chemische Industrie) 0): 20 kg N ha−1 (tillering, BBCH 20): 15 Kg N ha−1 (anthesis, BBCH 60), T6: application of 100 kg N ha−1 (30 kg N ha−1 (sowing, BBCH 0): 40 kg N ha−1 (tillering, BBCH 20): 30 kg N ha−1 (anthesis, BBCH 60) and T7: application of 150 kg N ha−1 (45 kg N ha−1 (sowing, BBCH 0): 60 kg N ha−1 (tillering, BBCH 20): 45 kg N ha−1 (anthesis, BBCH 60). Each treatment was replicated three times. The field experiments were laid out using a randomized complete block design (RCBD). The soil physiochemical properties at Islamabad, URF-Koont and Talagang are presented in Table 1 and Table 2. The plot size was 5 × 6 m2 in which one bread wheat cultivar (Pakistan-13) was sown on 15th November for two years with a row to row distance of 25 cm. This variety was released by the Pakistan Agriculture Research Council (PARC) with yield potential of 6.0 tones ha−1 and good adaptability to the rainfed area. It has 12.1% protein content with gluten contents of 21.5% and 1000 seed weight of 48 g. This cultivar is resistant to yellow rust, leaf rust and stem rust race of Ug99. Weed control was done manually. Sowing was done by hand drill using a seed rate of 50 kg acre−1. Prior to sowing, the particular field remained fallow during summer, was ploughed once with a soil inverting implement and thereafter thrice with a tractor mounted cultivator. A one-meter path was maintained to isolate treatments. Pedigree/parentage of sown cultivar is PTSS02B00132T-0TOPY-0B-0Y-0B-38Y-0M-0SYMEX94.27.1.20/3/SOKOLL//ATTILA/3*BCN, and it was released in the year 2013 for the rainfed conditions of Punjab, Pakistan.

2.2. Physiological Traits Measurements

Wheat physiological traits, which include gs (stomatal conductance), Rs (stomatal resistance) (m2 s mole−1), net photosynthetic rate (An) (μ mole/m2/s), E (transpiration rate) (mmole H2O m−2 s−1) and Ci (intercellular CO2) (μmole CO2/mol air) were measured with an infrared gas analyzer (IRGA) at anthesis (BBCH 60) stage of wheat by putting a leaf into the chamber and adjusting its leaf area, and when the value became constant, it was recorded. The averages of five samples were taken as measured by Long and Bernacchi [41]. Similarly, chlorophyll contents were measured using a SPAD chlorophyll meter. The chlorophyll contents were taken from the top, middle, and base of leaves, and then the average value was used to represent SPAD chlorophyll contents. Proline content (μg g−1) was measured by taking fresh leaves (0.5 g) from plants at the flag leaf stage from each plot. The samples were normalized in ten ml of three percent sulfosalicyclic acid (C7H6O6S) and then filtered. The stress amino acid, proline (C5H9NO), was estimated spectrophotometrically following the ninhydrin method [42].

2.3. Crop Total Nitrogen

The amount of N in the plant was determined at tillering (BBCH 20), anthesis (BBCH 60), and maturity stages (BBCH 90). The one-meter square area was used to take plant samples. Nitrogen contents from plant samples were determined after oven drying at 65 °C for 48 h. After drying, samples were ground using a Wiley Mill, and samples were placed in plastic bottles to determine N contents. Samples of 2 g in 30 to 50 mL of acid and approximately 100 mL sodium hydroxide (NaOH) solutions were used. The TN (Total nitrogen) was measured after wet digestion in concentrated sulphuric acid (H2SO4) using the Kjeldahl procedure [43]. The total organic nitrogen was converted to ammonium sulfate. Ammonia formed was distilled into boric acid solution under alkaline conditions. The borate anions formed were titrated with standardized hydrochloric acid. This was used to calculate the content of nitrogen, representing the amount of crude protein in the sample, which is generally 16% of nitrogen, thus the conversion factor used was 6.25.

2.4. Nitrogen Efficiencies

Rahimizadeh et al.’s [44] procedure was used to determine the nitrogen uptake efficiency (NUpE), nitrogen utilization efficiency (NUtE), and nitrogen use efficiency (NUE):
NUpE = N T N s u p p l y
NUtE = G Y N T
NUE = G Y N s u p p l y
where NT = total plant N uptake, GY = grain yield, and Supply = sum of soil N content at sowing and N fertilizer.

2.5. Agronomic Traits

At physiological maturity, total numbers of fertile tillers were counted from an area of one m2 from each plot. Furthermore, a sub-sample of a thousand grains from each treatment was weighed using a digital weighing balance. The biological yield was measured by harvesting a one m2 area per plot and was converted to get the final yield in kg ha−1. Grain yield was calculated by harvesting a one m2 area per plot and was converted to get final yield in kg ha−1. Finally, the harvest index (HI) was measured using the following formula.
H a r v e s t   i n d e x   ( H I ) = G r a i n   y i e l d B i o l o g i c a l   Y i e l d × 100

2.6. Statistical Analysis

The significance of the effects of years, locations, and N treatments at the 0.05 level was determined using a three-way analysis of variance (ANOVA) using SPSS 19.0 software (SPSS, Inc., Chicago, IL, USA). Means obtained were compared using a Tukey test at 0.05% level of significance.

3. Results

3.1. Crop Physiological Traits

A significant difference was found for all physiological characteristics against all treatments. Stomatal conductance (gs) results showed that it remained significantly higher during 2013–14 as compared to 2014–15. Among the sites, the maximum gs was observed for Islamabad, followed by URF-Koont, while it was minimum at Talagang, i.e., a low rainfall and high-temperature location. N treatment effects on stomatal conductance revealed that it was maximum at T4, while the minimum was observed for the control treatment with full application of N at sowing. However, among split N application, the highest gs was recorded for T6, which was at par with T7 (Table 3). The interactive effect of Y × L was significant on gs, while all other interactions were non-significant. The results for stomatal resistance (Rs) were inverse to gs. Among the years, the highest Rs (1.05 m2 s mole−1) was observed during 2014–15, while at sites, it remained high at Talagang, followed by URF-Koont and Islamabad. N treatment’s impacts on Rs revealed that with the application of higher N, it decreases significantly. The lowest stomatal resistance was found for T5 and T6, while the highest stomatal resistance was observed for control treatment T1. Only Y × L interactions were found to be significant for stomatal resistance, while all other interactions were non-significant. Net Photosynthesis (An) results showed that it remained highest for the first year compared to 2014–15. Among the sites, the maximum An was recorded for Islamabad, while it remained the minimum at Talagang. N treatments have shown significant impacts on An, and the highest An was observed for split treatment T6, which was at par with T7. However, among the full dose application of N maximum, An was found for T4, while it was minimum for T1. Transpiration rate (E) remained highest during 2013–14, while the lowest E was recorded for 2014–15. Among the sites, the highest E was recorded for Islamabad, followed by URF-Koont and Talagang. The impact of N treatments on the transpiration rate revealed that it remained highest for split application of N, i.e., T6, which was at par with T7 as well as with T4. However, the lowest E was observed for the control treatment (T1). A similar trend was observed for Ci (μmole CO2 mol−1 air) and SPAD chlorophyll contents. However, proline contents remained maximum for the second year compared to the first year. Among the sites, the highest proline contents were observed at Talagang, while it remained lowest at Islamabad. N addition resulted in the positive effects on proline contents, and the highest proline was observed for split treatment T6.

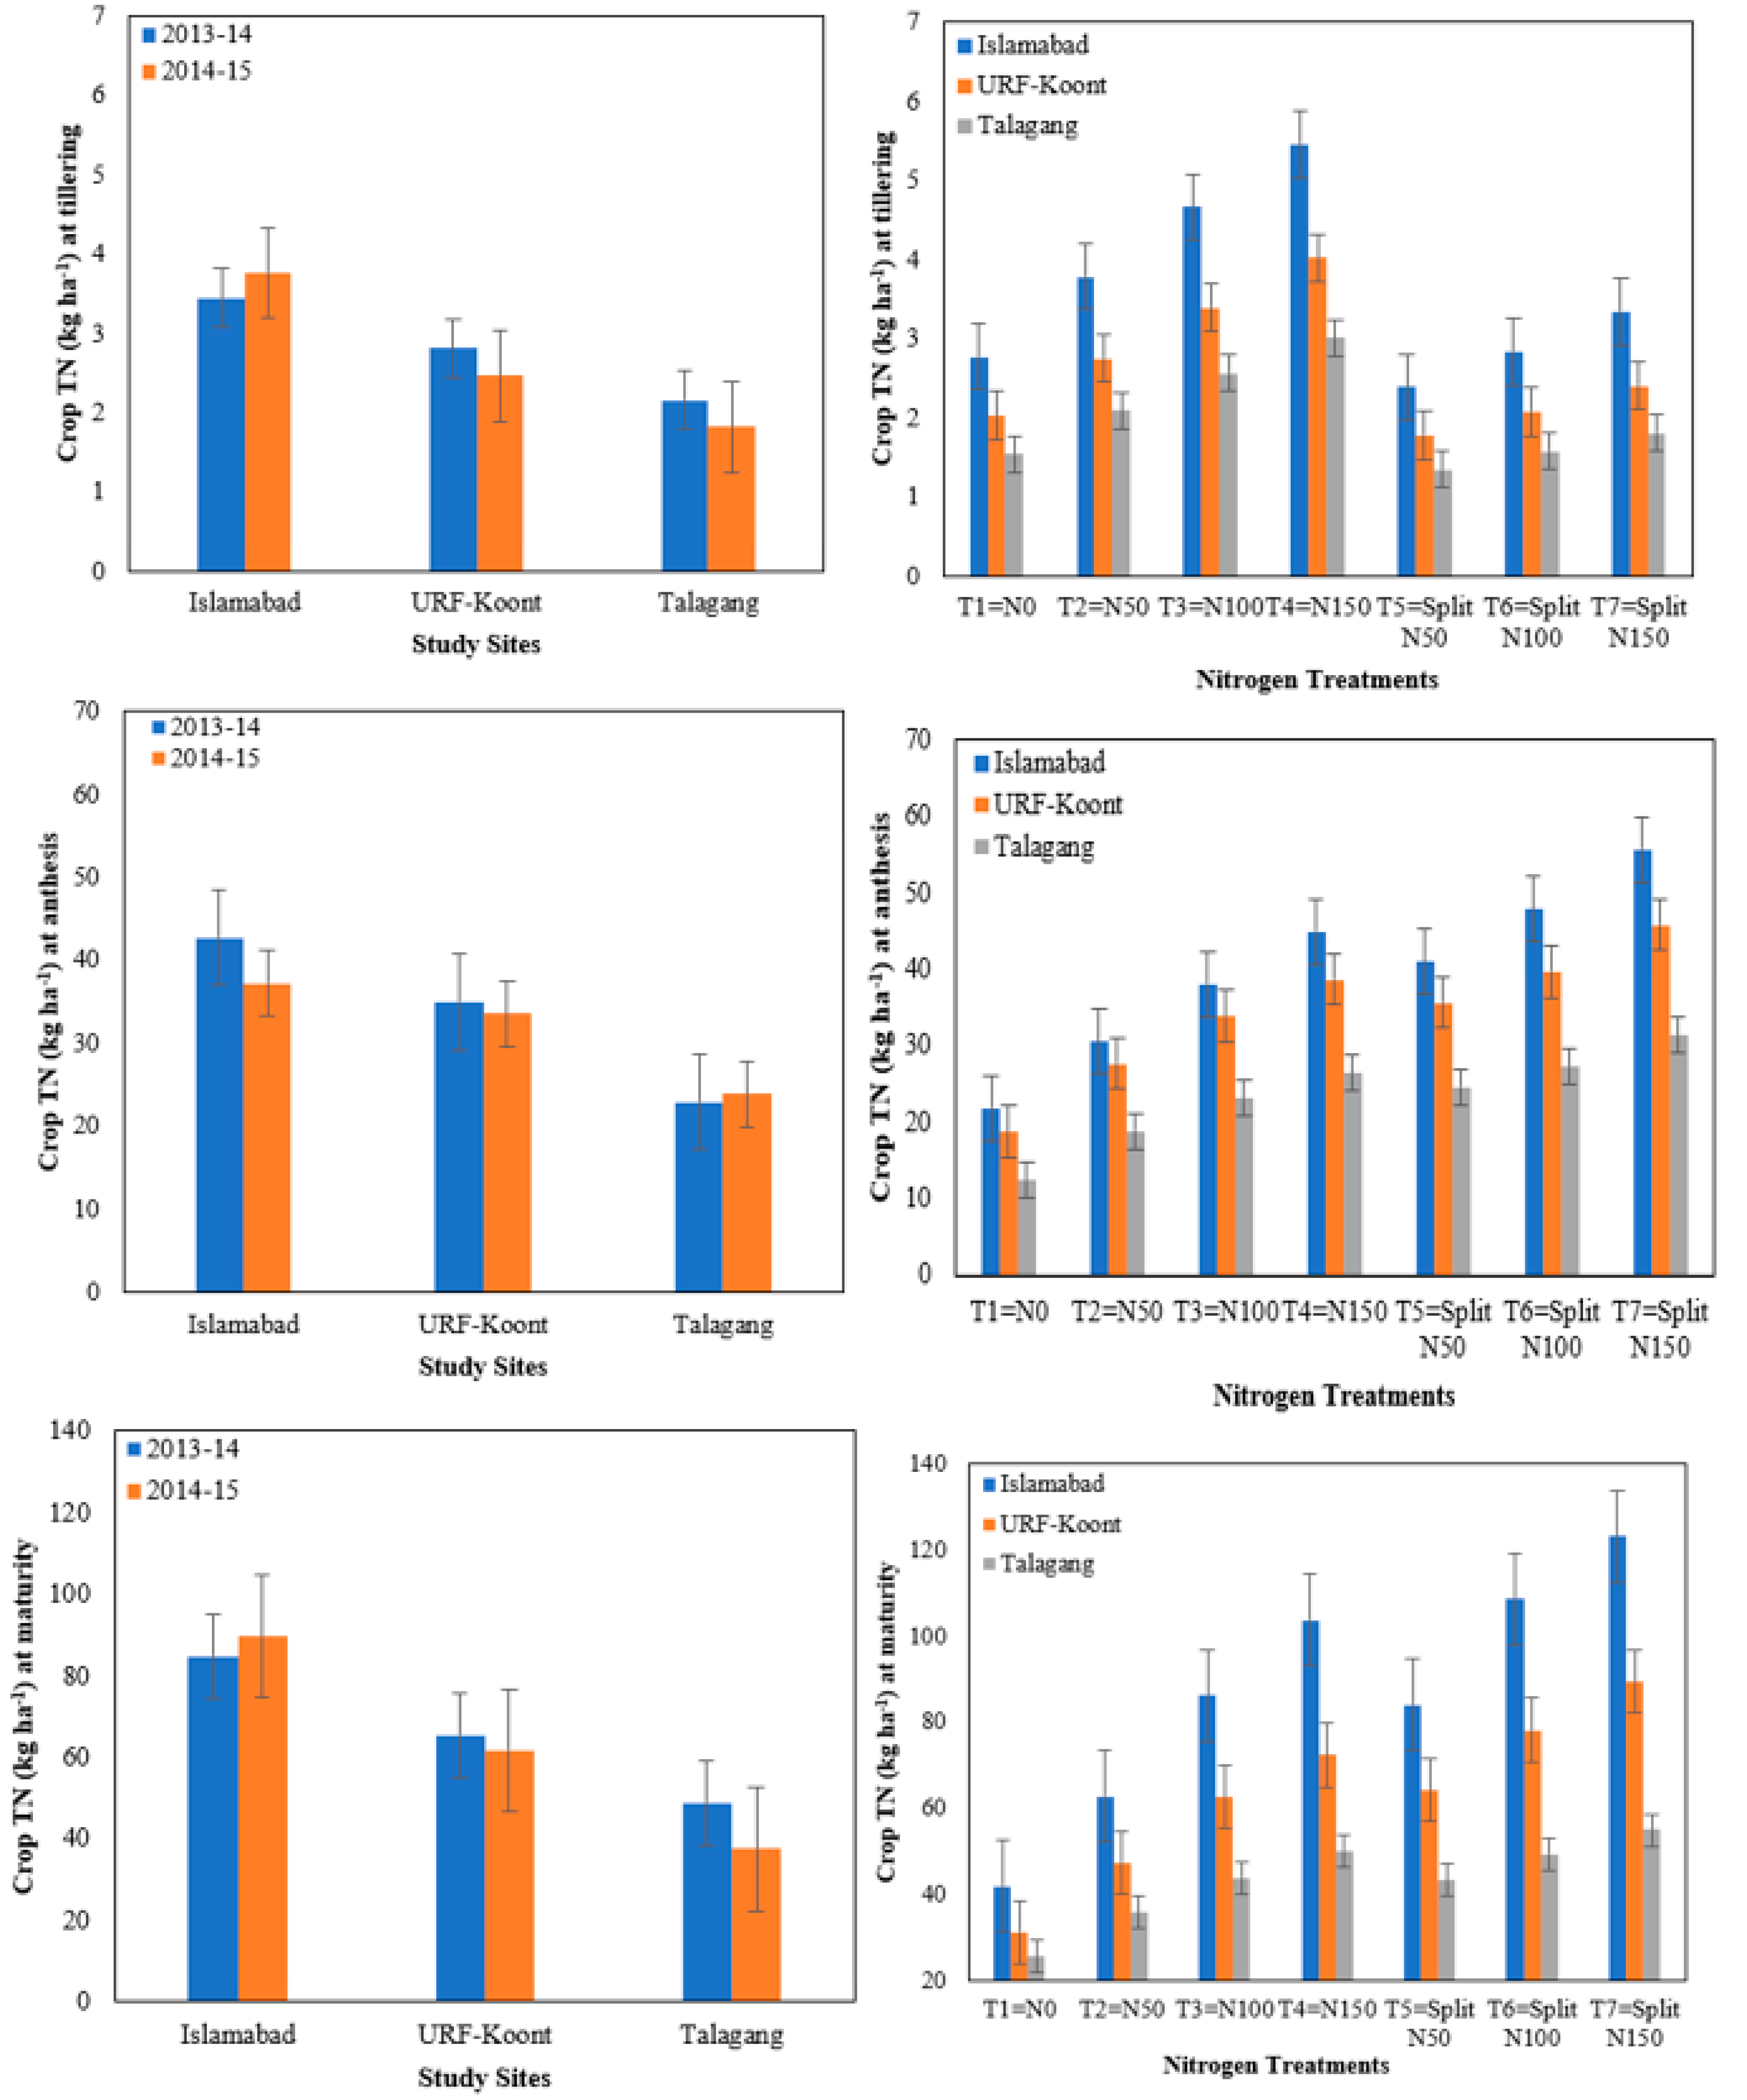
3.2. Crop Total Nitrogen

Significant variation for crop/biomass total nitrogen (TN) was observed during both years (2013–14 and 2014–15) at three locations under different N treatments. Both years differed significantly for crop N at the tillering stage. Maximum TN (2.81 kg ha−1) was observed during 2013–14, while minimum TN (2.68 kg ha−1) was recorded during 2014–15 (Table 4). During 2013–14, 5% higher TN was recorded than 2014–15. At tillering among locations, maximum TN (3.61 kg ha−1) was recorded at Islamabad, while minimum TN (1.99 kg ha−1) was observed at Talagang. There was a 44% variation among the study sites for TN at the tillering stage. The maximum TN (4.16 kg ha−1) was recorded under T4, while minimum TN at tillering was recorded under T5 (1.84 kg ha−1). Under T4, 42% higher TN was registered than T5 at the tillering stage. The interactive effects of years × locations (Y × L) and locations × treatments (L × T) were highly significant, while Y × T and Y × L × T remained non-significant. For interactive effect, Y × L maximum crop TN was accumulated during 2014–15 (3.77 kg ha−1) at Islamabad, while minimum crop TN (1.82 kg ha−1) was recorded during 2014–15 at Talagang (Figure 4). Maximum TN was recorded at Islamabad under T4 (5.46 kg ha−1), while minimum TN at tillering was recorded (1.34 kg ha−1) at Talagang under T5 (Figure 4). Similarly, a significant difference was noted during both years at the anthesis stage for TN. Maximum TN (33.53 kg ha−1) was recorded during 2013–14, while minimum crop TN (31.51 kg ha−1) was observed during 2014–15. During 2013–14, 6% higher N was noted than 2014–15. A significant difference in TN was recorded at three diverse locations. Higher TN (39.93 kg ha−1) was observed at Islamabad, while lower TN (23.39 kg ha−1) was recorded at Talagang. The difference in TN among Islamabad and Talagang was 41%. Total N also differed under different N treatments. Maximum crop TN (44.23 kg ha−1) was recorded under T7, while minimum TN (17.64 kg ha−1) was observed under T1. There was 88% higher TN for T7 compared to T1. The interactive effects Y × L and L × T were highly significant while Y × T and Y × L × T remained non-significant. For interactive effect, L × T maximum crop TN was accumulated during 2013–14 (42.71 kg ha−1) at Islamabad, while minimum crop TN was recorded (22.91 kg ha−1) during 2013–14 at Talagang (Figure 4). For interactive effect, Y × L highest crop TN (55.59 kg ha−1) was recorded during 2013–14 under T7, while the lowest TN (12.39 kg ha−1) was recorded at Talagang under control N treatment (Figure 4).
A significant variation for crop TN was observed during both years (2013–14 and 2014–15) at three varying climatic locations under different N treatments at maturity. Both years differed significantly for crop TN at the maturity stage. Maximum TN (66.42 kg ha−1) was observed during 2013–14, while minimum TN (62.95 kg ha−1) was recorded during 2014–15 (Table 4). During 2013–14, 5% higher TN was recorded than 2014–15. At maturity among locations, maximum TN (87.22 kg ha−1) was recorded at Islamabad, while minimum crop TN (43.22 kg ha−1) was observed at Talagang. There was a 47% variation among study sites for TN at the maturity stage. Meanwhile, maximum TN (89.20 kg ha−1) was recorded under T7, while minimum TN at maturity was recorded under control N treatment (32.91 kg ha−1). Under N treatment T7, 46% higher TN was registered than T1 at the maturity stage. The interactive effects Y × L and L × T were highly significant, while Y × T and Y × L × T remained non-significant. For interactive effect, Y × L maximum crop TN was accumulated during 2014–15 (89.63 kg ha−1) at Islamabad followed by 2013–14 at Islamabad (84.81 kg ha−1), while minimum crop TN (37.53 kg ha−1) was recorded during 2014–15 at Talagang (Figure 4). Maximum TN was recorded at Islamabad under T7 (123.19 kg ha−1), while minimum TN at maturity was recorded (25.55 kg ha−1) at Talagang under T1 (Figure 4).

3.3. Nitrogen Efficiencies

3.3.1. Nitrogen Use Efficiency (kg kg−1)

A significant variation for NUE was observed during both years (2013–14 and 2014–15) at three varying climatic locations under different N treatments. Both years differed significantly for NUE. Maximum NUE (18.35 kg kg−1) was observed during 2013–14, while minimum NUE (16.63 kg kg−1) was recorded during 2014–15 (Table 5). During 2013–14, 9% higher NUE was recorded than 2014–15. Among locations, maximum NUE (22.96 kg kg−1) was recorded at Islamabad, while minimum NUE (11.31 kg kg−1) was observed at Talagang. There was a 51% variation among study sites for NUE. The maximum NUE (21.72 kg kg−1) was recorded under T1, while the minimum NUE was recorded under T7 N treatment (13.395 kg kg−1). Under N treatment T1, 38% higher NUE was registered than T7. The interactive effects viz. Y × L, Y × T, L × T, and Y × L × T remained statistically non-significant for NUE.

3.3.2. Nitrogen Uptake Efficiency (NUpE)

A significant variation for NUpE was observed during both years (2013–14 and 2014–15) at three diverse locations under different N treatments. Both years differed significantly for NUpE. Maximum NUpE (0.41) was observed during 2013–14, while minimum NUpE (0.39) was recorded during 2014–15 (Table 5). During 2013–14, 5% higher NUpE was recorded than 2014–15. Among locations, maximum NUpE (0.53) was recorded at Islamabad, while minimum NUpE (0.27) was observed at Talagang. There was a 49% variation among study sites for NUpE. Meanwhile, maximum NUpE (0.49) was recorded under T5, while minimum NUpE was recorded under T4 N treatment (0.32). Under N treatment T5, 35% higher NUpE was recorded than T4.

3.3.3. Nitrogen Utilization Efficiency (NUtE) (kg kg−1)

A significant variation for (NUtE) was observed during both years (2013–14 and 2014–15) at three varying climatic locations under different N treatments. Both years differed significantly for N utilization efficiency at the maturity stage. Maximum NUtE (44.36 kg kg−1) observed during 2013–14 while minimum NUtE (44.19 kg kg−1) recorded during 2014–15 (Table 5). During 2013–14, 0.3% higher NUtE was recorded than 2014–15. At maturity, among locations, maximum N utilization efficiency (47.09 kg kg−1) was recorded at URF-Koont, while minimum N utilization efficiency (42.2 kg kg−1) was observed at Talagang. There was a 10% variation among study sites for N utilization efficiency at the maturity stage. Similarly, maximum NUtE (53.99 kg kg−1) was recorded under T2, while minimum NUtE at maturity was recorded under T7 (35.16 kg kg−1). Under N treatment T2, 34% higher N utilization efficiency was recorded than T7 at the maturity stage. The interactive effects Y × L, L × T, Y × T, and Y × L × T for NUtE were highly significant (Table 5).

3.4. Agronomic Traits

Results showed that the number of tillers remained non-significant during both years (2013–14 and 2014–15), while a significant difference was observed at the three different sites under different N treatments (Table 6). Similarly, thousand-grain weight (TGW) remained non-significant during both study years. However, it was significantly different at sites and under different N treatments. Under N treatment T6, 32% higher TGW was recorded than T1. The interactive effects Y × L was significant while L × T, Y × T, and Y × L × T were non-significant. Among locations, maximum TGW (34.3 g) was recorded at Islamabad, while minimum TGW (24.7 g) was observed at Talagang. There was a 28% variation among study sites for TGW. Meanwhile, maximum TGW (34.5 g) was recorded under the treatment T6, while the minimum TGW was recorded under control treatment. Significant variation for the grain yield was observed during both years (2013–14 and 2014–15) at three varying locations under different N treatments. The highest biological yield (9380.9 kg ha−1) was recorded for the first year (2013–14) while it was lowest (8704.7 kg ha−1) for the second year (2014–15). Among locations, biological yield remained maximum at Islamabad, while the addition of N resulted in the maximum biomass under split application of N, i.e., T6. Maximum grain yield (3001.9 kg ha−1) was observed during 2013–14, while minimum grain yield (2611.40 kg ha−1) was observed during 2014–15 (Table 6). During 2013–14, a 10% higher grain yield was recorded than 2014–15. Among locations, the highest grain yield (3957.5 kg ha−1) was recorded at Islamabad, while the lowest grain yield (1760.6 kg ha−1) was detected at Talagang. There was a 52% variation among the study sites for the grain yield. Meanwhile, the highest grain yield (3517.2 kg ha−1) was recorded under T6, while the lowest grain yield was recorded under T1 N treatment (1737.8 kg ha−1). For N treatment T6, a 44% higher grain yield was recorded than T1. The interactive effects of L × T were highly significant, while Y × L, Y × T, and Y × L × T were non-significant. A considerable difference for the harvest index was observed during both years (2013–14 and 2014–15). During 2013–14, a 6% higher harvest index was recorded than 2014–15. Among locations, the maximum harvest index (0.35) was recorded at Islamabad, while the minimum harvest index (0.25) was observed at Talagang. There was a 29% variation among study sites for the harvest index. Meanwhile, the maximum harvest index (0.32) was recorded under T2, T3, T4, and T7, while the minimum harvest index was recorded under T1 and T5 N treatment (0.29).

3.5. Relationship of Physiological Traits with Grain Yield

Linear regression analysis was performed to see the relationship between grain yield and physiological characteristics combined over the years, locations, and N treatments. The results showed that physiological traits (e.g., gs, Rs, An, E, and SPAD chlorophyll contents) have a significant relationship with grain yield of wheat. The regression equation for grain yield with stomatal conductance showed a positive trend with R2 = 0.98. The equation obtained for grain yield and gs is presented below.
G r a i n   y i e l d = 1476.28 + 6518.68 g s
The inverse relationship between grain yield and stomatal resistance was observed with R2 = 0.98. The equation obtained was
G r a i n   y i e l d = 5353.31 3591.18 R s .
A positive, strong association was obtained for net photosynthesis and grain yield (R2 = 0.99). The regression equation for this relationship is
G r a i n   y i e l d = 5614.79 + 433.27 A n .
Transpiration rate outcomes revealed that with the increase in transpiration rate, grain yield of wheat crop increases significantly (R2 = 0.98). The equation obtained for this trend is
G r a i n   y i e l d = 3490.54 + 833.24 E .
A similar pattern was observed for intercellular carbon dioxide concentration and SPAD chlorophyll contents with R2 values of 0.98 and 0.97, respectively. The model equations were
G r a i n   y i e l d = 6828.66 + 32.06 C i
G r a i n   y i e l d = 1501.84 + 74.45   SPAD c h l o r p h y l l   c o n t e n t s .

4. Discussion

Climate extremes in the form of rainfall variability, drought, and rise in temperature are the primary abiotic stresses affecting wheat physiological traits, crop total N, N efficiencies, and agronomic characteristics. Our results showed that the physiology of wheat crop decreases under stress (water, temperature, or nutrient); however, this stress could be managed by the application of N [8]. Water stress resulted in a significant decrease in the net photosynthetic rate, crop biomass and growth rate but the decrease was less in N primed treatment. This was because N treatment resulted in enhanced root growth and higher leaf water content. Stomatal conductance (gs) could be the critical determinant of crop yield and productivity as it balances CO2 uptake and water loss. It impacts on the total rate of photosynthesis and water use during the crop growing period. Ahmed et al. [45] concluded that crop physiological traits have a strong association with prevailing climatic conditions. Higher temperatures and lower availability of water resulted in a decline in physiological characteristics like gs, An, and E but an increase in stomatal resistance. However, they suggested that a change in the sowing date could be an option to mitigate the effect of climatic variables on crop physiology, while our findings confirm that the addition of N as a split application could build resilience in crop physiological traits. Split application at critical growth stages of the crop improves uptake efficiency and minimizes N loss. Since N helps in the process of photosynthesis, its addition could thus be beneficial for the crop. Higher photosynthetic rates lead to higher biomass production and grain yield. Yu et al. [46] reported that photosynthesis and transpiration are interdependent: the improvements of one are linked with the development of others. Higher values for both photosynthesis and transpiration rate under split application of N demonstrates that N helps to maintain water contents in the leaf, thus resulting iin the optimization of An, E, gs, and Ci. Kimball et al. [47] reported reduced stomatal conductance (33–50%) and transpiration rate (20–27%) with the change in the microclimate of the crop. Our results of N addition and its relationship with photosynthetic capacity was at par with the earlier findings in which they concluded that N addition could help to replenish the negative effect of stress by building resilience in the physiological traits of the crop [14,21,22,23]. Like the present work, an increased net photosynthetic rate (An) was observed due to the application of N [34]. Gyuga et al. [48] reported that N greatly influences photosynthetic processes, and deficiency of N leads to the declined photosynthesis. Similarly, Abid et al. [49] in their findings concluded that management of N nutrition could build drought tolerance in wheat by maintaining higher photosynthetic activities and antioxidative defense system during vegetative growth periods. A primary driving force for dry matter production in photosynthesis; thus, its management through the optimization of N could help to improve dry matter production in the plant. A positive correlation between leaves photosynthetic capacity and N contents have been shown in earlier work [14,21,22,23]. Application of N in wheat plants resulted in the improved properties of photosynthetic pigments and increased net photosynthetic rate (An) [24,25]. Similarly, the fitness of plants could be determined by indicators like chlorophyll content and photosynthetic rate. Thus, moderate stress (drought or nutrients) could decrease photosynthesis, mainly due to stomatal limitations [50,51,52]. Hence, we suggest here that the application of N in split dosage be used tackle this limitation. Variability in SPAD chlorophyll content due to temperature and water stress were reported in earlier work, and the use of suitable genotypes and optimum sowing time to provide suitable environmental conditions for the crop was suggested [53]. CO2 is an important ecological factor for plant matter, being directly involved in photosynthesis; however, its optimum fixation is linked with stomatal traits and chlorophyll contents in the leaves [54]. Proline is a vital stress defender, and in our findings, it has been revealed that N addition results in the increased N compound, i.e., proline (Table 3). Improved tolerance in plants was observed due to the accumulation of proline under water and temperature stress [55,56,57,58,59], which resulted in improved crop physiological processes. The role of antioxidants like proline in plant drought tolerance was well-reviewed by Laxa et al. [60]. The higher survival rate of plants under stress has a strong link with the accumulation of N-containing compounds, and their concentration is increased due to the addition of N, as reported in our studies [36,37].
Lu et al. [29] reported that reduced N supply could lead to severe plant growth and lower grain yield. The addition of N could help to increase total N in a plant, as elaborated in our findings (Table 2). A similar conclusion was made by Ladha et al. [13] in their work, where they emphasized the management of N to increase its uptake efficiency. Nitrogen use efficiency (NUE) and agronomic efficiency (AEN) were evaluated by Srivastava et al. [61] under different N rates (0 (N0), 75 (N75), 100 (N100) and 125 (N125) kg ha−1 and 0 (N0), 60 (N60), 80 (N80) and 100 (N100) kg ha−1)) and sowing scenarios in maize. They concluded that the under rainfed conditions, an N rate from N0 to N100 results in decreased NUE and AEN. Today, wheat cultivars require a higher input of N, but this results in a risk of environmental pollution. Therefore, the management of N is very important. Guarda et al. [62] investigated the impacts of different N rates (N0, N80, N160, kg ha−1) on wheat yield quality and NUE. The results showed that the management of N resulted in improved plant N uptake, NUE, and grain quality. Nitrogen uptake efficiency is the measure of how much N is taken up by the wheat crop. Raun and Johnson [63] reported that to increase NUE, its uptake must be enhanced. Raun et al. [64] concluded that N fertilization helps to improve NUE in wheat. The results of the current study showed that NUpE was affected by N treatments during both the years at three study sites. Rahimizadeh et al. [44] found decreased N uptake efficiency under increased N rates, which might be due to more N losses.
Agronomic traits showed significant changes in the present findings for all treatments, and it has been reported that dry matter and grain yield of the plants could be improved by N fertilization [64]. N has shown a positive influence on the growth and development of crop under water stress by sustaining metabolic activities. However, N fertilization should be matched with the crop demand as, in our case, higher agronomic traits were observed for split treatments compared to a full application at the time of sowing. Generally, farmers apply N at the time of sowing or at the earlier growth stages of the crop, which results in the maximum loss of N and lowered crop dry matter and yield. Thus, an integrated soil-crop system management strategy could help to improve grain yield and NUE as proposed by Meng et al. [65]. Hawkesford et al. [66] reported that 33% of applied N fertilizer is recovered in the harvested grain. Thus, 67% of N is lost, which could be a major source of pollutants and should be a major target for crop improvement. Therefore, agronomic management and crop breeding traits could help to improve NUE. Furthermore, optimizing the N application rate could be a good option to minimize N losses and increase crop yield [67]. The relationship of grain yield with crop physiological traits showed that stomatal conductance could be the major determinant of the grain yield. Since global temperature and frequent occurrence of drought could maximize N losses, new avenues for improving crop productivity must thus be exploited [68,69,70,71,72].

5. Conclusions

Crop physiological traits, total N, and N efficiencies have a significant strong relationship with crop dry matter and grain yield. Since crop yield is the most commonly used indicator, it needs to be improved by considering the interaction of N addition with crop physiology, such as stomatal conductance, net photosynthetic rate, and transpiration rate. The optimum N application rate and its timings could help to harvest real benefits of N as in our findings split dosage resulted in optimum physiological traits, i.e., gs, An and E. Improvement in stomatal conductance through the management of N under stress could be one of the key determinants of crop yield as it balances the crop CO2 uptake and water loss. Similarly, a split application of N resulted in higher N efficiencies, i.e., NUE, nitrogen uptake efficiency, and nitrogen utilization efficiency at all sites for both years. Thus, the idea of Hawkesford et al. [66] to recover maximum applied N fertilizer is possible through its split application during different stages of the crop. Furthermore, a split application of N resulted in the maximum agronomic traits, and a significant combined strong relationship was obtained between grain yield and crop physiological parameters. The results showed that T6 = split N100 could be used to get optimal returns from N. However, in the future, we will be further using the quadratic plateau model approach to build the relationship between N methods and rates. This will ultimately help us to optimize crop physiological traits and grain yield under different sets of N scenarios at these variable field sites.

Author Contributions

Experiments, field data collection, and analysis were performed by U.Q. and were part of her Ph.D. thesis under the supervision of M.A. (Mukhtar Ahmed) as a major supervisor, while guided and helped by the F.-u.-H. and M.A. (Muhammad Akmal) Statistical analysis was performed by U.Q. and M.A. (Mukhtar Ahmed). The manuscript was written by U.Q. and M.A. (Mukhtar Ahmed).

Funding

This research received no external funding.

Acknowledgments

The present work is part of the Ph.D. research work of the first author, and she was supported by the Higher Education Commission (HEC) Pakistan to visit Washington State University (WSU), Pullman USA under the International Research Support Initiative Programme (IRSIP).

Conflicts of Interest

The authors declare no conflicts of interest.

References

  1. Huang, J.; Yu, H.; Guan, X.; Wang, G.; Guo, R. Accelerated dryland expansion under climate change. Nat. Clim. Chang. 2016, 6, 166–171. [Google Scholar] [CrossRef]
  2. Drake, B.G.; Gonzàlez-Meler, M.A.; Long, S.P. More efficient plants: A consequence of rising atmospheric CO2? Ann. Rev. Plant Physiol. Plant Mol. Biol. 1997, 48, 609–639. [Google Scholar] [CrossRef] [PubMed]
  3. Zhang, X.C.; Yu, X.F.; Ma, Y.F. Effect of nitrogen application and elevated CO2 on photosynthetic gas exchange and electron transport in wheat leaves. Photosynthetica 2013, 51, 593–602. [Google Scholar] [CrossRef]
  4. Ainsworth, E.A.; Long, S. What have we learned from 15 years of free-air CO2 enrichment (FACE)? A meta-analytic review of the responses of photosynthesis, canopy properties and plant production to rising CO2. New Phytol. 2005, 165, 351–372. [Google Scholar] [CrossRef] [PubMed]
  5. Isopp, H.; Frehner, M.; Long, S.P.; Nösberger, J. Sucrose-phosphate synthase responds differently to source–sink relations and to photosynthetic rates: Lolium perenne L. growing at elevated pCO2 in the field. Plant Cell Environ. 2000, 23, 597–607. [Google Scholar] [CrossRef]
  6. Hymus, G.J.; Baker, N.R.; Long, S.P. Growth in elevated CO2 can both decrease and increase photochemistry and photoinhibition of photosynthesis in a predictable manner. Dactylis glomerata grown in two levels of nitrogen nutrition. Plant Physiol. 2001, 127, 1204–1211. [Google Scholar]
  7. Warren, C.R. The photosynthetic limitation posed by internal conductance to CO2 movement is increased by nutrient supply. J. Exp. Bot. 2004, 55, 2313–2321. [Google Scholar] [CrossRef]
  8. Gao, J.; Luo, Q.; Sun, C.; Hu, H.; Wang, F.; Tian, Z.; Jiang, D.; Cao, W.; Dai, T. Low Nitrogen Priming Enhances Photosynthesis Adaptation to Water-Deficit Stress in Winter Wheat (Triticum aestivum L.) Seedlings. Front. Plant Sci. 2019, 10, 818. [Google Scholar] [CrossRef]
  9. Chaves, M.M. Effects of Water Deficits on Carbon Assimilation. J. Exp. Bot. 1991, 42, 1–16. [Google Scholar] [CrossRef]
  10. Yordanov, I.; Velikova, V.; Tsonev, T. Plant Responses to Drought, Acclimation, and Stress Tolerance. Photosynthetica 2000, 38, 171–186. [Google Scholar] [CrossRef]
  11. Xin, Y.; Tao, F. Optimizing genotype-environment-management interactions to enhance productivity and eco-efficiency for wheat-maize rotation in the North China Plain. Sci. Total Environ. 2019, 654, 480–492. [Google Scholar] [CrossRef] [PubMed]
  12. Li, Y.; Gao, Y.; Xu, X.; Shen, Q.; Guo, S. Light-saturated photosynthetic rate in high-nitrogen rice (Oryza sativa L.) leaves is related to chloroplastic CO2 concentration. J. Exp. Bot. 2009, 60, 2351–2360. [Google Scholar] [CrossRef] [PubMed]
  13. Ladha, J.K.; Pathak, H.; Krupnik, T.J.; Six, J.; van Kessel, C. Efficiency of Fertilizer Nitrogen in Cereal Production: Retrospects and Prospects. In Advances in Agronomy; Academic Press: Cambridge, MA, USA, 2005; Volume 87, pp. 85–156. [Google Scholar]
  14. Jin, X.; Yang, G.; Tan, C.; Zhao, C. Effects of nitrogen stress on the photosynthetic CO2 assimilation, chlorophyll fluorescence, and sugar-nitrogen ratio in corn. Sci. Rep. 2015, 5, 9311. [Google Scholar] [CrossRef]
  15. Wong, S.-C.; Cowan, I.R.; Farquhar, G.D. Leaf Conductance in Relation to Rate of CO2 Assimilation I. Influence of Nitrogen Nutrition, Phosphorus Nutrition, Photon Flux Density, and Ambient Partial Pressure of CO2 during Ontogeny. Plant Physiol. 1985, 78, 821–825. [Google Scholar] [CrossRef] [PubMed]
  16. Terashima, I.; Evans, J.R. Effects of light and nitrogen nutrition on the organization of the photosynthetic apparatus in spinach. Plant Cell Physiol. 1988, 29, 143–155. [Google Scholar]
  17. Rascher, U.; Liebig, M.; Lüttge, U. Evaluation of instant light-response curves of chlorophyll fluorescence parameters obtained with a portable chlorophyll fluorometer on site in the field. Plant Cell Environ. 2000, 23, 1397–1405. [Google Scholar] [CrossRef]
  18. Lawlor, D.; Boyle, F.; Young, A.; Keys, A.; Kendall, A. Nitrate nutrition and temperature effects on wheat: Photosynthesis and photorespiration of leaves. J. Exp. Bot. 1987, 38, 393–408. [Google Scholar] [CrossRef]
  19. Sugiharto, B.; Miyata, K.; Nakamoto, H.; Sasakawa, H.; Sugiyama, T. Regulation of Expression of Carbon-Assimilating Enzymes by Nitrogen in Maize Leaf. Plant Physiol. 1990, 92, 963–969. [Google Scholar] [CrossRef]
  20. Sage, R.F.; Pearcy, R.W. The Nitrogen Use Efficiency of C3 and C4 Plants II. Leaf Nitrogen Effects on the Gas Exchange Characteristics of Chenopodium album (L.) and Amaranthus retroflexus (L.). Plant Physiol. 1987, 84, 959–963. [Google Scholar] [CrossRef]
  21. Ciompi, S.; Gentili, E.; Guidi, L.; Soldatini, G.F. The effect of nitrogen deficiency on leaf gas exchange and chlorophyll fluorescence parameters in sunflower. Plant Sci. 1996, 118, 177–184. [Google Scholar] [CrossRef]
  22. Khamis, S.; Lamaze, T.; Lemoine, Y.; Foyer, C. Adaptation of the Photosynthetic Apparatus in Maize Leaves as a Result of Nitrogen Limitation: Relationships between electron transport and carbon assimilation. Plant Physiol. 1990, 94, 1436–1443. [Google Scholar] [CrossRef] [PubMed]
  23. Dai, T.; Cao, W.; Jing, Q. Effects of nitrogen form on nitrogen absorption and photosynthesis of different wheat genotypes. Chin. J. Appl. Ecol. 2001, 12, 849–852. [Google Scholar]
  24. Fan, X.; Jiang, D.; Dai, T.; Jing, Q.; Cao, W. Effects of nitrogen supply on flag leaf photosynthesis and grain starch accumulation of wheat from its anthesis to maturity under drought or waterlogging. Ying Yong Sheng Tai Xue Bao/J. Appl. Ecol. 2005, 16, 1883–1888. [Google Scholar]
  25. Nunes, M.A.; Ramalho, J.C.; Dias, M.A. Effect of nitrogen supply on the photosynthetic performance of leaves from coffee plants exposed to bright light. J. Exp. Bot. 1993, 44, 893–899. [Google Scholar] [CrossRef]
  26. Verhoeven, A.S.; Demmig-Adams, B.; Adams, W.W., III. Enhanced Employment of the Xanthophyll Cycle and Thermal Energy Dissipation in Spinach Exposed to High Light and N Stress. Plant Physiol. 1997, 113, 817–824. [Google Scholar] [CrossRef]
  27. Schreiber, U.; Bilger, W.; Neubauer, C. Ecophysiology of photosynthesis. Ecol. Stud. 1994, 100, 49–70. [Google Scholar]
  28. Bungard, R.A.; McNeil, D.; Morton, J.D. Effects of nitrogen on the photosynthetic apparatus of Clematis vitalba grown at several irradiances. Funct. Plant Biol. 1997, 24, 205–214. [Google Scholar] [CrossRef]
  29. Lu, C.; Zhang, J. Photosynthetic CO2 assimilation, chlorophyll fluorescence and photoinhibition as affected by nitrogen deficiency in maize plants. Plant Sci. 2000, 151, 135–143. [Google Scholar] [CrossRef]
  30. Zhang, L.; Shangguan, Z.; Mao, M.; Yu, G. Effects of long-term application of nitrogen fertilizer on leaf chlorophyll fluorescence of upland winter wheat. Ying Yong Sheng Tai Xue Bao/J. Appl. Ecol. 2003, 14, 695–698. [Google Scholar]
  31. Cai, R.-G.; Zhang, M.; Yin, Y.-P.; Ping, W.; Zhang, T.B.; Feng, G.; Dai, Z.-M.; Liang, T.-B.; Wu, Y.-H.; Wang, Z.-L. Photosynthetic characteristics and antioxidative metabolism of flag leaves in responses to nitrogen application during grain filling of field-grown wheat. Agric. Sci. China 2008, 7, 157–167. [Google Scholar] [CrossRef]
  32. Filella, I.; Serrano, L.; Serra, J.; Penuelas, J. Evaluating wheat nitrogen status with canopy reflectance indices and discriminant analysis. Crop Sci. 1995, 35, 1400–1405. [Google Scholar] [CrossRef]
  33. Moran, J.A.; Mitchell, A.K.; Goodmanson, G.; Stockburger, K.A. Differentiation among effects of nitrogen fertilization treatments on conifer seedlings by foliar reflectance: A comparison of methods. Tree Physiol. 2000, 20, 1113–1120. [Google Scholar] [CrossRef] [PubMed]
  34. Shrestha, S.; Brueck, H.; Asch, F. Chlorophyll index, photochemical reflectance index and chlorophyll fluorescence measurements of rice leaves supplied with different N levels. J. Photochem. Photobiol. B Biol. 2012, 113, 7–13. [Google Scholar] [CrossRef]
  35. Zhong, S.; Xu, Y.; Meng, B.; Loik, M.E.; Ma, J.-Y.; Sun, W. Nitrogen Addition Increases the Sensitivity of Photosynthesis to Drought and Re-watering Differentially in C3 Versus C4 Grass Species. Front. Plant Sci. 2019, 10, 815. [Google Scholar] [CrossRef] [PubMed]
  36. Sánchez, E.; Garcia, P.C.; López-Lefebre, L.R.; Rivero, R.M.; Ruiz, J.M.; Romero, L. Proline metabolism in response to nitrogen deficiency in French Bean plants (Phaseolus vulgaris L. cv Strike). Plant Growth Regul. 2002, 36, 261–265. [Google Scholar] [CrossRef]
  37. Rare, E. Stress physiology: The functional significance of the accumulation of nitrogen-containing compounds. J. Hortic. Sci 1990, 65, 231–243. [Google Scholar] [CrossRef]
  38. Burns, I.G. Nitrogen supply, growth and development. Acta Hortic. 1996, 428, 21–30. [Google Scholar] [CrossRef]
  39. Makino, A. Photosynthesis, Grain Yield, and Nitrogen Utilization in Rice and Wheat. Plant Physiol. 2011, 155, 125–129. [Google Scholar] [CrossRef] [Green Version]
  40. Van Ogtrop, F.; Ahmad, M.; Moeller, C. Principal components of sea surface temperatures as predictors of seasonal rainfall in rainfed wheat growing areas of Pakistan. Meteorol. Appl. 2014, 21, 431–443. [Google Scholar] [CrossRef]
  41. Long, S.P.; Bernacchi, C.J. Gas exchange measurements, what can they tell us about the underlying limitations to photosynthesis? Procedures and sources of error. J. Exp. Bot. 2003, 54, 2393–2401. [Google Scholar] [CrossRef] [Green Version]
  42. Bates, L.S.; Waldren, R.P.; Teare, I.D. Rapid determination of free proline for water-stress studies. Plant Soil 1973, 39, 205–207. [Google Scholar] [CrossRef]
  43. Bremner, J.M.; Breitenbeck, G.A. A simple method for determination of ammonium in semimicro-Kjeldahl analysis of soils and plant materials using a block digester. Commun. Soil Sci. Plant Anal. 1983, 14, 905–913. [Google Scholar] [CrossRef]
  44. Rahimizadeh, M.; Kashani, A.; Zare-Feizabadi, A.; Koocheki, A.R.; Nassiri-Mahallati, M. Nitrogen use efficiency of wheat as affected by preceding crop, application rate of nitrogen and crop residues. Aust. J. Crop Sci. 2010, 4, 363–368. [Google Scholar]
  45. Ahmed, M.; Hassan, F.-U.; Aslam, M.; Akram, M.N.; Aslam, M.A. Photosynthesis of spring wheat (Triticum aestivum) in rainfed ecology of Pakistan. Afr. J. Biotechnol. 2010, 9, 7495–7503. [Google Scholar]
  46. Yu, O.; Goudriaan, J.; Wang, T.-D. Modelling Diurnal Courses of Photosynthesis and Transpiration of Leaves on the Basis of Stomatal and Non-Stomatal Responses, Including Photoinhibition. Photosynthetica 2001, 39, 43–51. [Google Scholar] [CrossRef]
  47. Kimball, B.A.; Kobayashi, K.; Bindi, M. Responses of Agricultural Crops to Free-Air CO2 Enrichment. In Advances in Agronomy; Sparks, D.L., Ed.; Academic Press: Cambridge, MA, USA, 2002; Volume 77, pp. 293–368. [Google Scholar]
  48. Gyuga, P.; Demagante, A.L.; Paulsen, G.M. Photosynthesis and grain growth of wheat under extreme nitrogen nutrition regimes during maturation. J. Plant Nutr. 2002, 25, 1281–1290. [Google Scholar] [CrossRef]
  49. Abid, M.; Tian, Z.; Ata-Ul-Karim, S.T.; Cui, Y.; Liu, Y.; Zahoor, R.; Jiang, D.; Dai, T. Nitrogen Nutrition Improves the Potential of Wheat (Triticum aestivum L.) to Alleviate the Effects of Drought Stress during Vegetative Growth Periods. Front. Plant Sci. 2016, 7, 981. [Google Scholar] [CrossRef] [Green Version]
  50. Zlatev, Z.; Lidon, F.C. An overview on drought induced changes in plant growth, water relations and photosynthesis. Emir. J. Food Agric. 2012, 24, 57–72. [Google Scholar]
  51. Maxwell, K.; Johnson, G.N. Chlorophyll fluorescence—A practical guide. J. Exp. Bot. 2000, 51, 659–668. [Google Scholar] [CrossRef]
  52. Grassi, G.; Magnani, F. Stomatal, mesophyll conductance and biochemical limitations to photosynthesis as affected by drought and leaf ontogeny in ash and oak trees. Plant Cell Environ. 2005, 28, 834–849. [Google Scholar] [CrossRef]
  53. Ahmed, M.; ul Hassan, F. Response of Spring Wheat (Triticum aestivum L.) Quality Traits and Yield to Sowing Date. PLoS ONE 2015, 10, e0126097. [Google Scholar] [CrossRef] [PubMed]
  54. Boretti, A.; Florentine, S. Atmospheric CO2 Concentration and Other Limiting Factors in the Growth of C3 and C4 Plants. Plants 2019, 8, 92. [Google Scholar] [CrossRef] [PubMed] [Green Version]
  55. Ahmed, M.; Hassan, F.U.; Qadir, G.; Shaheen, F.A.; Aslam, M.A. Response of proline accumulation in bread wheat (Triticum aestivum L.) under rainfed conditions. J. Agric. Meteorol. 2017. [Google Scholar] [CrossRef] [Green Version]
  56. Hayat, S.; Hayat, Q.; Alyemeni, M.N.; Wani, A.S.; Pichtel, J.; Ahmad, A. Role of proline under changing environments: A review. Plant Signal. Behav. 2012, 7, 1456–1466. [Google Scholar] [CrossRef] [PubMed] [Green Version]
  57. Ben Rejeb, K.; Abdelly, C.; Savouré, A. How reactive oxygen species and proline face stress together. Plant Physiol. Biochem. 2014, 80, 278–284. [Google Scholar] [CrossRef] [PubMed]
  58. Filippou, P.; Bouchagier, P.; Skotti, E.; Fotopoulos, V. Proline and reactive oxygen/nitrogen species metabolism is involved in the tolerant response of the invasive plant species Ailanthus altissima to drought and salinity. Environ. Exp. Bot. 2014, 97, 1–10. [Google Scholar] [CrossRef]
  59. Liang, X.; Zhang, L.; Natarajan, S.K.; Becker, D.F. Proline mechanisms of stress survival. Antioxid. Redox Signal. 2013, 19, 998–1011. [Google Scholar] [CrossRef] [Green Version]
  60. Laxa, M.; Liebthal, M.; Telman, W.; Chibani, K.; Dietz, K.-J. The Role of the Plant Antioxidant System in Drought Tolerance. Antioxidants 2019, 8, 94. [Google Scholar] [CrossRef] [Green Version]
  61. Srivastava, R.K.; Panda, R.K.; Chakraborty, A.; Halder, D. Enhancing grain yield, biomass and nitrogen use efficiency of maize by varying sowing dates and nitrogen rate under rainfed and irrigated conditions. Field Crops Res. 2018, 221, 339–349. [Google Scholar] [CrossRef]
  62. Guarda, G.; Padovan, S.; Delogu, G. Grain yield, nitrogen-use efficiency and baking quality of old and modern Italian bread-wheat cultivars grown at different nitrogen levels. Eur. J. Agron. 2004, 21, 181–192. [Google Scholar] [CrossRef]
  63. Raun, W.R.; Johnson, G.V. Improving nitrogen use efficiency for cereal production. Agron. J. 1999, 91, 357–363. [Google Scholar] [CrossRef] [Green Version]
  64. Raun, W.R.; Solie, J.B.; Johnson, G.V.; Stone, M.L.; Mullen, R.W.; Freeman, K.W.; Thomason, W.E.; Lukina, E.V. Improving nitrogen use efficiency in cereal grain production with optical sensing and variable rate application. Agron. J. 2002, 94, 815–820. [Google Scholar] [CrossRef] [Green Version]
  65. Meng, Q.; Yue, S.; Hou, P.; Cui, Z.; Chen, X. Improving Yield and Nitrogen Use Efficiency Simultaneously for Maize and Wheat in China: A Review. Pedosphere 2016, 26, 137–147. [Google Scholar] [CrossRef]
  66. Hawkesford, M.J.; Griffiths, S. Exploiting genetic variation in nitrogen use efficiency for cereal crop improvement. Curr. Opin. Plant Biol. 2019, 49, 35–42. [Google Scholar] [CrossRef] [PubMed]
  67. Zhang, Y.; Wang, H.; Lei, Q.; Luo, J.; Lindsey, S.; Zhang, J.; Zhai, L.; Wu, S.; Zhang, J.; Liu, X.; et al. Optimizing the nitrogen application rate for maize and wheat based on yield and environment on the Northern China Plain. Sci. Total Environ. 2018, 618, 1173–1183. [Google Scholar] [CrossRef]
  68. Faralli, M.; Matthews, J.; Lawson, T. Exploiting natural variation and genetic manipulation of stomatal conductance for crop improvement. Curr. Opin. Plant Biol. 2019, 49, 1–7. [Google Scholar] [CrossRef]
  69. Ahmed, M.; Aslam, M.A.; Hassan, F.; Hayat, R.; Ahmad, S. Biochemical, physiological and agronomic response of wheat to changing climate of reinfed areas of pakistan. Pak. J. Bot. 2018, 51, 535–551. [Google Scholar]
  70. Saud, S.; Fahad, S.; Yajun, C.; Ihsan, M.Z.; Hammad, H.M.; Nasim, W.; Amanullah, Jr.; Arif, M.; Alharby, H. Effects of Nitrogen Supply on Water Stress and Recovery Mechanisms in Kentucky Bluegrass Plants. Front. Plant Sci. 2017, 8, 983. [Google Scholar] [CrossRef] [Green Version]
  71. Ahmed, M.; Hassan, F.-U. Cumulative effect of temperature and solar radiation on wheat yield. Notulae Botanicae Horti Agrobotanici Cluj-Napoca 2011, 39, 146–152. [Google Scholar] [CrossRef] [Green Version]
  72. Asseng, S.; Martre, P.; Maiorano, A.; Rötter, R.P.; O’Leary, G.J.; Fitzgerald, G.J.; Girousse, C.; Motzo, R.; Giunta, F.; Babar, M.A.; et al. Climate change impact and adaptation for wheat protein. Glob. Chang. Biol. 2019, 25, 155–173. [Google Scholar] [CrossRef] [Green Version]
Figure 1. Climatic variables (temperature (Tmax and Tmin) and rainfall) during wheat crop growing season for two years (a; 2013–14 and b; 2014–15) at Islamabad (DOY = days of year).
Sustainability 11 06486 g001
Figure 2. Climatic variables (temperature (Tmax and Tmin) and rainfall) during wheat crop growing season for two years (a; 2013–14 and b; 2014–15) at URF-Koont (DOY = days of year).
Sustainability 11 06486 g002
Figure 3. Climatic variables (temperature (Tmax and Tmin) and rainfall) during wheat crop growing season for two years (a; 2013–14 and b; 2014–15) at Talagang (DOY = days of year).
Sustainability 11 06486 g003
Figure 4. Crop total nitrogen (TN) Kg N ha−1 at tillering, anthesis and at maturity stages for years × locations (Y × L) and locations × treatments (L × T) interactions.
Sustainability 11 06486 g004
Table 1. Physiochemical analysis for three study sites from 0–15 cm, 15–30 cm and 30–45 cm during 2013–14.
IslamabadURF-KoontTalagang
Determinations (2013–14)Units0–1515–3030–450–1515–3030–450–1515–3030–45
pH1:017.57.68.38.18.68.88.38.48.5
ECdSm−10.240.20.210.320.340.260.280.270.29
Nitrogen%0.0420.0410.0390.040.360.330.0320.0310.029
Nitrate-Nmg Kg−17.867.286.54.524.214.043.163.343.12
AV.Pmg kg−13.683.463.412.832.8622.162.32
Kmg kg−1156175177114150157118108109
Organic Carbon%0.890.760.680.720.470.450.640.750.72
Silt%0.350.350.35232120272828
Sand%0.310.310.31565656585655
Clay%0.340.340.34212324151617
TextureLoamLoamLoamSandy clay loamSandy clay loamSandy clay loamsandy loamsandy loamsandy loam
B. Densitygcm−31.241.421.461.311.581.661.511.591.68
SLLmmmm−10.070.090.1980.0610.080.080.080.080.08
SDULmmmm−10.380.300.300.280.230.220.180.180.15
Saturated SWmmmm−10.4170.4240.3870.380.350.310.360.330.3
SW at tillering (BBCH20)mmmm−10.300.240.230.240.180.180.150.150.14
SW at anthesis (BBCH60)mmmm−10.330.250.230.240.190.190.160.160.15
AV.P: available phosphorus, B. Density: bulk density, SLL: soil lower limit, SDUL: soil drain upper limit and SW: soil water.
Table 2. Soil physiochemical analysis for three study sites from 0–15 cm, 15–30 cm and 30–45 cm during 2014–15.
IslamabadURF-KoontTalagang
Determinations (2014–15)Units0–1515–3030–450–1530–4545–6015–3030–4545–60
pH1:017.47.57.98.28.187.987.7
ECdSm−10.230.20.20.280.310.310.210.230.23
Nitrogen%0.0410.0420.0390.030.020.020.0310.0360.035
Nitrate-Nmg Kg−16.45.95.32.582.772.642.612.512.4
AV.Pmg kg−13.12.93.32.382.552.431.922.072.23
Kmg kg−1120135159109143149115101106
Organic Carbon%0.720.690.50.680.450.430.640.750.72
Silt%0.350.350.35232120272828
Sand%0.310.30.31565656585655
Clay%0.340.350.34212324151617
TextureLoamLoamLoamSandy clay loamSandy clay loamSandy clay loamsandy loamsandy loamsandy loam
BDgcm−31.221.41.441.291.551.651.531.611.7
SLLmmmm−10.090.1980.1860.0570.0760.0760.070.080.08
SDULmmmm−10.290.280.260.260.210.210.230.230.25
Saturated SWmmmm−10.4240.4190.3590.380.330.290.360.330.3
SW at tillering (BBCH20)mmmm−10.230.250.210.230.170.170.200.200.22
SW at anthesis (BBCH60)mmmm−10.260.260.220.240.180.180.210.210.23
AV.P: available phosphorus, B. Density: bulk density, SLL: soil lower limit, SDUL: soil drain upper limit and SW: soil water.
Table 3. Physiological traits of wheat for two years, at three variable sites and under different nitrogen treatments; *** p ≤ 0.001; NS = non-significant.
gs (mole H2O m−2 s−1)Rs (m2 s mole−1)An μmole CO2 m−2 s−1E (mmole H2O m−2 s−1)Ci (μmole CO2 mol−1 air)Chlorophyll Contents (SPAD)Proline Content (μg g−1)
Years (Y)
2013–140.65 a0.73 b18.70 a7.52 a298.41 a54.672 a30.77 b
2014–150.50 b1.05 a16.24 b6.32 b272.60 b45.56 b38.25 a
Study Sites/Locations (L)
Islamabad0.67 a0.66 c18.88 a7.95 a317.79 a51.80 a27.85 c
URF-Koont0.56 b0.87 b16.77 b6.89 b290.12 b46.79 b33.86 b
Talagang0.46 c1.07 a15.55 c6.13 c252.60 c40.29 c40.13 a
Nitrogen Treatments (T)
T1 = N00.60 c0.71 a15.25 c6.82 c290.79 d44.51 d27.97 d
T2 = N500.73 b0.56 b17.50 b8.15 b310.18 c48.39 c29.52 c
T3 = N1000.78 a0.49 c18.10 b8.75 b318.33 b54.55 b32.15 b
T4 = N1500.79 a0.48 c19.49 a9.22 a320.23 b57.28 a33.82 b
T5 = Split N500.73 b0.56 b17.52 b8.15 b310.19 c54.39 b30.74 c
T6 = Split N1000.80 a0.48 c20.07 a9.58 a329.25 a58.86 a35.42 a
T7 = Split N1500.80 a0.48 c19.79 a9.31 a325.27 a58.88 a35.42 a
Interactions
Y × L************NSNS***
Y × TNSNSNSNSNSNSNS
L × TNSNSNSNSNS***NS
Y × L × TNSNSNSNSNSNSNS
gs: stomatal conductance, Rs: stomatal resistance, An: net photosynthetic rate, E: transpiration rate and Ci: intercellular CO2. Different letters (a,b,c) in each column indicate significant difference of averages among each other while similar shows non-significant difference among each other.
Table 4. Crop total N (kg N ha−1) at tillering (BBCH20), anthesis (BBCH60) and maturity (BBCH90) stages of wheat crop during two years at three study sites under seven nitrogen treatments with significance of their interactions; *** p ≤ 0.001; NS = non-significant.
Crop N at Tillering (BBCH20) (kg N ha−1)Crop N at Anthesis (BBCH60) (kg N ha−1)Crop N at Maturity (BBCH90) (kg N ha−1)
Years (Y)
2013–142.81 a33.53 a66.417 a
2014–152.68 b31.51 b62.95 b
Study Sites/Locations (L)
Islamabad3.61 a39.93 a87.22 a
URF-Koont2.64 b34.25 b63.60 b
Talagang1.99 c23.38 c43.22 c
Nitrogen Treatments (T)
T1 = N02.11 e17.64 f32.91 e
T2 = N502.87 c25.64 e48.60 d
T3 = N1003.54 b31.61 d64.17 c
T4 = N1504.16 a36.62 b75.32 b
T5 = Split N501.84 f33.70 c63.81 c
T6 = Split N1002.17 e38.18 b78.74 b
T7 = Split N1502.52 d44.23 a89.20 a
Interactions
Y × L*********
Y × TNSNS***
L × T*********
Y × L × TNSNS***
Different alphabets (a,b,c,d,e and f) in each column depicts significant difference of averages among each other.
Table 5. Wheat nitrogen use efficiencies (nitrogen use (kg kg−1), utilization and uptake efficiencies) crop during two years at three study sites under seven nitrogen treatments with significance of their interactions; *** p ≤ 0.001; NS = non-significant.
Years (Y)NUENUtENUpE
2013–1418.35 a44.18 b0.41 a
2014–1516.63 b44.35 a0.39 b
Study Sites/Locations (L)
ISLAMABAD22.96 a43.53 b0.53 a
URF-Koont18.22 b47.08 a0.39 b
Talagang11.31 c42.20 c0.27 c
Nitrogen Treatments (T)
T1 = N021.72 a52.78 b0.41 bc
T2 = N5020.03 b53.98 a0.37 d
T3 = N10016.49 c46.33 c0.35 de
T4 = N15013.48 d41.38 d0.32 e
T5 = Split N5020.03 b40.84 e0.49 a
T6 = Split N10017.31 c39.42 f0.43 b
T7 = Split N15013.39 d35.15 g0.38 cd
Interactions
Y × LNS******
Y × TNSNS***
L × TNS******
Y × L × TNSNS***
NUE: nitrogen use efficiency, NUtE: nitrogen utilization efficiency and NUpE: nitrogen uptake efficiency: Different letters (a,b,c,d,e, f and g) in each column indicate significant difference of averages among each other while similar shows non-significant difference among each other.
Table 6. Agronomic traits of wheat crop during two years at three study sites under seven nitrogen treatments with significance of their interactions; *** p ≤ 0.001; NS = non-significant.
No of Tillers m−21000 Grain Weight (gm)Biological Yield (kg ha−1)Grain Yield (kg ha−1)Harvest Index
Years (Y)
2013–14222.4 NS31.3 NS9380.9 a3001.9 a0.32 a
2014–15212.730.78704.7 b2611.4 b0.3 b
Study Sites/Locations (L)
Islamabad236.5 a34.3 a10,450.1 a3957.5 a0.35 a
URF-Koont226.9 a33.9 a8578.2 b2830.8 b0.33 b
Talagang189.2 b24.7 b7042.4 c1760.6 c0.25 c
Nitrogen Treatments (T)
T1 = N0184.5 c23.5 c5992.4 c1737.8 c0.29 c
T2 = N50205.8 b28.1 b8140.6 b2605 b0.32 a
T3 = N100218.8 ab31.7 a9275.9 a2968.3 a0.32 a
T4 = N150229.3 a33.1 a10,942.8 a3501.7 a0.32 a
T5 = Split N50221.1 ab31.6 a8982.7 b2605 b0.29 c
T6 = Split N100234.4 a34.5 a11,345.5 a3517.2 a0.31 b
T7 = Split N150229.1 a34.3 a10,976.3 a3512.4 a0.32 a
Interactions
Y × L***NS***NS***
Y × TNSNSNSNS***
L × TNS***NS******
Y × L × TNSNSNSNS***
Different letters in each column indicate significant difference of averages among each other while similar shows non-significant difference among each other.

