Study on Environment Regulation of Residential in Severe Cold Area of China in Winter: Base on Outdoor Thermal Comfort of the Elderly


Key Laboratory of Cold Region Urban and Rural Human Settlement Environment Science and Technology, Ministry of Industry and Information Technology, School of Architecture, Harbin Institute of Technology, Harbin 150000, China
*
Author to whom correspondence should be addressed.
Sustainability 2019, 11(22), 6509; https://doi.org/10.3390/su11226509
Submission received: 15 October 2019
/
Revised: 8 November 2019
/
Accepted: 15 November 2019
/
Published: 19 November 2019
(This article belongs to the Special Issue Sustainable Built Environments for Health and Wellbeing)
Abstract
:Overwhelming evidence shows that the harsh climate conditions are affecting urban residents who are living in severe cold areas of China in winter, particularly affecting the frequency and length of outdoor space usage of the elderly. This study aims (1) to establish the modified model which is suitable for the harsh climate region, (2) to verify whether the physiological equivalent temperature (PET) index can be evaluated for the outdoor thermal comfort of older adults in severe cold areas of China in winter, (3) to draw the thermal comfort map that is based on the former conclusions. In this study, the outdoor environments in typical residential areas for the elderly of Changchun, China, has been investigated by using field measurement, questionnaire survey, and Computational Fluid Dynamics (CFD) simulation. The results show that the wind direction is the important aspects of model modification and quite possibly one of the most neglected. In addition, it is convenient to evaluate outdoor thermal comfort of the elderly on the basis of the PET index and the neutral PET temperature of elderly people who live in severe cold areas of China in winter is −0.5 degrees Celsius. According to the thermal comfort map, the park green land of urban residential is the best area for the elderly.
1. Introduction
In recent years, with the continuous extending of city space, urban ecological environments have tended to become worse. Weather-related events, like heat island and air pollution, have an enormous impact on people’s comfort and health when they are participated in outdoor activities. Many previous studies have confirmed that microclimate conditions directly affect the number of pedestrians in open spaces like park, plaza, campus, residential areas, hardscape, and landscape [1,2,3,4]. Also, the microclimate condition is closely related with comfortable sensation of human beings [5,6,7,8]. The discomfort of thermal environment can affect people’s satisfaction and health, would even cause diseases like thermoplegia [9,10,11,12,13]. This situation has much worse in cold climate zone. Some references indicated that the extreme cold weather and mortality are closely related [14]. The research on urban environment and outdoor thermal comfort in severe cold areas are becoming increasingly important.
Furthermore, with fewer children entering the population and people living longer, the phenomenon of the world aging getting more and more serious. According to the Global Health and Aging Report by the WHO in 2011, there are 524 million people over the age of 65 in the world by the end of 2010, 8% of the total population. By 2050, the number of the population is expected to increase to 1.5 billion, which accounts for 16%. The World report on aging and health, which is published by WHO in 2015, reemphasize this point. It is obvious that the aging population continues to increase. This trend is likely to accelerate over coming decades. As the vast majority of urban open spaces users, the elderly problem is always concerned. The relevant research could be divided into two-parts. The first one is the relation between the health of the aged and urban outdoor environments. Takano focuses on the survival rates of elderly people within five years by investigating 3144 Japanese. He found that the outdoor thermal comfort and pedestrian area with green space have significantly positive influence on their life [15]. Artmann analyses the data from 126 care facilities in 17 cities of Europe via online survey and the results show that the elderly of facilities with gardens had recreation and socialization more often than facilities without gardens [16].
The second one is the thermal comfort of the elderly. The majority of literature on this research field focuses on the indoor environment and comfort. By using the thermal sensation questionnaire and indoor steady-state microclimate measurement, Hwang gets a series of data that contain the comfort of elderly people in the different seasons [17]. Schellen made the thermal comfort comparison between the young and the old. The result shows that the comfortable temperature of elderly is higher than young people in indoor environments [18]. The similar results are summarized in Taylor’s research. Due to the other method that includes air temperature control, experimental and control groups, Taylor found that the elderly need much more thermal stimulator than young people to drives them to adjust thermal sensation because their depression of the physiological function [19]. However, the outdoor thermal comfort of elderly may be often overlooked, especially when they enjoy outdoor activities in urban open spaces. The main reason might be that the outdoor environment is dynamic, as Rupp shows in his paper. He reviews the relation between built environment and thermal comfort. The conclusion drawn is that there are still disputes about the empirical model and evaluation index of outdoor thermal comfort. Specifically, because the different empirical models are established based on various climate zones, races, cultural backgrounds, and habits. It made all models difficult to universality [20]. In terms of index, almost all of them are from indoor steady-state research. Different theoretical foundations could lead to moderately inaccurate for thermal comfort.
However, more and more scholars gradually pay attention to urban microclimate and outdoor thermal comfort in recent years, some significant results are presented. As for research methods, it could be divided into three ways, first one is the combination with field measurement and questionnaire investigation [21,22,23,24,25]. Second is numerical simulation [26,27,28,29,30] and the third one is a new method combining the field research and simulation of computer software [31,32]. As for index of outdoor thermal comfort, they mainly include five aspects as follows, predicted mean vote (PMV) [33], standard effective temperature (SET) [34], the universal thermal climate index (UTCI) [35], CBE Thermal Comfort [36] and the physiological equivalent temperature (PET) [37]. As for the regulation strategy, it includes four main parts. They are urban geometry [4,38,39,40], green vegetation [31,41,42,43,44], river [45,46,47,48], and construction materials [30,49,50,51,52]. In terms of the relation between the health of the aged and urban outdoor environment, there is a lack of research on the effect of outdoor environment on the physically and mentally healthy of senior citizens under harsh climatic conditions in severe cold regions. As for the thermal comfort of the aged, the most studies above focus mainly on the relation between indoor environment and the elderly, ignore the outdoor conditions. In the aspect of outdoor thermal comfort, few studies pay attention to old people and extremely cold climate. This could cause the existing research methods, evaluation index, and regulation strategy to not necessarily apply to the elderly and severe cold areas. That means all these should be adjusted based on climatic conditions. Therefore, the main issue discusses in this paper is how to analyze outdoor environmental features in urban residential and evaluate the outdoor thermal comfort of the aged by combining the extremely cold climate and the elderly people’s characteristics.
This paper aims to establish the modified numerical model which is suitable for the harsh climate region. In addition, whether the thermal comfort indices can be evaluated for the outdoor thermal comfort of older adults in severe cold areas of China in winter would be verified. Moreover, based on the former conclusions, the thermal comfort map would be presented. In this study, the commercial software ANSYS Fluent would be selected to be used in the numerical simulation studies. The PET index would be chosen to evaluate outdoor thermal comfort of the aged.
2. Research Framework
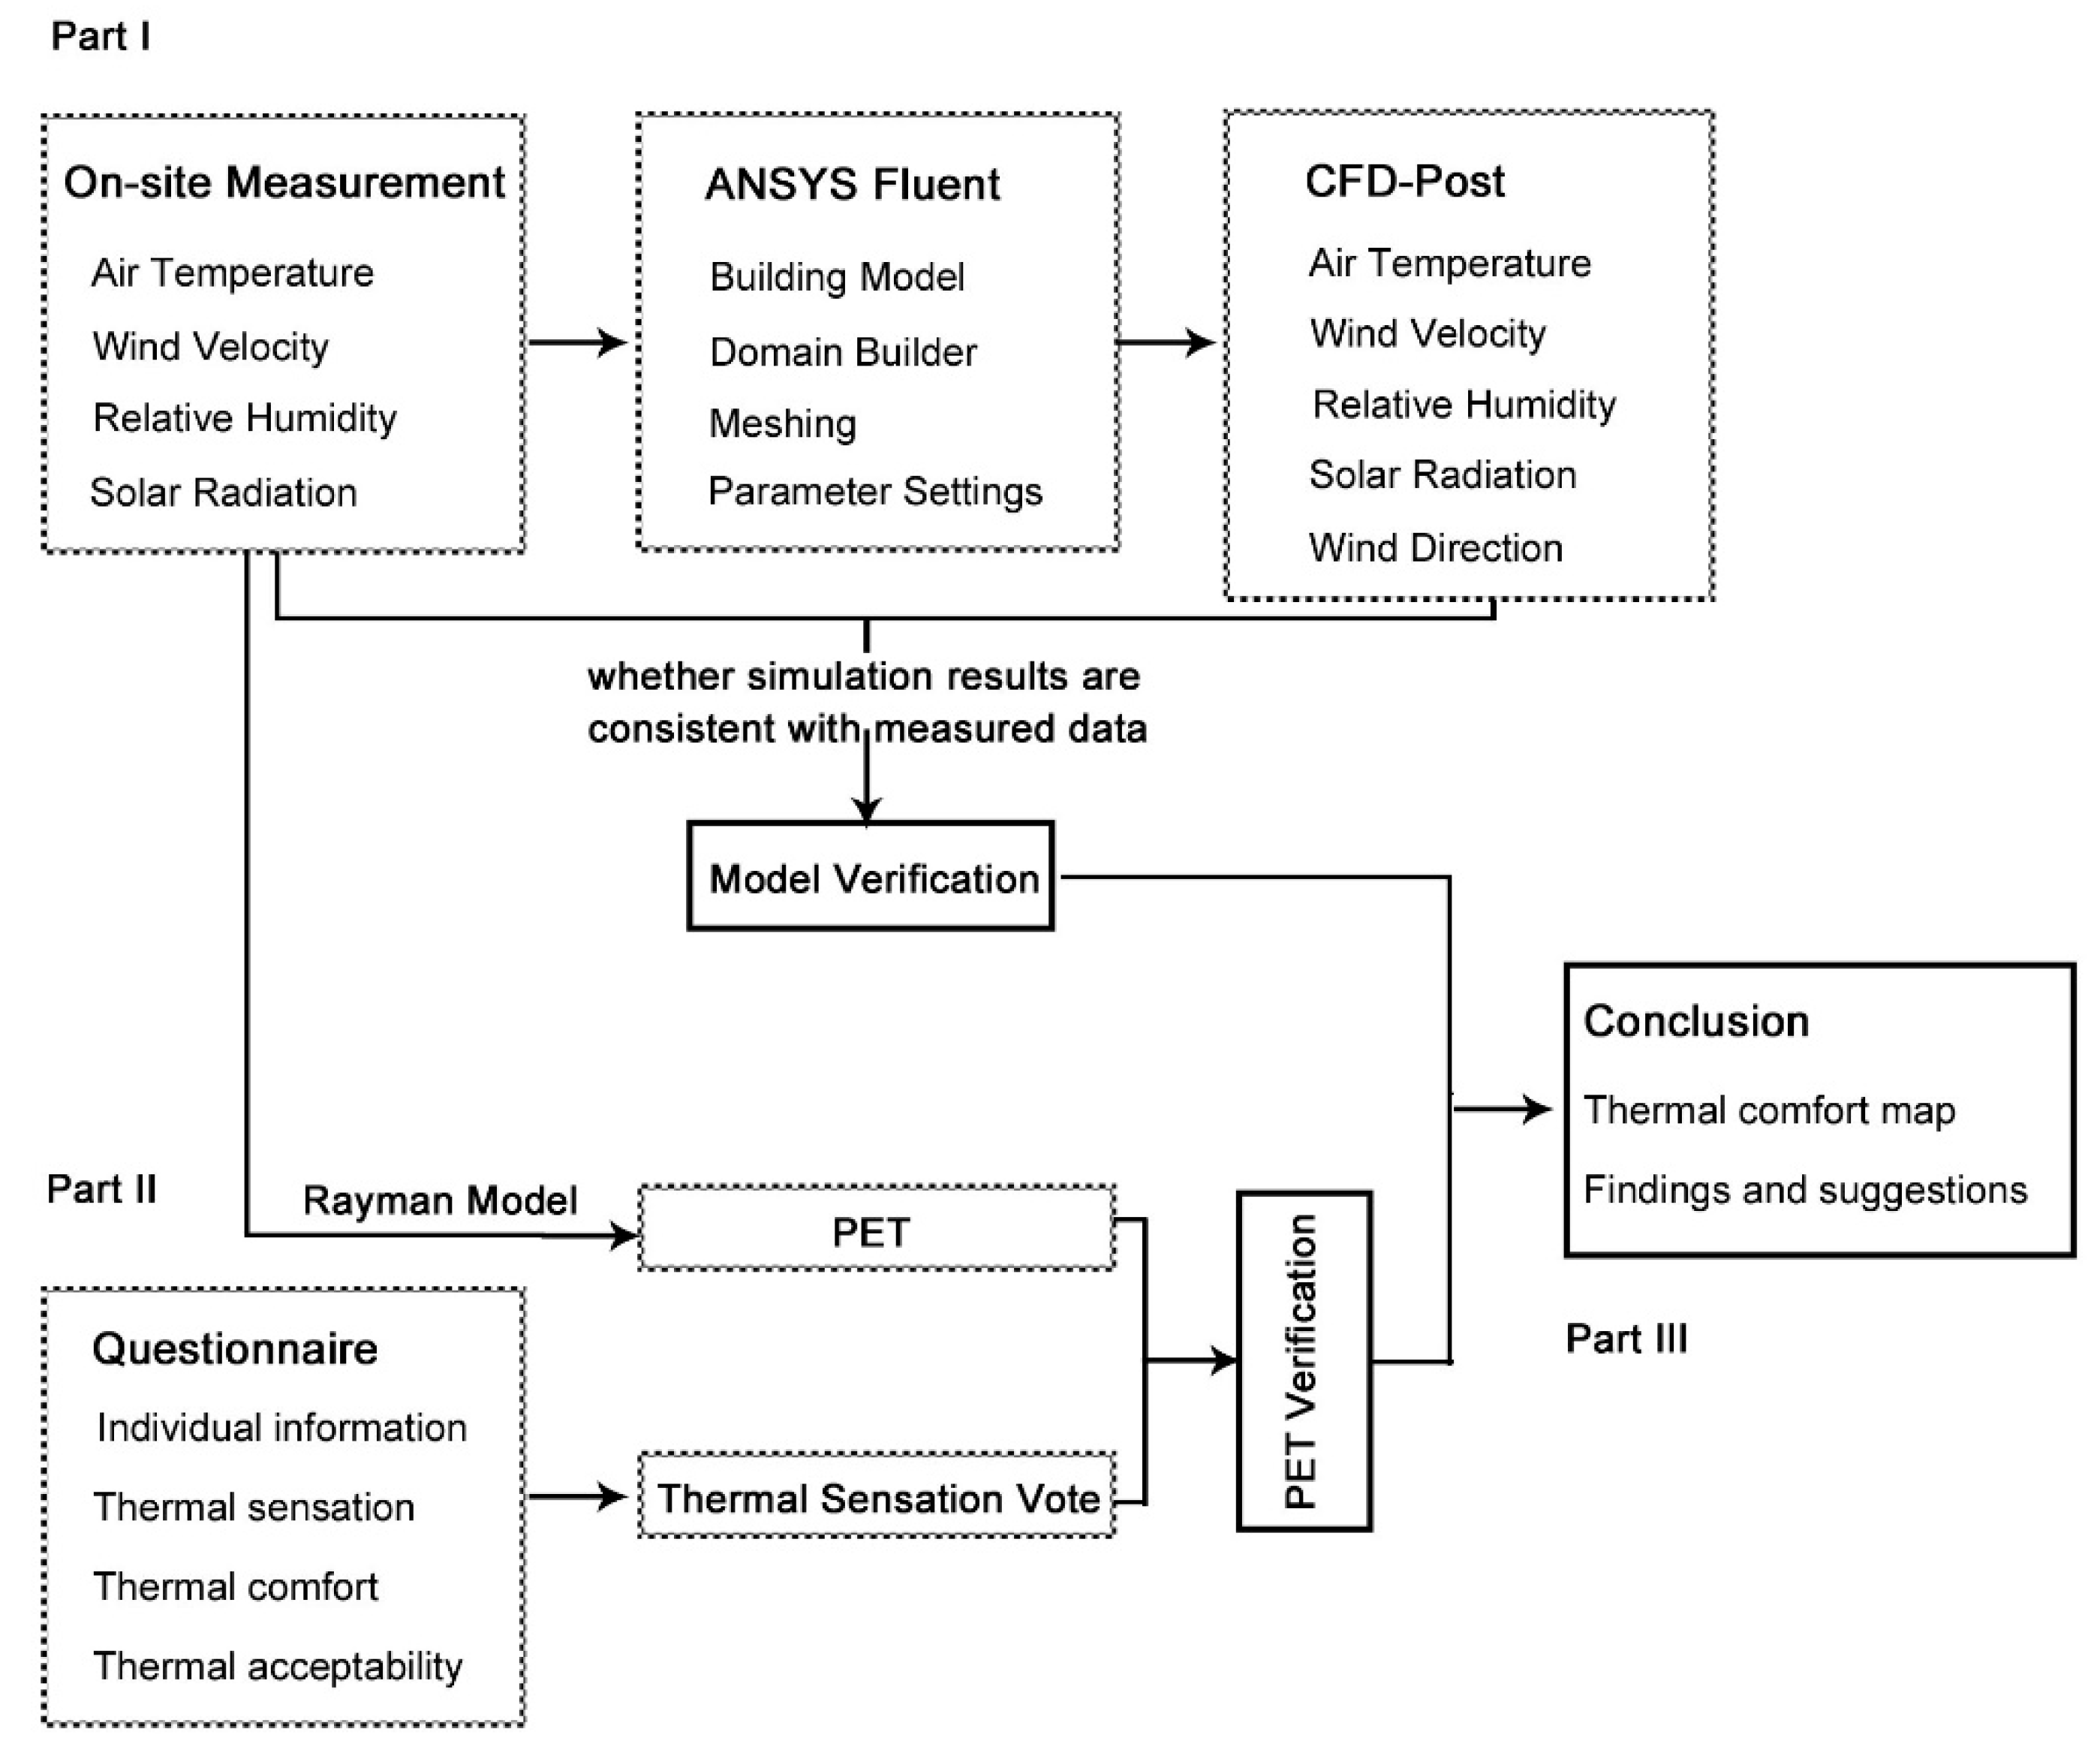
The purpose of this study would be divided into three parts: Part I is the verification of the numerical model. More specifically, the measured data would be used as verifying methods to detect whether model settings are correct. After selecting the research site, the outdoor space of residential areas could be classified variously according to different environmental conditions. Then the portable weather station has been placed and the meteorological parameters, like air temperature, wind speed, relative humidity, and solar radiation, can be obtained. Next, the measured data are applied to the input parameters in the Fluent model and the simulation results can be calculated. By comparison of the measurement and simulation results, if the results keep conformity, the modified model would be completed. Otherwise, it should re-evaluate parameter settings of Fluent model and simulate multiple times until two sets of data remain consistent. Part II is to validate whether the PET index can be evaluated for the outdoor thermal comfort of the elderly in severe cold areas of China in winter. On one hand, the measurement data of each test point would be import to RayMan model and PET value could be calculated by using this model. On the other hand, the thermal sensation vote (TSV) are counted from questionnaire survey in different outdoor spaces of residential area. By the means of contrast, study is carried through both PET and TSV. Part III is based on the previous analysis. The winter outdoor environment of residential areas would be simulated by using modified numerical model. Moreover, these simulation results are imported into RayMan model and the elderly thermal comfort map of urban residential areas in severe cold areas would be presented. It is beneficial for improvement of outdoor environmental quality and the elderly comfort in winter. The framework was shown in Figure 1.
3. Methodology
3.1. Research Site
The investigation is conducted at Changchun city(43°53′N,125°19′E), where is the capital of Jilin province (as shown in Figure 2a). The selection of this city has two main reasons. Firstly, Changchun city is windy dry weather in short spring, warm and rainy in summer. In autumn, it has large difference with spring in temperature and velocity. In a long winter, it is cold and dry. The annual average air temperature is 5.65 degrees. The coldest month of the year is January and month average temperature is −15.1 degrees. It is the typical city in severe cold area of northern China.
Secondly, Changchun city is the population aged one of more serious cities in China. According to the definition of the World Health Organization and China 6th national population census, the people of 60 or above account for more than 13.63% of Jilin province population, is the third-highest in the country. According to official figures, the number of people aged 60 or over already had 1.139 million, which accounted for 14.8% of the total in 2012. In 2013, this number had increased to 1.228 million, nearly 16.3% of the population. By 2016, the number of aging make up about 18.1% of the population. That trend will continue to increase in the foreseeable future.
By comparing four residential areas that the proportion of older people are all more than 18%, Tianjia Community (as shown in Figure 2b) has been selected to be research site. The number of people aged 60 or over make up about 25.9% of the total. Besides, there are varying heights and planning layouts in community areas (as shown in Table 1).
3.2. Filed Measurement and Questionnaire Survey
According to the different environmental conditions, functions, and activities of the aged, seven typical measure points would be selected. All the points are presented in Figure 3.
Point 1 is a playground, where located in the central north of test site. Besides, the areas are surrounded by some multi-story buildings. Then the expanded plastic mats on the ground could prevent the children’s safety. The wood is open in this area in order to care for the child, which could forbid the children have been occluded with trees. The activities of the aged are childcare and talk with other elderly people.
Point 2 is a fitness area. It is near the west of the playground. Two multi-story buildings are on the east side and many high-rise buildings are on the west. There are many pieces of fitness equipment in this area and the half of ground materials are plastics, others are asphalt concrete. In addition, there are no trees or greenery in this area. The fitness exercises and conversation are the most common outdoor activities of elderly people.
Point 3 is park green land, which is located in the south of the fitness area. Unlike the previous two areas, great open space is here. The distance of surrounding buildings is far enough away. Furthermore, there are plenty of poplars, bush, grass, and a rest pavilion. Whenever a sunny day, the aged would like to sit around or walking quickly. Besides, occasionally there would have some elderly people who practice Tai Chi in this area.
Point 4 is squares 1 and point 6 is squares 2. They are separately located in the west and east of the central residential area. The main difference between these two areas is that square 1 had open space with no trees, and some street trees are in the squares 2 areas. The most outdoor activities of elderly people are gymnastic exercise and jogging.
Point 5 and point 7 are sidewalk 1 and 2. The locations of them are the northeast and southwest of the central residential area. Similarly, the number of trees and plants in sidewalk 2 is far more than the number in 1 area. Then, the main activity in this area is brisk daily walk.
The test duration is from 22nd January to 24th January 2018, from 8 am to 6 pm. The test instrument is continuously used with automatic record system.
All the test points are shown in Table 2. All the details of instruments for weather measurement are shown in Table 3.
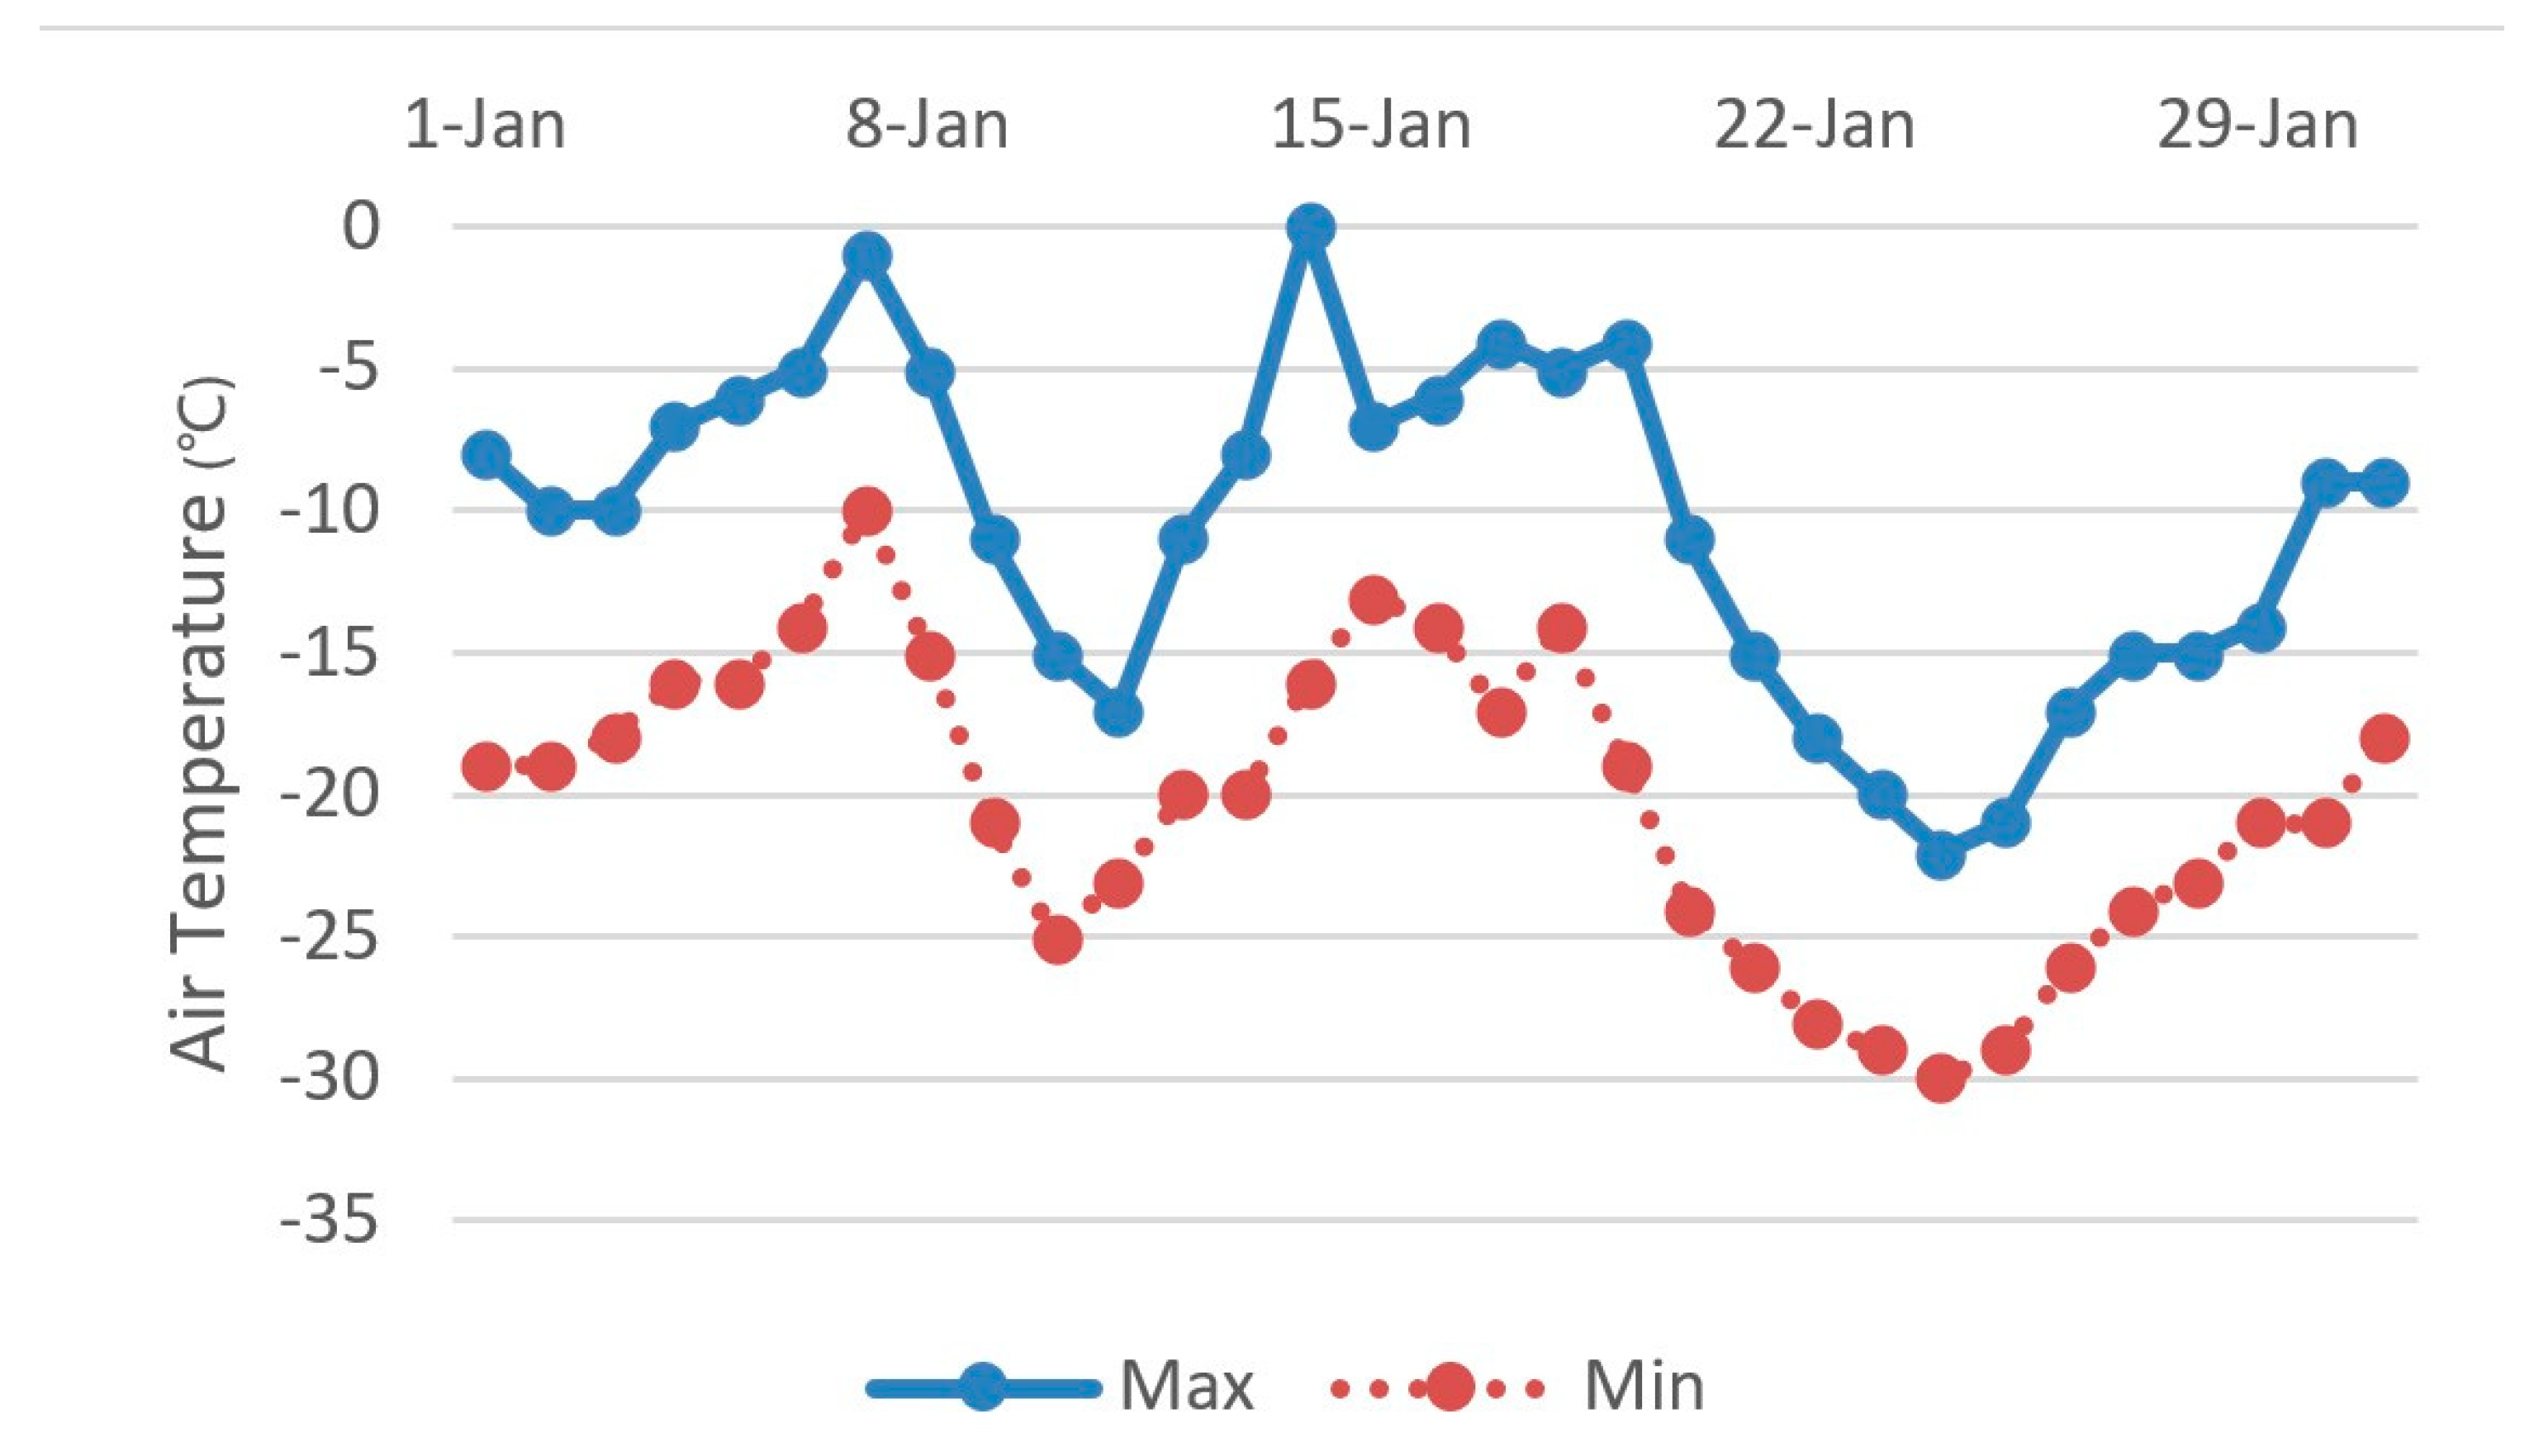
The results show the month average air temperature is −15.4 degrees Celsius in January. The coldest day is 24th, the warmest day is 7th (as shown in Figure 4). The month average relative humidity is 58.6% and wind speed is 0.45m/s. Besides, it has twenty-two sunny days, five cloudy days and four snowy days in January. The dates of field tests are typical days that they are all within the range of coldest days in winter in severe cold areas of China.
In terms of the questionnaire survey, this paper analyzes the respondents’ personal information and subjective thermal sensation based on a survey among Tianjia residents. It focuses on ten days between 20th and 29th January. A total of 450 questionnaires are completed, and only 418 of them are valid because they fall outside the age range or lack vital information. This questionnaire can be divided into two parts, one is gathering objective information and the other is about subjective votes. The votes included thermal sensation, thermal comfort, and thermal acceptability. The sensory scales of first two indexes are shown in Table 4, and the scales of thermal acceptation are warmer, constant and colder.
3.3. Simulation Research
There have been many papers about the urban microclimate and outdoor thermal comfort research in recent years. The numerical simulation has become one of the main research methods. As a common and efficient software, ANSYS Fluent has been selected to be used in this paper.
3.3.1. Parameters Setting
The first one is the boundary setting. How to establish the appropriate dimension of the boundary is important insuring the accuracy of numerical simulation. Hence, the modeling with multi-scale dimension of boundary is built. Through many simulation experiments, combined with existing research results [53,54,55]. Finally, the specific requirements and proper range of models are summarized. It is shown in Figure 5.
There should be 5H (H means the height of buildings) distance kept between the inlet and building. Similarly, the distance from outflow to the building is 20H, from symmetry to building is 5H and from top to building is 11H.
The second one is a log wind profile. During the numerical simulation, the correct definition of mean wind speed of inlet is very important. According to the result of wind tunnel test from AIJ Japan [56] and the conclusion of Oke’s book, the speed of ground-level horizontal wind had kind of distribution rule [57]. An empirical formula could be used to calculate the horizontal wind of different height level,
here . is friction velocity which means the velocity profile near the boundary, . is the Karman constant and it is approximately equal 0.41, d is the height from the ground, . is the surface roughness, which is the horizontal mean wind speed near the ground. It is related to the height of ground roughness. Due to the relevant literature, the roughness length is about one-tenth of the height of the surface elements. When the underlying surface is snow or gravel, . ranges from 0.001 to 0.005, grass is from 0.01 to 0.05, crops is from 0.1 to 0.25 [58]. d is the zero-plane displacement that is nearly equal from 2/3 to 3/4 of building height.
When the horizontal mean wind speed at 1.5 meters . is known (data from the field measurement), the new mean wind speed at the new height . could have mathematical relationship with
here, is the wind velocity of height. According to the measurement data of 1.5 meters, all the horizontal velocity of different levels could be calculated with formula 2. In this study, the horizontal mean wind speed can be divided into 11 different areas by calculation at the inlets. The velocity of each inlet had a strong relationship with the height on the ground. In order to simplify calculating, the speed of each area would be set up identically. The details are shown in Figure 5.
The third one is soil temperature. When setting the boundary layer parameters, the soil temperature generally is neglected, which lead to some deviation from the exact results. Some researchers who come from agricultural engineering, geography, and meteorology conducts intensive study on this research field [59]. Some findings show that the soil temperature is associated with air temperature and soil thickness. A simulation model that can analyze the soil temperature has been established by Florides, but they find that model is suited for only under two meters deep areas. Since the surfaces are more complicated, the areas where are near the ground would be unpredictable [60]. In the paper, the field measurement is tested during the winter, and that means there are ice and snow on the surface in severe cold areas. As a result, the calculation methods for soil temperature are more complicated [61]. Therefore, based on the empirical method from Rankinen [62], the soil temperature can be calculated with formula that has considered the snow cover condition.
The fourth one is fluids and solid materials setting. As said in much relative literature, the property of air changes with different air temperatures. The density, dynamic viscosity, specific heat, conductivity, and thermal diffusivity of air have been changed. Hence, the property calculator should be used to calculate air parameter. It could guarantee the accuracy of inputting parameter settings. In the meanwhile, some new materials include the ground surface and concrete should be calculated carefully. Depends on various environmental conditions and times, the input parameters are totally different. This would lead to differences in every simulation.
After all the basic parameters setting are complete, the preliminary input for fluent simulations are shown in Table 5:
3.3.2. Wind Direction
However, the results between measurement and simulation still have a difference. In order to solve this problem, the air temperature, relative humidity, wind velocity, wind direction, and solar radiation would be inspected one by one. Due to these results and related research, wind direction might be the most critical element. Due to circumstances beyond control, the value of wind direction could change quickly during the field research. This would strongly affect the results of simulations. This agreed with the result of the study of Van Hooff and Wise. In Van Hooff’s research, the wind direction and surrounding buildings layout influence mechanism on the natural ventilation are analyzed in detail. Then the wind model couples the indoor and outdoor stadiums are used for further simulation. According to the surrounding or no surrounding buildings, the simulation would be divided into two conditions. Next, this model with eight different angles of wind direction are simulated, respectively. Comparing with the data of wind direction in field tests, the difference between two angles is 75% with no surrounding building. In contrast, the results had increased to 152% when the stadium is in urban environments [63]. Like the Van Hooff studies, Wise also uses the RANS model and same boundary condition settings in his study. Then, he divides original wind direction of inlet within 30 degrees into seven different angles and simulated these eight cases respectively [64]. Therefore, his research has higher precision compared with Van Hooff. By contrasting the data between simulation and measurement, he finds that there exist big differences in studied results with different angles, even change five degrees.
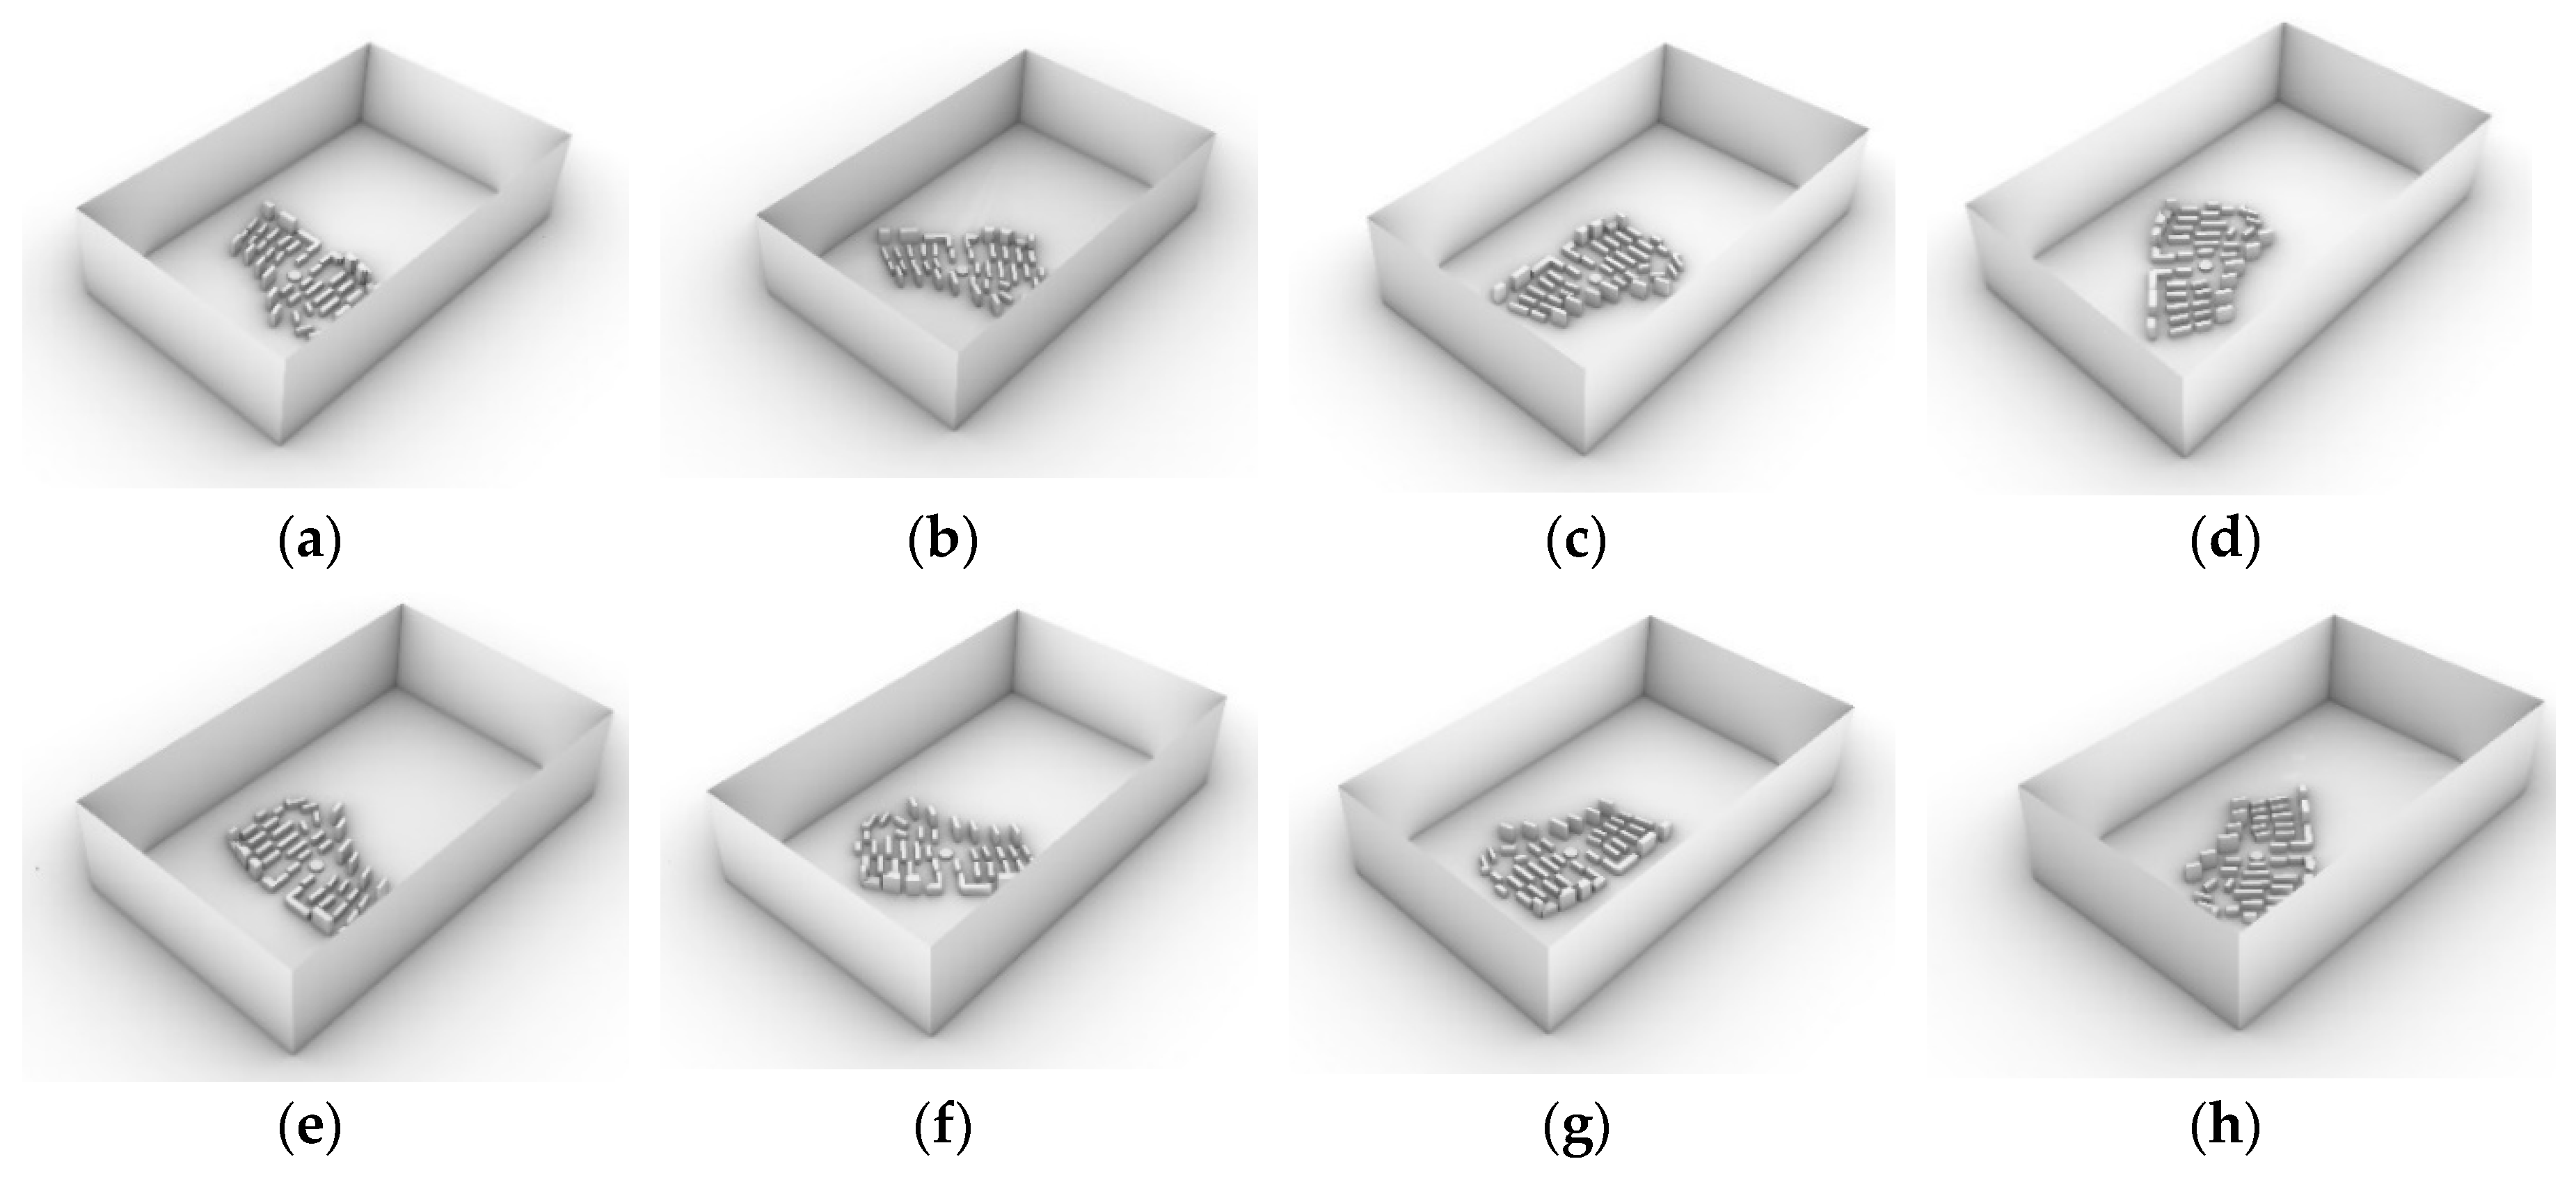
Therefore, in order to ensure the accuracy of boundary condition settings and simulation results, the steady RANS standard k-ε model would be used in this paper [65]. Moreover, with other boundary conditions unchanged, the orientation of the inlet would be changed into eight directions. The difference between each direction is 45 degrees. These are east, southeast, south, southwest, west, northwest, north, and northeast, respectively. Furthermore, eight numerical models and meshing are built (as shown in Figure 6.) which is based on these eight orientations. Next, these numerical models would be calculated at the same time. By comparing with the observation data at same time, the accurate wind direction could be determined. Based on this research method, the wind direction of different times during a typical day in winter in severe cold areas of China would be presented.
4. Results
4.1. Relation Analysis between Field Measurement and Numerical Simulation
Through field study and questionnaire survey, the typical day, 25th January 2018, should be identified as the date of numerical simulation. Besides, the results of simulations from eight models in each period would compare with measurement data. In addition, this paper proposed to divide the daytime of the 25th into five periods, 8:00–10:00 am, 10:00 am–12:00 pm, 12:00–2:00 pm, 2:00–4:00 pm, 4:00–6:00 pm, respectively. The input data used by these models are all the mean values.
The air temperature and wind velocity comparison between the results of field measurement and numerical simulation are shown in Figure 7, Figure 8, Figure 9, Figure 10 and Figure 11.
The analysis result shows that the simulation of each test point is nearly identical to the field measurement data when the direction of the inlet is southwest, which would mean the prevailing wind directions from 8 to 10 am is southwest. Similarly, the prevailing wind direction from 10 am to 12 pm is west, from 12 to 2 pm is northwest, from 2 to 4 pm is west and from 4 to 6 pm is northwest. It also shows the modified numerical model could be a reliable tool for simulating outdoor environment of residential areas in severe cold areas of China in winter. Furthermore, it should focus on not only the basic parameters setting, like boundary conditions, log wind profile, mesh generation, ground temperature, and material parameters, but also the impact of wind direction during the process of model revision. Next, all outdoor environments of residential areas could predict the microclimate parameters with this modified model at different times. This result can be the partial data basis for the thermal comfort map.
4.2. Thermal Comfort Validation and Analysis
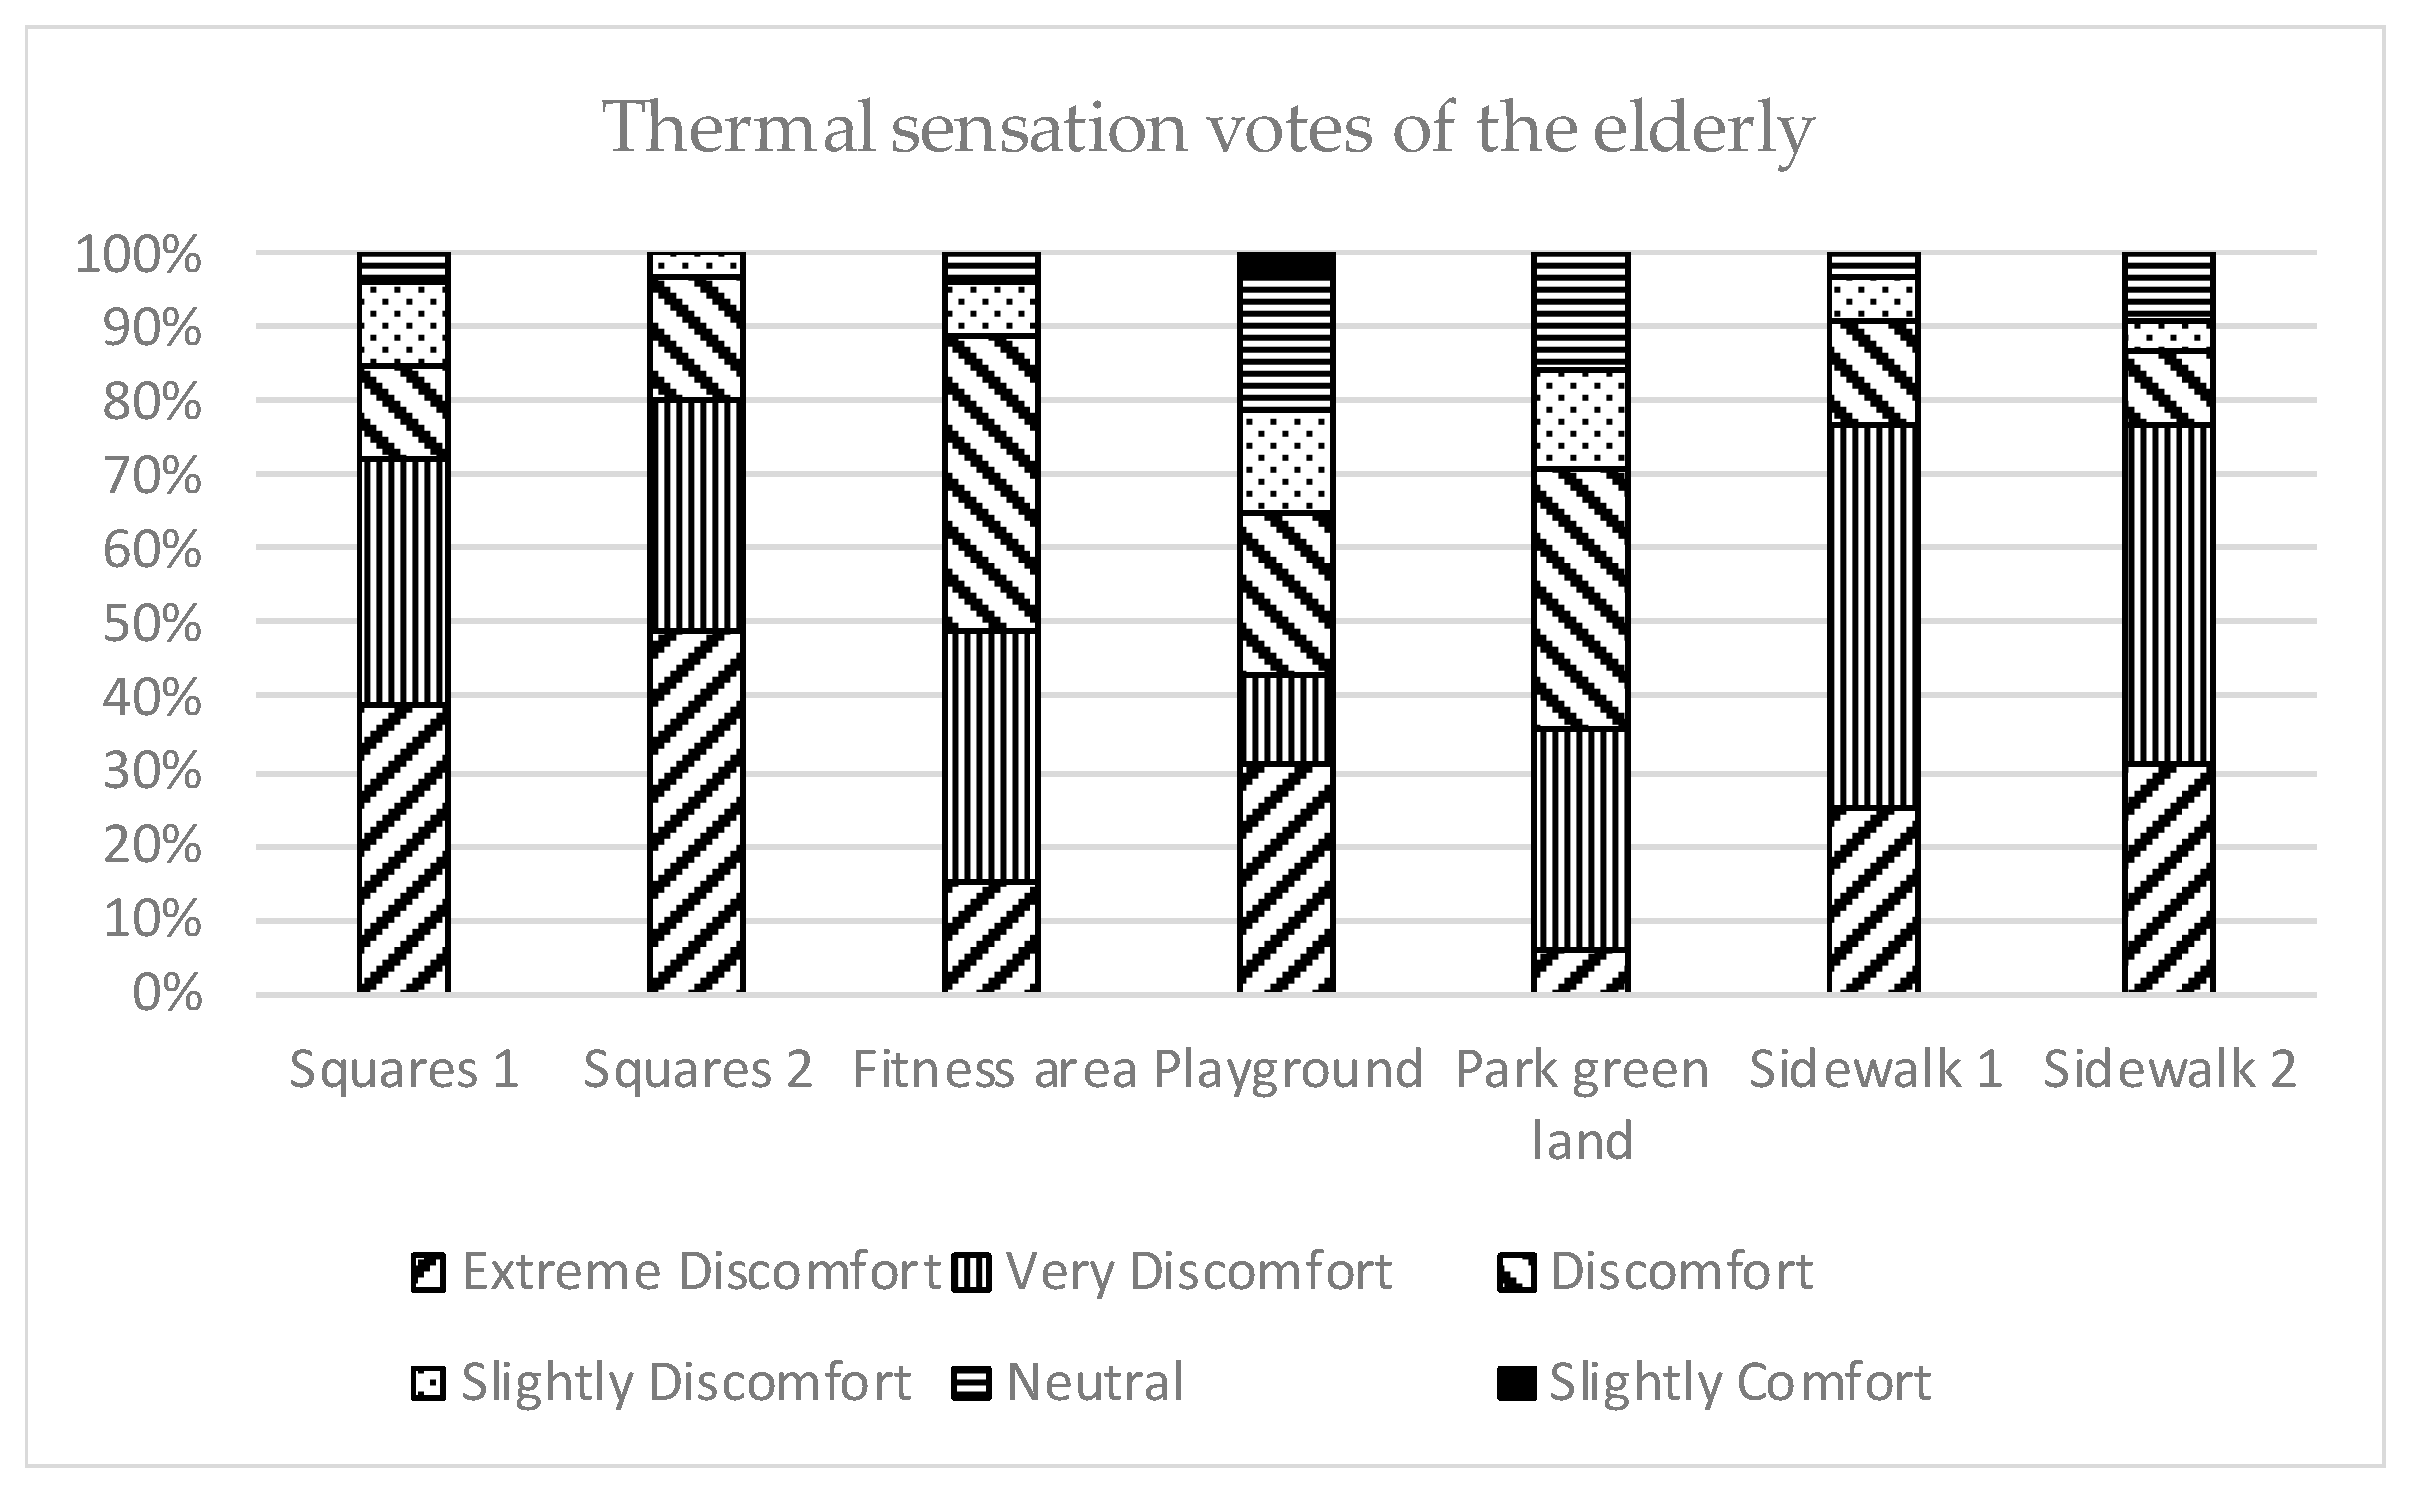
In this study, 418 questionnaires, which including 42% of men and 58%of women, are collected in all test points. After statistical analysis, the percentage of thermal sensation votes of the aged in seven locations are created as shown in Figure 12.
The above figure shows that the elderly in the squares 2, vote for ‘extreme discomfort’, accounting for the highest proportion. In contrast, the aged in park green land has the lowest percentage. In addition, sidewalks 1 and 2 have similar results and the votes of ‘very discomfort’ have a large proportion. Furthermore, in terms of the neutral sensation, the areas of park green land and playground have the highest percentage. On the contrary, squares 1, fitness area, and sidewalk 1 have lower ratio and squares 2 even have no sensation. It is worth noting that the old people who stay in playground could even feel slight comfort.
Next, based on the microclimate parameters of different areas in the community, the RayMan 1.2 model, which is built under the VDI 3789 PART II and VDI-3787 guidance, would be used to calculate PET in this study [66].
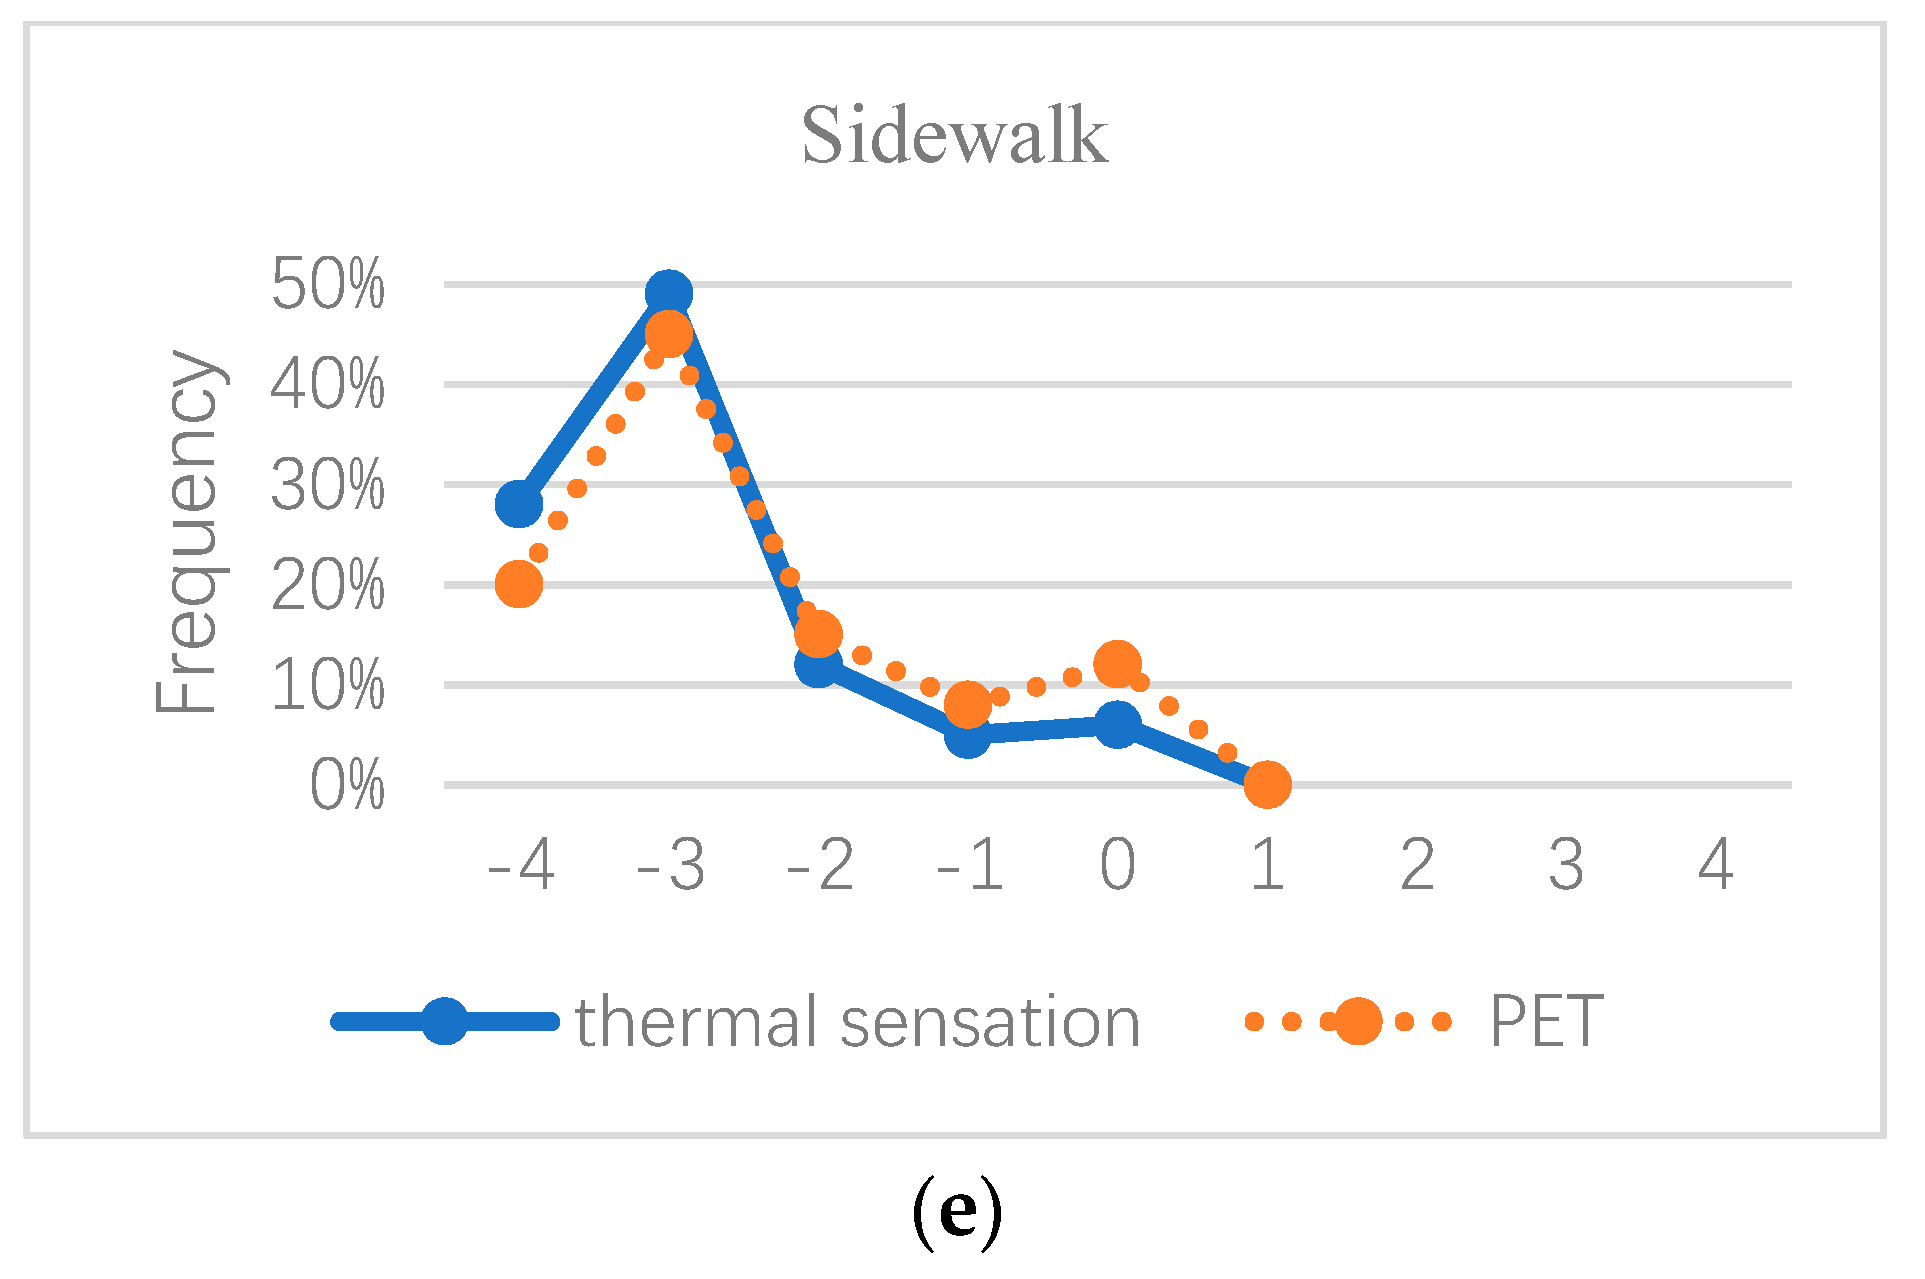
By comparing the PET and the results of subjective thermal sensation in the aforementioned areas, it could validate whether the PET index is suitable for evaluating the thermal comfort of the aged in severe cold areas of China. The TSV of squares would be defined as the average value of squares 1 and 2. So are the sidewalks. The results appear as shown in Figure 13,
The results showed that the PET had a great regression relationship with the perception of the elderly. There are clear correlations between PET and thermal sensation of the elderly during the winter in severe cold areas of China. In other words, the results of numerical modeling and questionnaire survey could have verified each other. Moreover, in order to make sure the range of thermal comfort in Changchun, a similar approach to Lin’s would be used [67]. The mean (thermal sensation votes) TSV could be calculated for each 1 degree PET interval. For instance, if the value of mean thermal sensation of elderly is close to −16 degrees to −17 degrees PET is −2.1, it means the mean TSV is equal to −2.1 for a PET of −16.5 degrees. Based on this method, the relation between all the thermal sensation votes of older people in this study and PET could be calculated, as shown in Figure 14,
The regression equation for MTSV and PET is
MTSV = 0.231 × PET + 0.126 (R2 = 0.838, p < 0.001)
Compared with other studies, the neutral PET temperature of the elderly during the winter in Changchun is significantly lower than those people in different climatic zones. This is mainly because the aged who living in severe cold areas for a long time had a strong sense of thermal adaptation. As Richard concludes, living experience of a place is a multivariate phenomenon that has a complicated relationship with person’s objectives and expectations. Hence, he believes the thermal adaptation should be categorized into three parts, behavioral, physiological, and psychological feedback [68]. In this study, the elderly put more on clothes and make the move when they decide to participate in outdoor activities. According to the increasing metabolic rate and heat resistance of clothing, the neutral PET temperature of elderly in Changchun can stay at a comparatively low temperature.
4.3. Thermal Comfort Map
Therefore, based on the above analysis, the index of PET could well weigh the degree of elderly thermal comfort during the winter in Changchun. Besides, there is almost no direct and diffuse solar radiation during the 8–10 am and 4–6 pm. In other words, most community areas are uncomfortable before 10 am and after 4 pm. Hence, according to the previous studies, the thermal comfort map would be drawn between 10 am–4 pm as shown in Figure 15.
Based on the above analysis and conclusions, the neutral PET temperature of elderly is −0.5 degrees Celsius. Hence, any areas of residential outdoor environment at the temperature below this is uncomfortable. In addition, the range of PET temperature and the average of that in these figures have both had a significant drop. Moreover, most areas gradually became uncomfortable except for fitness after 2 pm. Furthermore, all the areas like squares, park green land, fitness area, playground, and sidewalk have different comfortable periods of aged people. The park green land and playground have a longer duration, from 10 am to 2 pm. Next, the comfortable period of open squares is only between 12 to 2 pm because the mean wind speed is faster from 10 to 12 pm. The cold wind would cause extremely uncomfortable and further influenced the PET index and subjective thermal sensation of the elderly. Then, the areas of sidewalks are always uncomfortable during the typical day, and especially after 4 pm. More interestingly, in terms of fitness area, the comfortable periods are 10 to 12 pm and 2 to 4 pm, respectively. The reason was that the elderly who live in the severe cold areas of China had siesta habit. This could cause the evaluation of these areas are not high between 12 am to 2 pm, although the index of PET values is not bad.
5. Conclusions
The conclusions are the following several aspects:
Firstly, in order to evaluate how the different values of wind direction could affect the simulation result. There are 8 models, which have the same basic parameters settings and different wind directions, would be simulated separately in the same time and day, whereby each different angle value is 45 degrees in this paper. By comparing these simulation results, the model with accurate wind direction can fit for measured data in a certain period of time during the typical day in winter. Moreover, this method is valuable to determine the exact model parameters setting, which could more accurately forecast the microclimate in severe cold areas of China. Furthermore, based on this modified model, meteorological parameters could be calculated more easily.
Secondly, in terms of the outdoor thermal comfort, the verification conclusion is that PET had a great regression relation with perception of elderly. Moreover, the neutral PET temperature of the elderly is −0.5 degrees Celsius during the winter in Changchun. Comparing with other climatic zones, severe cold areas have great differences [69,70]. It demonstrates that the thermal expectation and thermal experience have an important effect on the thermal comfort of the aged in Changchun.
Thirdly, due to the numerical modeling and thermal comfort map, the park green land and playground have a better thermal comfort sensation that is between 10 am to 2 pm. In addition, the comfortable feeling of fitness area is contradictory, which is from 10 am to 12 pm and from 2 pm to 4 pm. In contrast, the open squares and sidewalk of community areas are uncomfortable during all the typical day. This would cause the walking and other outdoor activities of the elderly to happen in the park green land areas. This result will provide an important value for urban design and urban planning in severe cold areas of China.
In order to improve the outdoor thermal comfort of the elderly, some suggestions for residential planning and environmental design would be concluded as follows:
- The most significant method is increasing the area of green land as much as possible in residential planning. Then combined with the mean angle of the sun and prevailing wind direction in the winter season, the semi-open structure, like a small pavilion or outdoor porch would be set up. It not only can mitigate the discomfort of the elderly due to blocking off the cold wind and absorbs solar radiation but also would be more convenient for the elderly people to make decision to do some outdoor activities. However, it is worth noting that this area has discomfort feeling before 10 am and after 4 pm during the typical day in winter. Therefore, it should indicate the detailed information about this in a clear place and give some advice to elderly people.
- According to the research results, the values of neutral PET temperature in the playground are no higher than those in the fitness area, but the subjective thermal sensation in playground areas has significantly higher levels. The main reason is the thermal adaptation. Compare with doing exercise or walking alone, it seems apparent that taking physical exercise, chatting with others, and looking after the kids at the same time have more interest for the elderly people. Hence, the areas of playgrounds and fitness should be increased in environmental design, particularly for playgrounds. Furthermore, some more outdoor fitness equipment should be installed on the basis of the reasonable trip distance for the aged, which could increase the thermal comfort of the elderly people in winter in severe cold areas of China.
- Comparison with the sidewalk in urban residential, open squares is more popular among old people. In addition, the open squares 1 without trees have higher value of PET index than open squares 2 with street trees by comparison of them. This illustrates that solar radiation has a larger effect on the thermal comfort of elderly people than wind speed. Moreover, based on the thermal comfort map, it is shown that the surrounding building of open squares 1 are east-west orientation. The prevailing wind direction is west from 10 am to 12 pm and is northwest from 12 to 2 pm. It is noticeable, however, that the PET temperature is higher in the former timespan than later. It thus can be said that the surrounding building direction of open squares should avoid being parallel with the prevailing winds of winter in severe cold areas of China.
- In terms of the sidewalk, the use frequency of this area is low no matter whether it is tree-shaded, or any position of the urban residential areas. The thermal acceptation of the aged might be probably the main reason, which caused this to be uncomfortable in winter. Park green land, by contrast, has become the main site of brisk daily walk and other physical exercises. Many older people who lived in severe cold areas of China believed that the function of sidewalks is only for entry and exit routes, and do not have any other usage. Therefore, satisfying the basic function of the access, to reduce unnecessary path in residential planning is a great way to mitigate discomfort of the senior citizens in severe cold areas of China.
Author Contributions
Data curation, B.H.; Writing—original draft, B.W.; Writing—review & editing, H.J.
Funding
This research was funded by National Natural Science Foundation of China (Grant number 51438005).
Acknowledgments
The authors are thankful to Yun Kyu Yi at University of Illinois Urbana-Champaign for the assistance with computational simulation. We would also like to thank the two anonymous reviewers for their valuable comments and suggestions.
Conflicts of Interest
The authors declare no conflict of interest.
References
- Watanabe, S.; Ishii, J. Effect of outdoor thermal environment on pedestrians’ behavior selecting a shaded area in a humid subtropical region. Build. Environ. 2016, 95, 32–41. [Google Scholar] [CrossRef]
- Shui, T.; Liu, J.; Zhang, P.; Liu, S.; Zhao, Z. Development of an urban canopy model for the evaluation of urban thermal climate with snow cover in severe cold regions. Build. Environ. 2016, 95, 160–170. [Google Scholar] [CrossRef]
- Chen, L.; Wen, Y.; Zhang, L.; Xiang, W. Studies of thermal comfort and space use in an urban park square in cool and cold seasons in Shanghai. Build. Environ. 2015, 94, 644–653. [Google Scholar] [CrossRef]
- Taleghani, M.; Kleerekoper, L.; Tenpierik, M.; Van Den Dobbelsteen, A. Outdoor thermal comfort within five different urban forms in the Netherlands. Build. Environ. 2014, 83, 65–78. [Google Scholar] [CrossRef]
- Villadiego, K.; Velay-Dabat, M. Outdoor thermal comfort in a hot and humid climate of Colombia: A field study in Barranquilla. Build. Environ. 2014, 75, 142–152. [Google Scholar] [CrossRef]
- Pantavou, K.; Liu, J.; Theoharatos, G.; Santamouris, M.; Asimakopoulos, D. Outdoor thermal sensation of pedestrians in a Mediterranean climate and a comparison with UTCI. Build. Environ. 2013, 66, 82–95. [Google Scholar] [CrossRef]
- Lin, T.; Tsai, K.; Liao, C.; Huang, Y. Effects of thermal comfort and adaptation on park attendance regarding different shading levels and activity types. Build. Environ. 2013, 59, 599–611. [Google Scholar] [CrossRef]
- Nikolopoulou, M.; Lykoudis, S. Thermal comfort in outdoor urban spaces: Analysis across different European countries. Build. Environ. 2006, 41, 1455–1470. [Google Scholar] [CrossRef]
- Basu, R.; Samet, J. Relation between elevated ambient temperature and mortality: A review of the epidemiologic evidence. Epidemiol. Rev. 2002, 24, 190–202. [Google Scholar] [CrossRef]
- Kovats, R.; Hajat, S. Heat stress and public health: A critical review. Annu. Rev. Public Health 2008, 29, 41–55. [Google Scholar] [CrossRef]
- Balbus, J.; Malina, C. Identifying vulnerable subpopulations for climate change health effects in the United States. J. Occup. Environ. Med. 2009, 51, 33–39. [Google Scholar] [CrossRef] [PubMed]
- O’Neill, M.; Zanobetti, A.; Schwartz, J. Modifiers of the temperature and mortality association in seven US cities. Am. J. Epidemiol. 2003, 157, 1074–1082. [Google Scholar] [CrossRef] [PubMed]
- Sheridan, S.; Kalkstein, L. Progress in heat watch-warning system technology. Bull. Am. Meteorol. Soc. 2004, 85, 1931–1941. [Google Scholar] [CrossRef]
- Hassi, J. Cold Extremes and Impacts on Health; Springer: Berlin, Germany, 2005. [Google Scholar]
- Takano, T.; Nakamura, K.; Watanabe, M. Urban residential environments and senior citizens’ longevity in megacity areas: The importance of walkable green spaces. J. Epidemiol. Community Health 2002, 56, 913–918. [Google Scholar] [CrossRef]
- Artmann, M.; Chen, X.; Ioja, C.; Hof, A.; Onose, D.; Ponizy, L.; Lamovsek, A.Z.; Breuste, J. The role of urban green spaces in care facilities for elderly people across European cities. Urban For. Urban Green. 2017, 27, 203–213. [Google Scholar] [CrossRef]
- Hwang, R.; Chen, C. Field study on behaviors and adaptation of elderly people and their thermal comfort requirements in residential environments. Indoor Air 2010, 20, 235–245. [Google Scholar] [CrossRef]
- Schellen, L.; Lichtenbelt, W.V.M.; Loomans, M.; Toftum, J.; De Wit, M. Differences between young adults and elderly in thermal comfort, productivity, and thermal physiology in response to a moderate temperature drift and a steady state condition. Indoor Air 2010, 20, 273–283. [Google Scholar] [CrossRef]
- Taylor, N.; Allsopp, N.; Parkes, D. Preferred Room Temperature of Young vs. Aged Males: The Influence of Thermal Sensation, Thermal Comfort, and Affect. J. Gerontol. Biol. Sci. Med. Sci. 1995, 50, M216–M221. [Google Scholar] [CrossRef]
- Rupp, R.; Vásquez, N.; Lamberts, R. A review of human thermal comfort in the built environment. Energy Build. 2015, 105, 178–205. [Google Scholar] [CrossRef]
- Johansson, E. Influence of urban geometry on outdoor thermal comfort in a hot dry climate: A study in Fez, Morocco. Build. Environ. 2006, 41, 1326–1338. [Google Scholar] [CrossRef]
- Qaid, A.; Lamit, H.; Ossen, D.; Shahminan, R. Urban heat island and thermal comfort conditions at micro-climate scale in a tropical planned city. Energy Build. 2016, 133, 577–595. [Google Scholar] [CrossRef]
- Klemm, W.; Heusinkveld, B.; Lenzholzer, S.; Van Hove, B. Street greenery and its physical and psychological impact on thermal comfort. Landsc. Urban Plan. 2015, 138, 87–98. [Google Scholar] [CrossRef]
- Voogt, J.; Oke, T. Thermal remote sensing of urban climates. Remote Sens. Environ. 2003, 86, 370–384. [Google Scholar] [CrossRef]
- Sun, R.; Chen, L. How can urban water bodies be designed for climate adaptation? Landsc. Urban Plan. 2012, 105, 27–33. [Google Scholar] [CrossRef]
- Toparlar, Y.; Blocken, B.; Maiheu, B.; Van Heijst, G. A review on the CFD analysis of urban microclimate. Renew. Sustain. Energy Rev. 2017, 80, 1613–1640. [Google Scholar] [CrossRef]
- Oke, T.; Mills, G.; Christen, A.; Voogt, J. Urban Climates; Cambridge University Press: Cambridge, UK, 2017. [Google Scholar]
- Mirzaei, P.; Haghighat, F. Approaches to study urban heat island–abilities and limitations. Build. Environ. 2010, 45, 2192–2201. [Google Scholar] [CrossRef]
- Huttner, S.; Bruse, M. Numerical modeling of the urban climate—A preview on ENVI-met 4.0. In Proceedings of the 7th International Conference on Urban Climate (ICUC-7), Yokohama, Japan, 29 June–3 July 2009. [Google Scholar]
- Yang, J.; Wang, Z.; Kaloush, K.; Dylla, H. Effect of pavement thermal properties on mitigating urban heat islands: A multi-scale modeling case study in Phoenix. Build. Environ. 2016, 108, 110–121. [Google Scholar] [CrossRef]
- Morakinyo, T.; Dahanayake, K.; Adegun, O.; Balogun, A. Modelling the effect of tree-shading on summer indoor and outdoor thermal condition of two similar buildings in a Nigerian university. Energy Build. 2016, 130, 721–732. [Google Scholar] [CrossRef]
- Liu, J.; Niu, J.; Xia, Q. Combining measured thermal parameters and simulated wind velocity to predict outdoor thermal comfort. Build. Environ. 2016, 105, 185–197. [Google Scholar] [CrossRef]
- Fanger, P. Assessment of man’s thermal comfort in practice. Occup. Environ. Med. 1973, 4, 313–324. [Google Scholar] [CrossRef]
- Gagge, A.; Fobelets, A.; Berglund, L. A standard predictive index of human response to the thermal environment. ASHARE Trans. 1986, 92, 709–731. [Google Scholar]
- Bröde, P.; Jendritzky, G.; Fiala, D.; Havenith, G. The universal thermal climate index UTCI in operational use. In Proceedings of the 6th Windsor Conference on Thermal Comfort, Windsor, UK, 9–11 April 2010. [Google Scholar]
- Hoyt, T.; Schiavon, S.; Piccioli, A.; Cheung, T.; Moon, D.; Steinfeld, K. CBE Thermal Comfort Tool Center for the Built Environment. University of California Berkeley. Available online: http://comfort.cbe.berkeley.edu (accessed on 28 September 2019).
- Höppe, P. The physiological equivalent temperature—A universal index for the biometeorological assessment of the thermal environment. Int. J. Biometeorol. 1999, 43, 71–75. [Google Scholar] [CrossRef] [PubMed]
- Cheung, P.; Jim, C. Comparing the cooling effects of a tree and a concrete shelter using PET and UTCI. Build. Environ. 2018, 130, 49–61. [Google Scholar] [CrossRef]
- Kántor, N.; Chen, L.; Gál, C. Human-biometeorological significance of shading in urban public spaces—summertime measurements in Pécs, Hungary. Landsc. Urban Plan. 2018, 170, 241–255. [Google Scholar] [CrossRef]
- Chatzidimitriou, A.; Yannas, S. Street canyon design and improvement potential for urban open spaces: The influence of canyon aspect ratio and orientation on microclimate and outdoor comfort. Sustain. Cities Soc. 2017, 33, 85–101. [Google Scholar] [CrossRef]
- Zheng, S.; Zhao, L.; Li, Q. Numerical simulation of the impact of different vegetation species on the outdoor thermal environment. Urban For. Urban Green. 2016, 18, 138–150. [Google Scholar] [CrossRef]
- Wang, Y.; Bakker, F.; de Groot, R.; Wörtche, H.; Leemans, R. Effects of urban green infrastructure (UGI) on local outdoor microclimate during the growing season. Environ. Monit. Assess. 2015, 187, 732. [Google Scholar] [CrossRef] [Green Version]
- Santamouris, M. Cooling the cities—A review of reflective and green roof mitigation technologies to fight heat island and improve comfort in urban environments. Sol. Energy 2014, 103, 682–703. [Google Scholar] [CrossRef]
- Ouldboukhitine, S.; Belarbi, R.; Sailor, D. Experimental and numerical investigation of urban street canyons to evaluate the impact of green roof inside and outside buildings. Appl. Energy 2014, 114, 273–282. [Google Scholar] [CrossRef]
- Chatzidimitriou, A.; Yannas, S. Microclimate development in open urban spaces: The influence of form and materials. Energy Build. 2015, 108, 156–174. [Google Scholar] [CrossRef]
- Gómez, F.; Cueva, A.; Valcuende, M.; Matzarakis, A. Research on ecological design to enhance comfort in open spaces of a city (Valencia, Spain). Utility of the physiological equivalent temperature (PET). Ecol. Eng. 2013, 57, 27–39. [Google Scholar] [CrossRef]
- Xu, J.; Wei, Q.; Huang, X.; Zhu, X.; Li, G. Evaluation of human thermal comfort near urban waterbody during summer. Build. Environ. 2010, 45, 1072–1080. [Google Scholar] [CrossRef]
- Mahmoud, A. Analysis of the microclimatic and human comfort conditions in an urban park in hot and arid regions. Build. Environ. 2011, 46, 2641–2656. [Google Scholar] [CrossRef]
- Taleghani, M.; Berardi, U. The effect of pavement characteristics on pedestrians’ thermal comfort in Toronto. Urban Clim. 2018, 24, 449–459. [Google Scholar] [CrossRef]
- Yang, F.; Lau, S.; Qian, F. Thermal comfort effects of urban design strategies in high-rise urban environments in a sub-tropical climate. Arch. Sci. Rev. 2011, 54, 285–304. [Google Scholar] [CrossRef]
- Rosso, F.; Golasi, I.; Castaldo, V.; Piselli, C.; Pisello, A.; Salata, F.; Ferrero, M.; Cotana, F.; Vollaro, A.D.L. On the impact of innovative materials on outdoor thermal comfort of pedestrians in historical urban canyons. Renew. Energy 2018, 118, 825–839. [Google Scholar] [CrossRef]
- Rosso, F.; Pisello, A.; Cotana, F.; Ferrero, M. On the thermal and visual pedestrians’ perception about cool natural stones for urban paving: A field survey in summer conditions. Build. Environ. 2016, 107, 198–214. [Google Scholar] [CrossRef]
- You, W.; Shen, J.; Ding, W. Improving Wind Environment of Residential Neighborhoods by Understanding the Relationship between Building Layouts and Ventilation Efficiency. Energy Procedia 2017, 105, 4531–4536. [Google Scholar] [CrossRef]
- Schatzmann, M.; Britter, R. Quality assurance and improvement of micro-scale meteorological models. Int. J. Environ. Pollut. 2011, 44, 139–146. [Google Scholar] [CrossRef]
- Blocken, B.; Stathopoulos, T.; Carmeliet, J.; Hensen, J. Application of computational fluid dynamics in building performance simulation for the outdoor environment: An overview. J. Build. Perform. Simul. 2011, 4, 157–184. [Google Scholar] [CrossRef]
- Tominaga, Y.; Mochida, A.; Yoshie, R.; Kataoka, H.; Nozu, T.; Yoshikawa, M.; Shirasawa, T. AIJ guidelines for practical applications of CFD to pedestrian wind environment around buildings. J. Wind. Eng. Ind. Aerod. 2008, 96, 1749–1761. [Google Scholar] [CrossRef]
- Oke, T. Boundary Layer Climates; Methuen Press: London, UK, 1978. [Google Scholar]
- Holmes, J. Wind Loading of Structures, 3rd ed.; CRC Press: Boca Raton, FL, USA, 2015. [Google Scholar]
- Ahmad, M.; Rasul, G. Prediction of soil temperature by air temperature; a case study for Faisalabad. Pakistan J. Meteorol. 2008, 5, 19–27. [Google Scholar]
- Florides, G.; Kalogirou, S. Measurements of Ground Temperature at Various Depths. In Proceedings of the 3rd International Conference on Sustainable Energy Technologies, Nottingham, UK, 28–30 June 2004. [Google Scholar]
- Zhang, T. Influence of the seasonal snow cover on the ground thermal regime: An overview. Rev. Geophys. 2005, 43. [Google Scholar] [CrossRef]
- Rankinen, K.; Karvonen, T.; Butterfield, D. A simple model for predicting soil temperature in snow-covered and seasonally frozen soil: Model description and testing. Hydrol. Earth Syst. Sci. 2004, 8, 706–716. [Google Scholar] [CrossRef] [Green Version]
- Van Hooff, T.; Blocken, B. On the effect of wind direction and urban surroundings on natural ventilation of a large semi-enclosed stadium. Comput. Fluids 2010, 39, 1146–1155. [Google Scholar] [CrossRef]
- Wise, D.; Boppana, V.; Li, K.; Poh, H. Effects of minor changes in the mean inlet wind direction on urban flow simulations. Sustain. Cities Soc. 2018, 37, 492–500. [Google Scholar] [CrossRef]
- Blocken, B.; Stathopoulos, T.; Van Beeck, J. Pedestrian-level wind conditions around buildings Review of wind-tunnel and CFD techniques and their accuracy for wind comfort assessment. Build. Environ. 2016, 100, 50–81. [Google Scholar] [CrossRef]
- Matzarakis, A.; Rutz, F.; Mayer, H. Modelling radiation fluxes in simple and complex environments: Basics of the RayMan model. Int. J. Biometeorol. 2007, 51, 323–334. [Google Scholar] [CrossRef]
- Lin, T.; Matzarakis, A. Tourism climate and thermal comfort in Sun Moon Lake, Taiwan. Int. J. Biometeorol. 2008, 52, 281–290. [Google Scholar] [CrossRef]
- Brager, G.; De Dear, R. Thermal adaptation in the built environment: A literature review. Energy Build. 2011, 27, 83–96. [Google Scholar] [CrossRef] [Green Version]
- Lai, D.; Guo, D.; Hou, Y.; Lin, C.; Chen, Q. Studies of outdoor thermal comfort in northern China. Build. Environ. 2014, 77, 110–118. [Google Scholar] [CrossRef]
- Matzarakis, A.; Mayer, H. Another kind of environmental stress: Thermal stress. WHO Newsl. 1996, 18, 7–10. [Google Scholar]
Figure 1.
Research framework.

Figure 2.
(a) The location of Jilin province in China, (b) The research site Tianjia residential in Changchun city.
Figure 2.
(a) The location of Jilin province in China, (b) The research site Tianjia residential in Changchun city.

Figure 3.
A map of the measuring point and comparison environment characteristic.

Figure 4.
Daily air temperature changing trend diagram of Changchun in January.

Figure 5.
Dimension of boundary setting diagram.
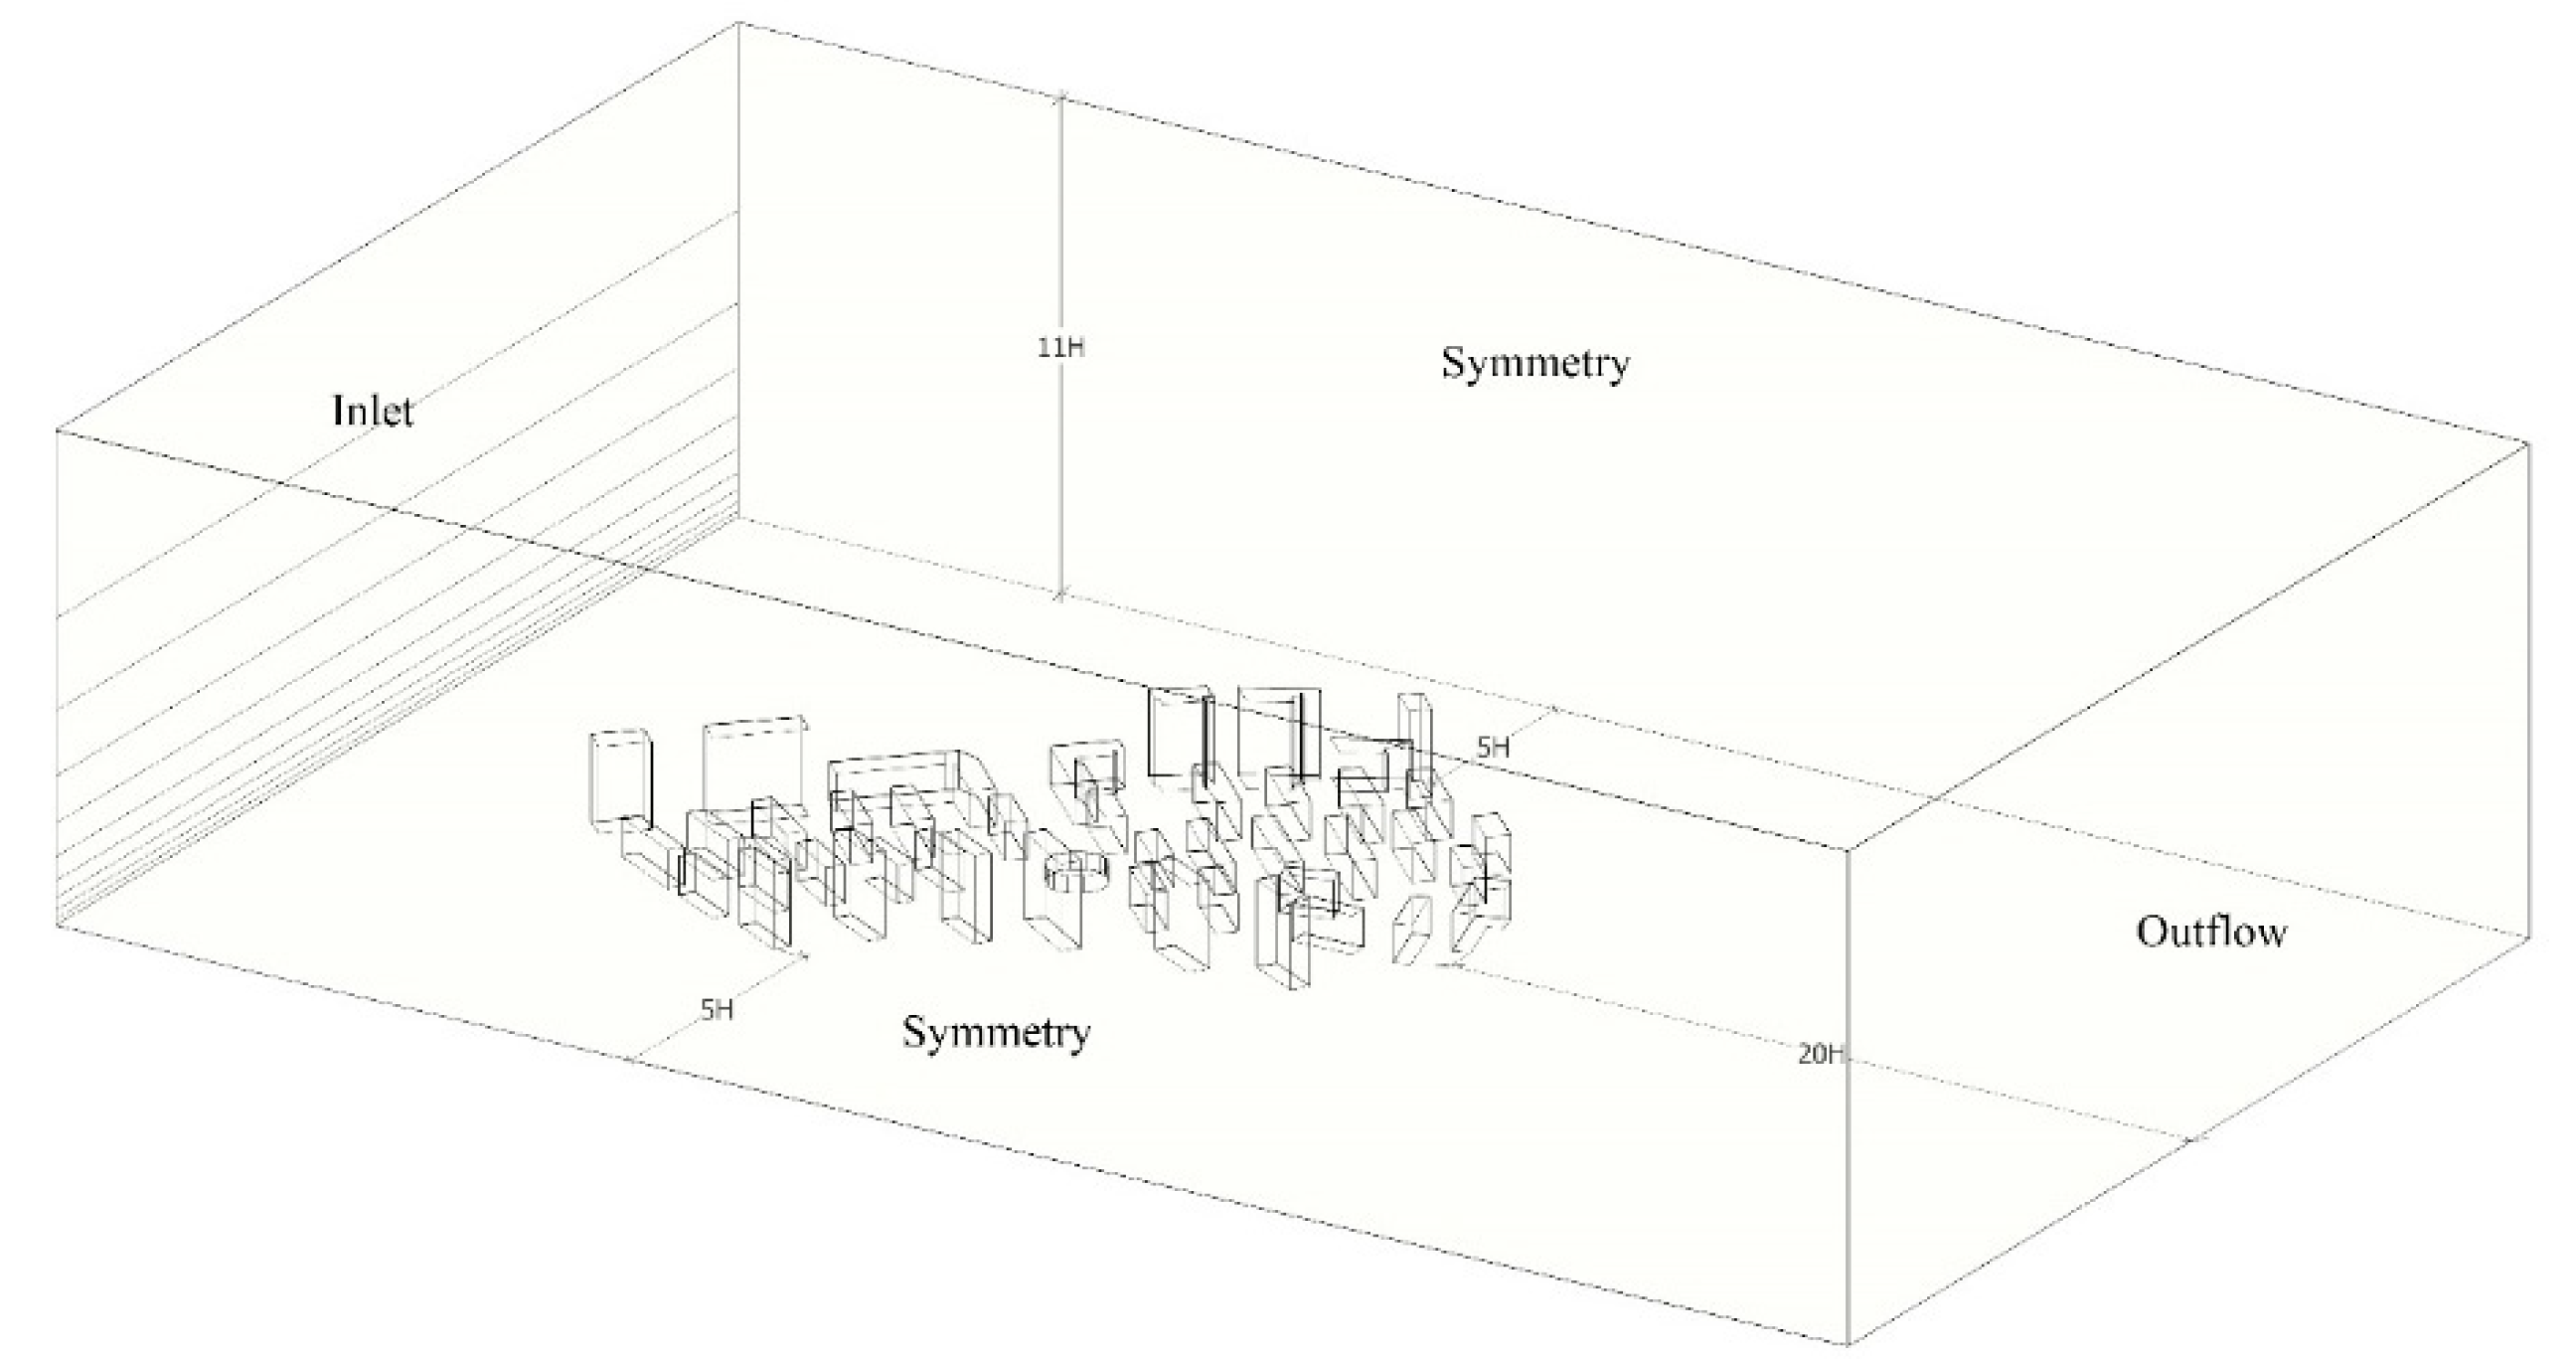
Figure 6.
The inlet orientation of model is (a) East, (b) Southeast, (c) South, (d) Southwest, (e) West, (f) Northwest, (g) North, (h) Northeast.
Figure 6.
The inlet orientation of model is (a) East, (b) Southeast, (c) South, (d) Southwest, (e) West, (f) Northwest, (g) North, (h) Northeast.

Figure 7.
Compare the air temperature and wind velocity in various locations from 8:00 to 10:00 am (a) Air temperature between measure and simulation (b) Wind velocity between measure and simulation.
Figure 7.
Compare the air temperature and wind velocity in various locations from 8:00 to 10:00 am (a) Air temperature between measure and simulation (b) Wind velocity between measure and simulation.

Figure 8.
Compare the air temperature and wind velocity in various locations from 10:00 to 12pm (a) Air temperature between measure and simulation (b) Wind velocity between measure and simulation.
Figure 8.
Compare the air temperature and wind velocity in various locations from 10:00 to 12pm (a) Air temperature between measure and simulation (b) Wind velocity between measure and simulation.

Figure 9.
Compare the air temperature and wind velocity in various locations from 12:00 to 2:00 pm. (a) Air temperature between measure and simulation (b) Wind velocity between measure and simulation.
Figure 9.
Compare the air temperature and wind velocity in various locations from 12:00 to 2:00 pm. (a) Air temperature between measure and simulation (b) Wind velocity between measure and simulation.

Figure 10.
Compare the air temperature and wind velocity in various locations from 2:00 to 4:00 pm. (a) Air temperature between measure and simulation (b) Wind velocity between measure and simulation.
Figure 10.
Compare the air temperature and wind velocity in various locations from 2:00 to 4:00 pm. (a) Air temperature between measure and simulation (b) Wind velocity between measure and simulation.

Figure 11.
Compare the air temperature and wind velocity in various locations from 4:00 to 6:00 pm. (a) Air temperature between measure and simulation (b) Wind velocity between measure and simulation.
Figure 11.
Compare the air temperature and wind velocity in various locations from 4:00 to 6:00 pm. (a) Air temperature between measure and simulation (b) Wind velocity between measure and simulation.

Figure 12.
The percentage of TSV of the aged.

Figure 13.
Comparison between thermal sensation of elderly and PET in different areas of the community (a) Square areas, (b) Fitness areas, (c) Playground areas, (d) Park green land areas, (e) Sidewalk areas.
Figure 13.
Comparison between thermal sensation of elderly and PET in different areas of the community (a) Square areas, (b) Fitness areas, (c) Playground areas, (d) Park green land areas, (e) Sidewalk areas.
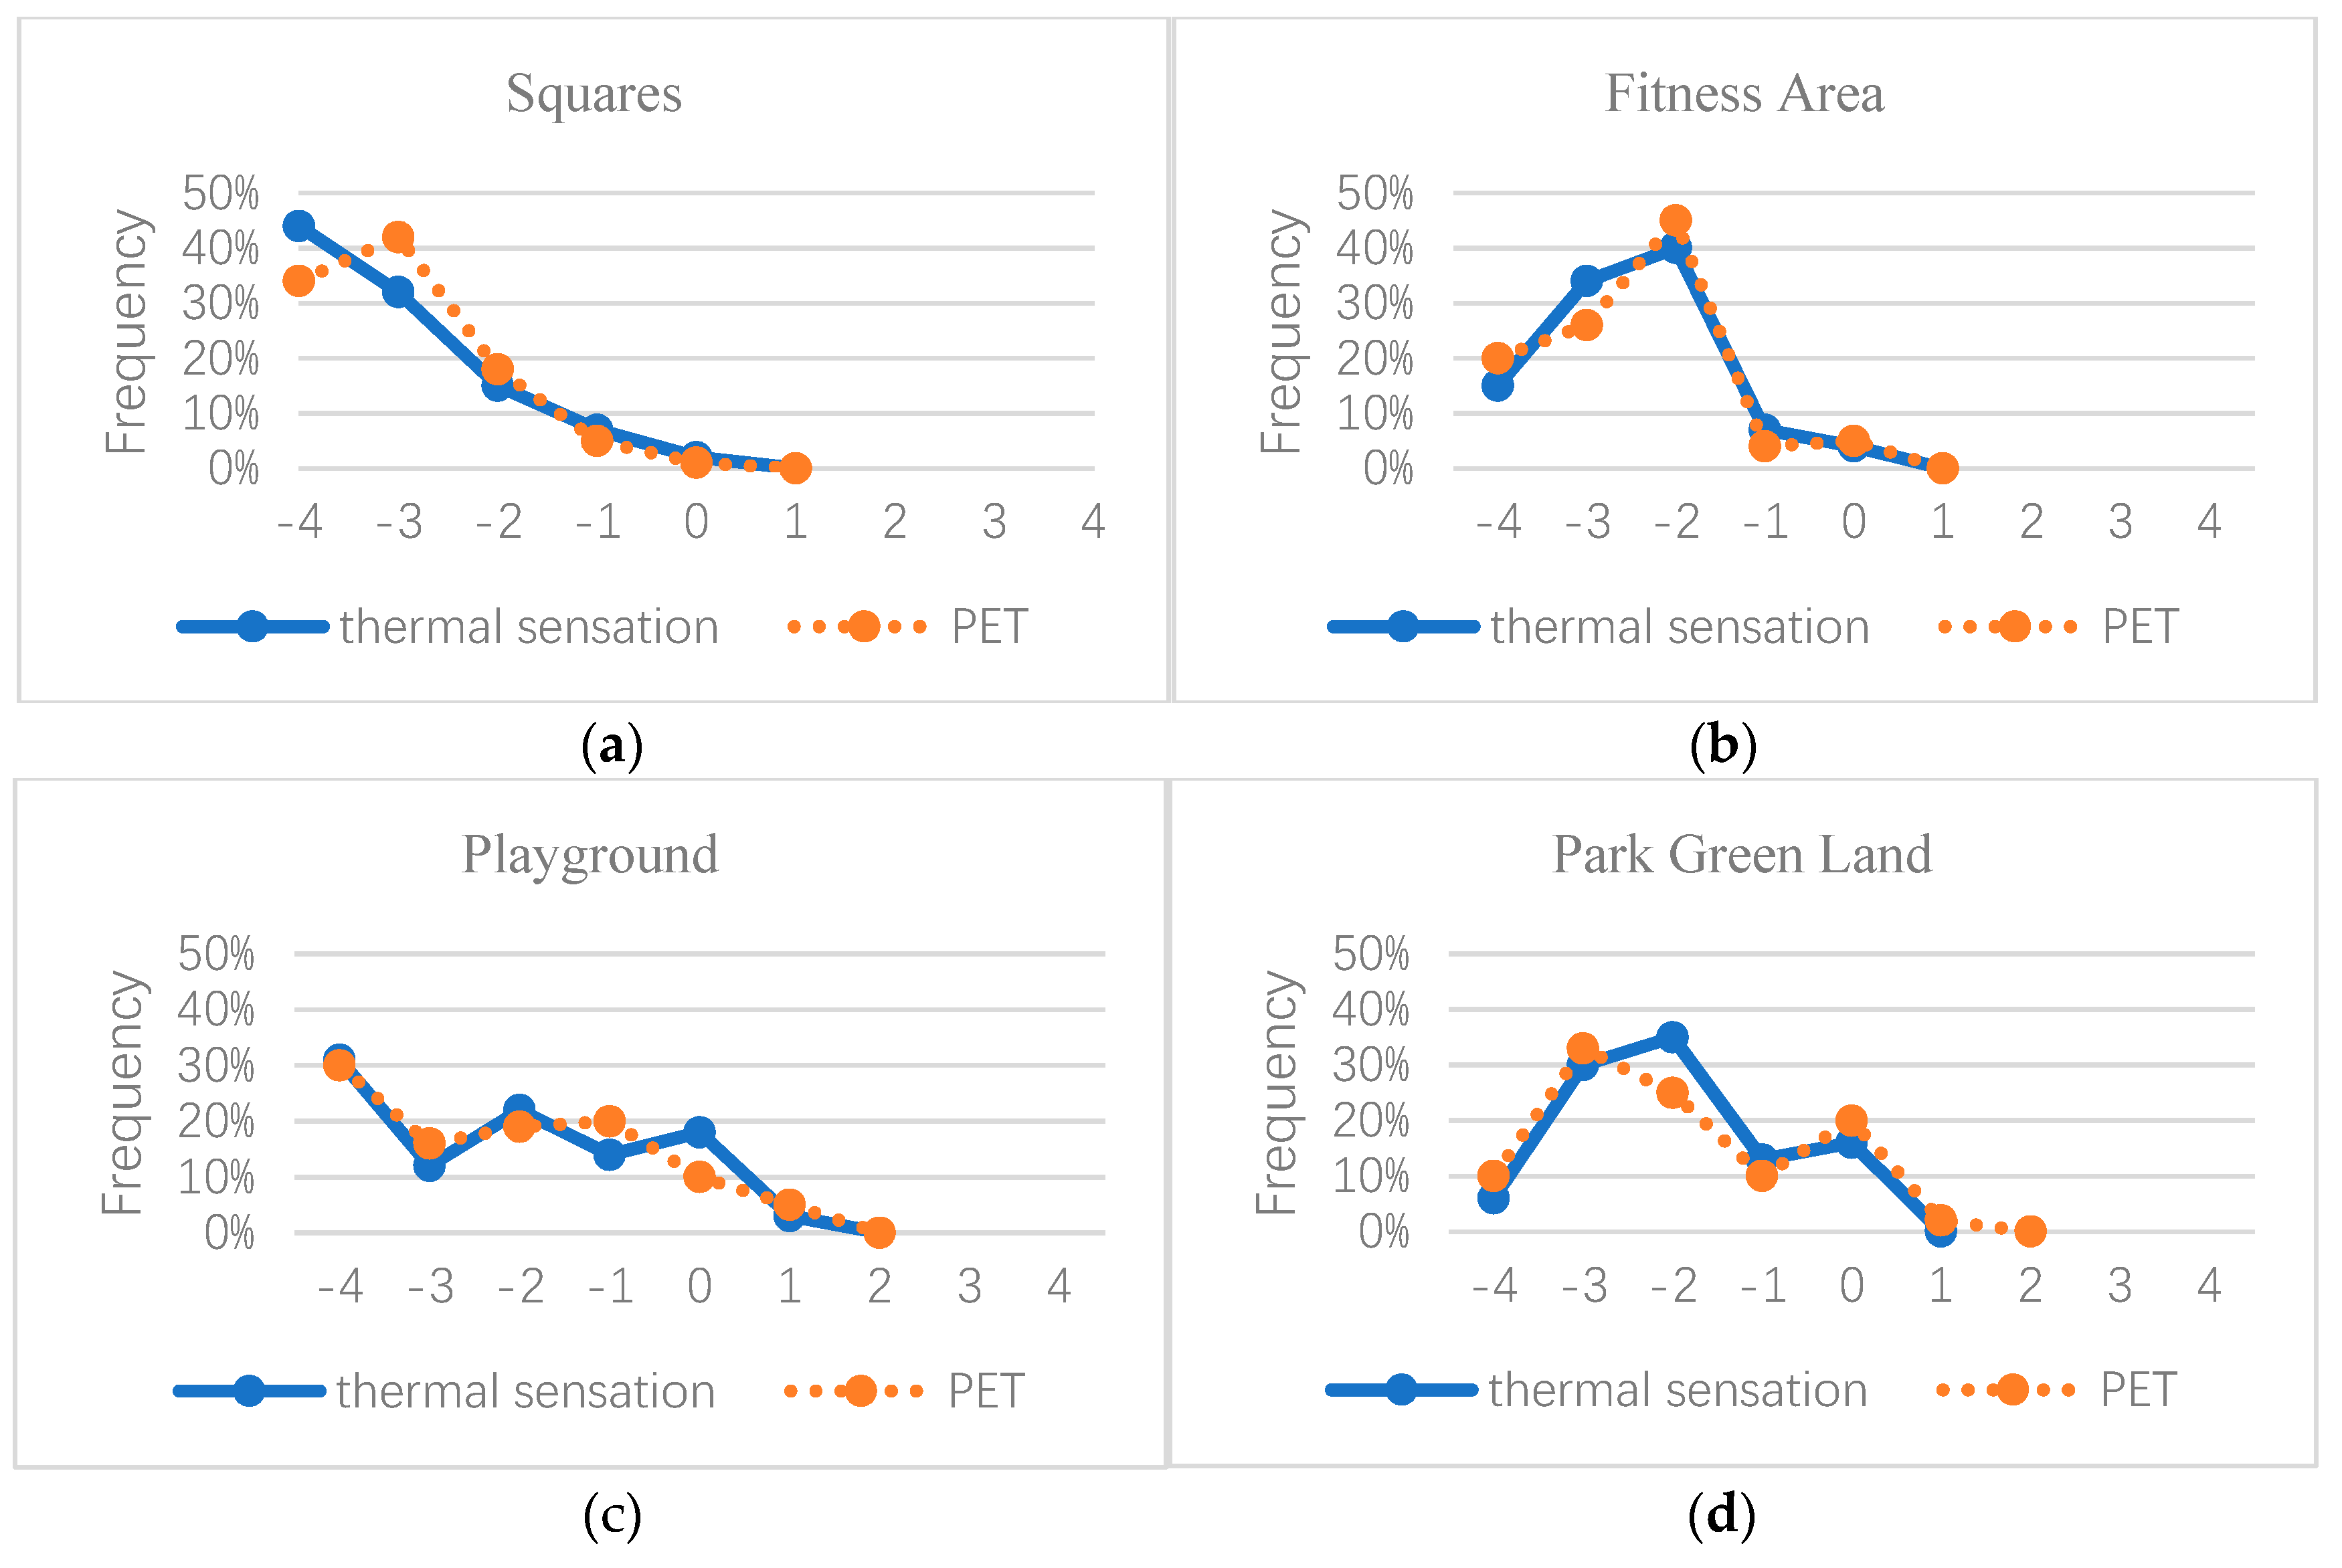

Figure 14.
The regression relation between thermal sensitivity and neutral temperature.

Figure 15.
Thermal comfort map at different times of the typical day. (a) 10:00–12:00 pm, (b) 12:00–2:00 pm, (c) 2:00–4:00 pm.
Figure 15.
Thermal comfort map at different times of the typical day. (a) 10:00–12:00 pm, (b) 12:00–2:00 pm, (c) 2:00–4:00 pm.


Table 1.
Comparison between four typical elderly residences in Changchun.
| Name | Tianjia | Wutong | Wanjia | Wansheng |
|---|---|---|---|---|
| Total floor area (m2) | 320,000 | 92,916 | 321,351 | 1,000,000 |
| Covering area (m2) | 185,500 | 25,222 | 200,848 | 714,000 |
| Capacity rate | 1.73 | 3.68 | 1.60 | 1.40 |
| Greening rate (%) | 40 | 32.64 | 32.40 | 30 |
| Total number of households | 2000 | 544 | 2131 | 10,000 |
| Proportion of elderly (%) | 25.90 | 18.40 | 22.40 | 21.70 |
| Building height/ types | Multi-layer building and high-rise | High-rise | Multi-layer building | Multi-layer building and high-rise |
| Architectural layout | Row layout and enclosed building | Point building | Row layout | Enclosed building |
Table 2.
Comparison between seven measuring points.
| Measuring Point | Location | Shade | Ground and Tree |
|---|---|---|---|
| 1 | Playground | Partial | Plastic ground and some trees |
| 2 | Fitness area | No shade | Partial plastic ground without trees |
| 3 | Park green land | In the shade | Grass from bushes |
| 4 | Squares 1 | No shade | Brick paving and open area |
| 5 | Sidewalk 1 | Partial | Brick paving and some trees |
| 6 | Squares 2 | Partial | Brick paving and some trees |
| 7 | Sidewalk 2 | In the shade | Asphalt concrete pavement with trees |
Table 3.
Performance parameters of test instruments.
| Meteorological Elements | Resolution | Range of Measurement | Accuracy | Mode |
|---|---|---|---|---|
| Air temperature | 0.1 ℃ | −30 ℃—70 ℃ | ±0. 5 ℃ | Automatic |
| Relative humidity | 0.1% | 0%-99% | ±2% | Automatic |
| Wind velocity | 0.1m/s | 0.6 m/s-40 m/s | ±0.3m/s | Automatic |
| Wind direction | 1° | 0°–360° | ±5° | Automatic |
| Solar radiation | 0.1 W/m2 | 1–3999 W/m2 | ±10 W/m2 | Manual |
Table 4.
Sensory scale (scale 7–9 almost never use in winter).
| 1 | 2 | 3 | 4 | 5 | 6 | |
|---|---|---|---|---|---|---|
| Thermal sensation | Extreme cold | Very cold | Cold | Slightly cold | Neutral | Slightly warm |
| Thermal comfort | Extreme discomfort | Very discomfort | discomfort | Slightly discomfort | Neutral | Slightly comfort |
Table 5.
The preliminary input parameters for the fluent simulation.
| Name | Input Parameters |
|---|---|
| Structured grid | total 450,000 |
| Turbulent model | standard k-ε model |
| Radiation model | P1 |
| Materials | Air, Ground, Concrete |
| Inlet | Inlet 01-Inlet 11 |
| Outflow | Pressure-outlet |
| Side/Ground | Symmetry |
| Solution methods | SIMPLE |
| Spatial discretization | Least Squares Cell Based – First Order Upwind |
© 2019 by the authors. Licensee MDPI, Basel, Switzerland. This article is an open access article distributed under the terms and conditions of the Creative Commons Attribution (CC BY) license (http://creativecommons.org/licenses/by/4.0/).
Share and Cite
MDPI and ACS Style
Jin, H.; Wang, B.; Han, B. Study on Environment Regulation of Residential in Severe Cold Area of China in Winter: Base on Outdoor Thermal Comfort of the Elderly. Sustainability 2019, 11, 6509. https://doi.org/10.3390/su11226509
AMA Style
Jin H, Wang B, Han B. Study on Environment Regulation of Residential in Severe Cold Area of China in Winter: Base on Outdoor Thermal Comfort of the Elderly. Sustainability. 2019; 11(22):6509. https://doi.org/10.3390/su11226509
Chicago/Turabian StyleJin, Hong, Bo Wang, and Bingbing Han. 2019. "Study on Environment Regulation of Residential in Severe Cold Area of China in Winter: Base on Outdoor Thermal Comfort of the Elderly" Sustainability 11, no. 22: 6509. https://doi.org/10.3390/su11226509
Note that from the first issue of 2016, this journal uses article numbers instead of page numbers. See further details here.